
Food Balance Sheets Data for FBS compilation: data
NS
Published · 36 slides · 0 views
1 / 1

Description
Food Balance Sheets Data for FBS compilation: data assessment and other preliminary considerations Session 3.0 Learning Objectives At the end of this session, the participants will: Know how to deal with different data sources and how to
Related Topics
Share
Embed code
Download this presentation From Below
"Food Balance Sheets Data for FBS compilation: data" is the property of its rightful owner. Permission is granted to download and print the materials on this website for personal, non-commercial use only, and to display it on your personal computer provided you do not modify the materials and that you retain all copyright notices contained in the materials. By downloading content from our website, you accept the terms of this agreement.
Presentation Transcript
01
Food Balance Sheets Data for FBS compilation: data assessment and other preliminary considerations
Session 3.0<br>
Session 3.0<br>
02
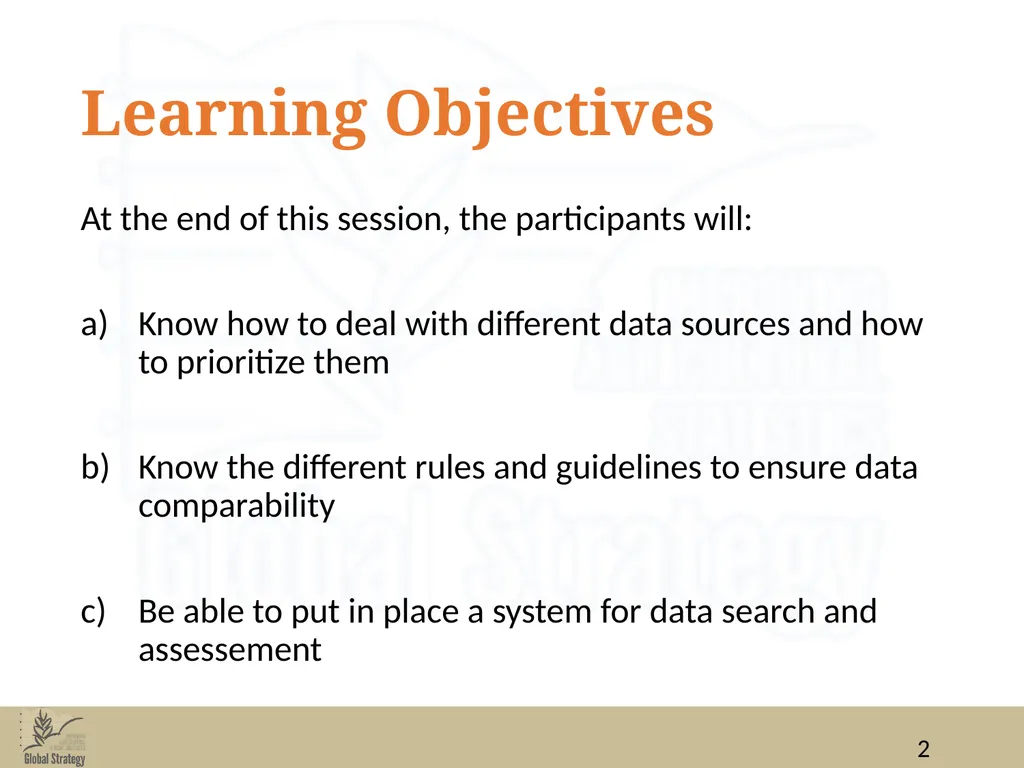
Learning Objectives At the end of this session, the participants will:
Know how to deal with different data sources and how to prioritize them
Know the different rules and guidelines to ensure data comparability
Be able to put in place a system for data search and assessement<br>
Know how to deal with different data sources and how to prioritize them
Know the different rules and guidelines to ensure data comparability
Be able to put in place a system for data search and assessement<br>
03
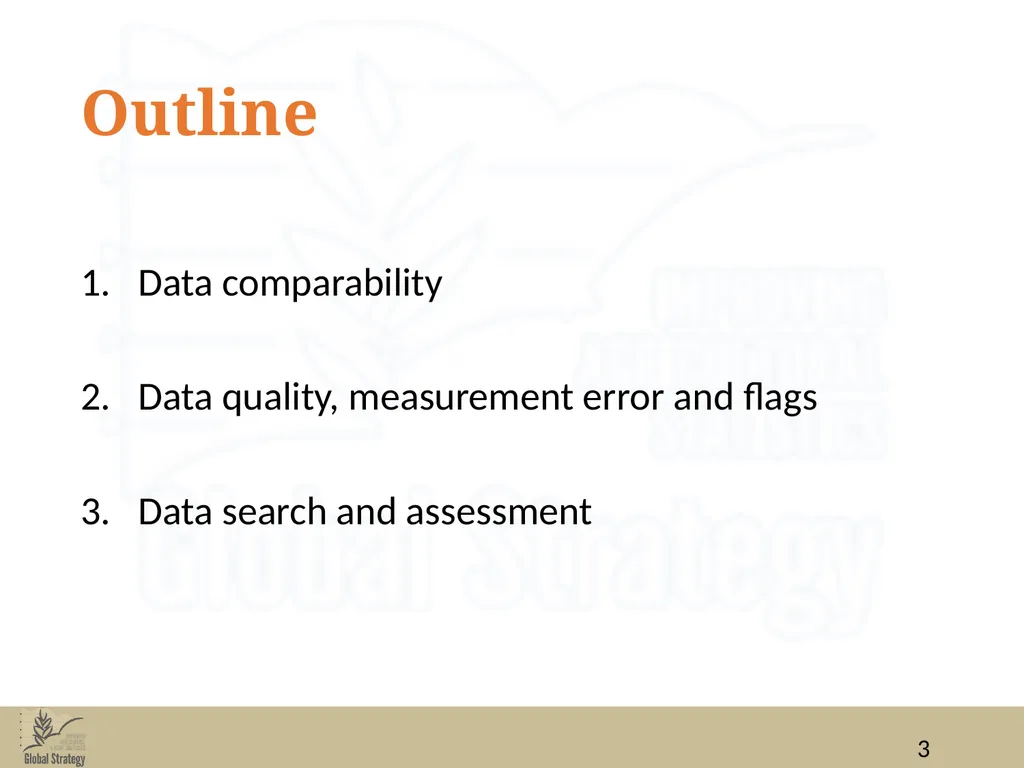
Outline Data comparability
Data quality, measurement error and flags
Data search and assessment<br>
Data quality, measurement error and flags
Data search and assessment<br>
04
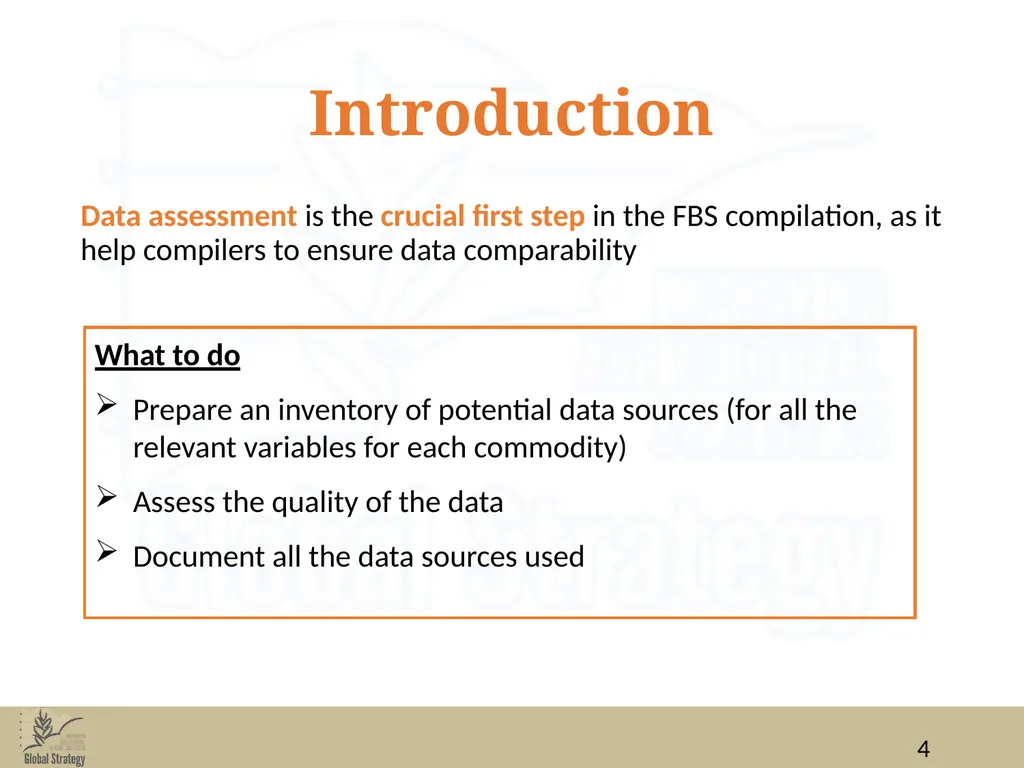
Introduction Data assessment is the crucial first step in the FBS compilation, as it help compilers to ensure data comparability What to do
Prepare an inventory of potential data sources (for all the relevant variables for each commodity)
Assess the quality of the data
Document all the data sources used<br>
Prepare an inventory of potential data sources (for all the relevant variables for each commodity)
Assess the quality of the data
Document all the data sources used<br>
05
I. Data comparability<br>
06
I. Data comparability:
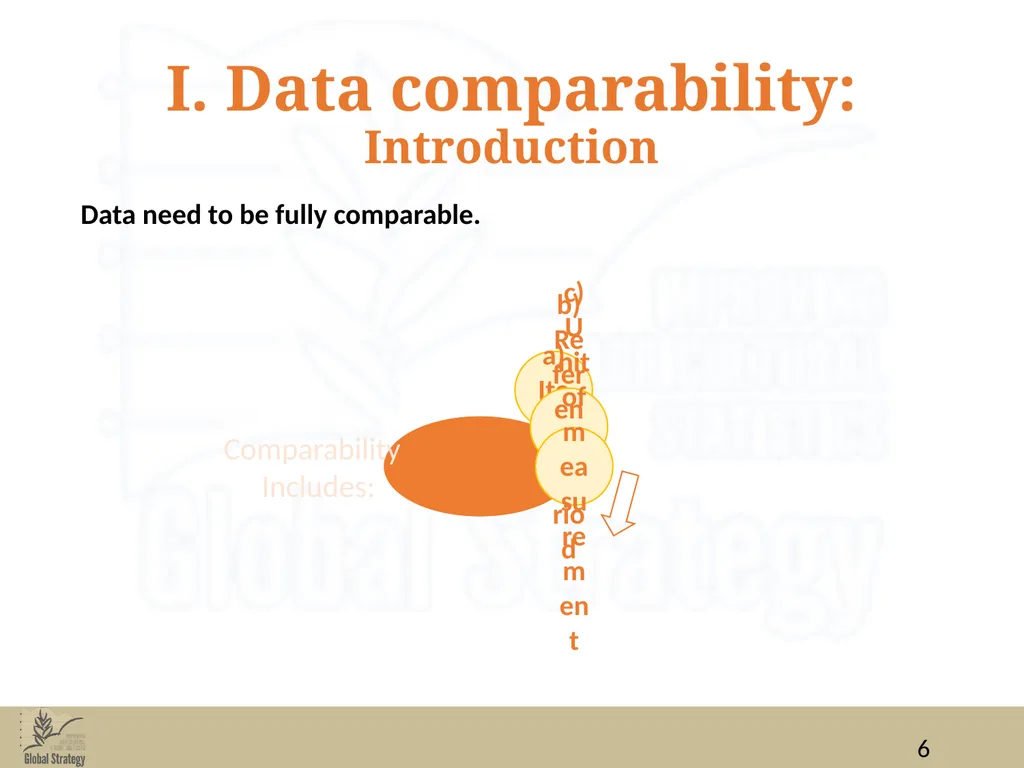
Introduction Data need to be fully comparable. Comparability
Includes:<br>
Includes:<br>
07
I. Data comparability:
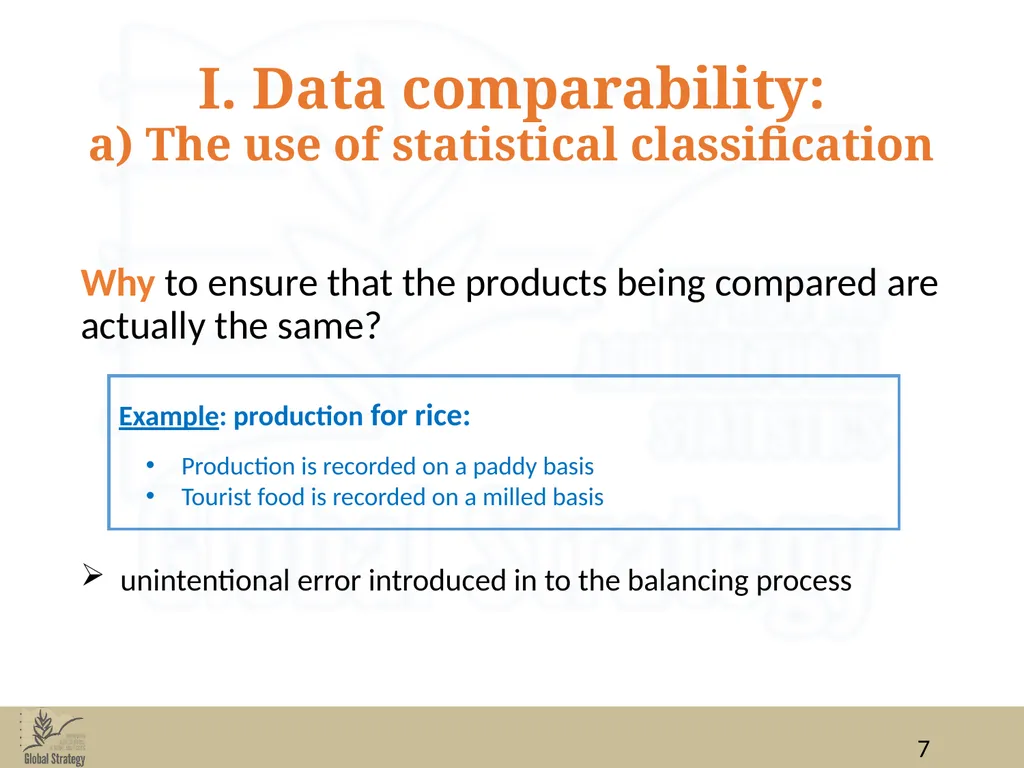
a) The use of statistical classification Why to ensure that the products being compared are actually the same?
unintentional error introduced in to the balancing process Example: production for rice:
Production is recorded on a paddy basis
Tourist food is recorded on a milled basis<br>
unintentional error introduced in to the balancing process Example: production for rice:
Production is recorded on a paddy basis
Tourist food is recorded on a milled basis<br>
08
I. Data comparability:
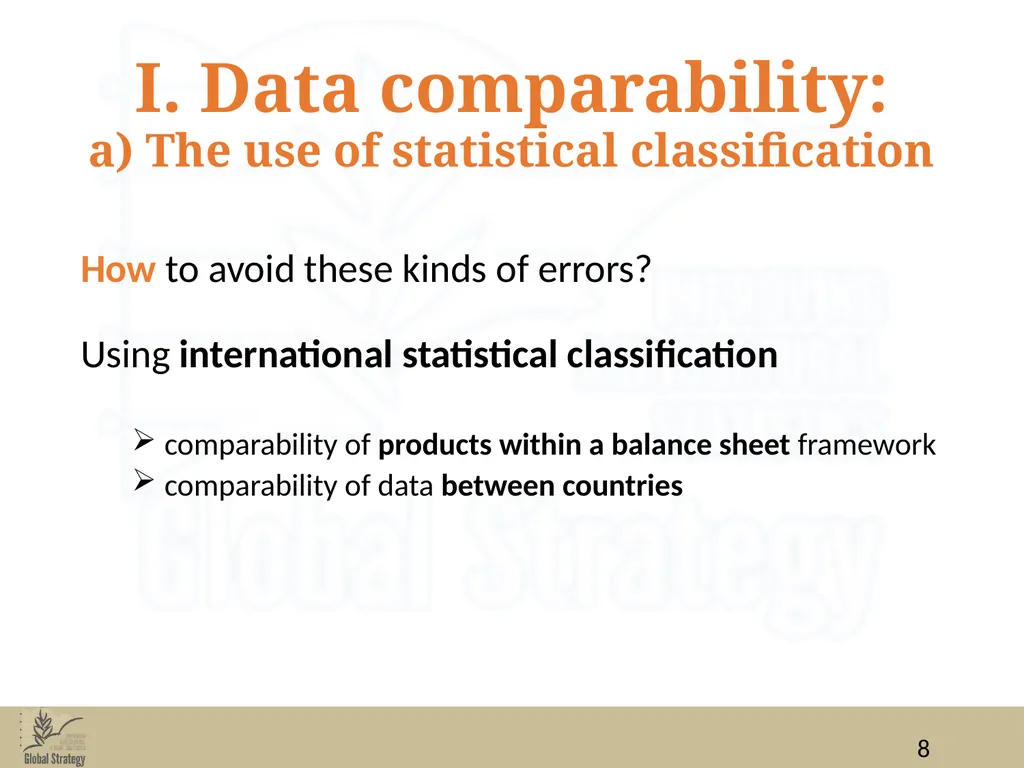
a) The use of statistical classification How to avoid these kinds of errors?
Using international statistical classification
comparability of products within a balance sheet framework
comparability of data between countries<br>
Using international statistical classification
comparability of products within a balance sheet framework
comparability of data between countries<br>
09
I. Data comparability:
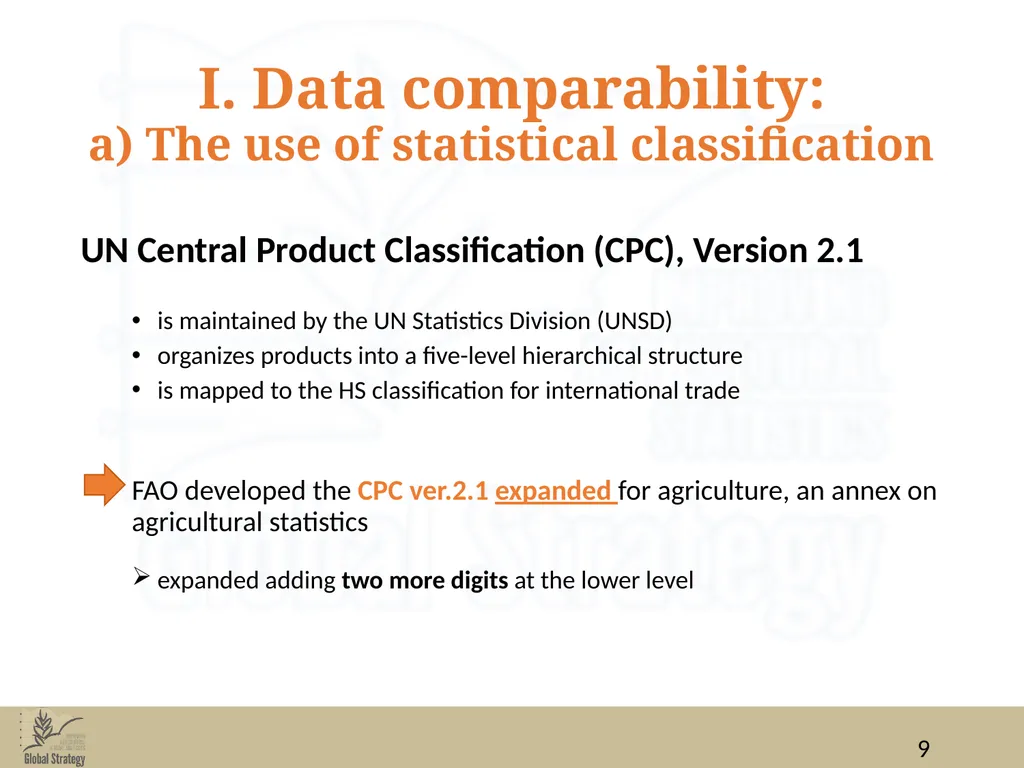
a) The use of statistical classification UN Central Product Classification (CPC), Version 2.1
is maintained by the UN Statistics Division (UNSD)
organizes products into a five-level hierarchical structure
is mapped to the HS classification for international trade
FAO developed the CPC ver.2.1 expanded for agriculture, an annex on agricultural statistics
expanded adding two more digits at the lower level<br>
is maintained by the UN Statistics Division (UNSD)
organizes products into a five-level hierarchical structure
is mapped to the HS classification for international trade
FAO developed the CPC ver.2.1 expanded for agriculture, an annex on agricultural statistics
expanded adding two more digits at the lower level<br>
10
I. Data comparability:
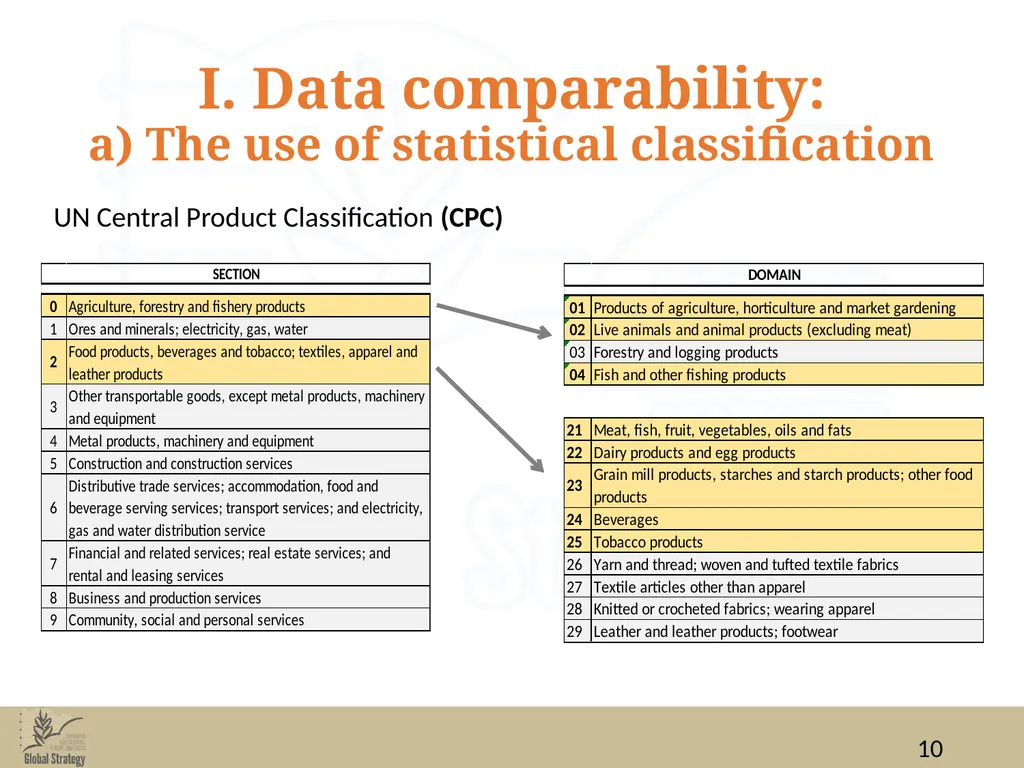
a) The use of statistical classification UN Central Product Classification (CPC)<br>
11
I. Data comparability:
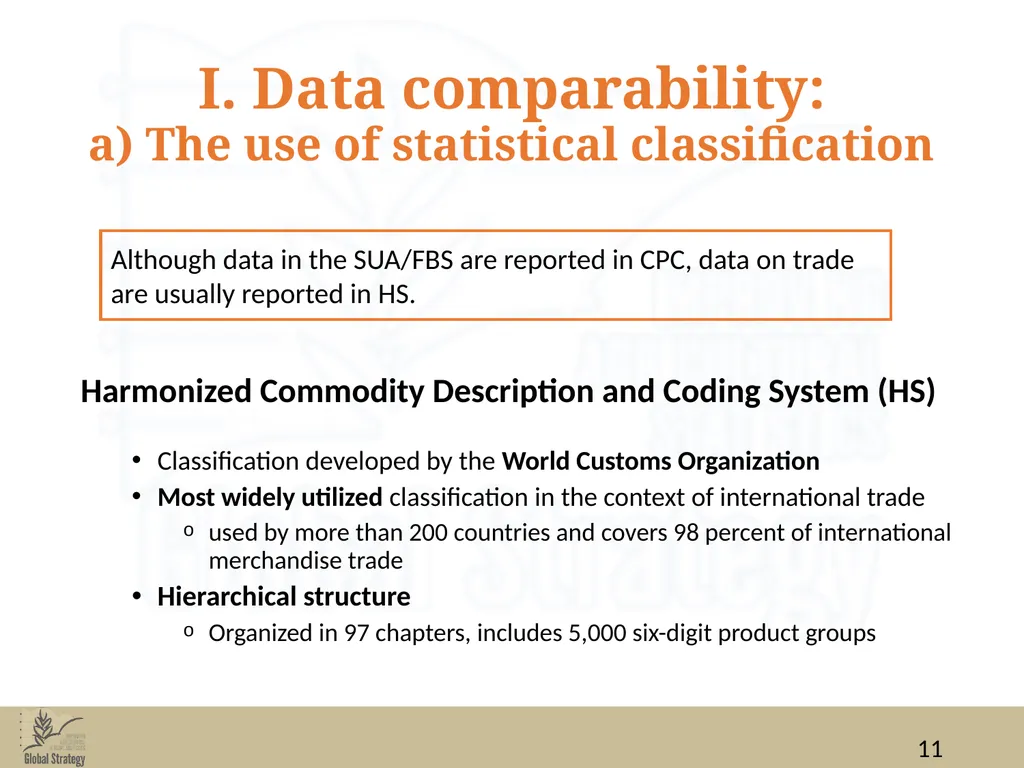
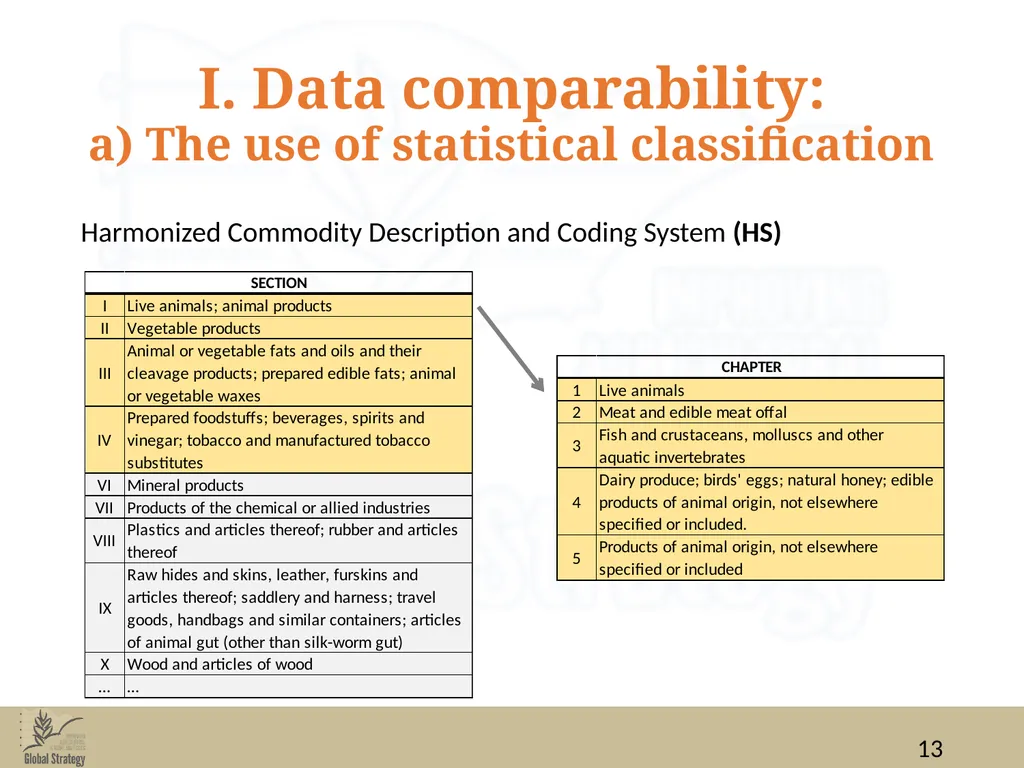
a) The use of statistical classification Harmonized Commodity Description and Coding System (HS)
Classification developed by the World Customs Organization
Most widely utilized classification in the context of international trade
used by more than 200 countries and covers 98 percent of international merchandise trade
Hierarchical structure
Organized in 97 chapters, includes 5,000 six-digit product groups Although data in the SUA/FBS are reported in CPC, data on trade are usually reported in HS.<br>
Classification developed by the World Customs Organization
Most widely utilized classification in the context of international trade
used by more than 200 countries and covers 98 percent of international merchandise trade
Hierarchical structure
Organized in 97 chapters, includes 5,000 six-digit product groups Although data in the SUA/FBS are reported in CPC, data on trade are usually reported in HS.<br>
12
I. Data comparability:
a) The use of statistical classification The use of the HS for trade data within the FBS context is recommended:
data comparability purposes
ease of concordance with the CPC<br>
data comparability purposes
ease of concordance with the CPC<br>
13
I. Data comparability:
a) The use of statistical classification Harmonized Commodity Description and Coding System (HS)<br>
14
I. Data comparability:
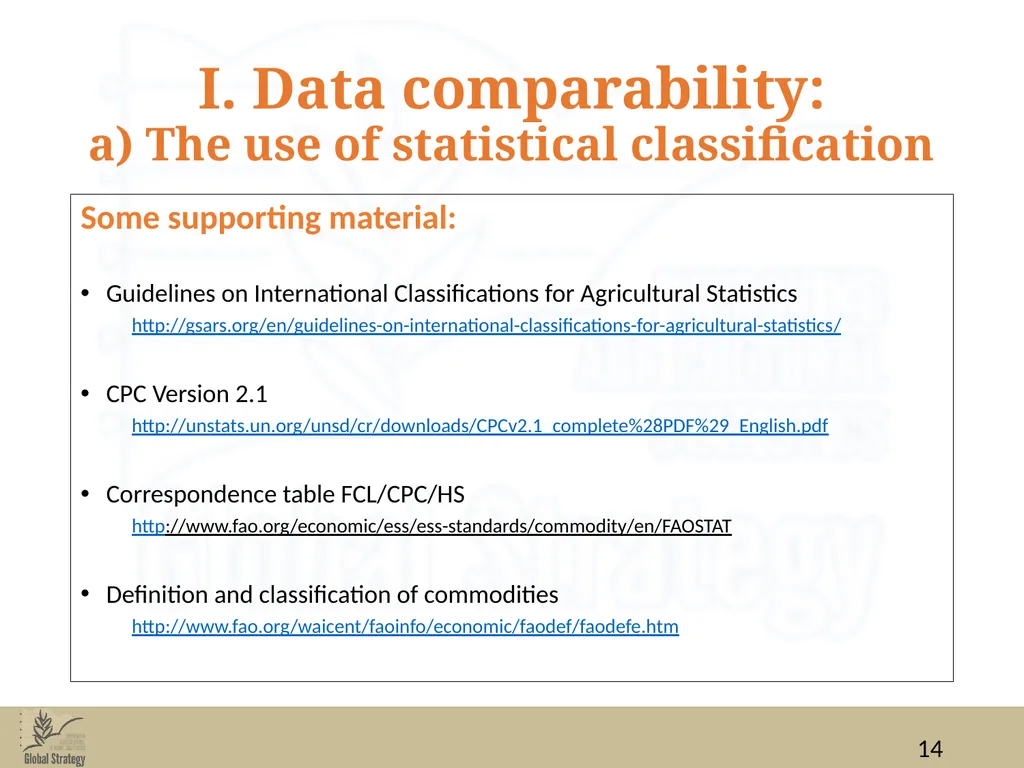
a) The use of statistical classification Some supporting material:
Guidelines on International Classifications for Agricultural Statistics
http://gsars.org/en/guidelines-on-international-classifications-for-agricultural-statistics/
CPC Version 2.1
http://unstats.un.org/unsd/cr/downloads/CPCv2.1_complete%28PDF%29_English.pdf
Correspondence table FCL/CPC/HS
http://www.fao.org/economic/ess/ess-standards/commodity/en/FAOSTAT
Definition and classification of commodities
http://www.fao.org/waicent/faoinfo/economic/faodef/faodefe.htm<br>
Guidelines on International Classifications for Agricultural Statistics
http://gsars.org/en/guidelines-on-international-classifications-for-agricultural-statistics/
CPC Version 2.1
http://unstats.un.org/unsd/cr/downloads/CPCv2.1_complete%28PDF%29_English.pdf
Correspondence table FCL/CPC/HS
http://www.fao.org/economic/ess/ess-standards/commodity/en/FAOSTAT
Definition and classification of commodities
http://www.fao.org/waicent/faoinfo/economic/faodef/faodefe.htm<br>
15
I. Data comparability:
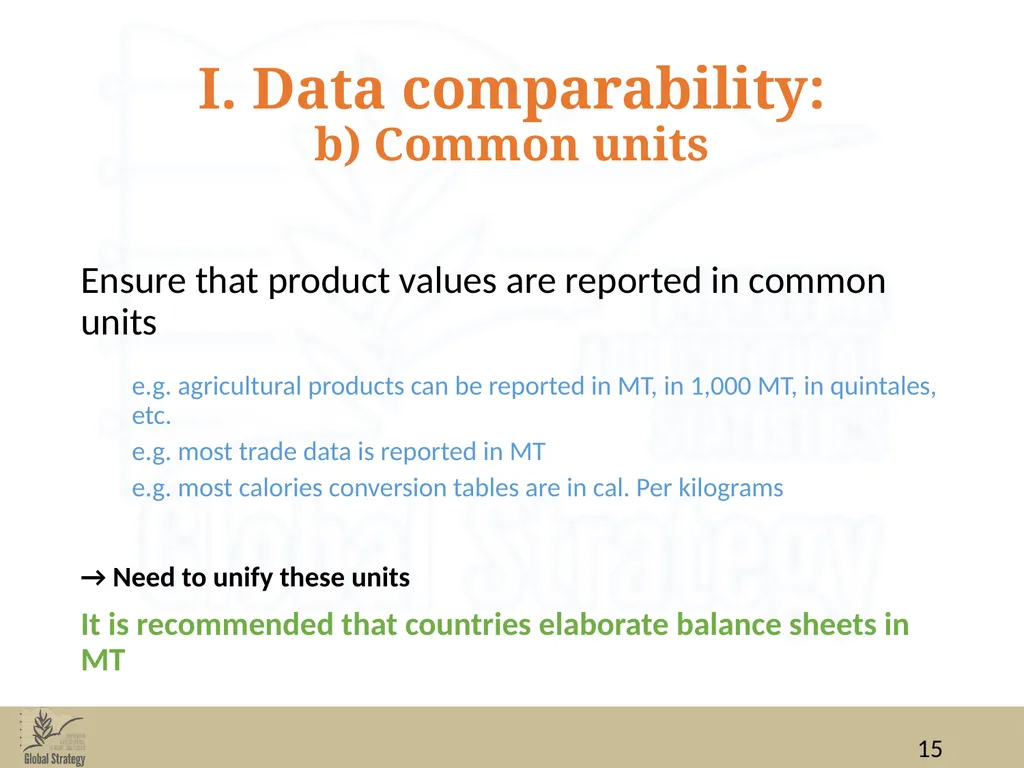
b) Common units Ensure that product values are reported in common units
e.g. agricultural products can be reported in MT, in 1,000 MT, in quintales, etc.
e.g. most trade data is reported in MT
e.g. most calories conversion tables are in cal. Per kilograms
→ Need to unify these units
It is recommended that countries elaborate balance sheets in MT<br>
e.g. agricultural products can be reported in MT, in 1,000 MT, in quintales, etc.
e.g. most trade data is reported in MT
e.g. most calories conversion tables are in cal. Per kilograms
→ Need to unify these units
It is recommended that countries elaborate balance sheets in MT<br>
16
I. Data comparability:
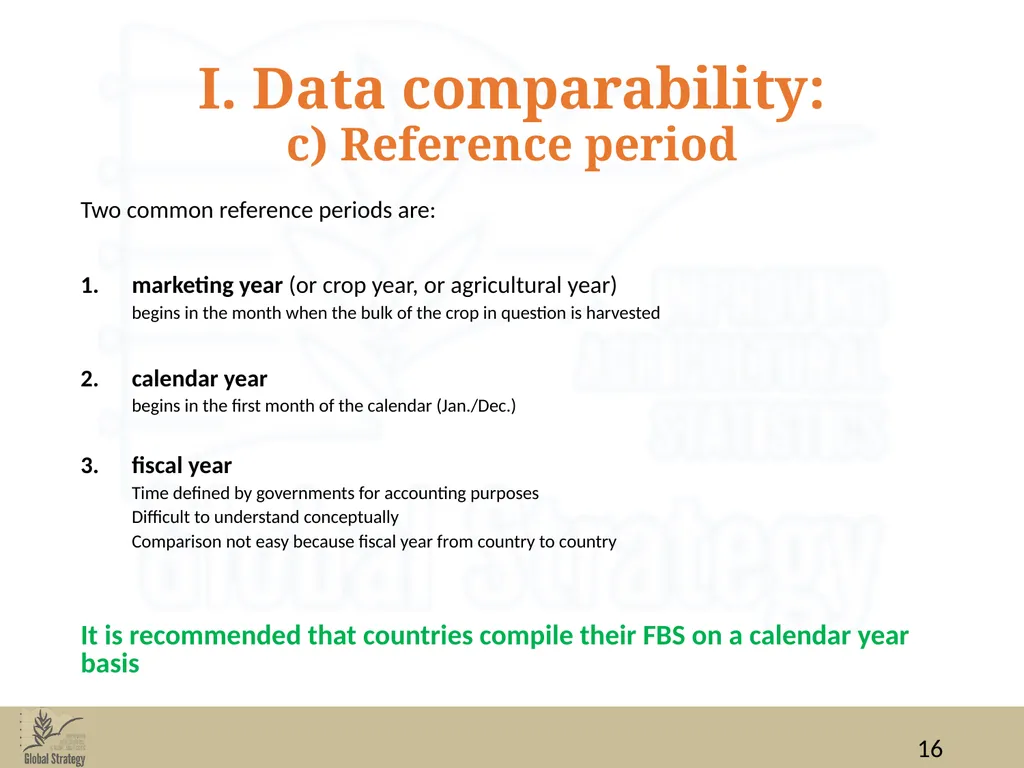
c) Reference period Two common reference periods are:
marketing year (or crop year, or agricultural year)
begins in the month when the bulk of the crop in question is harvested
calendar year
begins in the first month of the calendar (Jan./Dec.)
fiscal year
Time defined by governments for accounting purposes
Difficult to understand conceptually
Comparison not easy because fiscal year from country to country
It is recommended that countries compile their FBS on a calendar year basis<br>
marketing year (or crop year, or agricultural year)
begins in the month when the bulk of the crop in question is harvested
calendar year
begins in the first month of the calendar (Jan./Dec.)
fiscal year
Time defined by governments for accounting purposes
Difficult to understand conceptually
Comparison not easy because fiscal year from country to country
It is recommended that countries compile their FBS on a calendar year basis<br>
17
I. Data comparability:
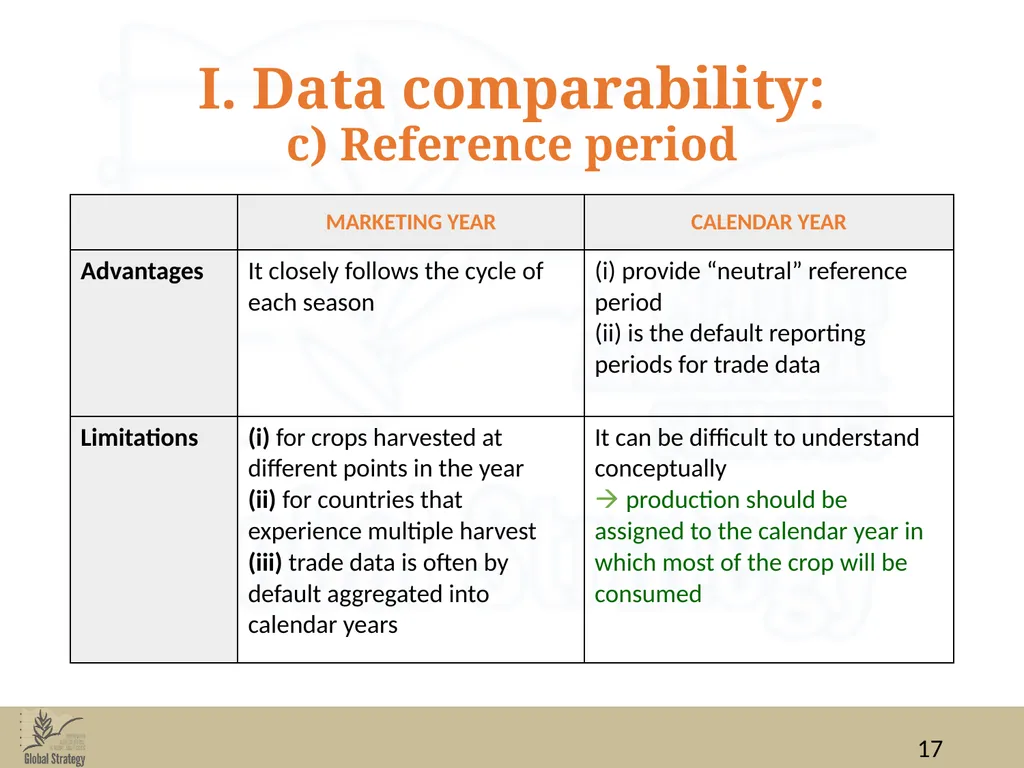
c) Reference period<br>
18
II. Data quality, measurement error and flags<br>
19
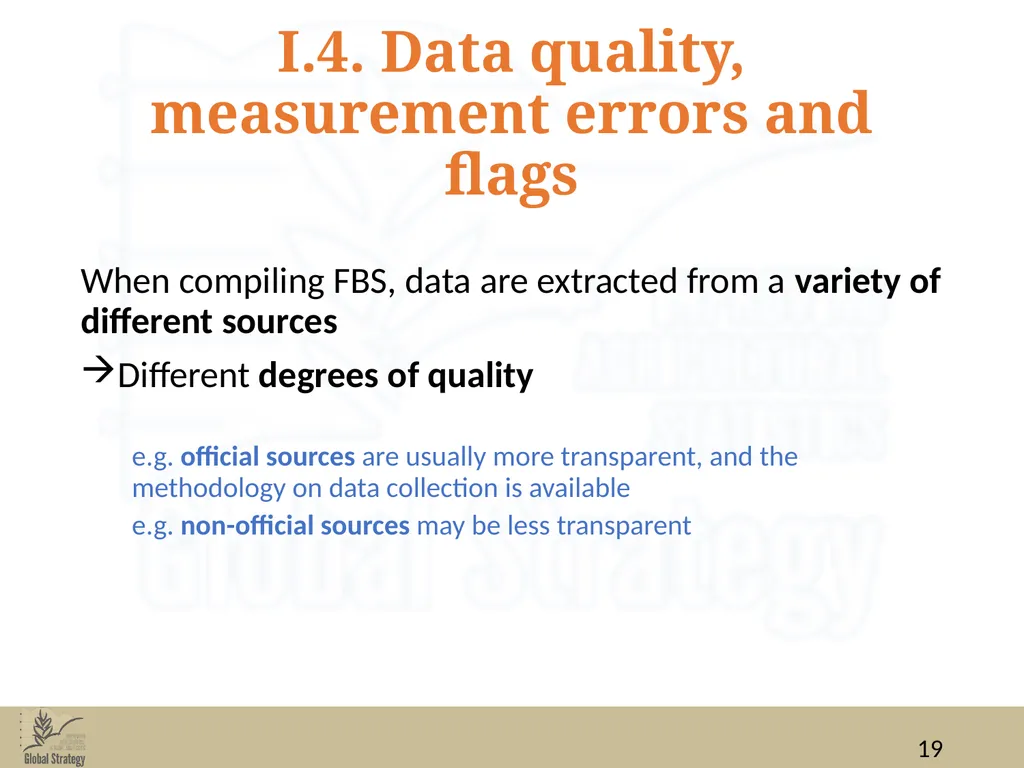
I.4. Data quality, measurement errors and flags When compiling FBS, data are extracted from a variety of different sources
Different degrees of quality
e.g. official sources are usually more transparent, and the methodology on data collection is available
e.g. non-official sources may be less transparent<br>
Different degrees of quality
e.g. official sources are usually more transparent, and the methodology on data collection is available
e.g. non-official sources may be less transparent<br>
20
I.4. Data quality, measurement errors and flags:
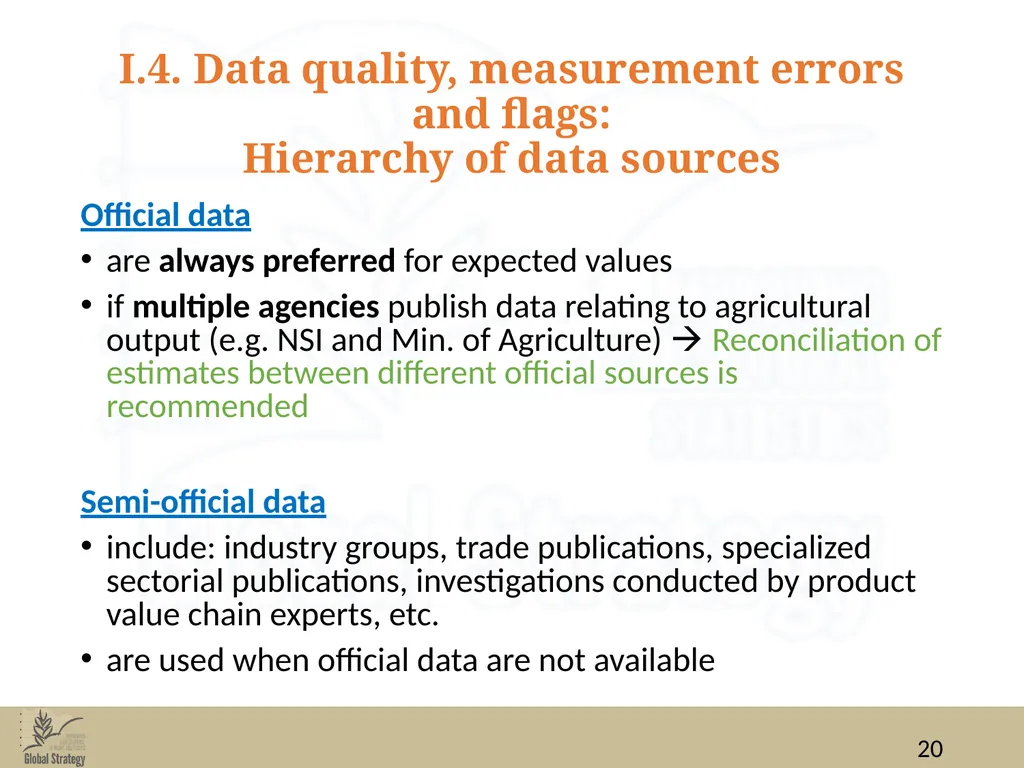
Hierarchy of data sources Official data
are always preferred for expected values
if multiple agencies publish data relating to agricultural output (e.g. NSI and Min. of Agriculture) Reconciliation of estimates between different official sources is recommended
Semi-official data
include: industry groups, trade publications, specialized sectorial publications, investigations conducted by product value chain experts, etc.
are used when official data are not available<br>
are always preferred for expected values
if multiple agencies publish data relating to agricultural output (e.g. NSI and Min. of Agriculture) Reconciliation of estimates between different official sources is recommended
Semi-official data
include: industry groups, trade publications, specialized sectorial publications, investigations conducted by product value chain experts, etc.
are used when official data are not available<br>
21
I.4. Data quality, measurement errors and flags:
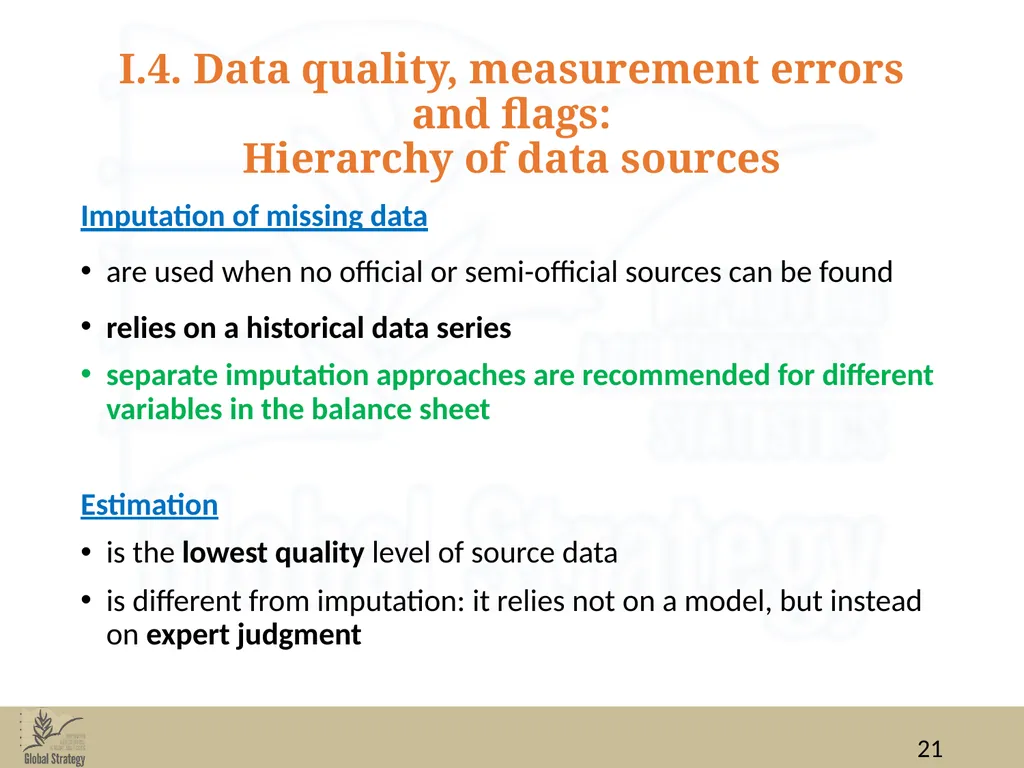
Hierarchy of data sources Imputation of missing data
are used when no official or semi-official sources can be found
relies on a historical data series
separate imputation approaches are recommended for different variables in the balance sheet
Estimation
is the lowest quality level of source data
is different from imputation: it relies not on a model, but instead on expert judgment<br>
are used when no official or semi-official sources can be found
relies on a historical data series
separate imputation approaches are recommended for different variables in the balance sheet
Estimation
is the lowest quality level of source data
is different from imputation: it relies not on a model, but instead on expert judgment<br>
22
II.1. Data quality, measurement errors and flags:
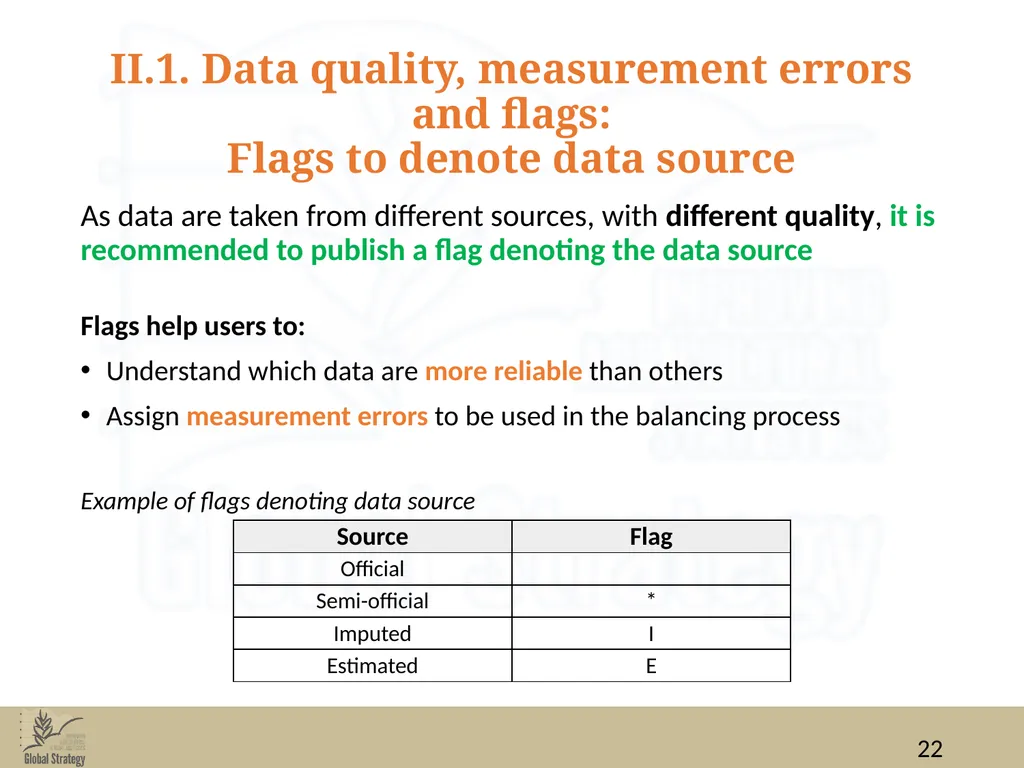
Flags to denote data source As data are taken from different sources, with different quality, it is recommended to publish a flag denoting the data source
Flags help users to:
Understand which data are more reliable than others
Assign measurement errors to be used in the balancing process
Example of flags denoting data source<br>
Flags help users to:
Understand which data are more reliable than others
Assign measurement errors to be used in the balancing process
Example of flags denoting data source<br>
23
II.2. Data quality, measurement errors and flags:
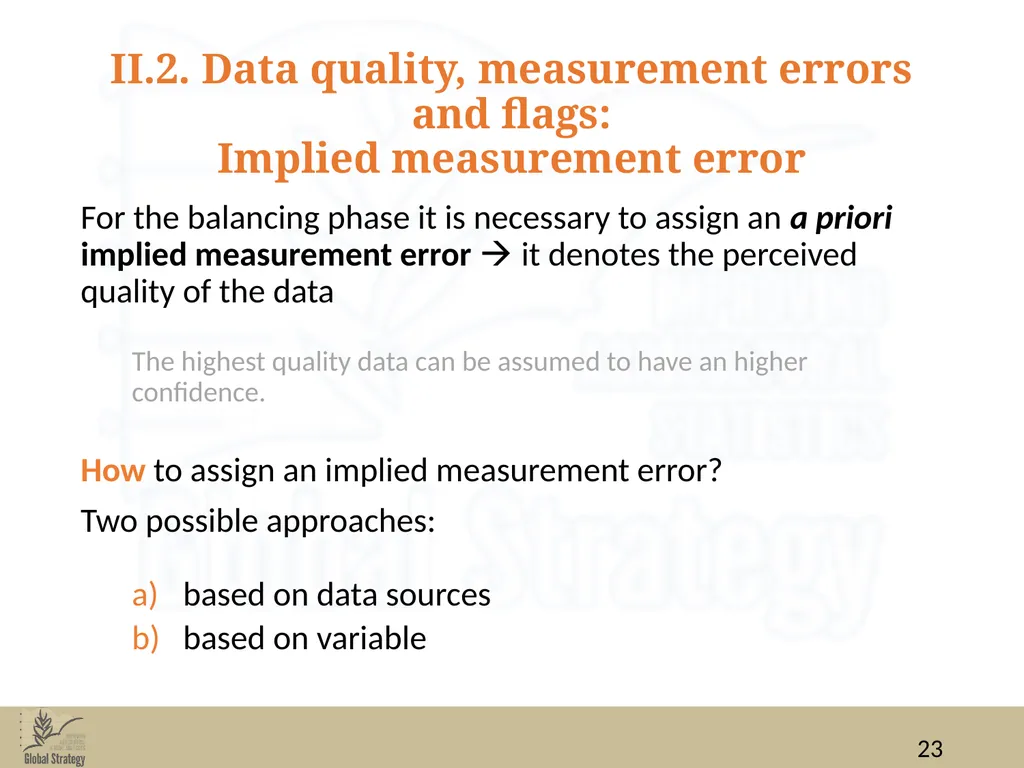
Implied measurement error For the balancing phase it is necessary to assign an a priori implied measurement error it denotes the perceived quality of the data
The highest quality data can be assumed to have an higher confidence.
How to assign an implied measurement error?
Two possible approaches:
based on data sources
based on variable<br>
The highest quality data can be assumed to have an higher confidence.
How to assign an implied measurement error?
Two possible approaches:
based on data sources
based on variable<br>
24
II.2. Data quality, measurement errors and flags:
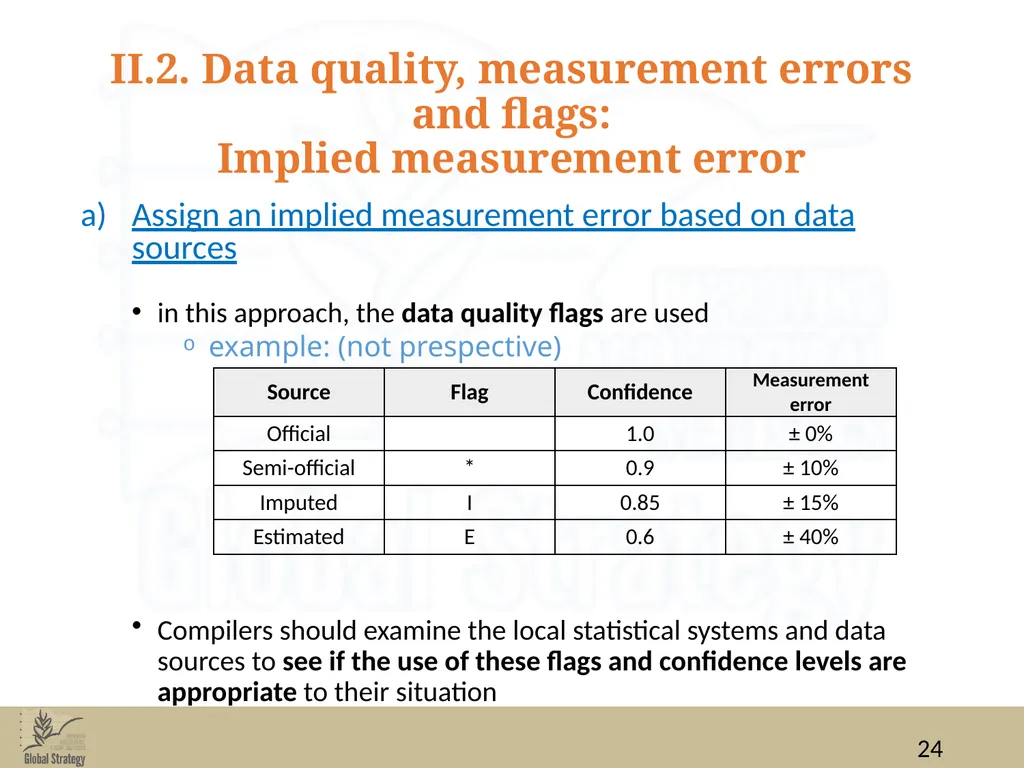
Implied measurement error Assign an implied measurement error based on data sources
in this approach, the data quality flags are used
example: (not prespective)
Compilers should examine the local statistical systems and data sources to see if the use of these flags and confidence levels are appropriate to their situation<br>
in this approach, the data quality flags are used
example: (not prespective)
Compilers should examine the local statistical systems and data sources to see if the use of these flags and confidence levels are appropriate to their situation<br>
25
II.2. Data quality, measurement errors and flags:
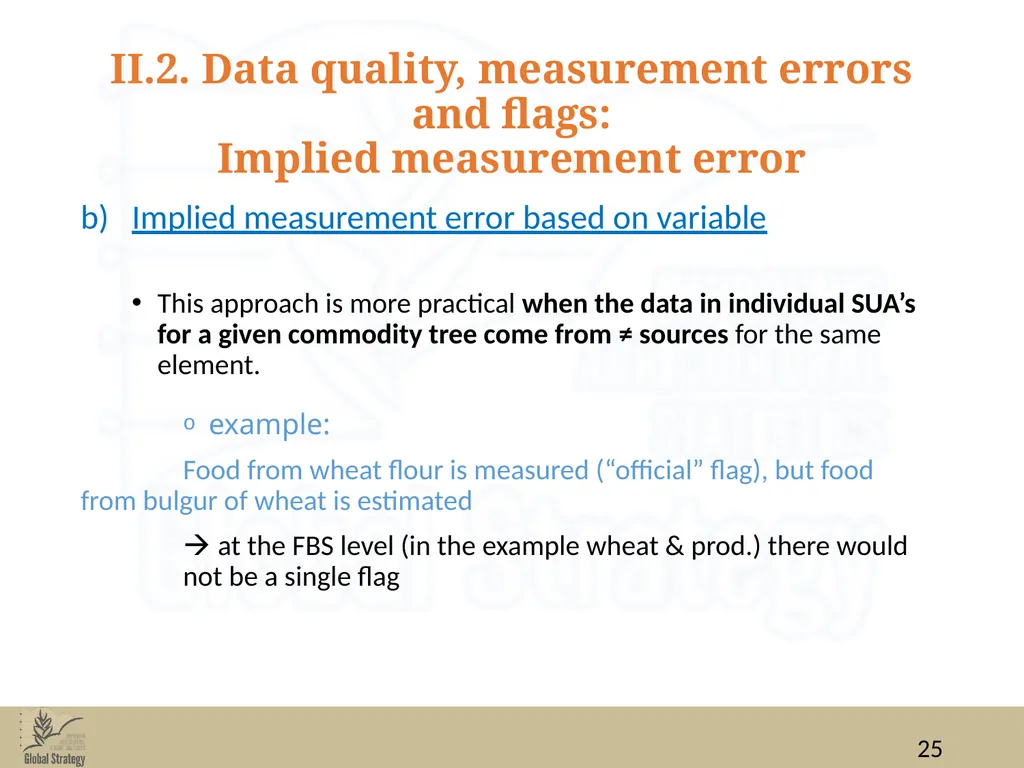
Implied measurement error Implied measurement error based on variable
This approach is more practical when the data in individual SUA’s for a given commodity tree come from ≠ sources for the same element.
example:
Food from wheat flour is measured (“official” flag), but food from bulgur of wheat is estimated
at the FBS level (in the example wheat & prod.) there would not be a single flag<br>
This approach is more practical when the data in individual SUA’s for a given commodity tree come from ≠ sources for the same element.
example:
Food from wheat flour is measured (“official” flag), but food from bulgur of wheat is estimated
at the FBS level (in the example wheat & prod.) there would not be a single flag<br>
26
II.2. Data quality, measurement errors and flags:
Implied measurement error Implied measurement error based on variable (…cont.)
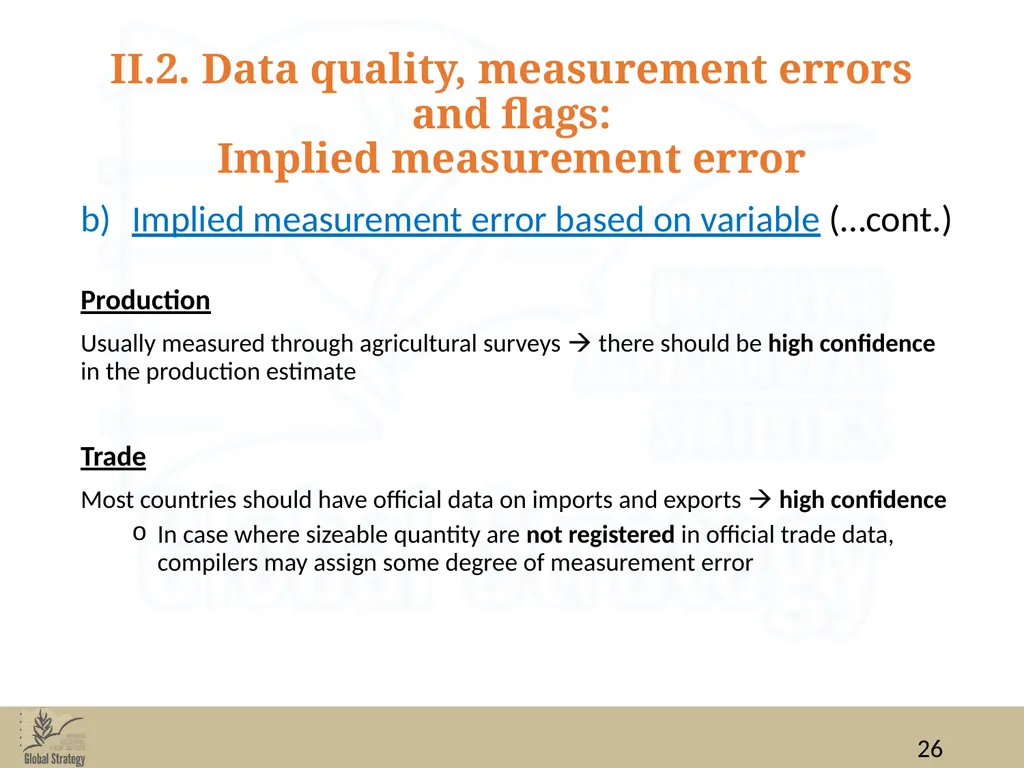
Production
Usually measured through agricultural surveys there should be high confidence in the production estimate
Trade
Most countries should have official data on imports and exports high confidence
In case where sizeable quantity are not registered in official trade data, compilers may assign some degree of measurement error<br>
Production
Usually measured through agricultural surveys there should be high confidence in the production estimate
Trade
Most countries should have official data on imports and exports high confidence
In case where sizeable quantity are not registered in official trade data, compilers may assign some degree of measurement error<br>
27
II.2. Data quality, measurement errors and flags:
Implied measurement error Implied measurement error based on variable (…cont.)
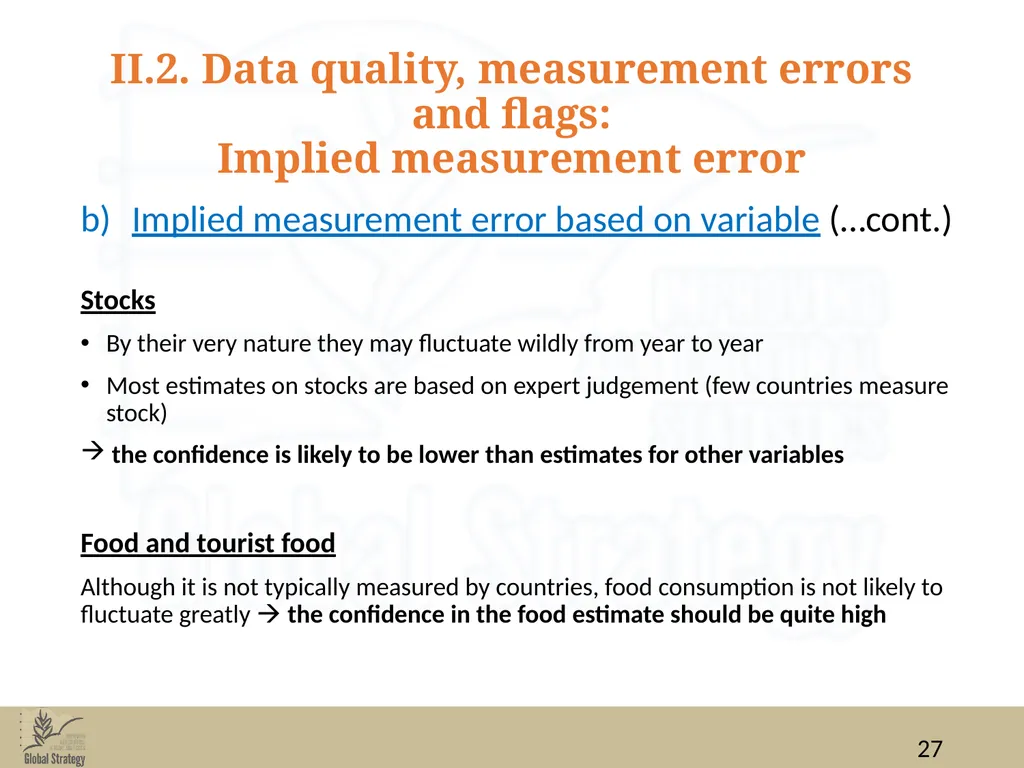
Stocks
By their very nature they may fluctuate wildly from year to year
Most estimates on stocks are based on expert judgement (few countries measure stock)
the confidence is likely to be lower than estimates for other variables
Food and tourist food
Although it is not typically measured by countries, food consumption is not likely to fluctuate greatly the confidence in the food estimate should be quite high<br>
Stocks
By their very nature they may fluctuate wildly from year to year
Most estimates on stocks are based on expert judgement (few countries measure stock)
the confidence is likely to be lower than estimates for other variables
Food and tourist food
Although it is not typically measured by countries, food consumption is not likely to fluctuate greatly the confidence in the food estimate should be quite high<br>
28
II.2. Data quality, measurement errors and flags:
Implied measurement error Implied measurement error based on variable (…cont.)
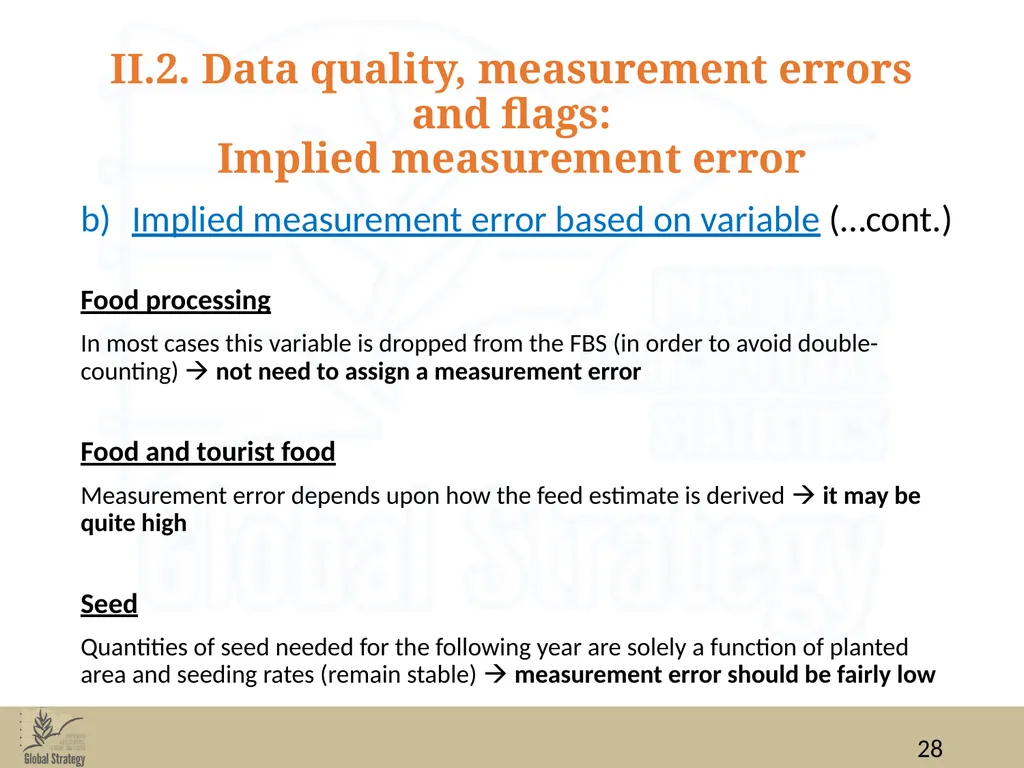
Food processing
In most cases this variable is dropped from the FBS (in order to avoid double-counting) not need to assign a measurement error
Food and tourist food
Measurement error depends upon how the feed estimate is derived it may be quite high
Seed
Quantities of seed needed for the following year are solely a function of planted area and seeding rates (remain stable) measurement error should be fairly low<br>
Food processing
In most cases this variable is dropped from the FBS (in order to avoid double-counting) not need to assign a measurement error
Food and tourist food
Measurement error depends upon how the feed estimate is derived it may be quite high
Seed
Quantities of seed needed for the following year are solely a function of planted area and seeding rates (remain stable) measurement error should be fairly low<br>
29
II.2. Data quality, measurement errors and flags:
Implied measurement error Implied measurement error based on variable (…cont.)
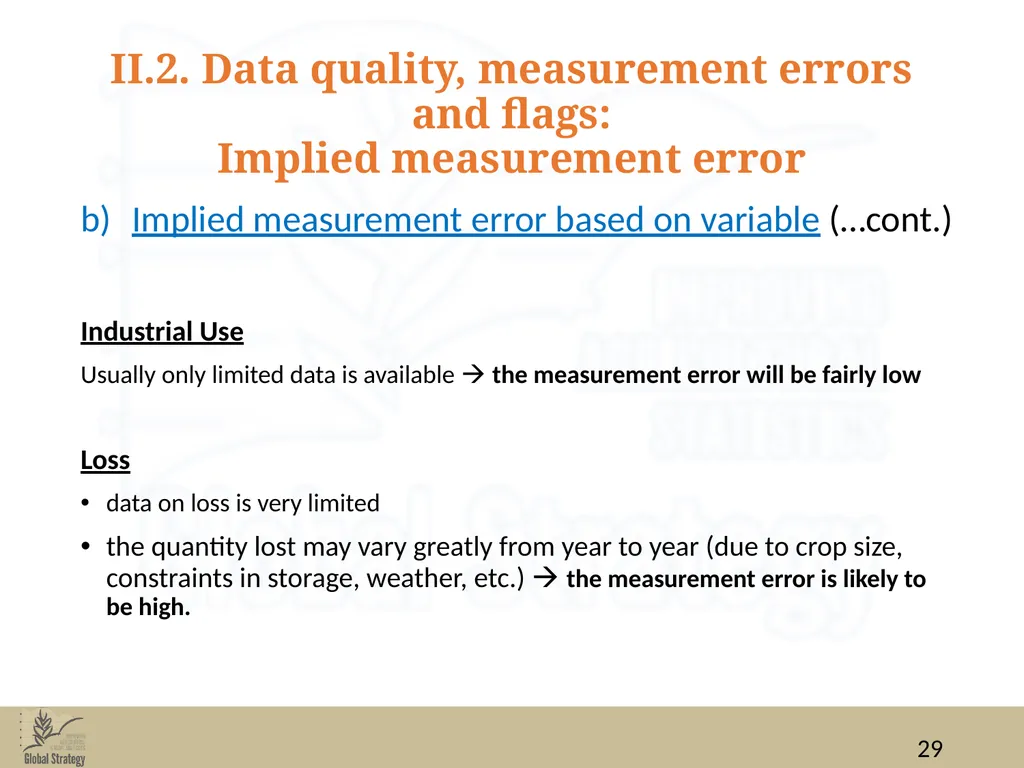
Industrial Use
Usually only limited data is available the measurement error will be fairly low
Loss
data on loss is very limited
the quantity lost may vary greatly from year to year (due to crop size, constraints in storage, weather, etc.) the measurement error is likely to be high.<br>
Industrial Use
Usually only limited data is available the measurement error will be fairly low
Loss
data on loss is very limited
the quantity lost may vary greatly from year to year (due to crop size, constraints in storage, weather, etc.) the measurement error is likely to be high.<br>
30
II.2. Data quality, measurement errors and flags:
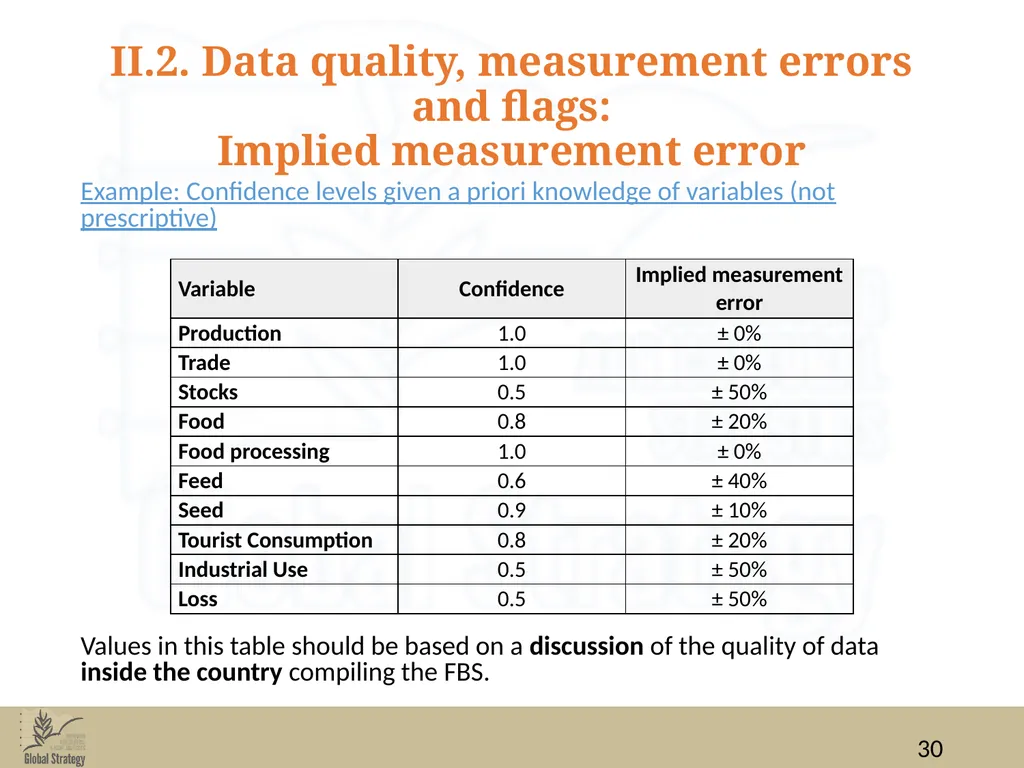
Implied measurement error Example: Confidence levels given a priori knowledge of variables (not prescriptive)
Values in this table should be based on a discussion of the quality of data inside the country compiling the FBS.<br>
Values in this table should be based on a discussion of the quality of data inside the country compiling the FBS.<br>
31
III. Data search and assessment<br>
32
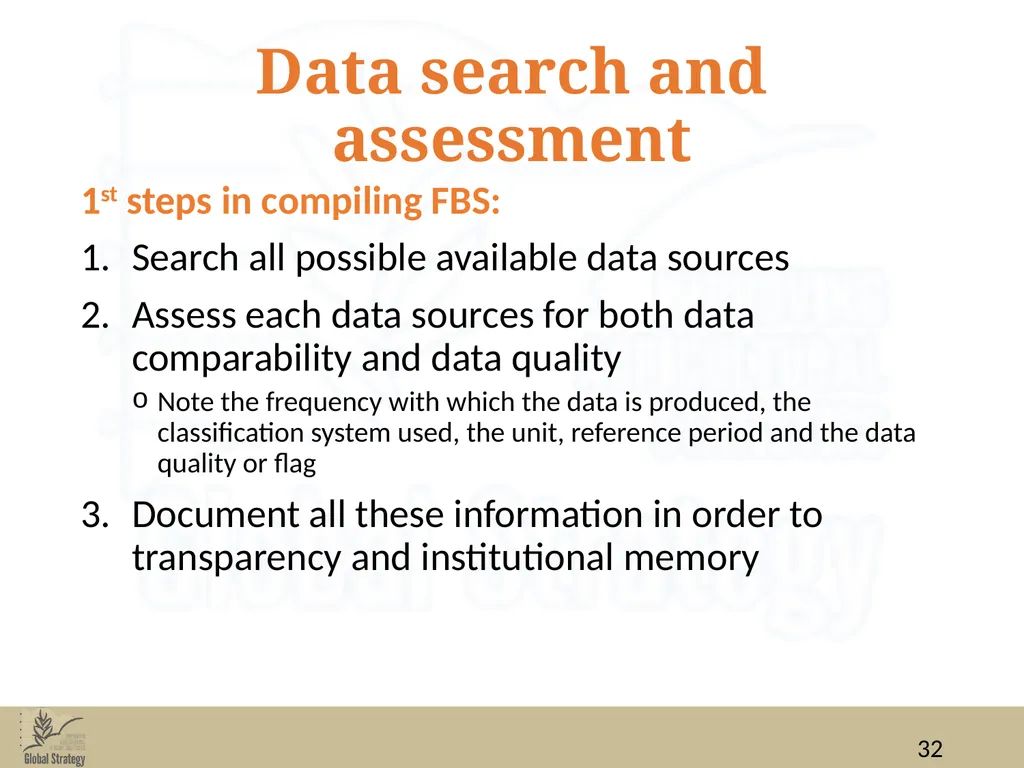
Data search and assessment 1st steps in compiling FBS:
Search all possible available data sources
Assess each data sources for both data comparability and data quality
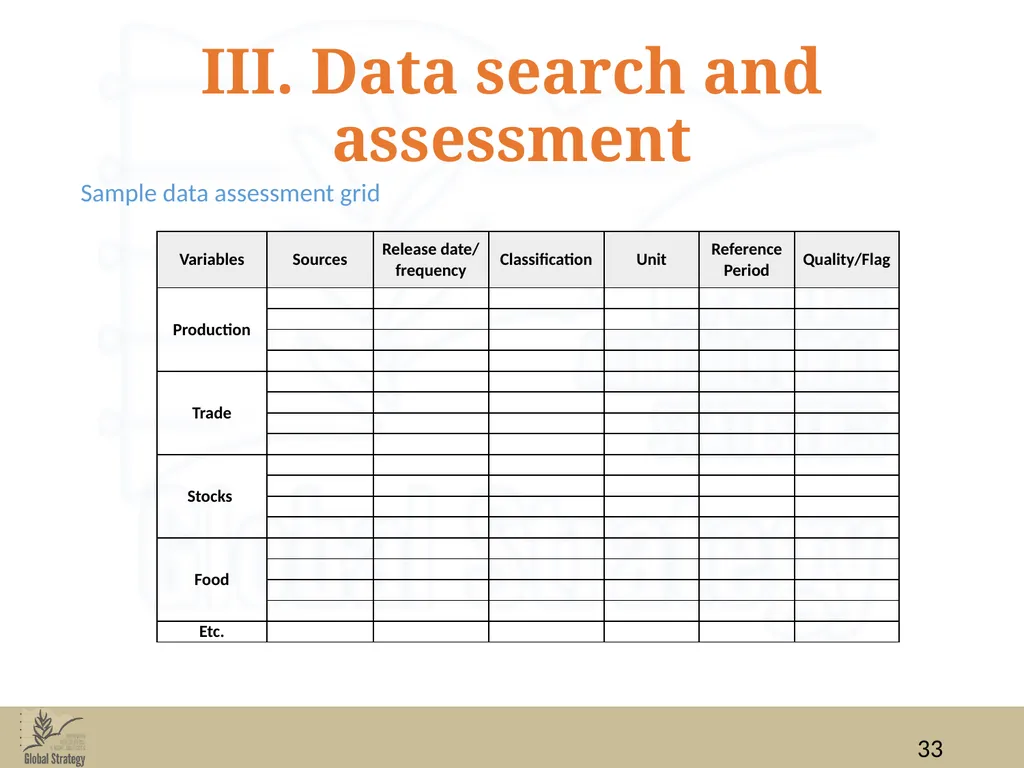
Note the frequency with which the data is produced, the classification system used, the unit, reference period and the data quality or flag
Document all these information in order to transparency and institutional memory<br>
Search all possible available data sources
Assess each data sources for both data comparability and data quality
Note the frequency with which the data is produced, the classification system used, the unit, reference period and the data quality or flag
Document all these information in order to transparency and institutional memory<br>
33
III. Data search and assessment Sample data assessment grid<br>
34
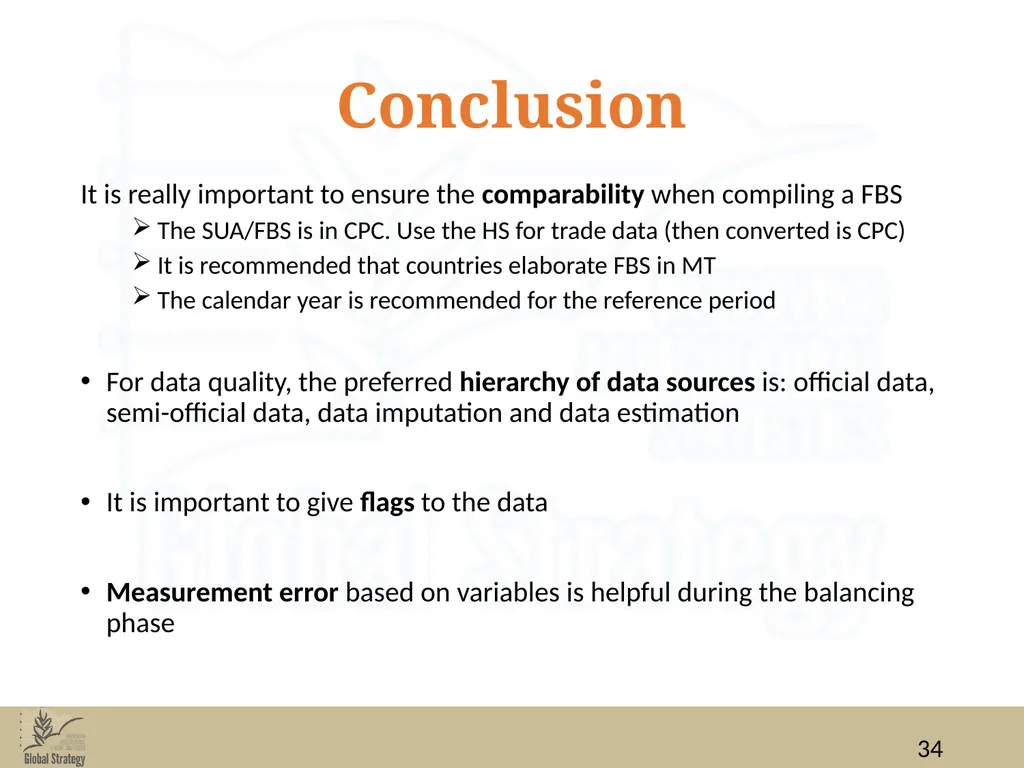
Conclusion It is really important to ensure the comparability when compiling a FBS
The SUA/FBS is in CPC. Use the HS for trade data (then converted is CPC)
It is recommended that countries elaborate FBS in MT
The calendar year is recommended for the reference period
For data quality, the preferred hierarchy of data sources is: official data, semi-official data, data imputation and data estimation
It is important to give flags to the data
Measurement error based on variables is helpful during the balancing phase<br>
The SUA/FBS is in CPC. Use the HS for trade data (then converted is CPC)
It is recommended that countries elaborate FBS in MT
The calendar year is recommended for the reference period
For data quality, the preferred hierarchy of data sources is: official data, semi-official data, data imputation and data estimation
It is important to give flags to the data
Measurement error based on variables is helpful during the balancing phase<br>
35
References Global Strategy to improve agricultural and rural statistics, 2017. Hanbook of Food Balance Sheet, pp 45-58., Rome, Italy<br>
36
Thank You<br>