
For Information Finance Report August 2023 (Month
T
Published · 20 slides · 0 views

1 / 1
Description
For Information Finance Report August 2023 (Month 5), FY24 Report to Board of Directors Executive Summary Income Statement Forecast Movement from Previous Month Forecast Risks Opportunities Capital Investment Programme Directorate
Related Topics
Share
Embed code
Download this presentation From Below
"For Information Finance Report August 2023 (Month" is the property of its rightful owner. Permission is granted to download and print the materials on this website for personal, non-commercial use only, and to display it on your personal computer provided you do not modify the materials and that you retain all copyright notices contained in the materials. By downloading content from our website, you accept the terms of this agreement.
Presentation Transcript
01
For Information
Finance Report
August 2023 (Month 5), FY24
Report to Board of Directors Executive Summary
Income Statement
Forecast Movement from Previous Month
Forecast Risks & Opportunities
Capital Investment Programme
Directorate Financial Performance Summary
Pay Trends
Agency Analysis
Non-Pay Expenditure analysis
Out of Area Placements
Cost Improvement Plan
Productivity Improvement Plan
Statement of Position
Cash-flow
Working Capital Indicators Contents A risk assessment has been undertaken around the legal issues that this paper presents and there are no issues that need to be referred to the Trust Solicitors. 1<br>
Finance Report
August 2023 (Month 5), FY24
Report to Board of Directors Executive Summary
Income Statement
Forecast Movement from Previous Month
Forecast Risks & Opportunities
Capital Investment Programme
Directorate Financial Performance Summary
Pay Trends
Agency Analysis
Non-Pay Expenditure analysis
Out of Area Placements
Cost Improvement Plan
Productivity Improvement Plan
Statement of Position
Cash-flow
Working Capital Indicators Contents A risk assessment has been undertaken around the legal issues that this paper presents and there are no issues that need to be referred to the Trust Solicitors. 1<br>
02
2 Executive Summary Highlights:
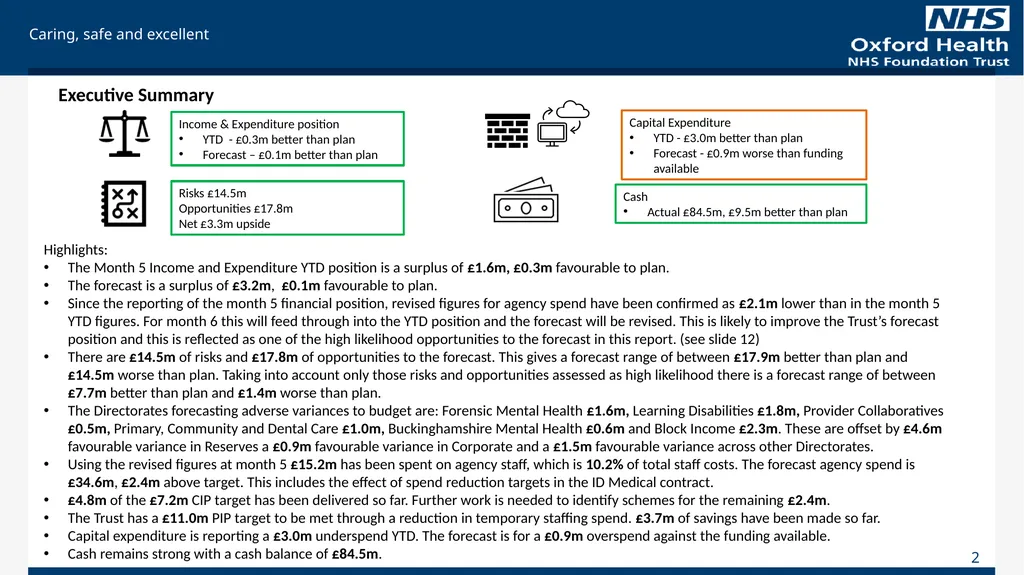
The Month 5 Income and Expenditure YTD position is a surplus of £1.6m, £0.3m favourable to plan.
The forecast is a surplus of £3.2m, £0.1m favourable to plan.
Since the reporting of the month 5 financial position, revised figures for agency spend have been confirmed as £2.1m lower than in the month 5 YTD figures. For month 6 this will feed through into the YTD position and the forecast will be revised. This is likely to improve the Trust’s forecast position and this is reflected as one of the high likelihood opportunities to the forecast in this report. (see slide 12)
There are £14.5m of risks and £17.8m of opportunities to the forecast. This gives a forecast range of between £17.9m better than plan and £14.5m worse than plan. Taking into account only those risks and opportunities assessed as high likelihood there is a forecast range of between £7.7m better than plan and £1.4m worse than plan.
The Directorates forecasting adverse variances to budget are: Forensic Mental Health £1.6m, Learning Disabilities £1.8m, Provider Collaboratives £0.5m, Primary, Community and Dental Care £1.0m, Buckinghamshire Mental Health £0.6m and Block Income £2.3m. These are offset by £4.6m favourable variance in Reserves a £0.9m favourable variance in Corporate and a £1.5m favourable variance across other Directorates.
Using the revised figures at month 5 £15.2m has been spent on agency staff, which is 10.2% of total staff costs. The forecast agency spend is £34.6m, £2.4m above target. This includes the effect of spend reduction targets in the ID Medical contract.
£4.8m of the £7.2m CIP target has been delivered so far. Further work is needed to identify schemes for the remaining £2.4m.
The Trust has a £11.0m PIP target to be met through a reduction in temporary staffing spend. £3.7m of savings have been made so far.
Capital expenditure is reporting a £3.0m underspend YTD. The forecast is for a £0.9m overspend against the funding available.
Cash remains strong with a cash balance of £84.5m. Income & Expenditure position
YTD - £0.3m better than plan
Forecast – £0.1m better than plan Capital Expenditure
YTD - £3.0m better than plan
Forecast - £0.9m worse than funding available Cash
Actual £84.5m, £9.5m better than plan Risks £14.5m
Opportunities £17.8m
Net £3.3m upside<br>
The Month 5 Income and Expenditure YTD position is a surplus of £1.6m, £0.3m favourable to plan.
The forecast is a surplus of £3.2m, £0.1m favourable to plan.
Since the reporting of the month 5 financial position, revised figures for agency spend have been confirmed as £2.1m lower than in the month 5 YTD figures. For month 6 this will feed through into the YTD position and the forecast will be revised. This is likely to improve the Trust’s forecast position and this is reflected as one of the high likelihood opportunities to the forecast in this report. (see slide 12)
There are £14.5m of risks and £17.8m of opportunities to the forecast. This gives a forecast range of between £17.9m better than plan and £14.5m worse than plan. Taking into account only those risks and opportunities assessed as high likelihood there is a forecast range of between £7.7m better than plan and £1.4m worse than plan.
The Directorates forecasting adverse variances to budget are: Forensic Mental Health £1.6m, Learning Disabilities £1.8m, Provider Collaboratives £0.5m, Primary, Community and Dental Care £1.0m, Buckinghamshire Mental Health £0.6m and Block Income £2.3m. These are offset by £4.6m favourable variance in Reserves a £0.9m favourable variance in Corporate and a £1.5m favourable variance across other Directorates.
Using the revised figures at month 5 £15.2m has been spent on agency staff, which is 10.2% of total staff costs. The forecast agency spend is £34.6m, £2.4m above target. This includes the effect of spend reduction targets in the ID Medical contract.
£4.8m of the £7.2m CIP target has been delivered so far. Further work is needed to identify schemes for the remaining £2.4m.
The Trust has a £11.0m PIP target to be met through a reduction in temporary staffing spend. £3.7m of savings have been made so far.
Capital expenditure is reporting a £3.0m underspend YTD. The forecast is for a £0.9m overspend against the funding available.
Cash remains strong with a cash balance of £84.5m. Income & Expenditure position
YTD - £0.3m better than plan
Forecast – £0.1m better than plan Capital Expenditure
YTD - £3.0m better than plan
Forecast - £0.9m worse than funding available Cash
Actual £84.5m, £9.5m better than plan Risks £14.5m
Opportunities £17.8m
Net £3.3m upside<br>
03
Year-to-Date Performance
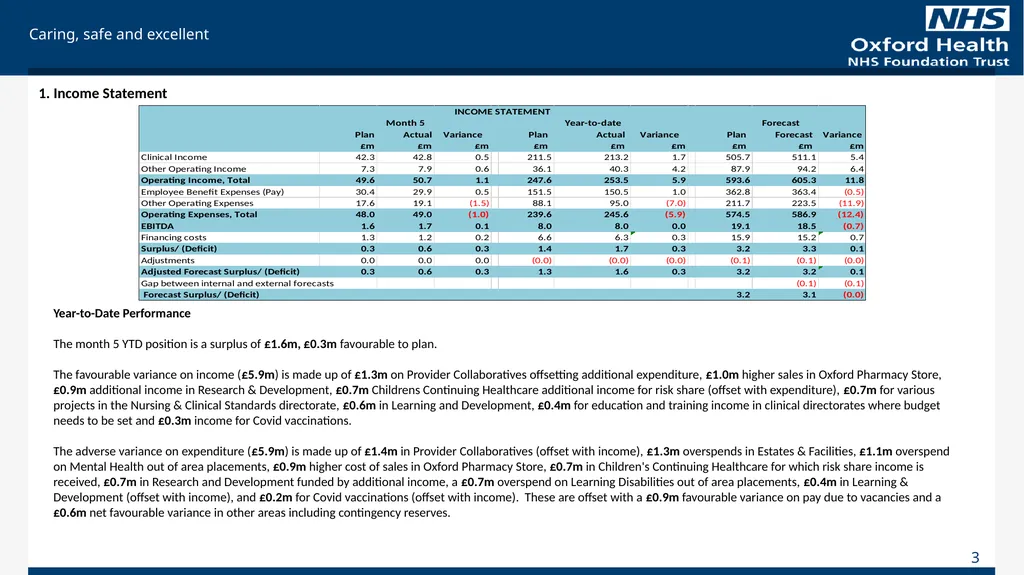
The month 5 YTD position is a surplus of £1.6m, £0.3m favourable to plan.
The favourable variance on income (£5.9m) is made up of £1.3m on Provider Collaboratives offsetting additional expenditure, £1.0m higher sales in Oxford Pharmacy Store, £0.9m additional income in Research & Development, £0.7m Childrens Continuing Healthcare additional income for risk share (offset with expenditure), £0.7m for various projects in the Nursing & Clinical Standards directorate, £0.6m in Learning and Development, £0.4m for education and training income in clinical directorates where budget needs to be set and £0.3m income for Covid vaccinations.
The adverse variance on expenditure (£5.9m) is made up of £1.4m in Provider Collaboratives (offset with income), £1.3m overspends in Estates & Facilities, £1.1m overspend on Mental Health out of area placements, £0.9m higher cost of sales in Oxford Pharmacy Store, £0.7m in Children's Continuing Healthcare for which risk share income is received, £0.7m in Research and Development funded by additional income, a £0.7m overspend on Learning Disabilities out of area placements, £0.4m in Learning & Development (offset with income), and £0.2m for Covid vaccinations (offset with income). These are offset with a £0.9m favourable variance on pay due to vacancies and a £0.6m net favourable variance in other areas including contingency reserves. 1. Income Statement 3<br>
The month 5 YTD position is a surplus of £1.6m, £0.3m favourable to plan.
The favourable variance on income (£5.9m) is made up of £1.3m on Provider Collaboratives offsetting additional expenditure, £1.0m higher sales in Oxford Pharmacy Store, £0.9m additional income in Research & Development, £0.7m Childrens Continuing Healthcare additional income for risk share (offset with expenditure), £0.7m for various projects in the Nursing & Clinical Standards directorate, £0.6m in Learning and Development, £0.4m for education and training income in clinical directorates where budget needs to be set and £0.3m income for Covid vaccinations.
The adverse variance on expenditure (£5.9m) is made up of £1.4m in Provider Collaboratives (offset with income), £1.3m overspends in Estates & Facilities, £1.1m overspend on Mental Health out of area placements, £0.9m higher cost of sales in Oxford Pharmacy Store, £0.7m in Children's Continuing Healthcare for which risk share income is received, £0.7m in Research and Development funded by additional income, a £0.7m overspend on Learning Disabilities out of area placements, £0.4m in Learning & Development (offset with income), and £0.2m for Covid vaccinations (offset with income). These are offset with a £0.9m favourable variance on pay due to vacancies and a £0.6m net favourable variance in other areas including contingency reserves. 1. Income Statement 3<br>
04
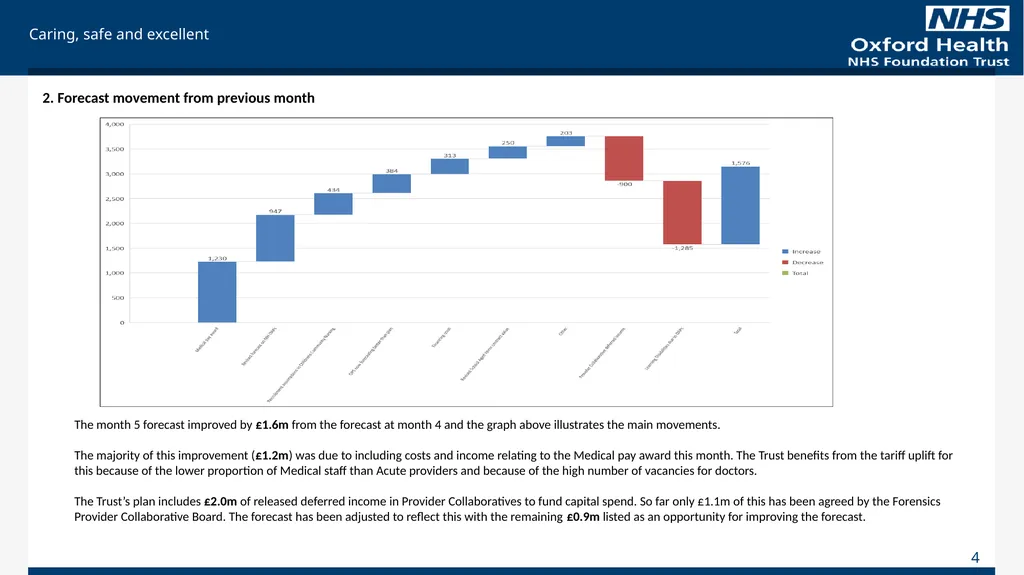
4 2. Forecast movement from previous month The month 5 forecast improved by £1.6m from the forecast at month 4 and the graph above illustrates the main movements.
The majority of this improvement (£1.2m) was due to including costs and income relating to the Medical pay award this month. The Trust benefits from the tariff uplift for this because of the lower proportion of Medical staff than Acute providers and because of the high number of vacancies for doctors.
The Trust’s plan includes £2.0m of released deferred income in Provider Collaboratives to fund capital spend. So far only £1.1m of this has been agreed by the Forensics Provider Collaborative Board. The forecast has been adjusted to reflect this with the remaining £0.9m listed as an opportunity for improving the forecast.<br>
The majority of this improvement (£1.2m) was due to including costs and income relating to the Medical pay award this month. The Trust benefits from the tariff uplift for this because of the lower proportion of Medical staff than Acute providers and because of the high number of vacancies for doctors.
The Trust’s plan includes £2.0m of released deferred income in Provider Collaboratives to fund capital spend. So far only £1.1m of this has been agreed by the Forensics Provider Collaborative Board. The forecast has been adjusted to reflect this with the remaining £0.9m listed as an opportunity for improving the forecast.<br>
05
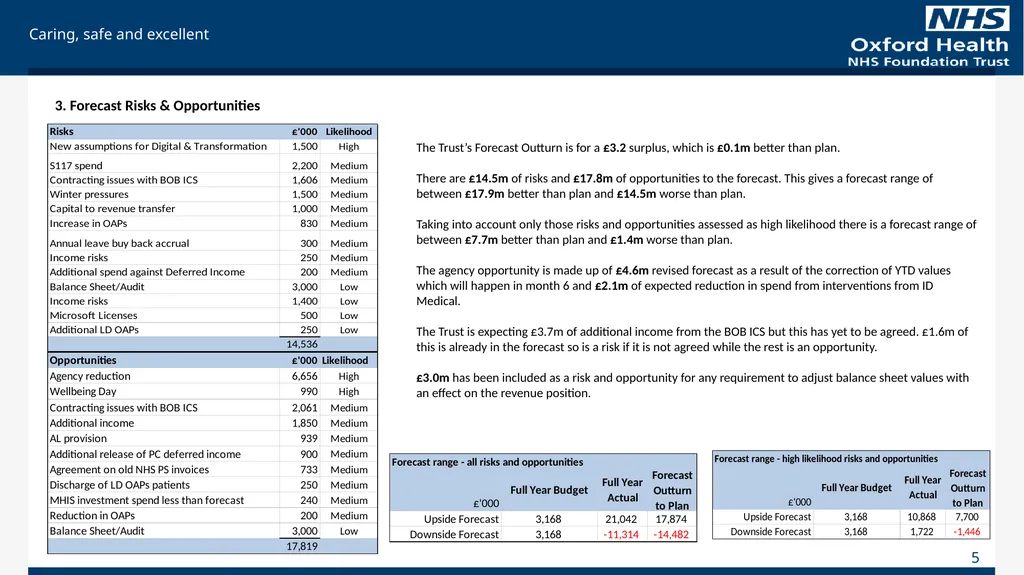
3. Forecast Risks & Opportunities The Trust’s Forecast Outturn is for a £3.2 surplus, which is £0.1m better than plan.
There are £14.5m of risks and £17.8m of opportunities to the forecast. This gives a forecast range of between £17.9m better than plan and £14.5m worse than plan.
Taking into account only those risks and opportunities assessed as high likelihood there is a forecast range of between £7.7m better than plan and £1.4m worse than plan.
The agency opportunity is made up of £4.6m revised forecast as a result of the correction of YTD values which will happen in month 6 and £2.1m of expected reduction in spend from interventions from ID Medical.
The Trust is expecting £3.7m of additional income from the BOB ICS but this has yet to be agreed. £1.6m of this is already in the forecast so is a risk if it is not agreed while the rest is an opportunity.
£3.0m has been included as a risk and opportunity for any requirement to adjust balance sheet values with an effect on the revenue position. 5<br>
There are £14.5m of risks and £17.8m of opportunities to the forecast. This gives a forecast range of between £17.9m better than plan and £14.5m worse than plan.
Taking into account only those risks and opportunities assessed as high likelihood there is a forecast range of between £7.7m better than plan and £1.4m worse than plan.
The agency opportunity is made up of £4.6m revised forecast as a result of the correction of YTD values which will happen in month 6 and £2.1m of expected reduction in spend from interventions from ID Medical.
The Trust is expecting £3.7m of additional income from the BOB ICS but this has yet to be agreed. £1.6m of this is already in the forecast so is a risk if it is not agreed while the rest is an opportunity.
£3.0m has been included as a risk and opportunity for any requirement to adjust balance sheet values with an effect on the revenue position. 5<br>
06
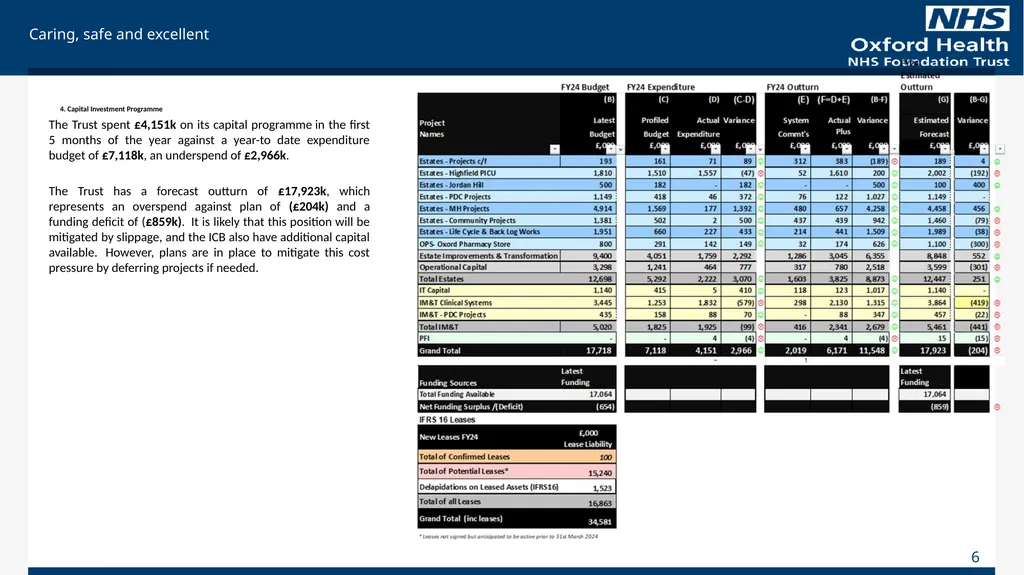
4. Capital Investment Programme The Trust spent £4,151k on its capital programme in the first 5 months of the year against a year-to date expenditure budget of £7,118k, an underspend of £2,966k.
The Trust has a forecast outturn of £17,923k, which represents an overspend against plan of (£204k) and a funding deficit of (£859k). It is likely that this position will be mitigated by slippage, and the ICB also have additional capital available. However, plans are in place to mitigate this cost pressure by deferring projects if needed. 6<br>
The Trust has a forecast outturn of £17,923k, which represents an overspend against plan of (£204k) and a funding deficit of (£859k). It is likely that this position will be mitigated by slippage, and the ICB also have additional capital available. However, plans are in place to mitigate this cost pressure by deferring projects if needed. 6<br>
07
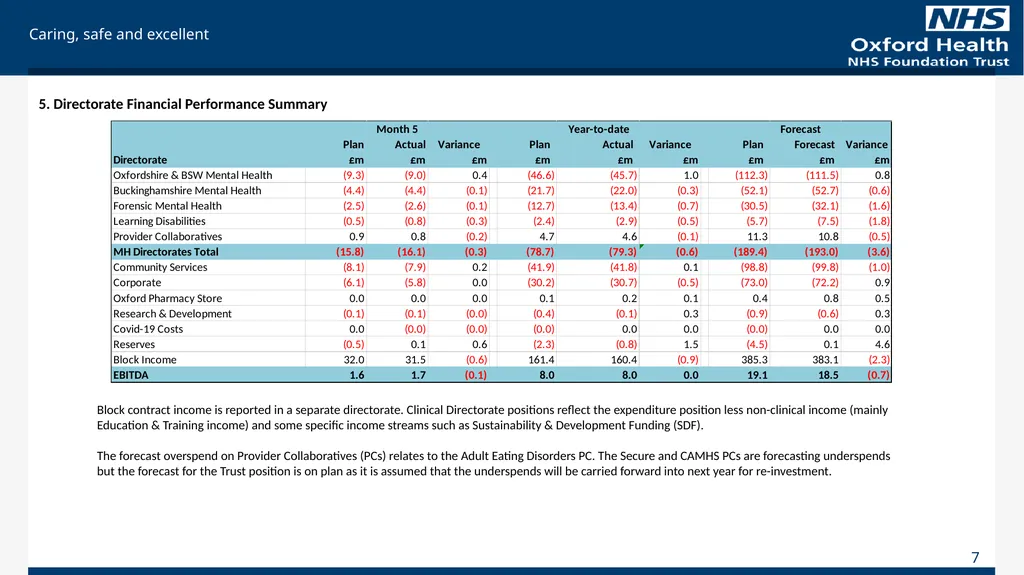
7 5. Directorate Financial Performance Summary Block contract income is reported in a separate directorate. Clinical Directorate positions reflect the expenditure position less non-clinical income (mainly Education & Training income) and some specific income streams such as Sustainability & Development Funding (SDF).
The forecast overspend on Provider Collaboratives (PCs) relates to the Adult Eating Disorders PC. The Secure and CAMHS PCs are forecasting underspends but the forecast for the Trust position is on plan as it is assumed that the underspends will be carried forward into next year for re-investment.<br>
The forecast overspend on Provider Collaboratives (PCs) relates to the Adult Eating Disorders PC. The Secure and CAMHS PCs are forecasting underspends but the forecast for the Trust position is on plan as it is assumed that the underspends will be carried forward into next year for re-investment.<br>
08
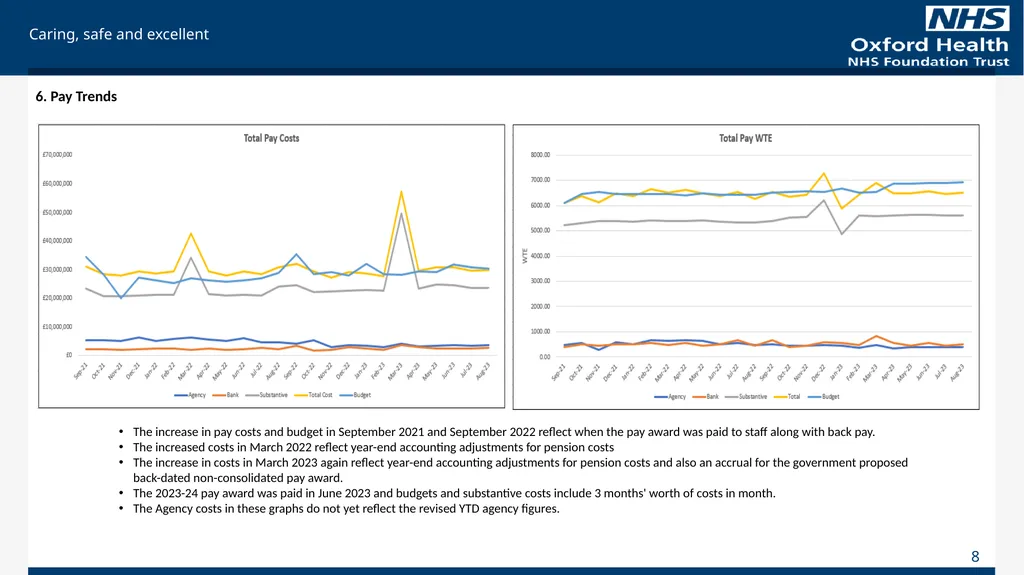
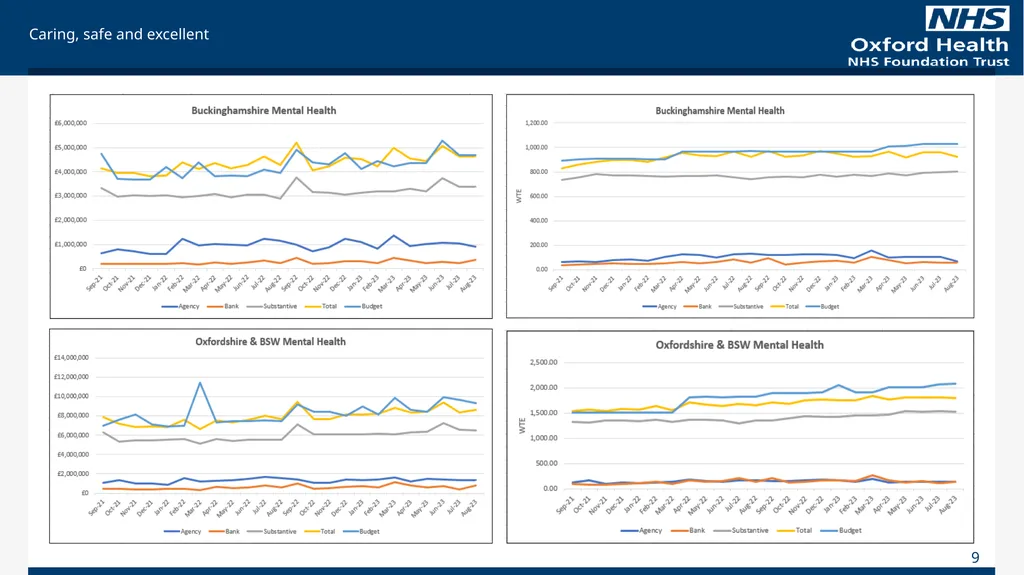
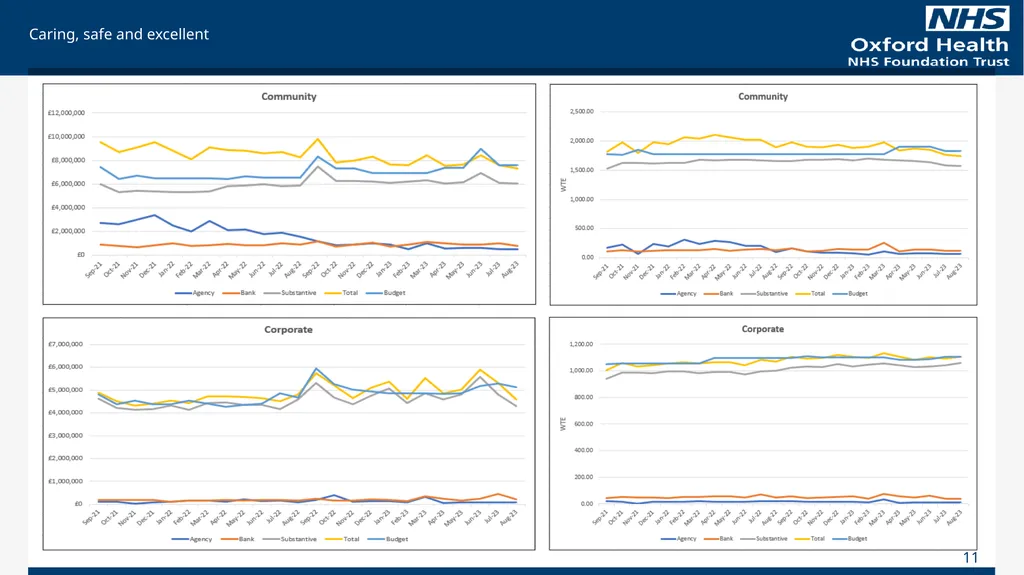
6. Pay Trends The increase in pay costs and budget in September 2021 and September 2022 reflect when the pay award was paid to staff along with back pay.
The increased costs in March 2022 reflect year-end accounting adjustments for pension costs
The increase in costs in March 2023 again reflect year-end accounting adjustments for pension costs and also an accrual for the government proposed back-dated non-consolidated pay award.
The 2023-24 pay award was paid in June 2023 and budgets and substantive costs include 3 months' worth of costs in month.
The Agency costs in these graphs do not yet reflect the revised YTD agency figures. 8<br>
The increased costs in March 2022 reflect year-end accounting adjustments for pension costs
The increase in costs in March 2023 again reflect year-end accounting adjustments for pension costs and also an accrual for the government proposed back-dated non-consolidated pay award.
The 2023-24 pay award was paid in June 2023 and budgets and substantive costs include 3 months' worth of costs in month.
The Agency costs in these graphs do not yet reflect the revised YTD agency figures. 8<br>
09
9<br>
10
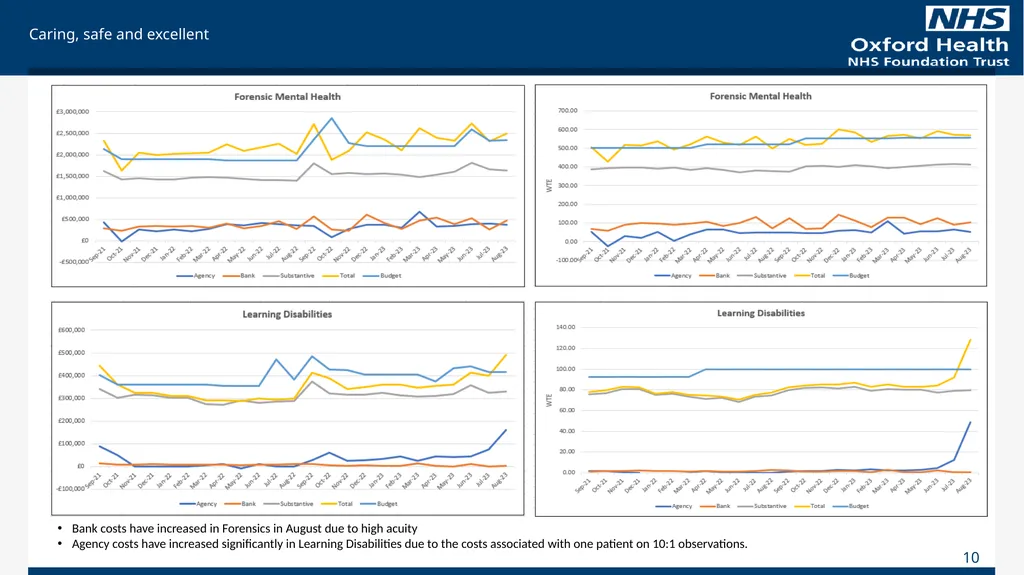
10 Bank costs have increased in Forensics in August due to high acuity
Agency costs have increased significantly in Learning Disabilities due to the costs associated with one patient on 10:1 observations.<br>
Agency costs have increased significantly in Learning Disabilities due to the costs associated with one patient on 10:1 observations.<br>
11
11<br>
12
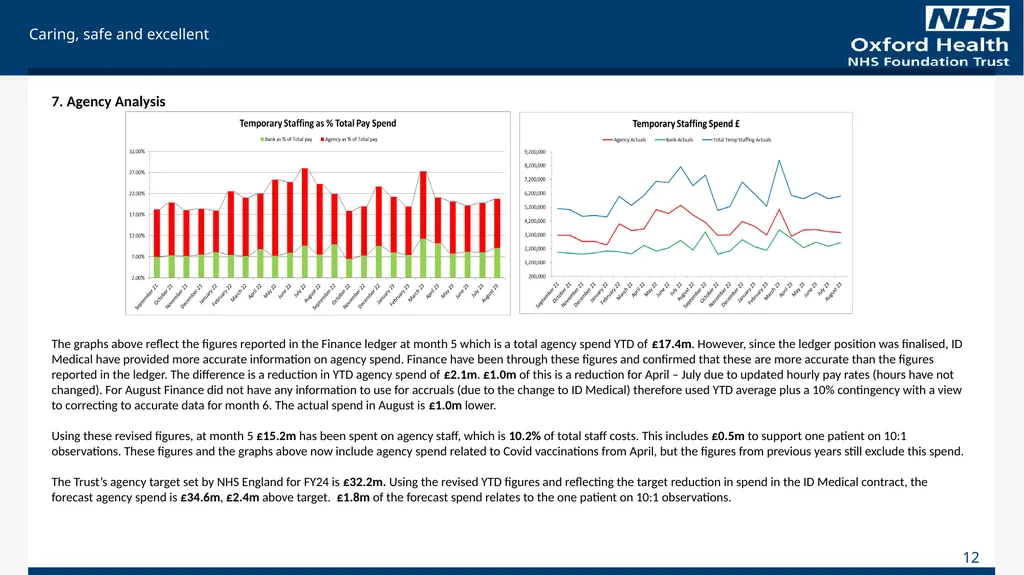
7. Agency Analysis The graphs above reflect the figures reported in the Finance ledger at month 5 which is a total agency spend YTD of £17.4m. However, since the ledger position was finalised, ID Medical have provided more accurate information on agency spend. Finance have been through these figures and confirmed that these are more accurate than the figures reported in the ledger. The difference is a reduction in YTD agency spend of £2.1m. £1.0m of this is a reduction for April – July due to updated hourly pay rates (hours have not changed). For August Finance did not have any information to use for accruals (due to the change to ID Medical) therefore used YTD average plus a 10% contingency with a view to correcting to accurate data for month 6. The actual spend in August is £1.0m lower.
Using these revised figures, at month 5 £15.2m has been spent on agency staff, which is 10.2% of total staff costs. This includes £0.5m to support one patient on 10:1 observations. These figures and the graphs above now include agency spend related to Covid vaccinations from April, but the figures from previous years still exclude this spend.
The Trust’s agency target set by NHS England for FY24 is £32.2m. Using the revised YTD figures and reflecting the target reduction in spend in the ID Medical contract, the forecast agency spend is £34.6m, £2.4m above target. £1.8m of the forecast spend relates to the one patient on 10:1 observations. 12<br>
Using these revised figures, at month 5 £15.2m has been spent on agency staff, which is 10.2% of total staff costs. This includes £0.5m to support one patient on 10:1 observations. These figures and the graphs above now include agency spend related to Covid vaccinations from April, but the figures from previous years still exclude this spend.
The Trust’s agency target set by NHS England for FY24 is £32.2m. Using the revised YTD figures and reflecting the target reduction in spend in the ID Medical contract, the forecast agency spend is £34.6m, £2.4m above target. £1.8m of the forecast spend relates to the one patient on 10:1 observations. 12<br>
13
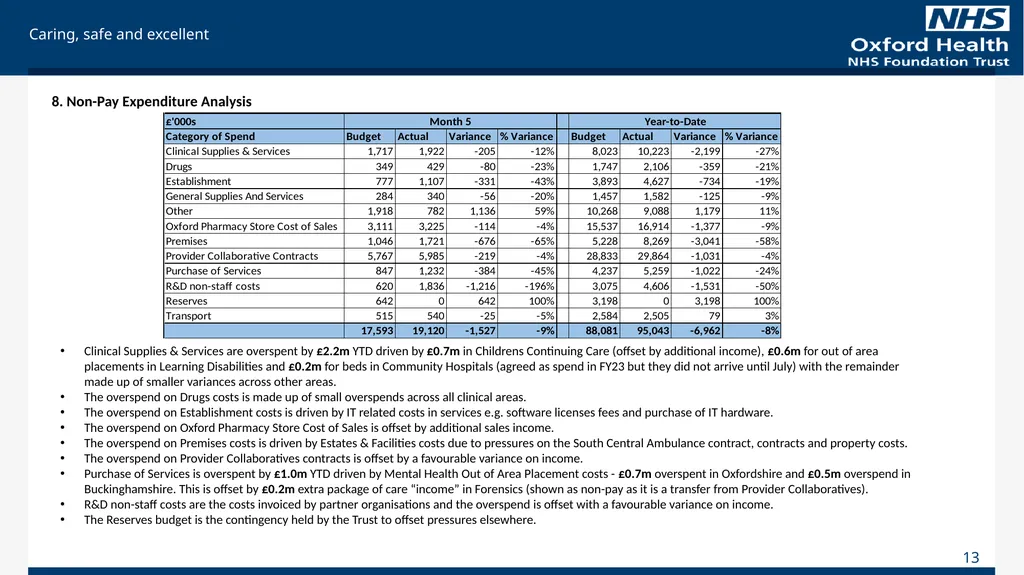
13 8. Non-Pay Expenditure Analysis Clinical Supplies & Services are overspent by £2.2m YTD driven by £0.7m in Childrens Continuing Care (offset by additional income), £0.6m for out of area placements in Learning Disabilities and £0.2m for beds in Community Hospitals (agreed as spend in FY23 but they did not arrive until July) with the remainder made up of smaller variances across other areas.
The overspend on Drugs costs is made up of small overspends across all clinical areas.
The overspend on Establishment costs is driven by IT related costs in services e.g. software licenses fees and purchase of IT hardware.
The overspend on Oxford Pharmacy Store Cost of Sales is offset by additional sales income.
The overspend on Premises costs is driven by Estates & Facilities costs due to pressures on the South Central Ambulance contract, contracts and property costs.
The overspend on Provider Collaboratives contracts is offset by a favourable variance on income.
Purchase of Services is overspent by £1.0m YTD driven by Mental Health Out of Area Placement costs - £0.7m overspent in Oxfordshire and £0.5m overspend in Buckinghamshire. This is offset by £0.2m extra package of care “income” in Forensics (shown as non-pay as it is a transfer from Provider Collaboratives).
R&D non-staff costs are the costs invoiced by partner organisations and the overspend is offset with a favourable variance on income.
The Reserves budget is the contingency held by the Trust to offset pressures elsewhere.<br>
The overspend on Drugs costs is made up of small overspends across all clinical areas.
The overspend on Establishment costs is driven by IT related costs in services e.g. software licenses fees and purchase of IT hardware.
The overspend on Oxford Pharmacy Store Cost of Sales is offset by additional sales income.
The overspend on Premises costs is driven by Estates & Facilities costs due to pressures on the South Central Ambulance contract, contracts and property costs.
The overspend on Provider Collaboratives contracts is offset by a favourable variance on income.
Purchase of Services is overspent by £1.0m YTD driven by Mental Health Out of Area Placement costs - £0.7m overspent in Oxfordshire and £0.5m overspend in Buckinghamshire. This is offset by £0.2m extra package of care “income” in Forensics (shown as non-pay as it is a transfer from Provider Collaboratives).
R&D non-staff costs are the costs invoiced by partner organisations and the overspend is offset with a favourable variance on income.
The Reserves budget is the contingency held by the Trust to offset pressures elsewhere.<br>
14
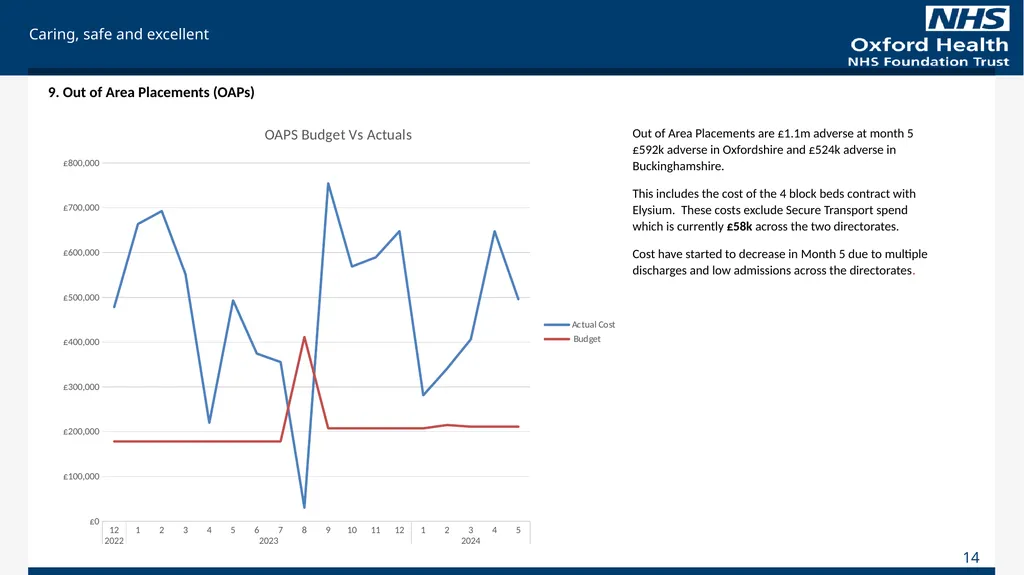
9. Out of Area Placements (OAPs) Out of Area Placements are £1.1m adverse at month 5 £592k adverse in Oxfordshire and £524k adverse in Buckinghamshire.
This includes the cost of the 4 block beds contract with Elysium. These costs exclude Secure Transport spend which is currently £58k across the two directorates.
Cost have started to decrease in Month 5 due to multiple discharges and low admissions across the directorates. 14<br>
This includes the cost of the 4 block beds contract with Elysium. These costs exclude Secure Transport spend which is currently £58k across the two directorates.
Cost have started to decrease in Month 5 due to multiple discharges and low admissions across the directorates. 14<br>
15
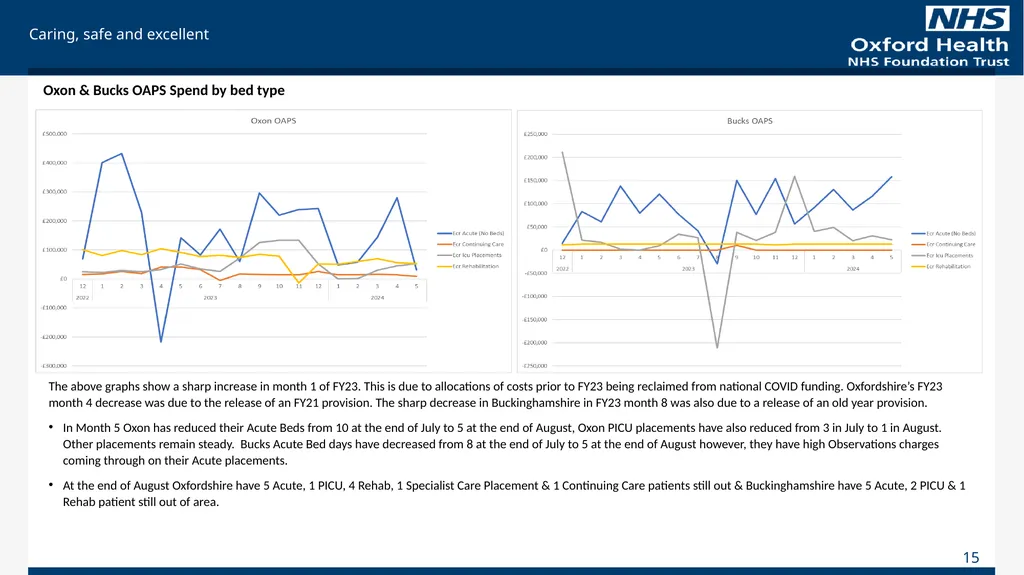
Oxon & Bucks OAPS Spend by bed type The above graphs show a sharp increase in month 1 of FY23. This is due to allocations of costs prior to FY23 being reclaimed from national COVID funding. Oxfordshire’s FY23 month 4 decrease was due to the release of an FY21 provision. The sharp decrease in Buckinghamshire in FY23 month 8 was also due to a release of an old year provision.
In Month 5 Oxon has reduced their Acute Beds from 10 at the end of July to 5 at the end of August, Oxon PICU placements have also reduced from 3 in July to 1 in August. Other placements remain steady. Bucks Acute Bed days have decreased from 8 at the end of July to 5 at the end of August however, they have high Observations charges coming through on their Acute placements.
At the end of August Oxfordshire have 5 Acute, 1 PICU, 4 Rehab, 1 Specialist Care Placement & 1 Continuing Care patients still out & Buckinghamshire have 5 Acute, 2 PICU & 1 Rehab patient still out of area. 15<br>
In Month 5 Oxon has reduced their Acute Beds from 10 at the end of July to 5 at the end of August, Oxon PICU placements have also reduced from 3 in July to 1 in August. Other placements remain steady. Bucks Acute Bed days have decreased from 8 at the end of July to 5 at the end of August however, they have high Observations charges coming through on their Acute placements.
At the end of August Oxfordshire have 5 Acute, 1 PICU, 4 Rehab, 1 Specialist Care Placement & 1 Continuing Care patients still out & Buckinghamshire have 5 Acute, 2 PICU & 1 Rehab patient still out of area. 15<br>
16
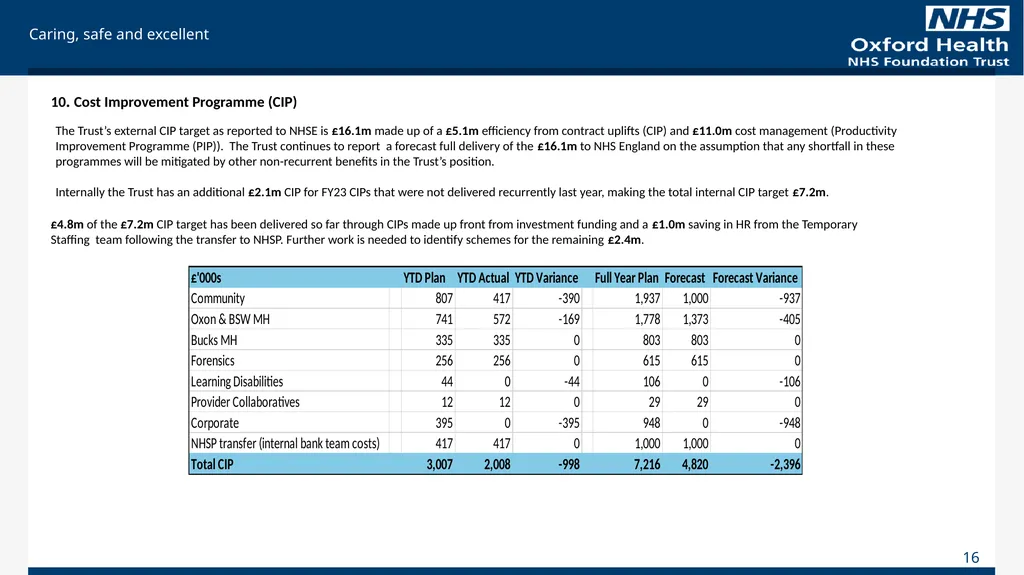
10. Cost Improvement Programme (CIP) 16 The Trust’s external CIP target as reported to NHSE is £16.1m made up of a £5.1m efficiency from contract uplifts (CIP) and £11.0m cost management (Productivity Improvement Programme (PIP)). The Trust continues to report a forecast full delivery of the £16.1m to NHS England on the assumption that any shortfall in these programmes will be mitigated by other non-recurrent benefits in the Trust’s position.
Internally the Trust has an additional £2.1m CIP for FY23 CIPs that were not delivered recurrently last year, making the total internal CIP target £7.2m. £4.8m of the £7.2m CIP target has been delivered so far through CIPs made up front from investment funding and a £1.0m saving in HR from the Temporary Staffing team following the transfer to NHSP. Further work is needed to identify schemes for the remaining £2.4m.<br>
Internally the Trust has an additional £2.1m CIP for FY23 CIPs that were not delivered recurrently last year, making the total internal CIP target £7.2m. £4.8m of the £7.2m CIP target has been delivered so far through CIPs made up front from investment funding and a £1.0m saving in HR from the Temporary Staffing team following the transfer to NHSP. Further work is needed to identify schemes for the remaining £2.4m.<br>
17
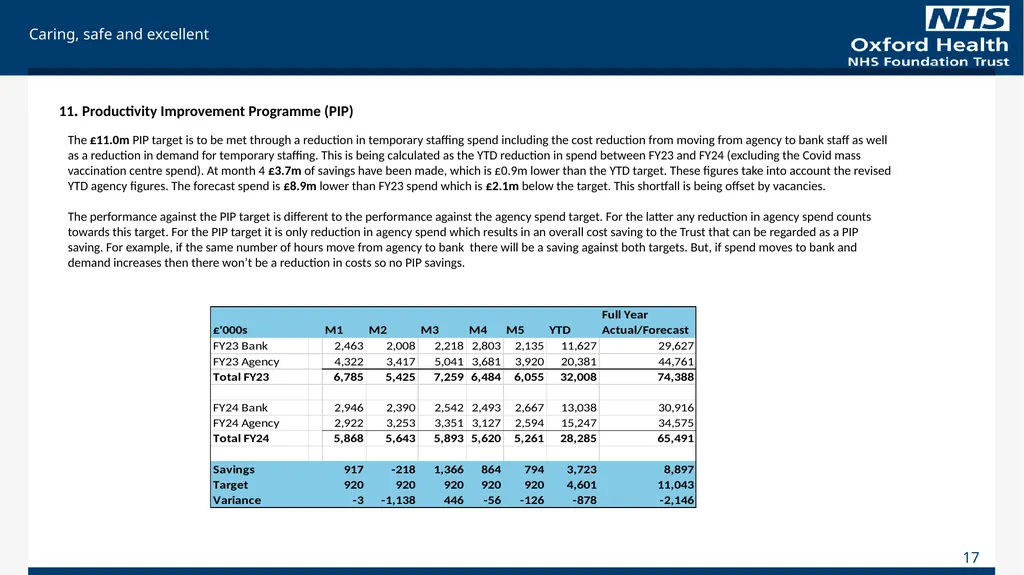
17 11. Productivity Improvement Programme (PIP) The £11.0m PIP target is to be met through a reduction in temporary staffing spend including the cost reduction from moving from agency to bank staff as well as a reduction in demand for temporary staffing. This is being calculated as the YTD reduction in spend between FY23 and FY24 (excluding the Covid mass vaccination centre spend). At month 4 £3.7m of savings have been made, which is £0.9m lower than the YTD target. These figures take into account the revised YTD agency figures. The forecast spend is £8.9m lower than FY23 spend which is £2.1m below the target. This shortfall is being offset by vacancies.
The performance against the PIP target is different to the performance against the agency spend target. For the latter any reduction in agency spend counts towards this target. For the PIP target it is only reduction in agency spend which results in an overall cost saving to the Trust that can be regarded as a PIP saving. For example, if the same number of hours move from agency to bank there will be a saving against both targets. But, if spend moves to bank and demand increases then there won’t be a reduction in costs so no PIP savings.<br>
The performance against the PIP target is different to the performance against the agency spend target. For the latter any reduction in agency spend counts towards this target. For the PIP target it is only reduction in agency spend which results in an overall cost saving to the Trust that can be regarded as a PIP saving. For example, if the same number of hours move from agency to bank there will be a saving against both targets. But, if spend moves to bank and demand increases then there won’t be a reduction in costs so no PIP savings.<br>
18
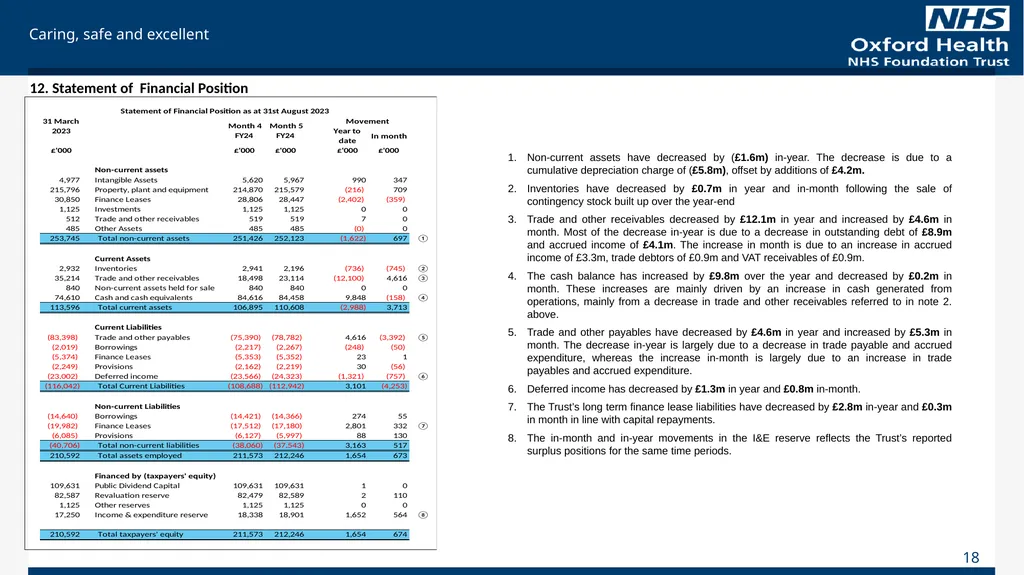
12. Statement of Financial Position Non-current assets have decreased by (£1.6m) in-year. The decrease is due to a cumulative depreciation charge of (£5.8m), offset by additions of £4.2m.
Inventories have decreased by £0.7m in year and in-month following the sale of contingency stock built up over the year-end
Trade and other receivables decreased by £12.1m in year and increased by £4.6m in month. Most of the decrease in-year is due to a decrease in outstanding debt of £8.9m and accrued income of £4.1m. The increase in month is due to an increase in accrued income of £3.3m, trade debtors of £0.9m and VAT receivables of £0.9m.
The cash balance has increased by £9.8m over the year and decreased by £0.2m in month. These increases are mainly driven by an increase in cash generated from operations, mainly from a decrease in trade and other receivables referred to in note 2. above.
Trade and other payables have decreased by £4.6m in year and increased by £5.3m in month. The decrease in-year is largely due to a decrease in trade payable and accrued expenditure, whereas the increase in-month is largely due to an increase in trade payables and accrued expenditure.
Deferred income has decreased by £1.3m in year and £0.8m in-month.
The Trust’s long term finance lease liabilities have decreased by £2.8m in-year and £0.3m in month in line with capital repayments.
The in-month and in-year movements in the I&E reserve reflects the Trust’s reported surplus positions for the same time periods. 18<br>
Inventories have decreased by £0.7m in year and in-month following the sale of contingency stock built up over the year-end
Trade and other receivables decreased by £12.1m in year and increased by £4.6m in month. Most of the decrease in-year is due to a decrease in outstanding debt of £8.9m and accrued income of £4.1m. The increase in month is due to an increase in accrued income of £3.3m, trade debtors of £0.9m and VAT receivables of £0.9m.
The cash balance has increased by £9.8m over the year and decreased by £0.2m in month. These increases are mainly driven by an increase in cash generated from operations, mainly from a decrease in trade and other receivables referred to in note 2. above.
Trade and other payables have decreased by £4.6m in year and increased by £5.3m in month. The decrease in-year is largely due to a decrease in trade payable and accrued expenditure, whereas the increase in-month is largely due to an increase in trade payables and accrued expenditure.
Deferred income has decreased by £1.3m in year and £0.8m in-month.
The Trust’s long term finance lease liabilities have decreased by £2.8m in-year and £0.3m in month in line with capital repayments.
The in-month and in-year movements in the I&E reserve reflects the Trust’s reported surplus positions for the same time periods. 18<br>
19
13. Cash Flow Summary Notes
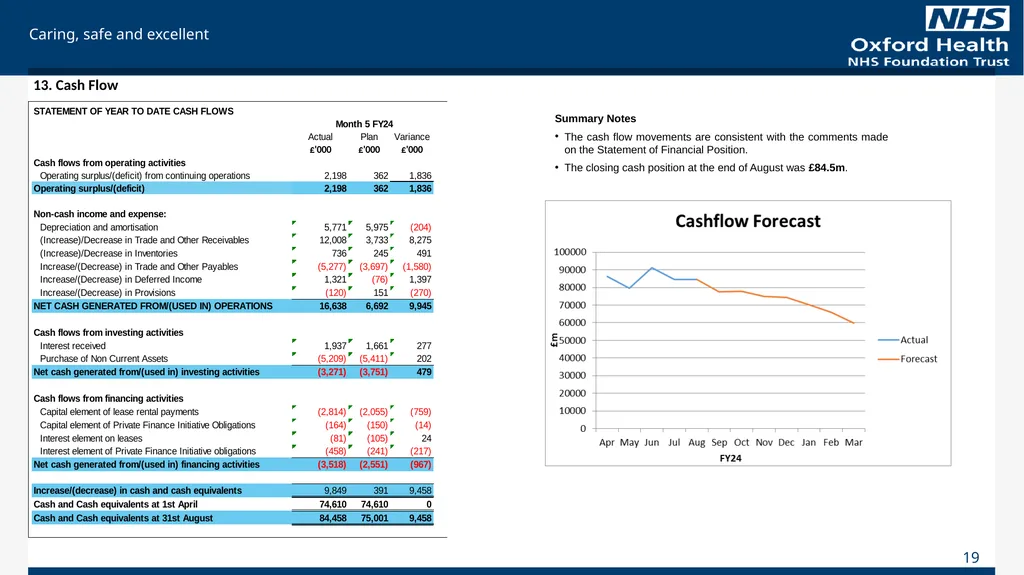
The cash flow movements are consistent with the comments made on the Statement of Financial Position.
The closing cash position at the end of August was £84.5m. 19<br>
The cash flow movements are consistent with the comments made on the Statement of Financial Position.
The closing cash position at the end of August was £84.5m. 19<br>
20
14. Working Capital Indicators Summary Notes
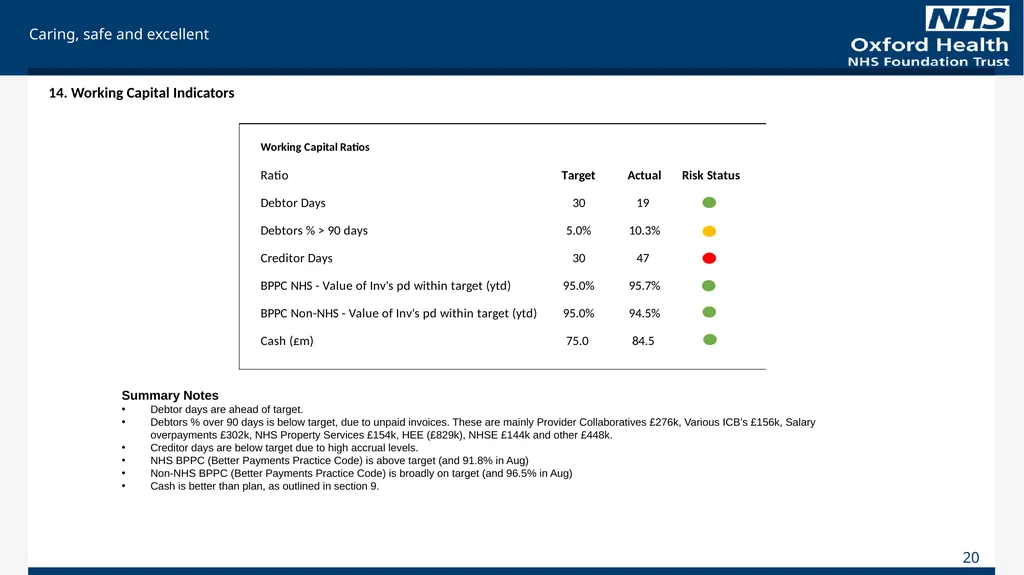
Debtor days are ahead of target.
Debtors % over 90 days is below target, due to unpaid invoices. These are mainly Provider Collaboratives £276k, Various ICB’s £156k, Salary overpayments £302k, NHS Property Services £154k, HEE (£829k), NHSE £144k and other £448k.
Creditor days are below target due to high accrual levels.
NHS BPPC (Better Payments Practice Code) is above target (and 91.8% in Aug)
Non-NHS BPPC (Better Payments Practice Code) is broadly on target (and 96.5% in Aug)
Cash is better than plan, as outlined in section 9. 20<br>
Debtor days are ahead of target.
Debtors % over 90 days is below target, due to unpaid invoices. These are mainly Provider Collaboratives £276k, Various ICB’s £156k, Salary overpayments £302k, NHS Property Services £154k, HEE (£829k), NHSE £144k and other £448k.
Creditor days are below target due to high accrual levels.
NHS BPPC (Better Payments Practice Code) is above target (and 91.8% in Aug)
Non-NHS BPPC (Better Payments Practice Code) is broadly on target (and 96.5% in Aug)
Cash is better than plan, as outlined in section 9. 20<br>