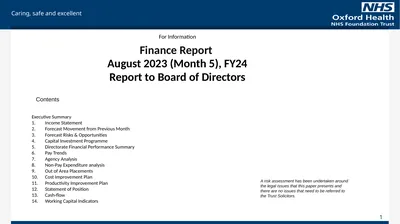
For Information Finance Report May 2023 (Month 2),

Published  . 0 views
↓ Download
For Information Finance Report May 2023 (Month 2),
1 / 1
For Information Finance Report May 2023 (Month 2), - slide 1 of 17 For Information Finance Report May 2023 (Month 2), - slide 2 of 17 For Information Finance Report May 2023 (Month 2), - slide 3 of 17 For Information Finance Report May 2023 (Month 2), - slide 4 of 17 For Information Finance Report May 2023 (Month 2), - slide 5 of 17 For Information Finance Report May 2023 (Month 2), - slide 6 of 17 For Information Finance Report May 2023 (Month 2), - slide 7 of 17 For Information Finance Report May 2023 (Month 2), - slide 8 of 17 For Information Finance Report May 2023 (Month 2), - slide 9 of 17 For Information Finance Report May 2023 (Month 2), - slide 10 of 17 For Information Finance Report May 2023 (Month 2), - slide 11 of 17 For Information Finance Report May 2023 (Month 2), - slide 12 of 17 For Information Finance Report May 2023 (Month 2), - slide 13 of 17 For Information Finance Report May 2023 (Month 2), - slide 14 of 17 For Information Finance Report May 2023 (Month 2), - slide 15 of 17 For Information Finance Report May 2023 (Month 2), - slide 16 of 17 For Information Finance Report May 2023 (Month 2), - slide 17 of 17
Description: For Information Finance Report May 2023 (Month 2), FY24 Report to Board of Directors Executive Summary Income Statement Capital Investment Programme Directorate Financial Performance Summary Pay Trends Agency Analysis Cost Improvement Plan

Related Topics

Download Presentation

"For Information Finance Report May 2023 (Month 2)," is the property of its rightful owner. Permission is granted to download and print the materials on this website for personal, non-commercial use only, and to display it on your personal computer provided you do not modify the materials and that you retain all copyright notices contained in the materials. By downloading content from our website, you accept the terms of this agreement.

Presentation Transcript

slide1. For Information

Finance Report
May 2023 (Month 2), FY24
Report to Board of Directors Executive Summary
Income Statement
Capital Investment Programme
Directorate Financial Performance Summary
Pay Trends
Agency Analysis
Cost Improvement Plan
Productivity Improvement Plan
Out of Area Placements
Statement of Position
Cash-flow
Working Capital Indicators Contents A risk assessment has been undertaken around the legal issues that this paper presents and there are no issues that need to be referred to the Trust Solicitors. 1<br>
slide2. 2 Executive Summary Highlights:
The month 2 Income and Expenditure YTD position is a surplus of £0.7m, £0.2m favourable to plan.
This includes a £0.3m YTD cost pressure from the 5% Agenda for Change pay award (more details on page 3).
Significant adverse variances are reported in:
Buckinghamshire Mental Health £0.9m
Forensic Mental Health £0.5m
Community £0.4m
At month 2 £6.7m has been spent on agency staff, which is 11.0% of total staff costs.
The Trust has a total savings target of £18.3m for the year (CIP & PIP). £1.0m has been saved YTD which is £2.0m adverse to plan and the forecast is £15.9m, £2.4m adverse to plan.
Capital expenditure is showing a small overspend YTD.
Cash remains strong with a cash balance of £79.9m.
A full year forecast is not produced at month 2, however two risks and issues against our full year plan have been flagged to the ICS and NHSE, which are £2.1m due to underfunding of the Agenda for Change pay award and £2.9m of income from BOB ICS which has yet to be confirmed. Income & Expenditure position
YTD - £0.2m better than plan Capital Expenditure
YTD - £83k overspent Cash
Actual £79.9m<br>
slide3. Month 2 Performance

The month 2 YTD position is a surplus of £0.7m, £0.2m favourable to plan.

The 5% pay award for Agenda for Change Staff has been accrued at month 2 along with additional income for this. Budget has not been set for this so this accounts for £1.5m of the adverse variance on expenditure and £1.2m of the favourable variance on income. The £0.3m difference is the cost pressure at month 2 from the pay award as the income the Trust is receiving does not cover all costs. This equates to an annual pressure of £2.1m which on a budgeted basis is more than this due to vacancies (this figure has still to be calculated). The Finance team are working with Berkshire Healthcare to argue with NHSE and the BOB ICS that mental health and community providers should receive a higher share of the income due to a higher proportion of pay costs and a higher proportion of Agenda for Change staff than acute providers.

The remaining favourable variance on income (£2.3m) is made up of £0.7m for education and training income in clinical directorates where budget needs to be set, £0.6m higher sales in Oxford Pharmacy Store, £0.4m in Learning and Development, £0.3m in the Institute of Clinical Psychology Training and £0.3m for various projects in the Nursing & Clinical Standards directorate.

The remaining adverse variance on expenditure (£2.8m) is made up of £1.8m on pay due to the use of agency staff, £0.6m higher cost of sales in Oxford Pharmacy Store and £0.4m in Learning and Development (offset with additional income). 1. Income Statement 3<br>
slide4. 2. Capital Investment Programme The Trust spent £1,661k on its capital programme in the first 2 months of the year against a year-to date expenditure budget of £1,579k, an overspend of £83k.

The Trust has a forecast outturn of £17,695k, which represents a £23k underspend against the capital expenditure plan.

From a funding perspective, the Trust has £17,024k available in FY24, a funding deficit of £694k against the FY24 capital programme. 4<br>
slide5. 5 3. Directorate Financial Performance Summary Block contract income is now reported in a separate directorate. Clinical Directorate positions now reflect the expenditure position less non-clinical income (mainly Education & Training income) and some specific income streams such as Sustainability & Development Funding (SDF.)

The Covid vaccination programme is now reported under the Community Services Directorate. There are some small costs still being reported with the Covid-19 Costs directorate, but these will move to Corporate in month 3.

The 5% pay award expenditure is within Reserves and the income associated with this is shown in Block income.<br>
slide6. 4. Pay Trends The increase in pay costs and budget in September 2021 and September 2022 reflect when the pay award was paid to staff along with back pay.
The increased costs in March 2022 reflect year-end accounting adjustments for pension costs
The increase in costs in March 2023 again reflect year-end accounting adjustments for pension costs and also an accrual for the government proposed back-dated non-consolidated pay award. 6<br>
slide7. 7<br>
slide8. 8<br>
slide9. 9<br>
slide10. 5. Agency Analysis At month 2 £6.7m has been spent on agency staff, which is 11.0% of total staff costs. These figures and the graphs above now include agency spend related to Covid vaccinations from April, but the figures from previous years still exclude this spend.

The accruals for March and April are based on actual hours worked but rates were not available on the data provided by NHSP. Average rates per type of shift and worker were used and actual costs could vary from this. The rates are now correct in the NHSP system and May’s data reflects this. Finance are waiting for updated data from NHSP and will reflect any changes to the March and April amounts in the month 3 position.

The Trust’s agency target set by NHS England for FY24 is £32.2m. A straight line forecast of the month 2 amount would give a forecast of £40.2m, £8.0m above the target.

In a recent meeting with NHS England around the Trust’s financial plans for FY24 the Trust’s high agency spend and being an outlier in this area were raised as the main area of concern with the Trust’s financial performance. It is expected that the transfer to NHS Professionals and other initiatives from the Improving Quality Reducing Agency (IQRA) will reduce agency costs in FY24. In addition, further agency controls are being introduced to ensure these costs reduce over the year. 10<br>
slide11. 6. Cost Improvement Programme (CIP) 11 The Trust’s external CIP target as reported to NHSE is £16.1m made up of a £5.1m efficiency from contract uplifts (CIP) and £11.0m cost management (Productivity Improvement Programme (PIP)).

Internally the Trust has an additional £2.1m CIP for FY23 CIPs that were not delivered recurrently last year, making the total internal CIP target £7.2m. £4.8m of the £7.2m CIP target has been delivered so far through CIPs made up front from investment funding and a £1.0m saving in HR from the bank team following the transfer to NHSP. Further work is needed to identify schemes for the remaining £2.4m.<br>
slide12. 12 7. Productivity Improvement Programme (PIP) The £11.0m PIP target is to be met through a reduction in temporary staffing spend including the cost reduction from moving from agency to bank staff as well as a reduction in demand for temporary staffing. This is being calculated as the YTD reduction in spend between FY23 and FY24. At month 2 £0.2m has been delivered which is £1.6m below target. Actions are being put in place, including the new agency controls, to ensure the target is met by the end of the year.<br>
slide13. 8. Out of Area Placements (OAPs) Out of Area Placements are £200k adverse at month 2 £24k adverse in Oxfordshire and £176k adverse in Buckinghamshire.
This includes the cost of the 4 block beds contract with Elysium. These costs exclude Secure Transport spend which is currently £37k across the two directorates.
Costs have increased in month 2 due to increase in Acute admissions across both directorates and a new specialist care placement in Oxfordshire. 13<br>
slide14. Oxon & Bucks OAPS Spend by bed type The above graphs show a sharp increase in month 1 of FY23. This is due to allocations of costs prior to FY23 being reclaimed from national COVID funding. Oxfordshire’s month 4 decrease was due to the release of an FY21 provision. The sharp decrease in Buckinghamshire in month 8 was also due to a release of an old year provision.
The month 1 FY24 decrease is due to low new admissions and multiple discharges across the counties with a slight rise in Buckinghamshire against Acute beds. The month 2 increase is due to increased admissions across both directorates for Acute beds & high observation charges.
At the end of May Oxfordshire have 6 Acute, 4 Rehab, 1 Specialist Care Placement & 1 Continuing Care patients still out & Buckinghamshire have 4 Acute, 2 PICU & 1 Rehab patient still out of area. 14<br>
slide15. 9. Statement of Financial Position Non-current assets have decreased by (£0.6m) in-year. The decrease is due to a cumulative depreciation charge of (£2.2m), offset by additions of £1.6m.
Trade and other receivables increased by £7.9m in month, mostly due to an increase in accrued income, and decreased by (£0.6m) in year. The decrease in year is due to a decrease in outstanding debt of (£9.0m) that is offset by a net increase in other receivables of £8.4m, of which £7.8m related to accrued income.
The cash balance has increased by £5m over the year and decreased by £6.5m in month. The year-to-date increase is driven by an increase in cash generated from operations (mainly working capital), outflows against investing activities (capital expenditure) and capital repayments against leased assets – see section 9.
Trade and other payables have increased by (£2.3m) in year, due largely to an increase in accrued expenditure.
Deferred income has increased by (£1.5m) in year.
The Trust’s long term finance lease liabilities have decreased by £0.6m in-year as a result of capital repayments
The in-month and in-year movements in the I&E reserve reflects the Trust’s reported surplus positions for the same time periods. 15<br>
slide16. 10. Cash Flow Summary Notes
The cash flow movements are consistent with the comments made on the Statement of Financial Position.
The closing cash position at the end of May was £79.7m. 16<br>
slide17. 11. Working Capital Indicators Summary Notes
Debtor days are worse than target.
Debtors % over 90 days is worse than target, due to unpaid invoices. These are mainly NHS Property Services £154k (2.5%), OUH £76k (1.2%), Salary overpayments £283k (4.5%) and other £376k (6.0%).
Creditor days is worse than target due to high accrual levels and NHS BPPC figures below target. 
NHS BPPC (Better Payments Practice Code) is below target in-year and in-month (62.8%).
Non-NHS BPPC (Better Payments Practice Code) is on target.  
Cash is better than plan, as outlined in section 9. 17<br>