
FY25 Chapter 70 aid and Charter reimbursements
CS
Published · 28 slides · 0 views

1 / 1

Description
FY25 Chapter 70 aid and Charter reimbursements July 2024 FY25 Chapter 70 funding FY25 Chapter 70 is 6,901,918,685, a 309 million increase (4.7) over FY24 The SOA establishes new, higher foundation budget rates in 5 areas: Benefits and
Related Topics
Share
Embed code
Download this presentation From Below
"FY25 Chapter 70 aid and Charter reimbursements" is the property of its rightful owner. Permission is granted to download and print the materials on this website for personal, non-commercial use only, and to display it on your personal computer provided you do not modify the materials and that you retain all copyright notices contained in the materials. By downloading content from our website, you accept the terms of this agreement.
Presentation Transcript
01
FY25 Chapter 70 aid and Charter reimbursements July 2024<br>
02
FY25 Chapter 70 funding<br>
03
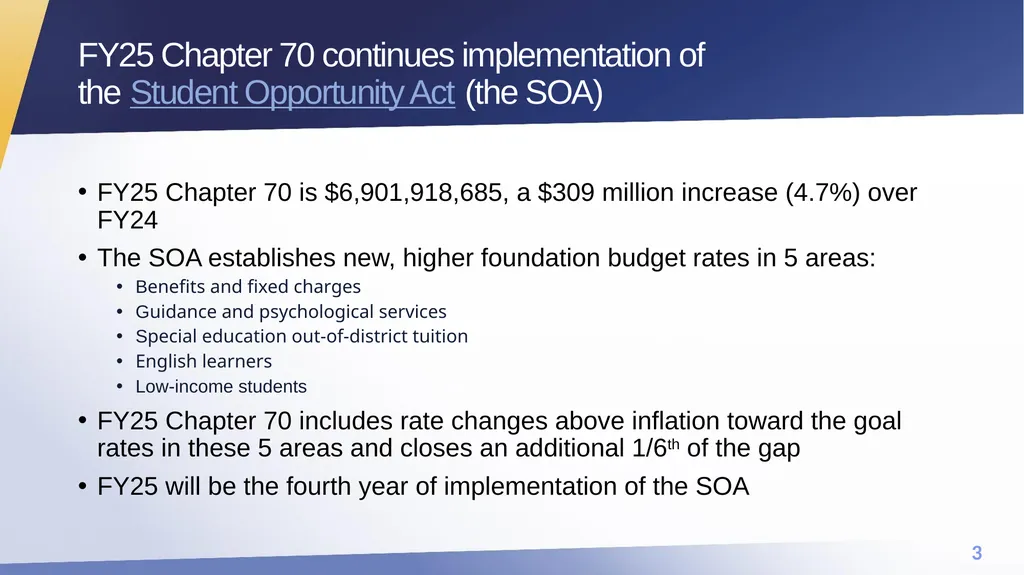
FY25 Chapter 70 is $6,901,918,685, a $309 million increase (4.7%) over FY24
The SOA establishes new, higher foundation budget rates in 5 areas:
Benefits and fixed charges
Guidance and psychological services
Special education out-of-district tuition
English learners
Low-income students
FY25 Chapter 70 includes rate changes above inflation toward the goal rates in these 5 areas and closes an additional 1/6th of the gap
FY25 will be the fourth year of implementation of the SOA FY25 Chapter 70 continues implementation of the Student Opportunity Act (the SOA)<br>
The SOA establishes new, higher foundation budget rates in 5 areas:
Benefits and fixed charges
Guidance and psychological services
Special education out-of-district tuition
English learners
Low-income students
FY25 Chapter 70 includes rate changes above inflation toward the goal rates in these 5 areas and closes an additional 1/6th of the gap
FY25 will be the fourth year of implementation of the SOA FY25 Chapter 70 continues implementation of the Student Opportunity Act (the SOA)<br>
04
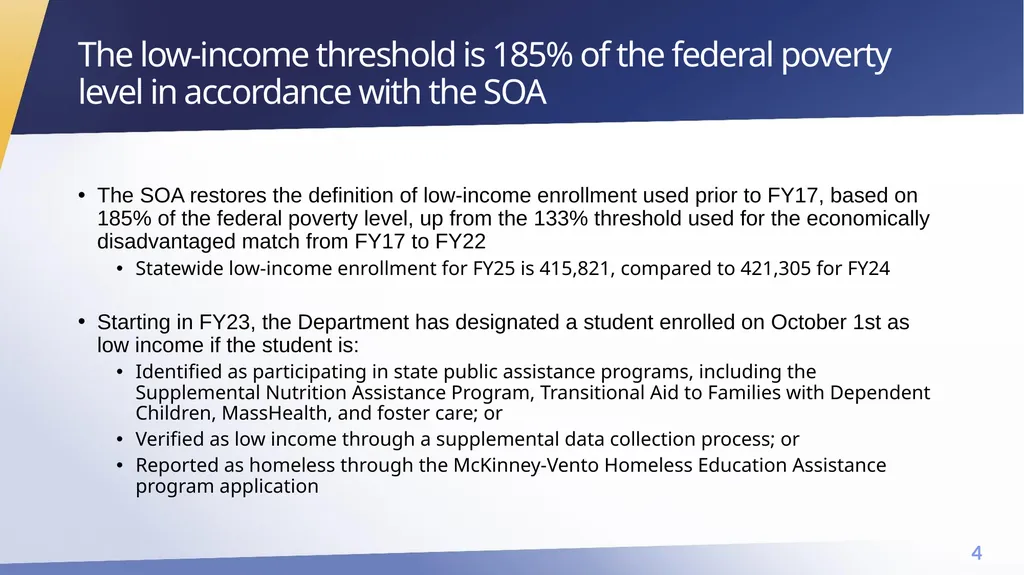
The SOA restores the definition of low-income enrollment used prior to FY17, based on 185% of the federal poverty level, up from the 133% threshold used for the economically disadvantaged match from FY17 to FY22
Statewide low-income enrollment for FY25 is 415,821, compared to 421,305 for FY24
Starting in FY23, the Department has designated a student enrolled on October 1st as low income if the student is:
Identified as participating in state public assistance programs, including the Supplemental Nutrition Assistance Program, Transitional Aid to Families with Dependent Children, MassHealth, and foster care; or
Verified as low income through a supplemental data collection process; or
Reported as homeless through the McKinney-Vento Homeless Education Assistance program application The low-income threshold is 185% of the federal poverty level in accordance with the SOA<br>
Statewide low-income enrollment for FY25 is 415,821, compared to 421,305 for FY24
Starting in FY23, the Department has designated a student enrolled on October 1st as low income if the student is:
Identified as participating in state public assistance programs, including the Supplemental Nutrition Assistance Program, Transitional Aid to Families with Dependent Children, MassHealth, and foster care; or
Verified as low income through a supplemental data collection process; or
Reported as homeless through the McKinney-Vento Homeless Education Assistance program application The low-income threshold is 185% of the federal poverty level in accordance with the SOA<br>
05
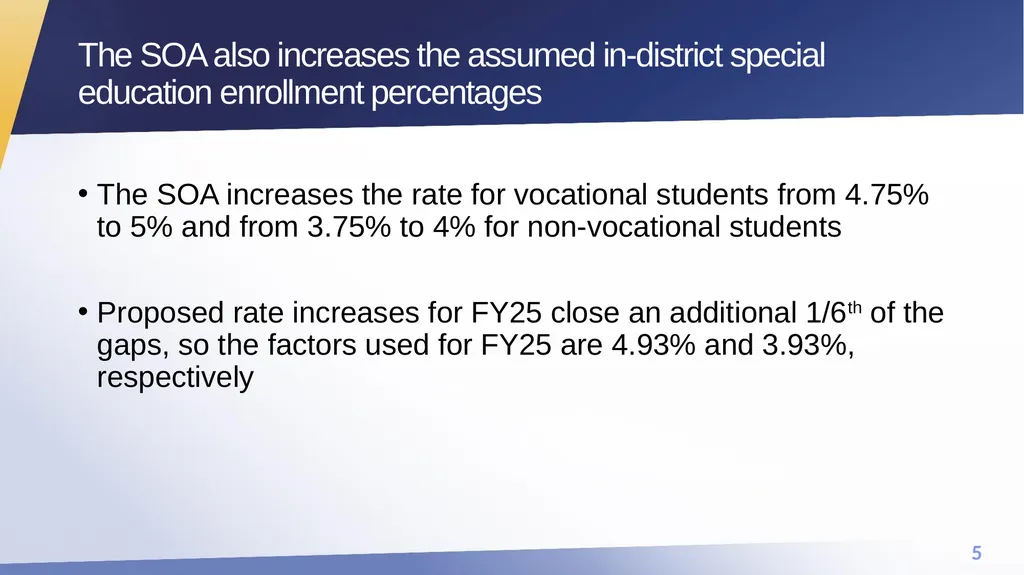
The SOA increases the rate for vocational students from 4.75% to 5% and from 3.75% to 4% for non-vocational students
Proposed rate increases for FY25 close an additional 1/6th of the gaps, so the factors used for FY25 are 4.93% and 3.93%, respectively The SOA also increases the assumed in-district special education enrollment percentages<br>
Proposed rate increases for FY25 close an additional 1/6th of the gaps, so the factors used for FY25 are 4.93% and 3.93%, respectively The SOA also increases the assumed in-district special education enrollment percentages<br>
06
An employee benefits inflation rate is applied to the employee benefits and fixed charges category
Based on the enrollment-weighted, three-year average premium increase for all GIC plans
For FY25 the increase is 5.03%
An inflation increase of 1.35% has been applied to all other foundation budget rates, based on the U.S. Department of Commerce’s state and local government price deflator On top of the targeted rate increases, all foundation budget categories have been adjusted upward for inflation<br>
Based on the enrollment-weighted, three-year average premium increase for all GIC plans
For FY25 the increase is 5.03%
An inflation increase of 1.35% has been applied to all other foundation budget rates, based on the U.S. Department of Commerce’s state and local government price deflator On top of the targeted rate increases, all foundation budget categories have been adjusted upward for inflation<br>
07
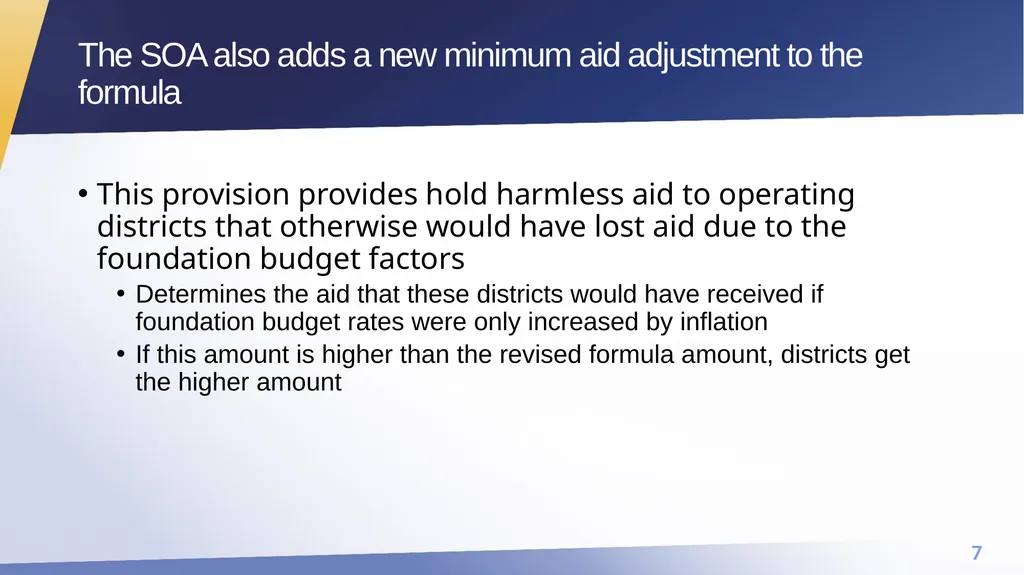
This provision provides hold harmless aid to operating districts that otherwise would have lost aid due to the foundation budget factors
Determines the aid that these districts would have received if foundation budget rates were only increased by inflation
If this amount is higher than the revised formula amount, districts get the higher amount The SOA also adds a new minimum aid adjustment to the formula<br>
Determines the aid that these districts would have received if foundation budget rates were only increased by inflation
If this amount is higher than the revised formula amount, districts get the higher amount The SOA also adds a new minimum aid adjustment to the formula<br>
08
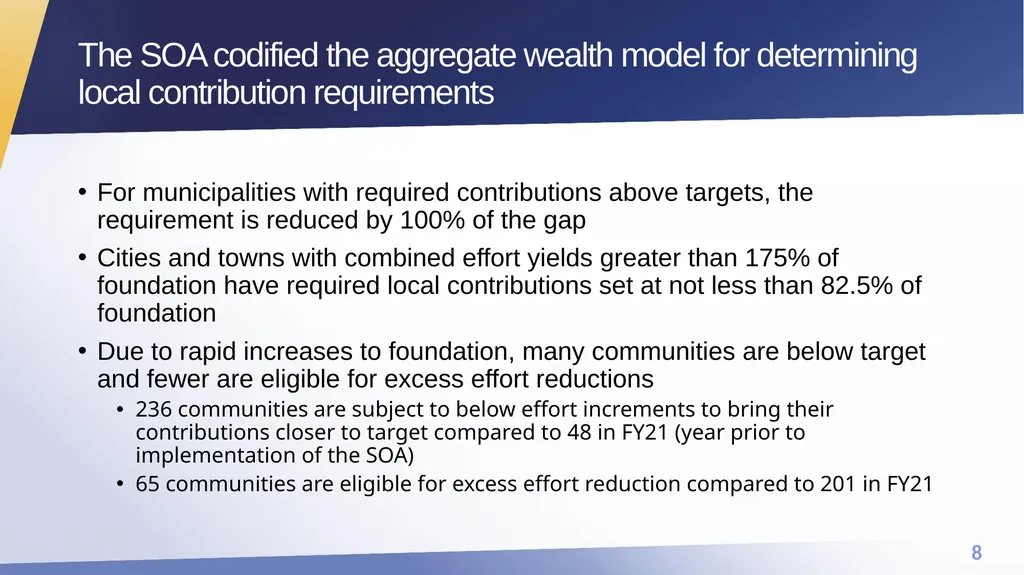
For municipalities with required contributions above targets, the requirement is reduced by 100% of the gap
Cities and towns with combined effort yields greater than 175% of foundation have required local contributions set at not less than 82.5% of foundation
Due to rapid increases to foundation, many communities are below target and fewer are eligible for excess effort reductions
236 communities are subject to below effort increments to bring their contributions closer to target compared to 48 in FY21 (year prior to implementation of the SOA)
65 communities are eligible for excess effort reduction compared to 201 in FY21 The SOA codified the aggregate wealth model for determining local contribution requirements<br>
Cities and towns with combined effort yields greater than 175% of foundation have required local contributions set at not less than 82.5% of foundation
Due to rapid increases to foundation, many communities are below target and fewer are eligible for excess effort reductions
236 communities are subject to below effort increments to bring their contributions closer to target compared to 48 in FY21 (year prior to implementation of the SOA)
65 communities are eligible for excess effort reduction compared to 201 in FY21 The SOA codified the aggregate wealth model for determining local contribution requirements<br>
09
Charter school tuition and reimbursements<br>
10
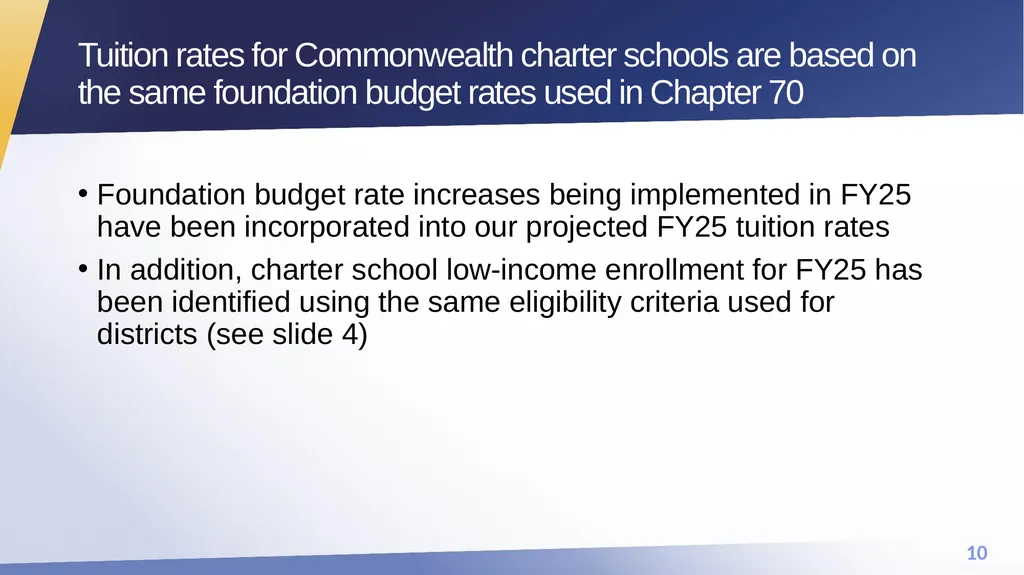
Foundation budget rate increases being implemented in FY25 have been incorporated into our projected FY25 tuition rates
In addition, charter school low-income enrollment for FY25 has been identified using the same eligibility criteria used for districts (see slide 4) Tuition rates for Commonwealth charter schools are based on the same foundation budget rates used in Chapter 70<br>
In addition, charter school low-income enrollment for FY25 has been identified using the same eligibility criteria used for districts (see slide 4) Tuition rates for Commonwealth charter schools are based on the same foundation budget rates used in Chapter 70<br>
11
Funding for first year reimbursements is prioritized over funding for second year reimbursements
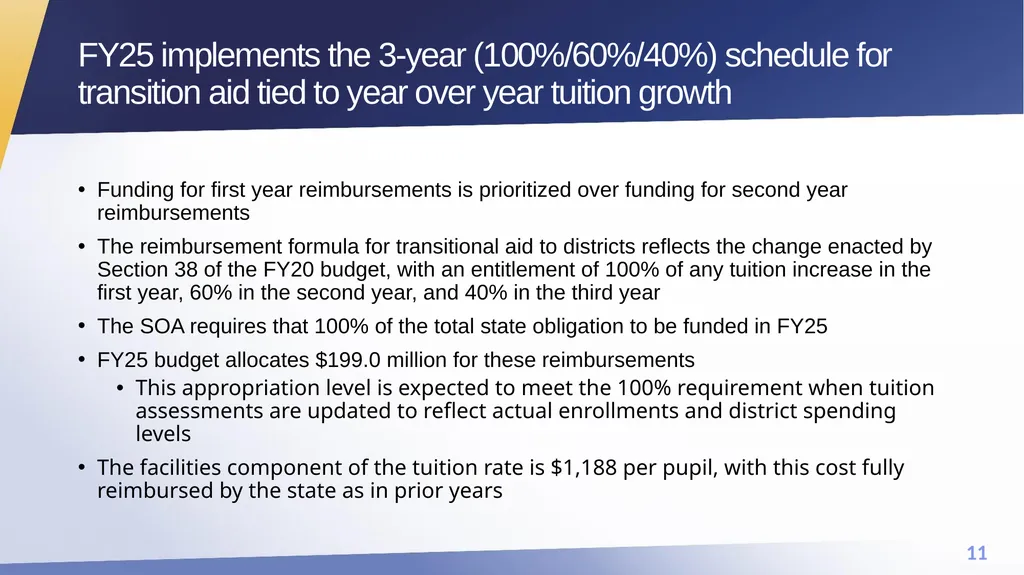
The reimbursement formula for transitional aid to districts reflects the change enacted by Section 38 of the FY20 budget, with an entitlement of 100% of any tuition increase in the first year, 60% in the second year, and 40% in the third year
The SOA requires that 100% of the total state obligation to be funded in FY25
FY25 budget allocates $199.0 million for these reimbursements
This appropriation level is expected to meet the 100% requirement when tuition assessments are updated to reflect actual enrollments and district spending levels
The facilities component of the tuition rate is $1,188 per pupil, with this cost fully reimbursed by the state as in prior years FY25 implements the 3-year (100%/60%/40%) schedule for transition aid tied to year over year tuition growth<br>
The reimbursement formula for transitional aid to districts reflects the change enacted by Section 38 of the FY20 budget, with an entitlement of 100% of any tuition increase in the first year, 60% in the second year, and 40% in the third year
The SOA requires that 100% of the total state obligation to be funded in FY25
FY25 budget allocates $199.0 million for these reimbursements
This appropriation level is expected to meet the 100% requirement when tuition assessments are updated to reflect actual enrollments and district spending levels
The facilities component of the tuition rate is $1,188 per pupil, with this cost fully reimbursed by the state as in prior years FY25 implements the 3-year (100%/60%/40%) schedule for transition aid tied to year over year tuition growth<br>
12
Calculating Chapter 70 local contribution requirements and state aid<br>
13
To ensure that every district has sufficient resources to meet its foundation budget spending level, through an equitable combination of local property taxes and state aid. Goal of the Chapter 70 formula<br>
14
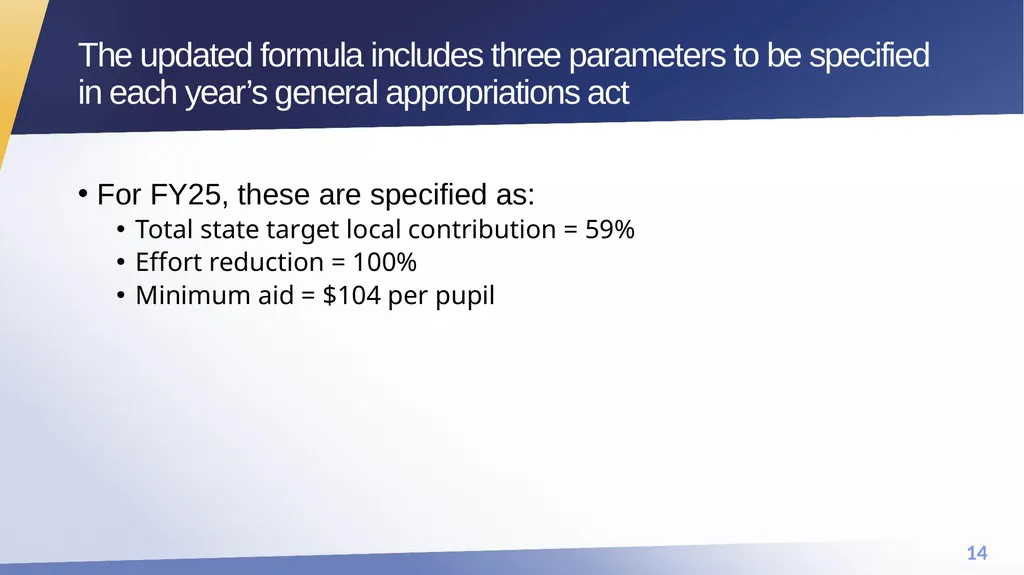
For FY25, these are specified as:
Total state target local contribution = 59%
Effort reduction = 100%
Minimum aid = $104 per pupil The updated formula includes three parameters to be specified in each year’s general appropriations act<br>
Total state target local contribution = 59%
Effort reduction = 100%
Minimum aid = $104 per pupil The updated formula includes three parameters to be specified in each year’s general appropriations act<br>
15
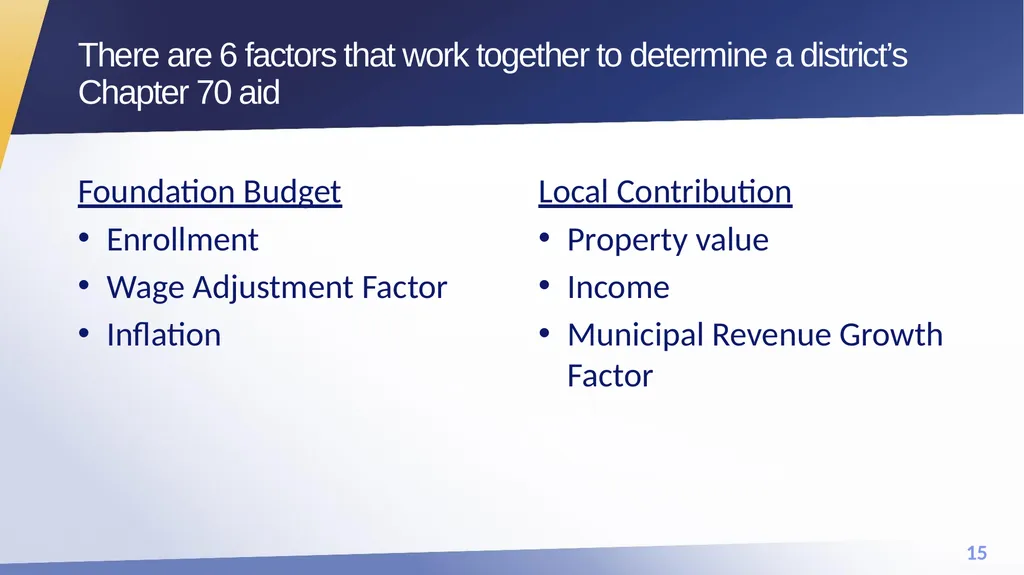
There are 6 factors that work together to determine a district’s Chapter 70 aid Foundation Budget
Enrollment
Wage Adjustment Factor
Inflation Local Contribution
Property value
Income
Municipal Revenue Growth Factor<br>
Enrollment
Wage Adjustment Factor
Inflation Local Contribution
Property value
Income
Municipal Revenue Growth Factor<br>
16
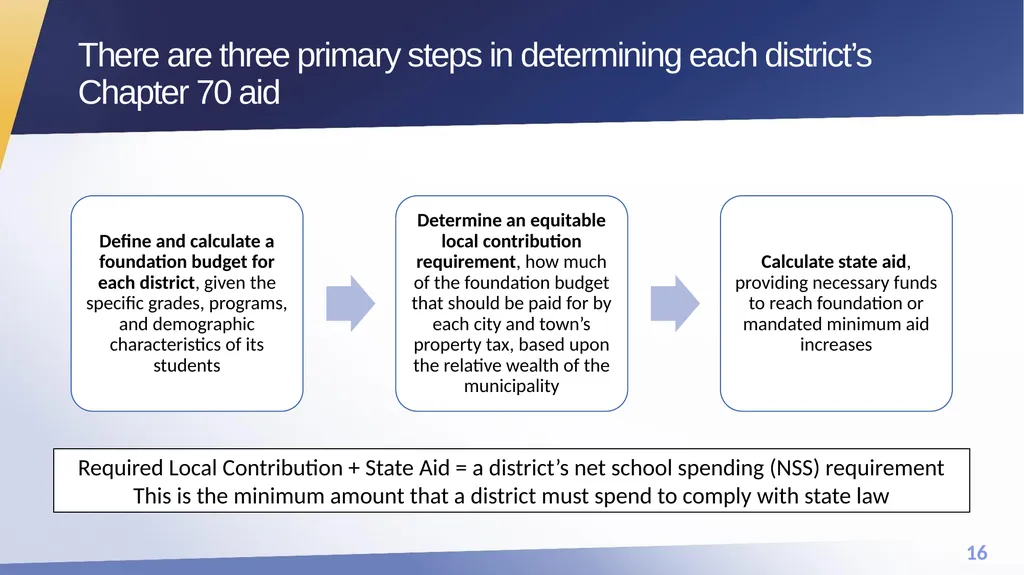
There are three primary steps in determining each district’s Chapter 70 aid Required Local Contribution + State Aid = a district’s net school spending (NSS) requirement
This is the minimum amount that a district must spend to comply with state law<br>
This is the minimum amount that a district must spend to comply with state law<br>
17
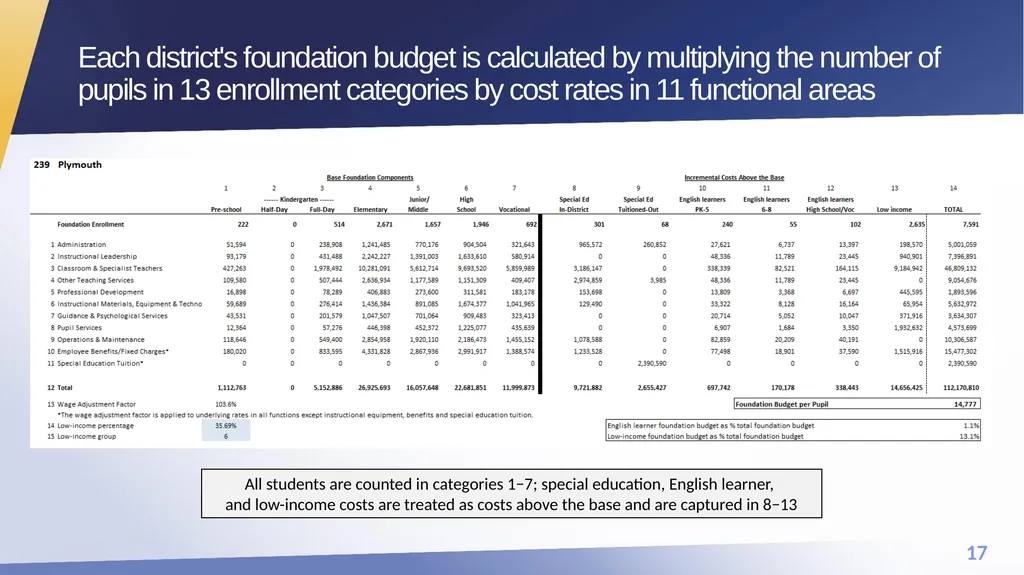
Each district's foundation budget is calculated by multiplying the number of pupils in 13 enrollment categories by cost rates in 11 functional areas All students are counted in categories 1−7; special education, English learner,
and low-income costs are treated as costs above the base and are captured in 8−13<br>
18
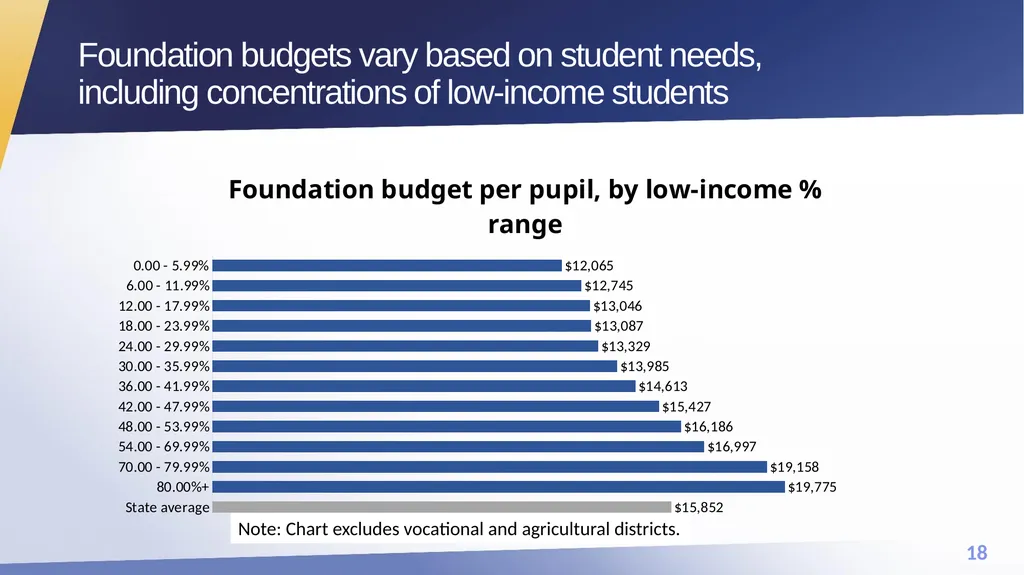
Foundation budgets vary based on student needs,
including concentrations of low-income students Note: Chart excludes vocational and agricultural districts.<br>
19
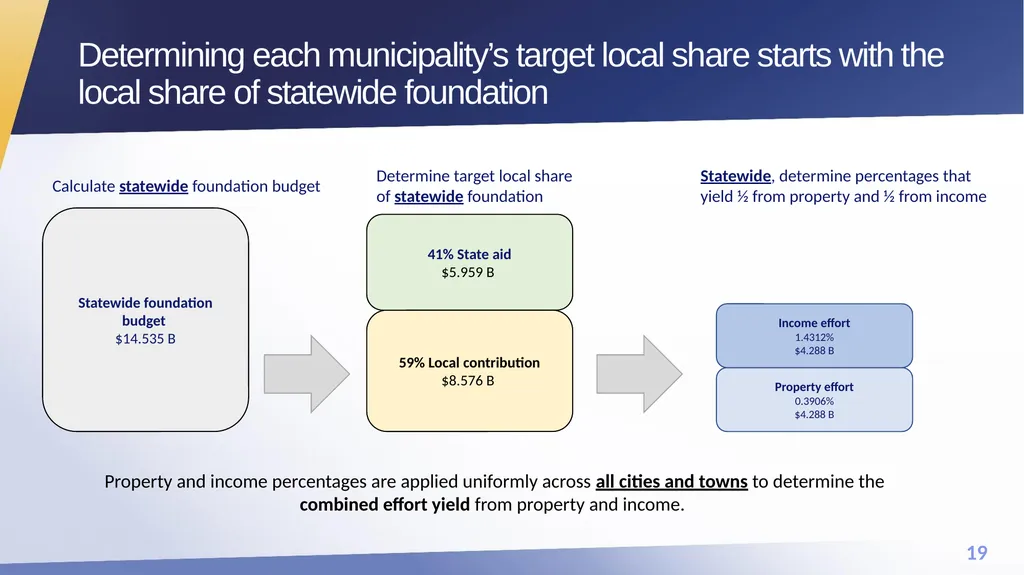
Determining each municipality’s target local share starts with the local share of statewide foundation Calculate statewide foundation budget Determine target local share
of statewide foundation Statewide, determine percentages that yield ½ from property and ½ from income Property and income percentages are applied uniformly across all cities and towns to determine the combined effort yield from property and income.<br>
20
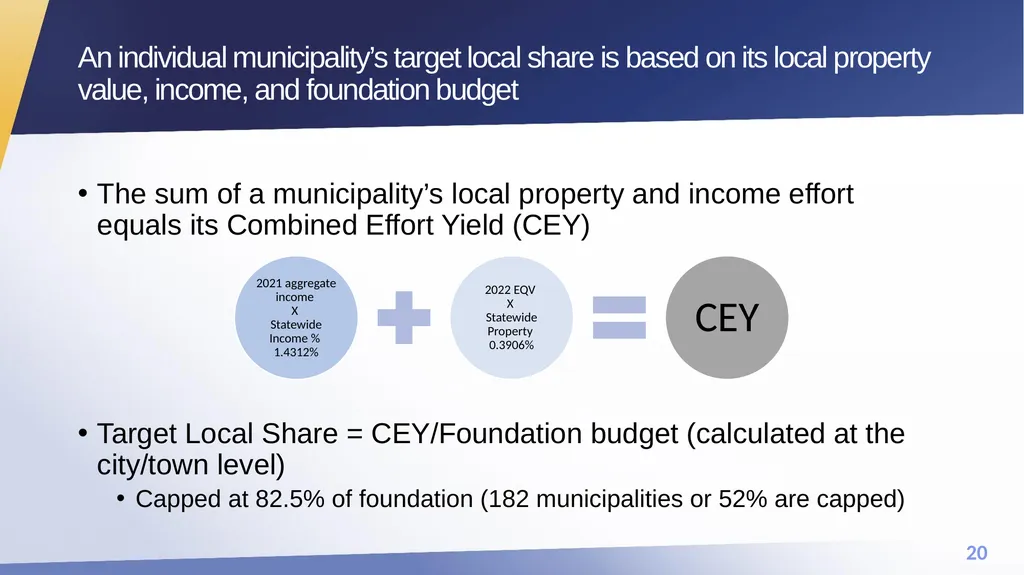
The sum of a municipality’s local property and income effort equals its Combined Effort Yield (CEY)
Target Local Share = CEY/Foundation budget (calculated at the city/town level)
Capped at 82.5% of foundation (182 municipalities or 52% are capped) An individual municipality’s target local share is based on its local property value, income, and foundation budget<br>
Target Local Share = CEY/Foundation budget (calculated at the city/town level)
Capped at 82.5% of foundation (182 municipalities or 52% are capped) An individual municipality’s target local share is based on its local property value, income, and foundation budget<br>
21
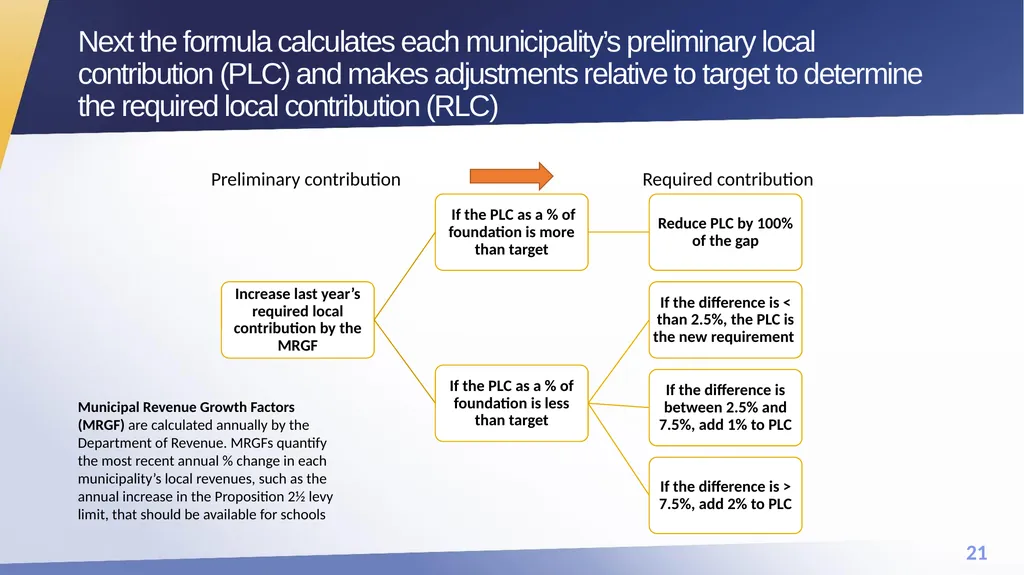
Next the formula calculates each municipality’s preliminary local contribution (PLC) and makes adjustments relative to target to determine the required local contribution (RLC) Preliminary contribution Required contribution Municipal Revenue Growth Factors (MRGF) are calculated annually by the Department of Revenue. MRGFs quantify the most recent annual % change in each municipality’s local revenues, such as the annual increase in the Proposition 2½ levy limit, that should be available for schools<br>
22
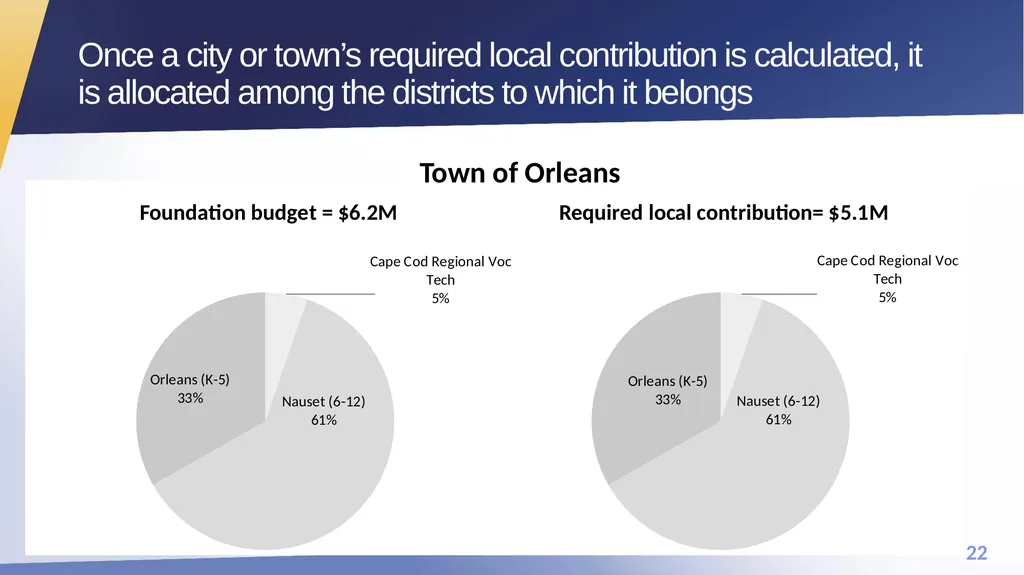
Once a city or town’s required local contribution is calculated, it is allocated among the districts to which it belongs Town of Orleans<br>
23
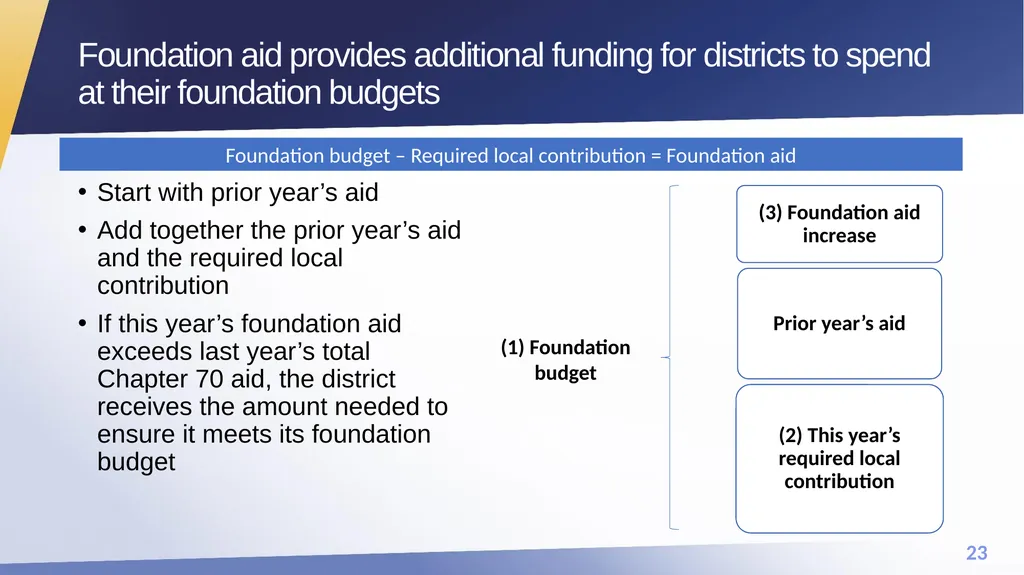
Start with prior year’s aid
Add together the prior year’s aid and the required local contribution
If this year’s foundation aid exceeds last year’s total Chapter 70 aid, the district receives the amount needed to ensure it meets its foundation budget Foundation aid provides additional funding for districts to spend at their foundation budgets Foundation budget – Required local contribution = Foundation aid (1) Foundation budget<br>
Add together the prior year’s aid and the required local contribution
If this year’s foundation aid exceeds last year’s total Chapter 70 aid, the district receives the amount needed to ensure it meets its foundation budget Foundation aid provides additional funding for districts to spend at their foundation budgets Foundation budget – Required local contribution = Foundation aid (1) Foundation budget<br>
24
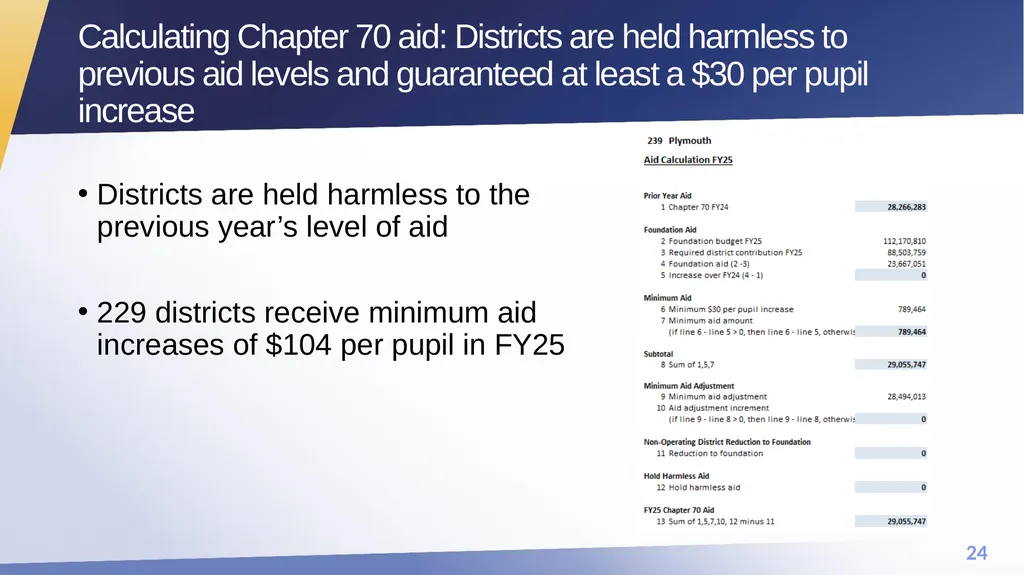
Districts are held harmless to the previous year’s level of aid
229 districts receive minimum aid increases of $104 per pupil in FY25 Calculating Chapter 70 aid: Districts are held harmless to previous aid levels and guaranteed at least a $30 per pupil increase<br>
229 districts receive minimum aid increases of $104 per pupil in FY25 Calculating Chapter 70 aid: Districts are held harmless to previous aid levels and guaranteed at least a $30 per pupil increase<br>
25
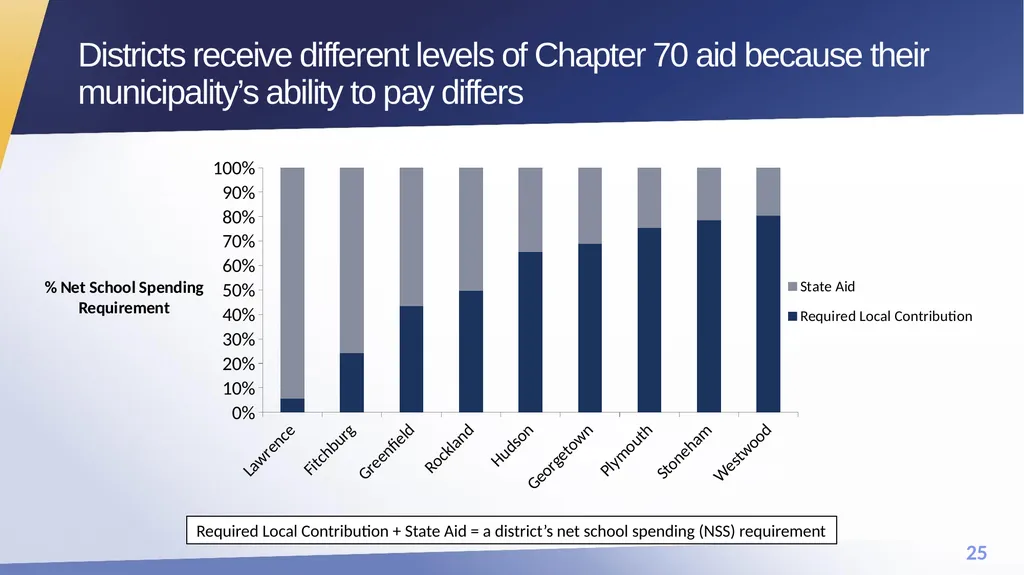
Districts receive different levels of Chapter 70 aid because their municipality’s ability to pay differs Required Local Contribution + State Aid = a district’s net school spending (NSS) requirement<br>
26
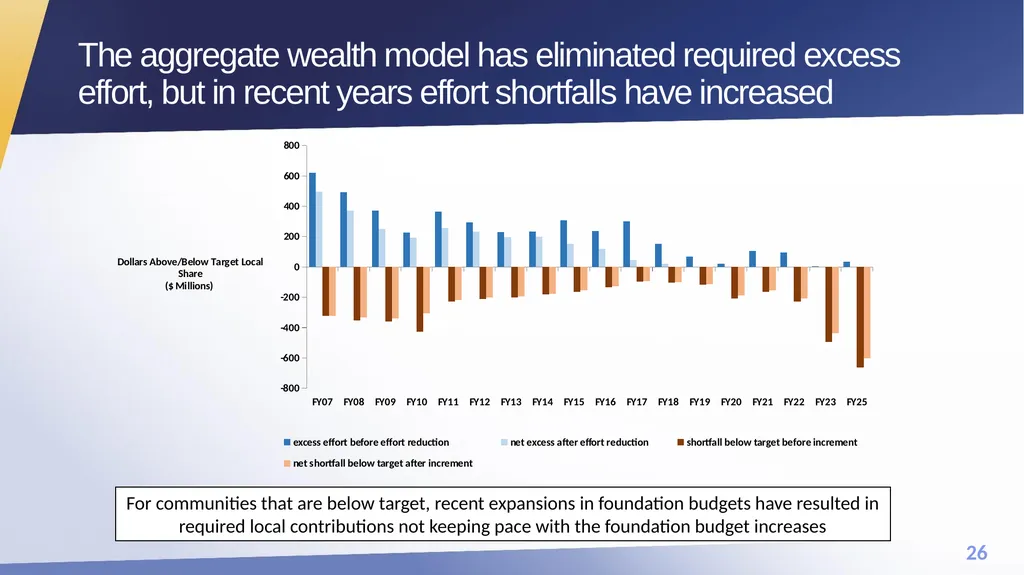
The aggregate wealth model has eliminated required excess effort, but in recent years effort shortfalls have increased For communities that are below target, recent expansions in foundation budgets have resulted in required local contributions not keeping pace with the foundation budget increases<br>
27
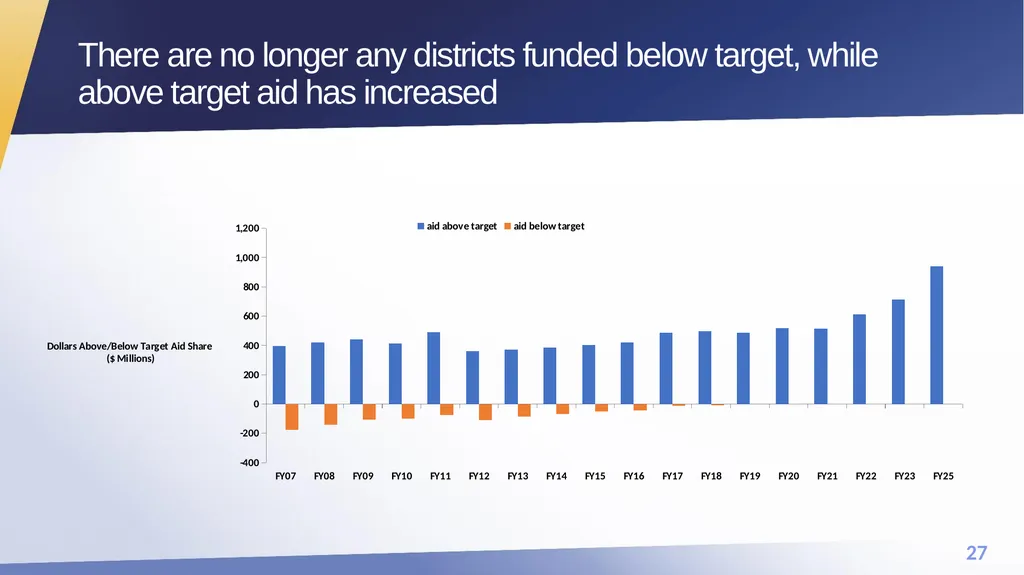
There are no longer any districts funded below target, while above target aid has increased<br>
28
QUESTIONS? Robert.F.O’Donnell@mass.gov 781.338.6512 Meghan.Ryan2@mass.gov 781.338.6507 Rob O’Donnell, Director of School Finance
Meghan Ryan, State Aid Programs Manager<br>
Meghan Ryan, State Aid Programs Manager<br>