01
GCSE Business StudiesUnit 2 Developing a Business Break-Even<br>
02
Learning OutcomesStudents should be able to: calculate break-even both graphically and by formula
explain the significance of the break-even point
distinguish between fixed and variable costs
label a break-even chart
analyse a break-even chart
calculate the margin of safety and explain its significance for a business Images © thinkstockphotos.co.uk<br>
03
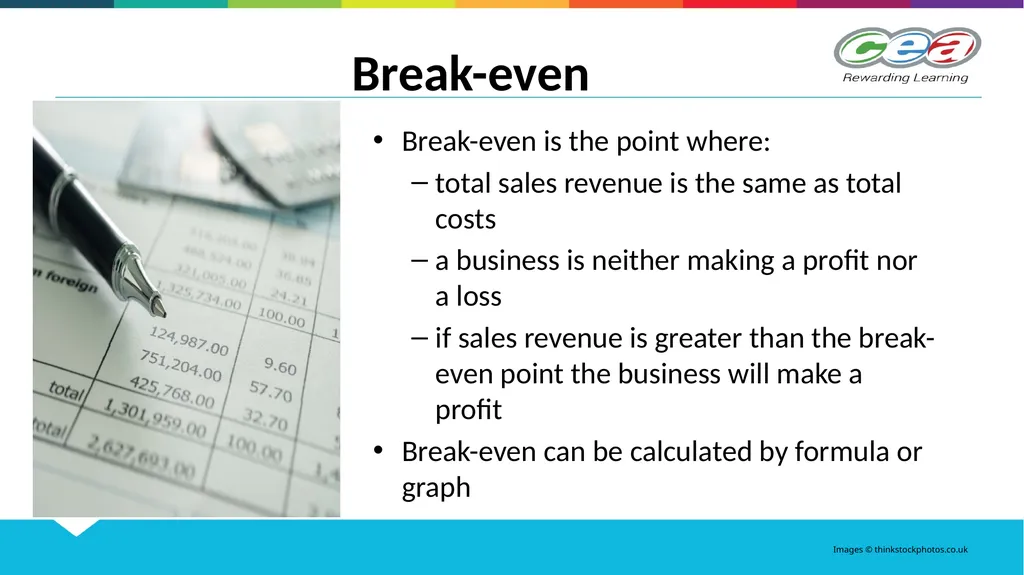
Break-even Break-even is the point where:
total sales revenue is the same as total costs
a business is neither making a profit nor a loss
if sales revenue is greater than the break-even point the business will make a profit
Break-even can be calculated by formula or graph Images © thinkstockphotos.co.uk<br>
04
Importance of Break-even Shows the amount of goods needed to be sold in order to cover costs and go on to make a profit
Used to set the price of a product
Assesses the impact of planned price changes
Assesses how changes in fixed and/or variable costs may affect profit Images © thinkstockphotos.co.uk<br>
05
Fixed Costs do not change with output
have to be paid regardless of the number of items produced
examples of fixed costs include:
Rent
Rates
Insurance
One thing to remember fixed costs can change. An example of this is if a firm decides to expand and move to larger premises they will increased rent and rates Images © thinkstockphotos.co.uk<br>
06
Variable Costs do change with output
vary according to the number of items produced
examples of variable costs include:
Raw materials
Production wages
Transport of goods Images © thinkstockphotos.co.uk<br>
07
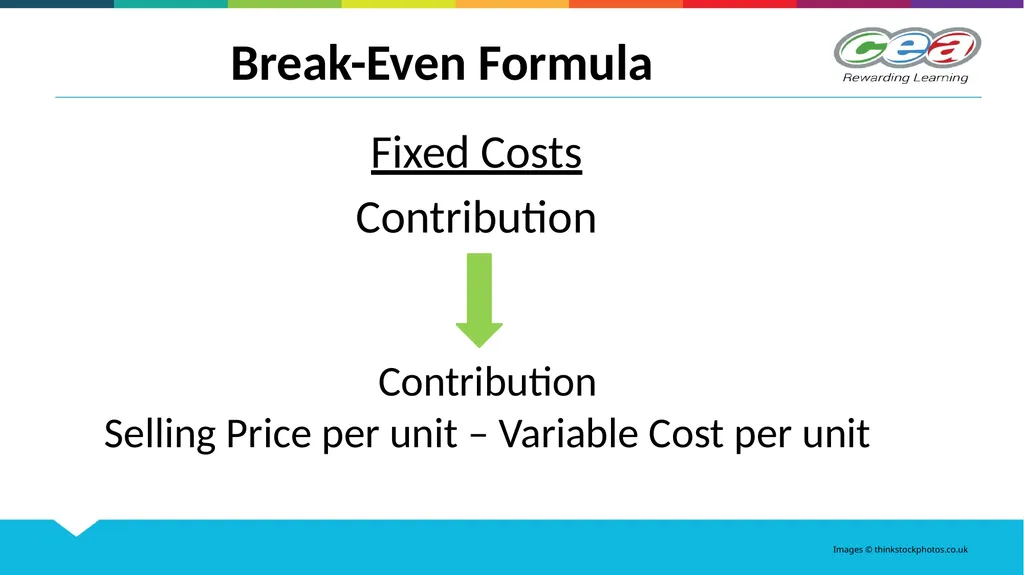
Break-Even Formula Images © thinkstockphotos.co.uk<br>
08
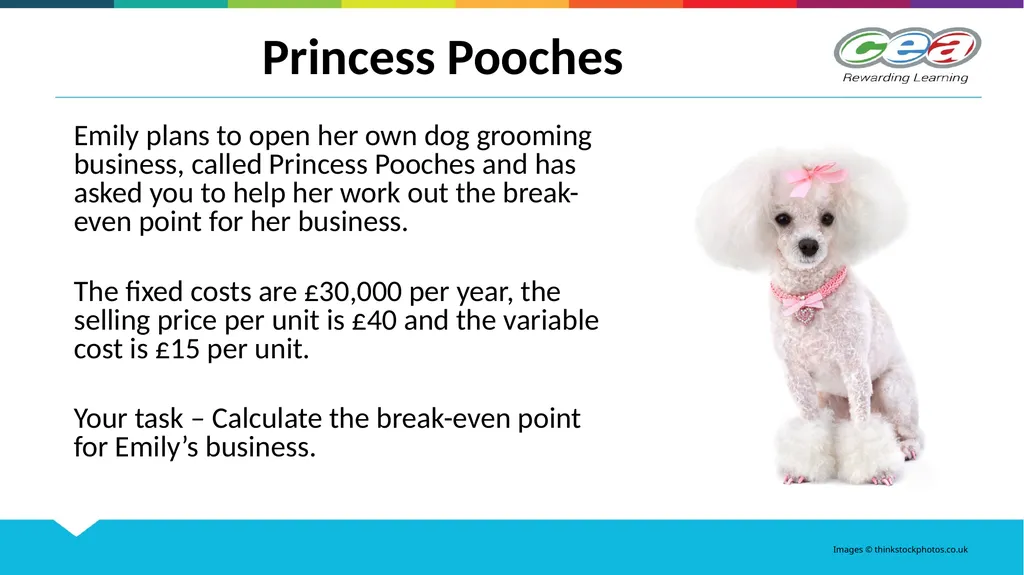
Princess Pooches Emily plans to open her own dog grooming business, called Princess Pooches and has asked you to help her work out the break-even point for her business.
The fixed costs are £30,000 per year, the selling price per unit is £40 and the variable cost is £15 per unit.
Your task – Calculate the break-even point for Emily’s business. Images © thinkstockphotos.co.uk<br>
09
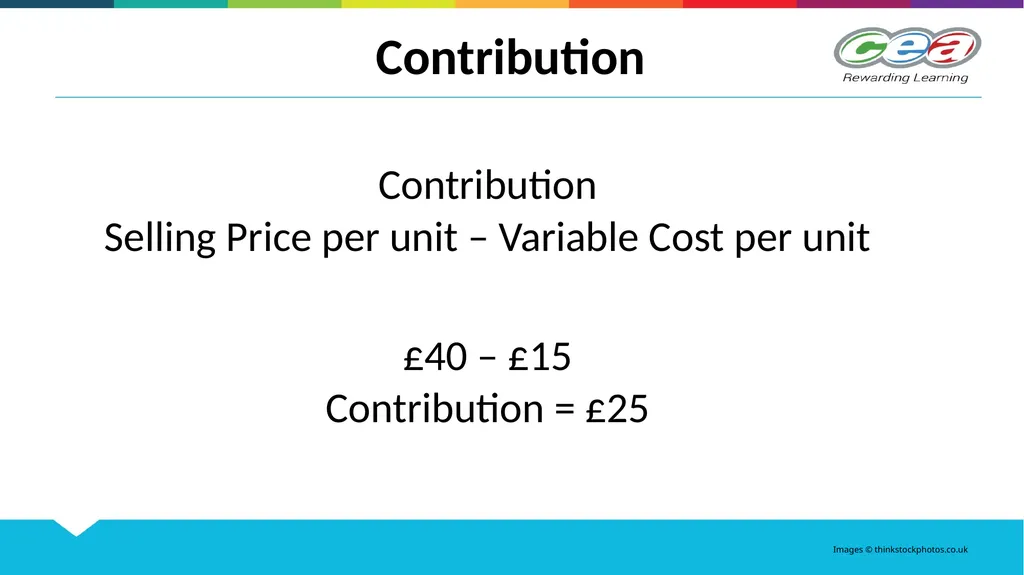
Contribution Images © thinkstockphotos.co.uk<br>
10
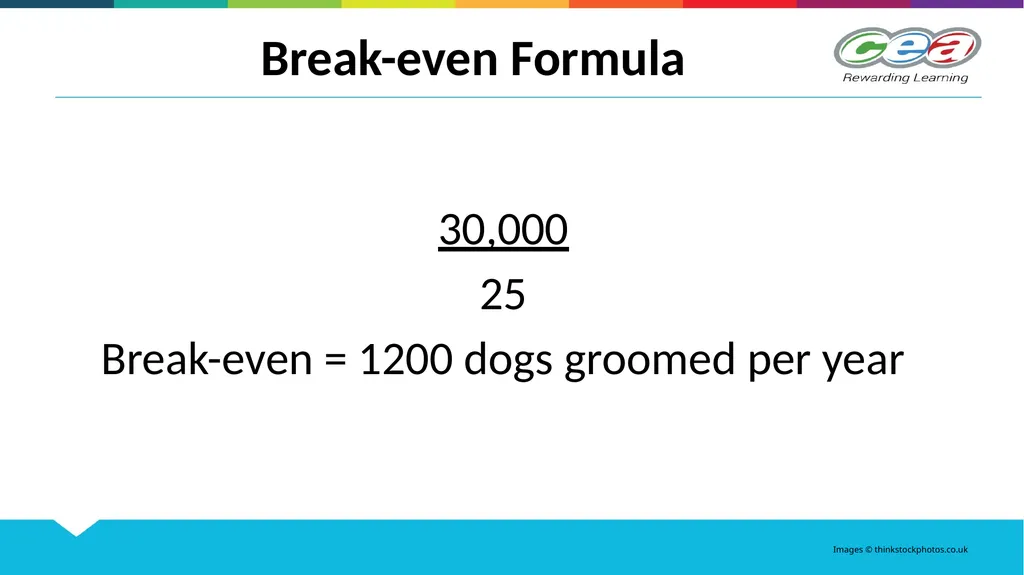
Break-even Formula Images © thinkstockphotos.co.uk<br>
11
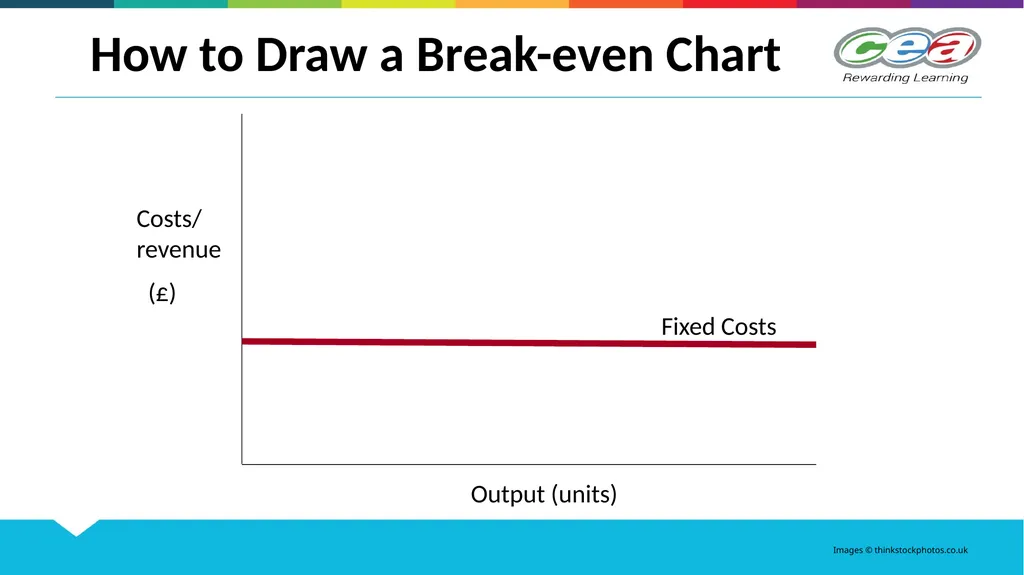
Costs/ revenue
(£) Output (units) How to Draw a Break-even Chart Fixed Costs Images © thinkstockphotos.co.uk<br>
12
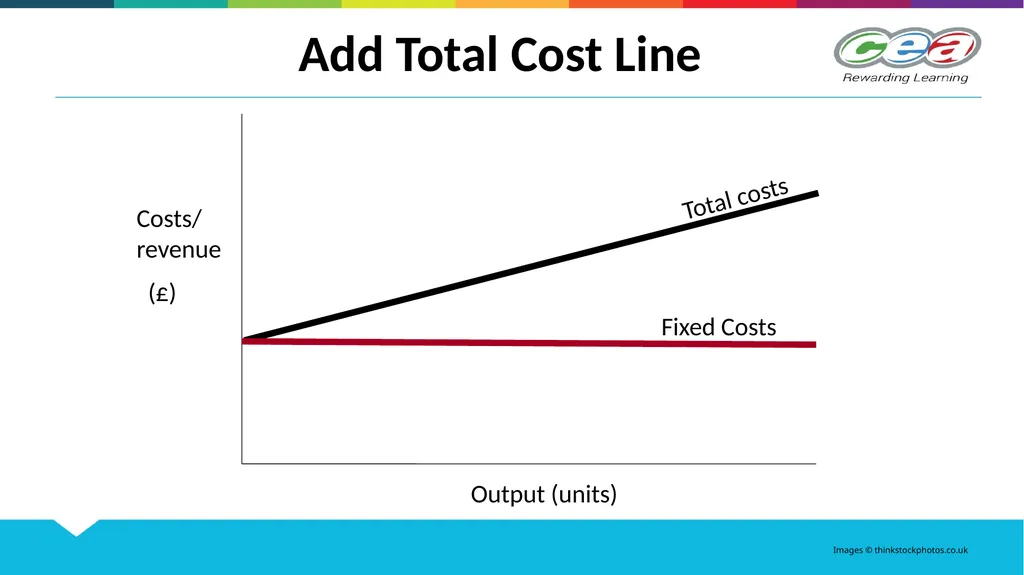
Fixed Costs Total costs Add Total Cost Line Costs/ revenue
(£) Output (units) Images © thinkstockphotos.co.uk<br>
13
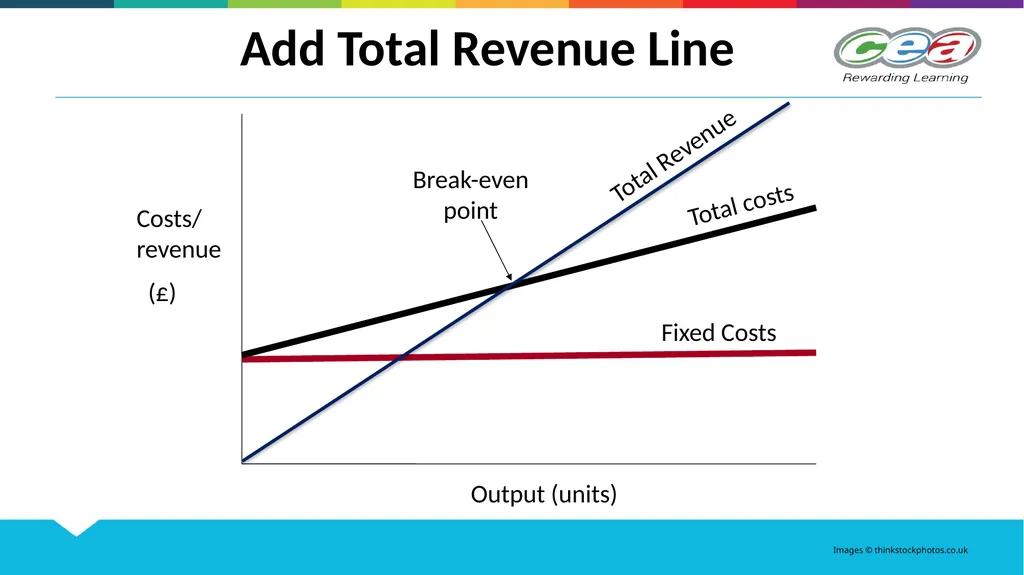
Fixed Costs Total costs Total Revenue Break-even point Add Total Revenue Line Costs/ revenue
(£) Output (units) Images © thinkstockphotos.co.uk<br>
14
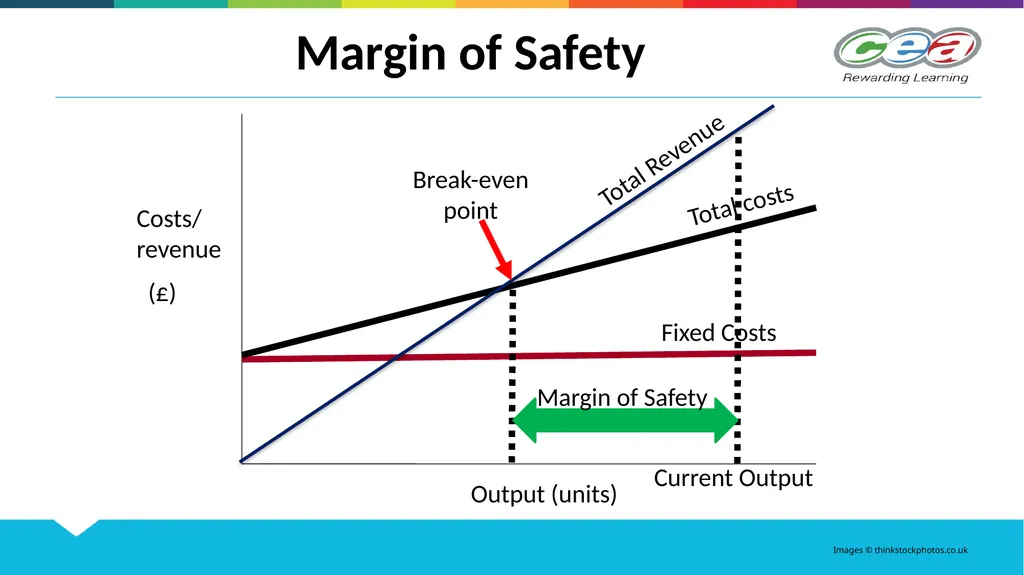
Fixed Costs Total costs Total Revenue Break-even point Margin of Safety Costs/ revenue
(£) Output (units) Current Output Margin of Safety Images © thinkstockphotos.co.uk<br>
15
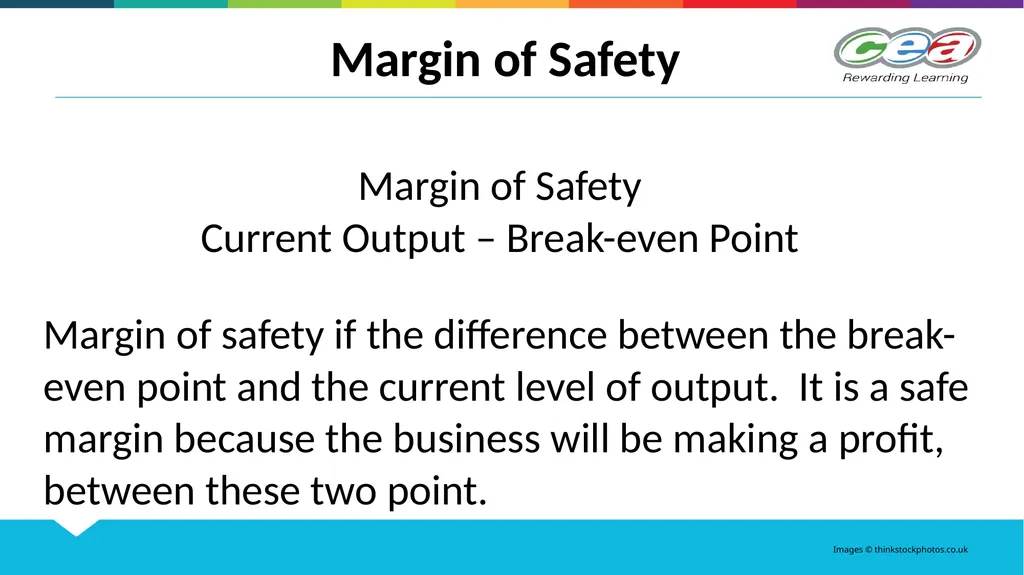
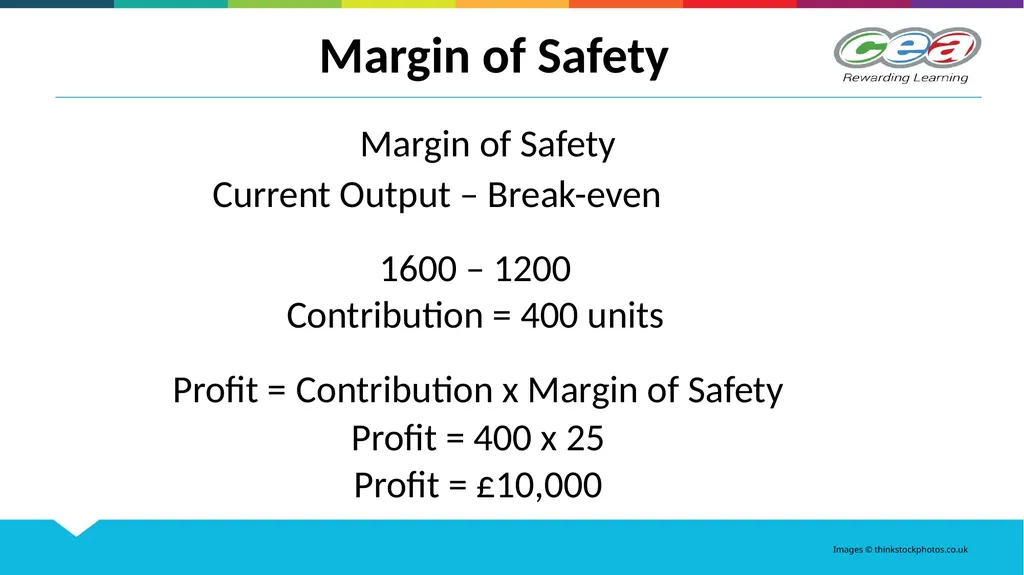
Margin of Safety Images © thinkstockphotos.co.uk<br>
16
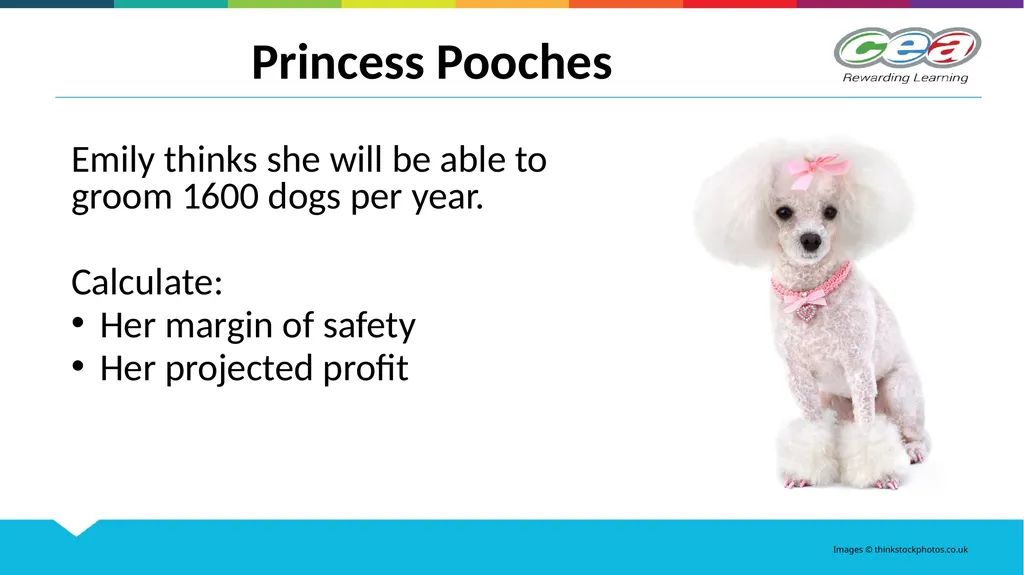
Princess Pooches Emily thinks she will be able to groom 1600 dogs per year.
Calculate:
Her margin of safety
Her projected profit Images © thinkstockphotos.co.uk<br>
17
Margin of Safety Images © thinkstockphotos.co.uk<br>
18
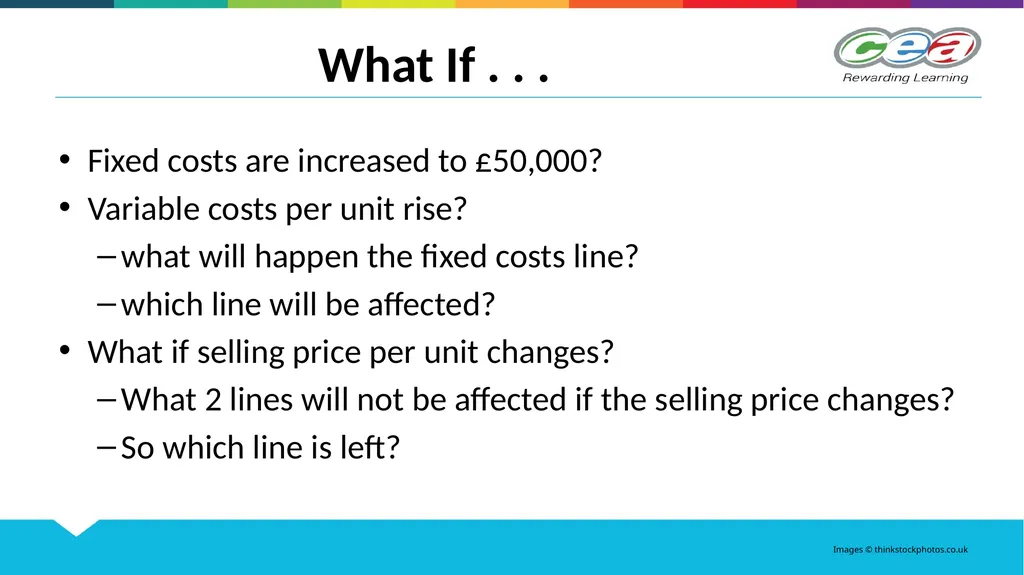
What If . . . Fixed costs are increased to £50,000?
Variable costs per unit rise?
what will happen the fixed costs line?
which line will be affected?
What if selling price per unit changes?
What 2 lines will not be affected if the selling price changes?
So which line is left? Images © thinkstockphotos.co.uk<br>
19
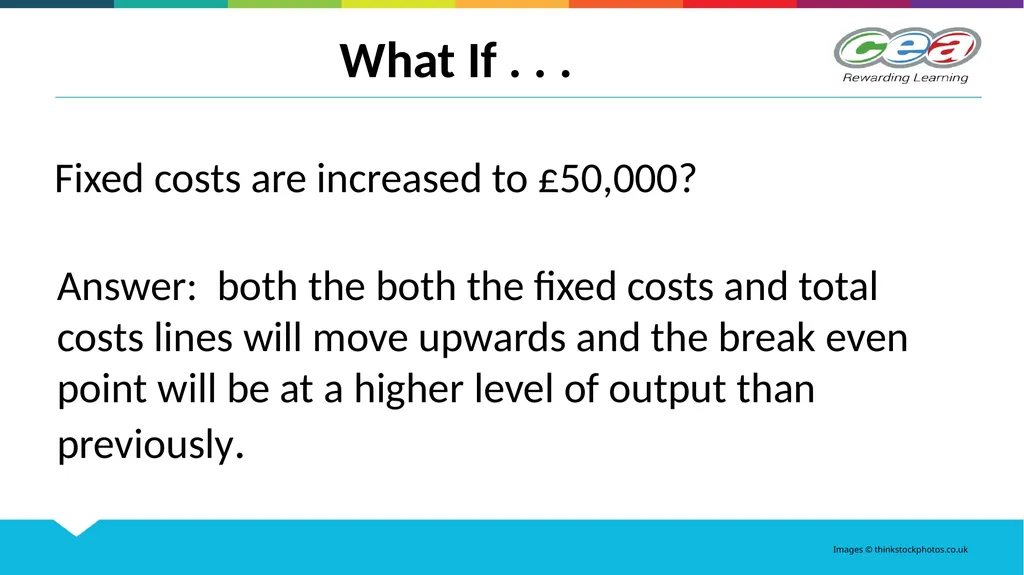
What If . . . Answer: both the both the fixed costs and total costs lines will move upwards and the break even point will be at a higher level of output than previously. Fixed costs are increased to £50,000? Images © thinkstockphotos.co.uk<br>
20
What If . . . What will happen the fixed costs line?
Answer: it will stay the same
Which line will be affected?
Answer: the total cost line.
The new total cost line will begin at the same level as the fixed cost line but it rises more steeply than before. Variable costs per unit rise? Images © thinkstockphotos.co.uk<br>
21
What If . . . What 2 lines will not be affected if the selling price changes?
Answer: fixed cost and total cost lines
So which line is left?
Answer: total revenue line
If the Selling Price of the product rises then the total revenue line will still come from 0 but it will be steeper.
The Break-Even Point will be lower. Why is this? What if selling price per unit changes? Images © thinkstockphotos.co.uk<br>
22
Uses of Break-even Analysis The main use of break-even analysis is to help in making decision about the level of output to produce and sell in order to produce a particular level of profit.
It can also help the entrepreneur decide whether or not the business will be viable:
If the break-even chart shows that the break-even point is above the output which market research suggests is demanded, then the business should not be run.
It is also very useful for ‘what if’ analysis:
This means that it can be used to work out what would happen to profitability and break-even output if one of the costs changed or if selling price was altered. Images © thinkstockphotos.co.uk<br>
23
Limitations Break-even analysis does not indicate what sales are actually likely to be for the product. This is an important limitation as it does not take into consideration what the demand for the product might be.
It assumes that fixed costs are constant. This may not always be the case as some economies of scale may arise.
It assumes average variable costs are constant per unit of output, at least in the range of likely quantities of sales. Again these may change as output levels change.
It assumes that the quantity of goods produced is equal to the quantity of goods sold.
It is sometimes difficult to classify costs as either fixed or variable. Some costs are semi-variable. Images © thinkstockphotos.co.uk<br>
24
Pupil Activity Working individually you have thirty minutes to answer the following past paper questions:
2011 Question 3c
2012 Question 3a – d
2014 Question 3d – h Images © thinkstockphotos.co.uk<br>
25
Learning CheckCan you: calculate break-even both graphically and by formulae
explain the significance of the break-even point
distinguish between fixed and variable costs
label a break-even chart
analyse a break-even chart
calculate the margin of safety and explain its significance for a business Images © thinkstockphotos.co.uk<br>
Show all 25 slides