
Getting started with Data Science Grade VIII


Description: Getting started with Data Science Grade VIII Version 1.0 Chapter 1: Introduction to data At the end of this chapter, students will understand what is data. They will know: What are qualitative and quantitative data? Difference between
Related Topics
Download Presentation
"Getting started with Data Science Grade VIII" is the property of its rightful owner. Permission is granted to download and print the materials on this website for personal, non-commercial use only, and to display it on your personal computer provided you do not modify the materials and that you retain all copyright notices contained in the materials. By downloading content from our website, you accept the terms of this agreement.
Presentation Transcript
slide1. Getting started with Data Science Grade VIII Version 1.0<br>
slide2. Chapter 1: Introduction to data At the end of this chapter, students will understand what is data. They will know:
What are qualitative and quantitative data?
Difference between discrete and continuous data
Real world applications of data<br>
slide3. Chapter 1: What is data? We often use the term data to refer to computer information
This information is either transmitted or stored
Data comes in numerous forms
Any kind of information may it be in numbers or text, or pictures is termed as Data<br>
slide4. Types of data Data comes in different types. Some of the common types of data include:
Text
Image
Video
Numbers
Spreadsheets
Sound<br>
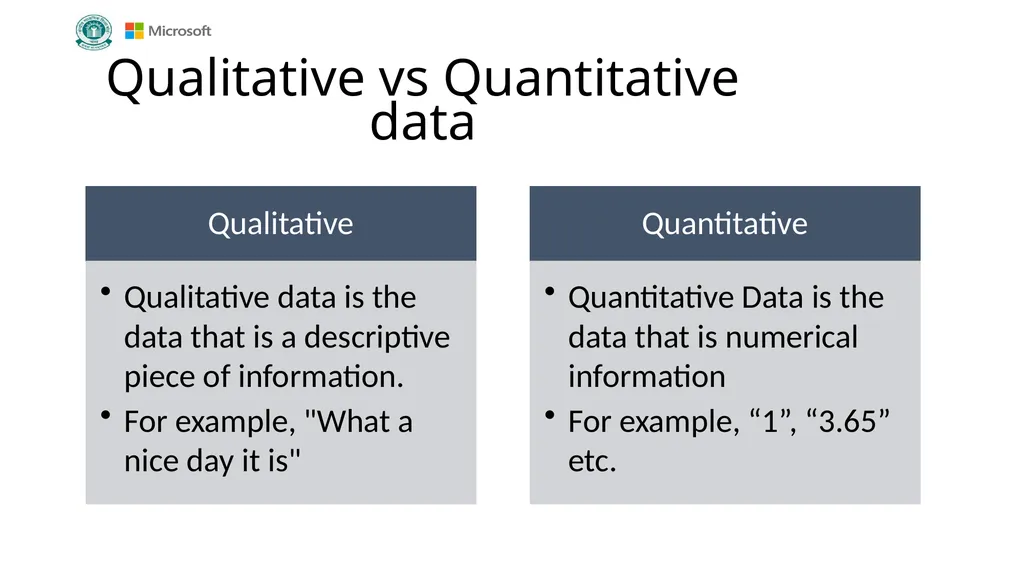
slide5. Qualitative vs Quantitative data<br>
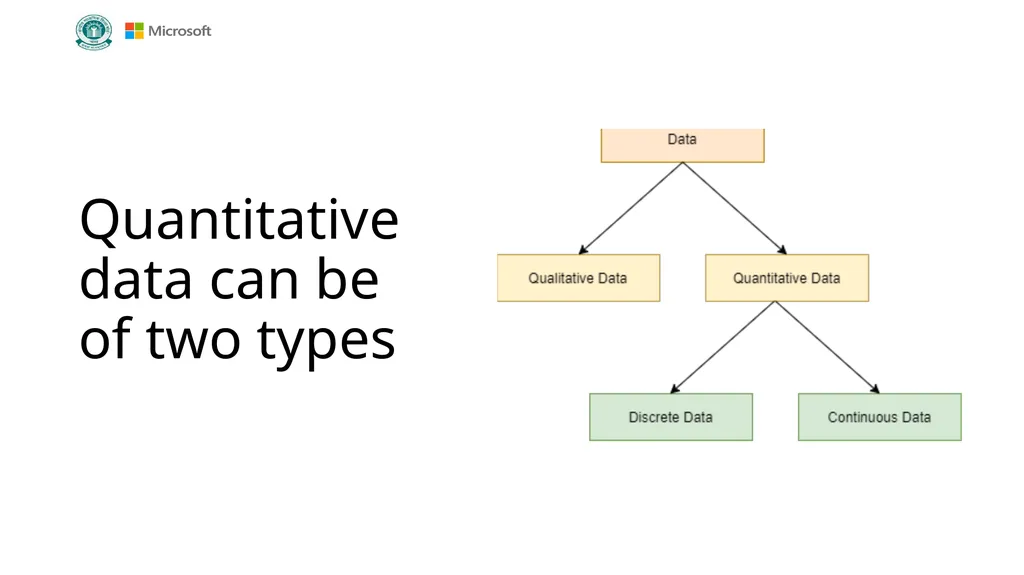
slide6. Quantitative data can be of two types<br>
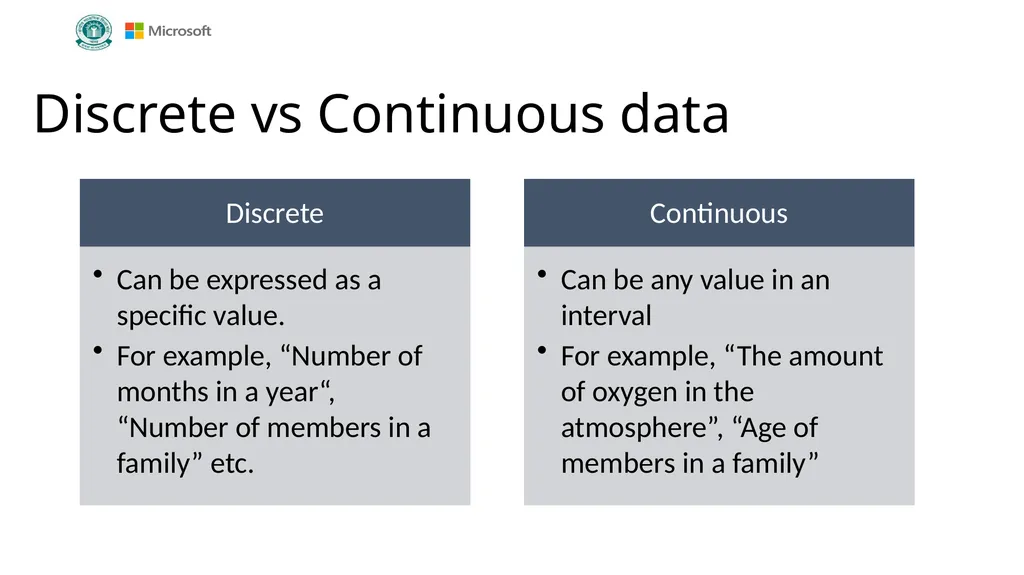
slide7. Discrete vs Continuous data<br>
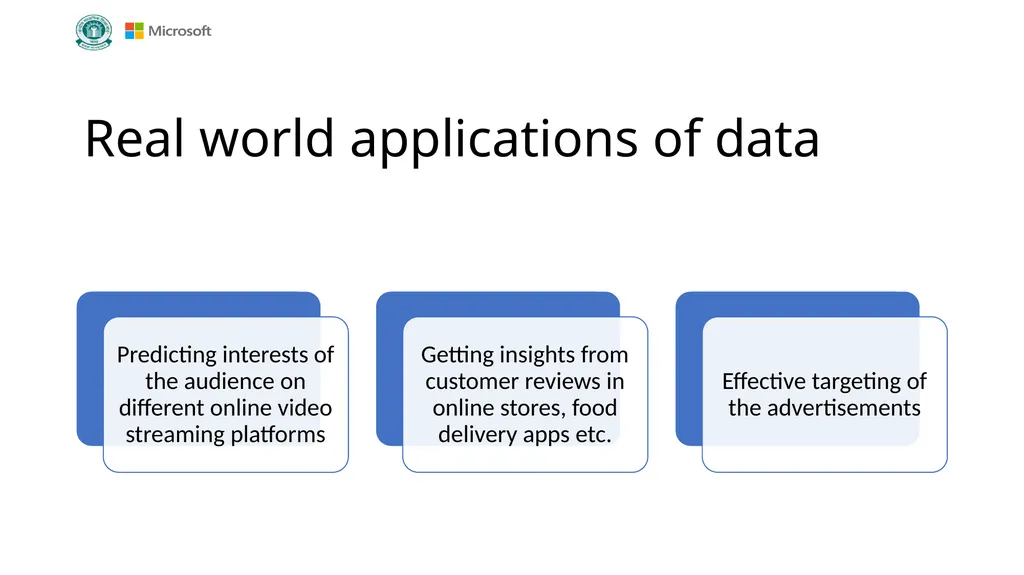
slide8. Real world applications of data<br>
slide9. Chapter 2: Introduction to data science At the end of this chapter, students will have a brief introduction to data science. They will know:
What is data science?
Careers in data science
What data science helps us achieve<br>
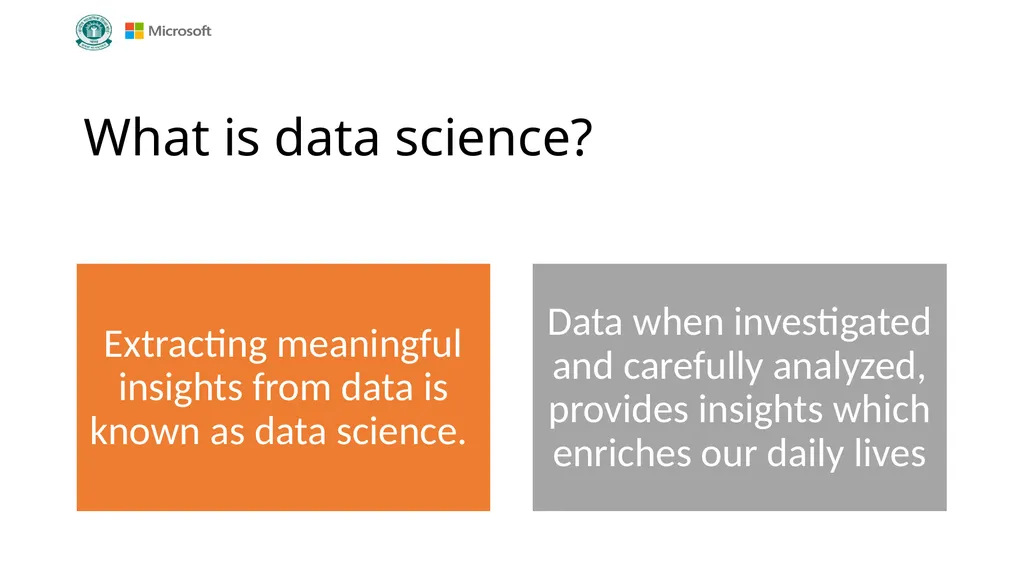
slide10. What is data science?<br>
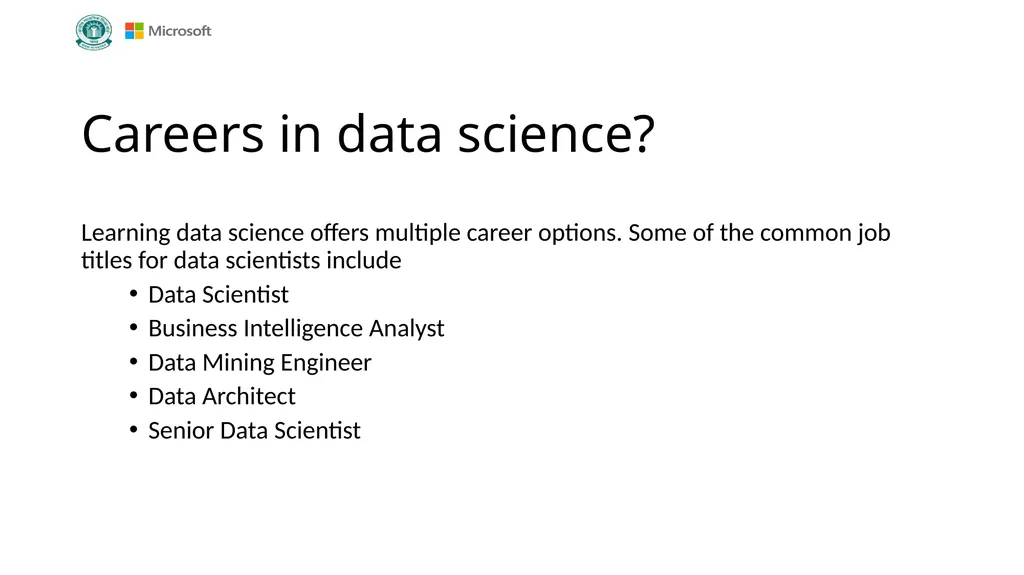
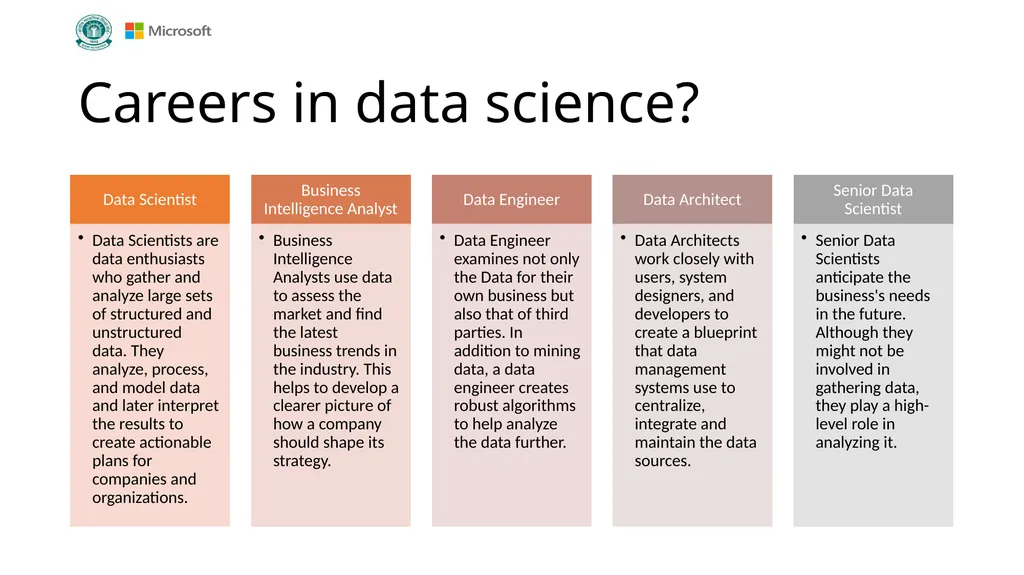
slide11. Careers in data science? Learning data science offers multiple career options. Some of the common job titles for data scientists include
Data Scientist
Business Intelligence Analyst
Data Mining Engineer
Data Architect
Senior Data Scientist<br>
slide12. Careers in data science?<br>
slide13. How data science helps us? Simply stated, data science helps us answer different types of questions from data. Some common questions to ask from data are:
Which class does this belong to - A or B?
Is this an outlier?
What will probably be the value of this variable?
What should be done now?<br>
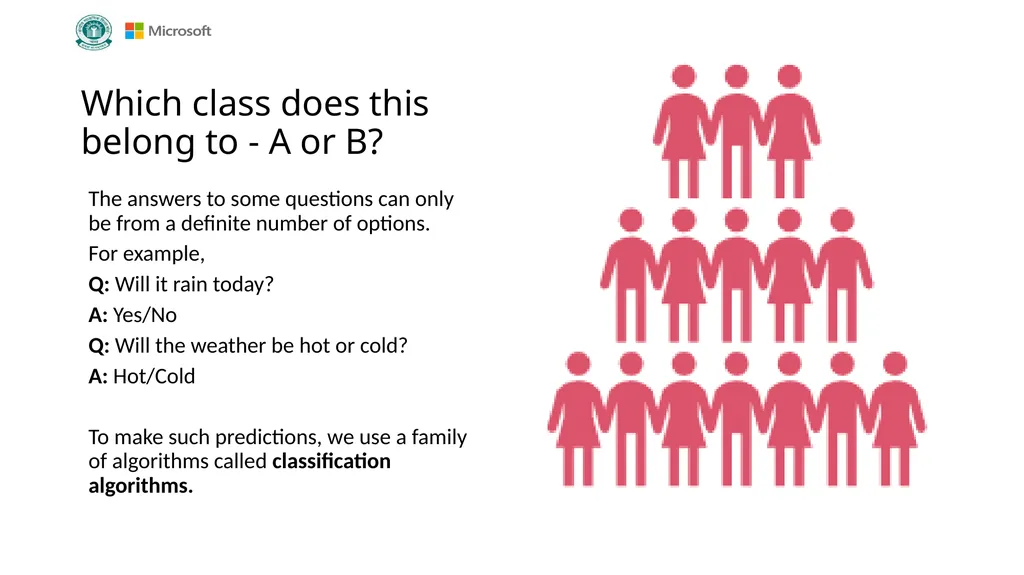
slide14. Which class does this belong to - A or B? The answers to some questions can only be from a definite number of options.
For example,
Q: Will it rain today?
A: Yes/No
Q: Will the weather be hot or cold?
A: Hot/Cold
To make such predictions, we use a family of algorithms called classification algorithms.<br>
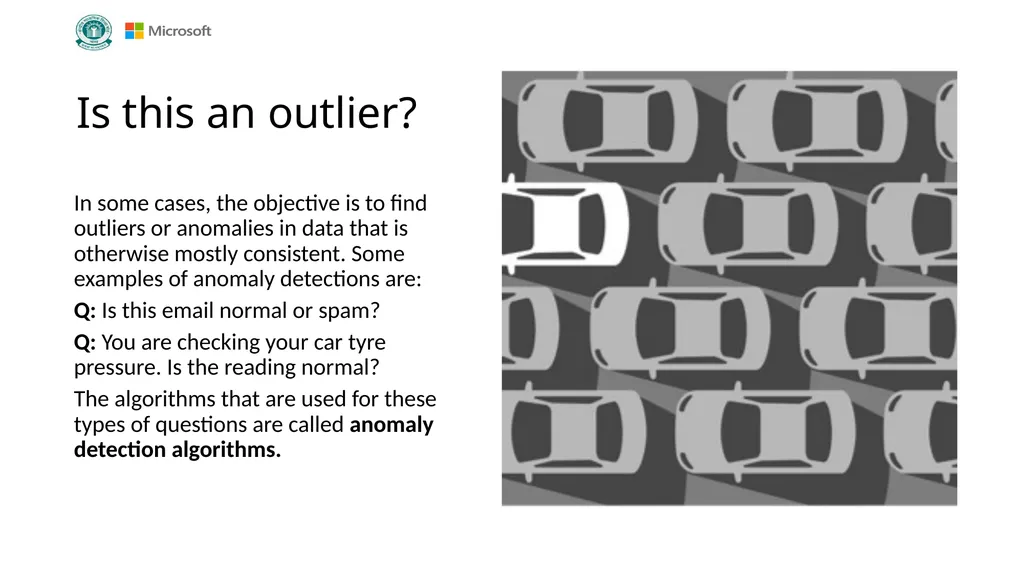
slide15. Is this an outlier? In some cases, the objective is to find outliers or anomalies in data that is otherwise mostly consistent. Some examples of anomaly detections are:
Q: Is this email normal or spam?
Q: You are checking your car tyre pressure. Is the reading normal?
The algorithms that are used for these types of questions are called anomaly detection algorithms.<br>
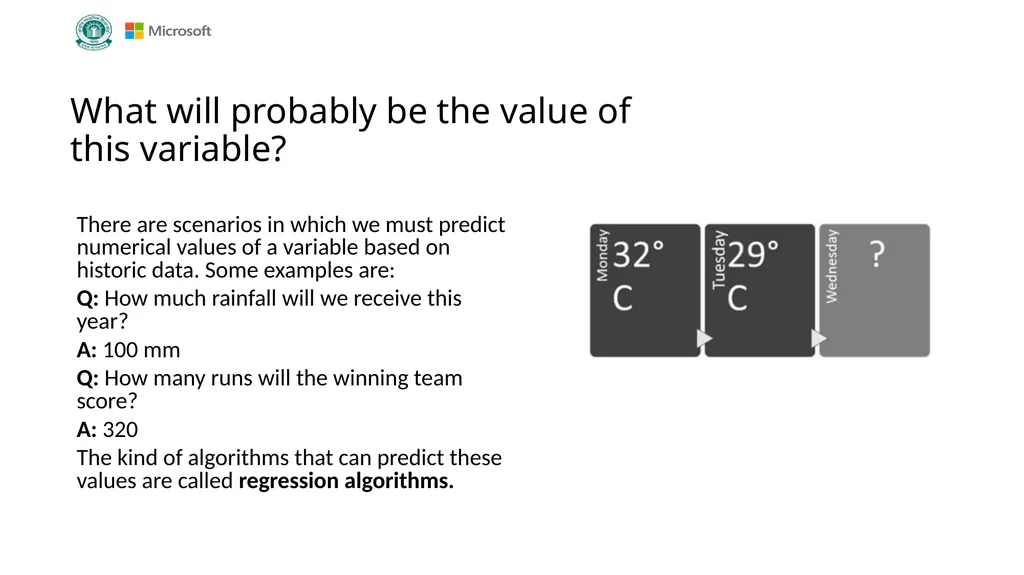
slide16. What will probably be the value of this variable? There are scenarios in which we must predict numerical values of a variable based on historic data. Some examples are:
Q: How much rainfall will we receive this year?
A: 100 mm
Q: How many runs will the winning team score?
A: 320
The kind of algorithms that can predict these values are called regression algorithms.<br>
slide17. What should be done now? This question usually solves the problems of autonomous robots or self-driving cars that need to make decisions based on changes in external factors. Machine learning helps to solve such problems with the help of reinforcement learning.<br>
slide18. Chapter 3: Data visualization At the end of this chapter, students will have a brief introduction to data visualizations. They will know:
What is data visualization?
Examples of data visualization
The importance of visualization
Collecting relevant data
Asking the right question
Predict an answer<br>
slide19. What is data visualization?<br>
slide20. Common types of data visualizations? Common types of data visualizations are:
Charts
Graphs
Tables
Maps
Histograms<br>
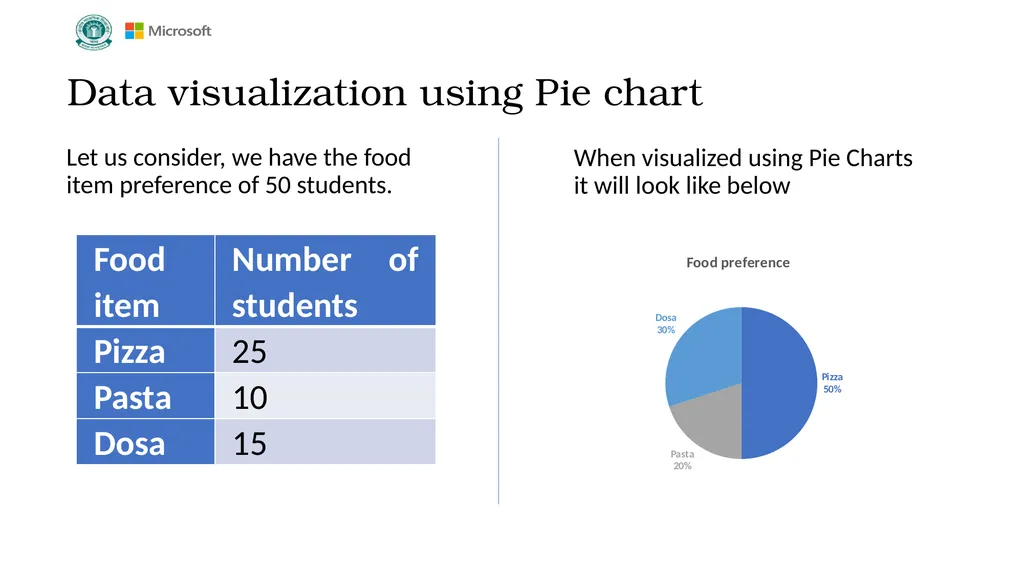
slide21. Data visualization using Pie chart Let us consider, we have the food item preference of 50 students. When visualized using Pie Charts it will look like below<br>
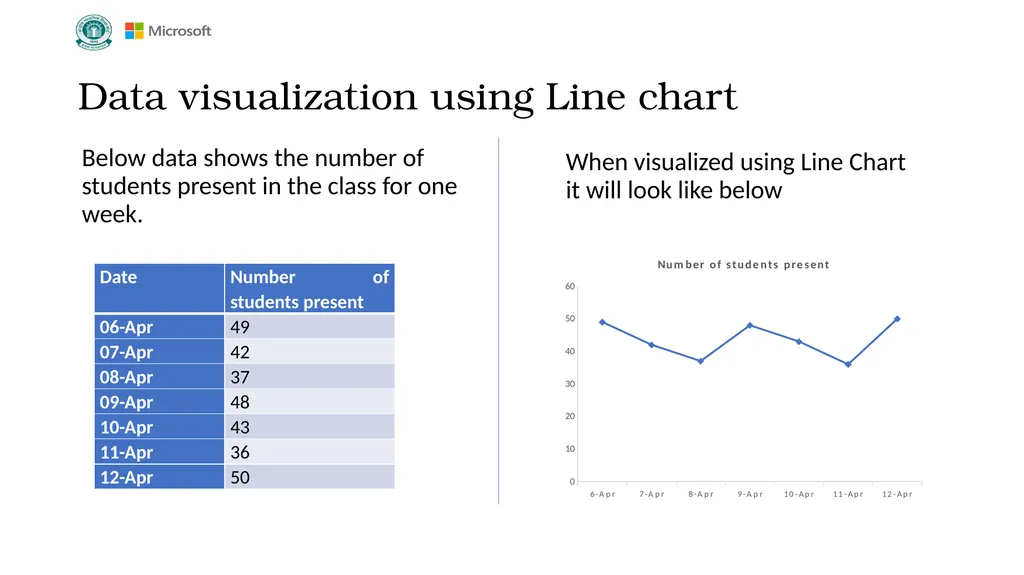
slide22. Data visualization using Line chart Below data shows the number of students present in the class for one week. When visualized using Line Chart it will look like below<br>
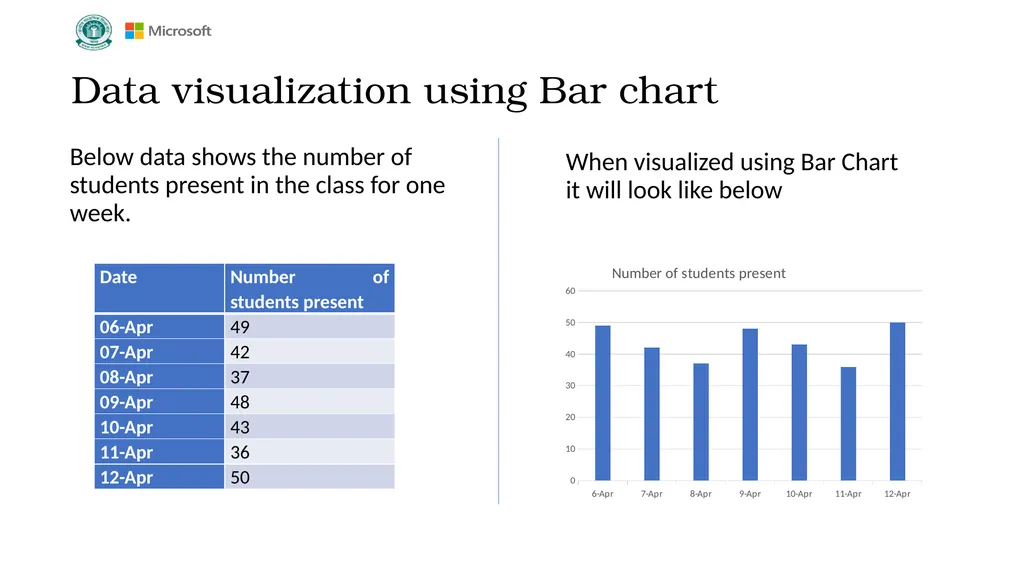
slide23. Data visualization using Bar chart Below data shows the number of students present in the class for one week. When visualized using Bar Chart it will look like below<br>
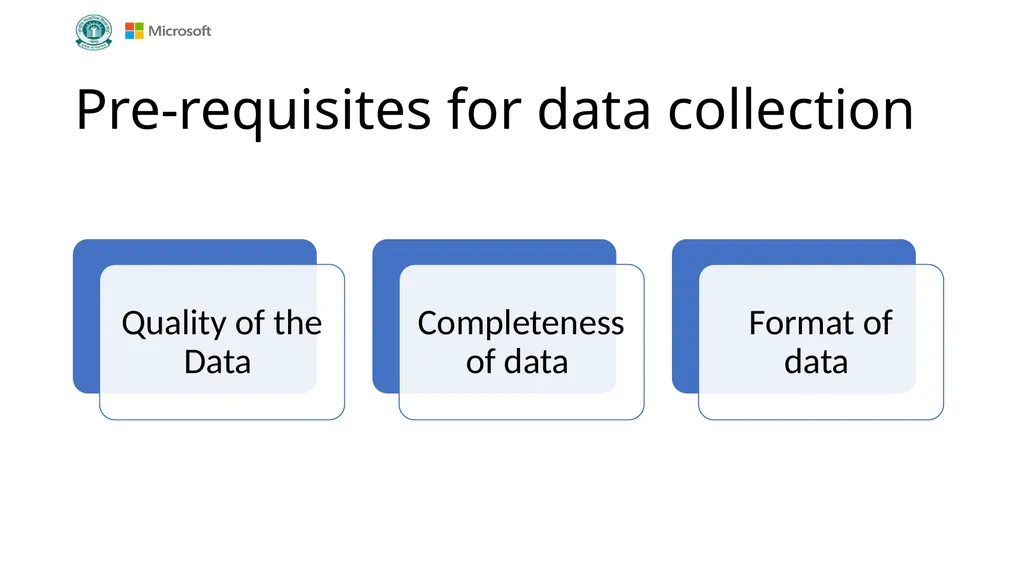
slide24. Pre-requisites for data collection<br>
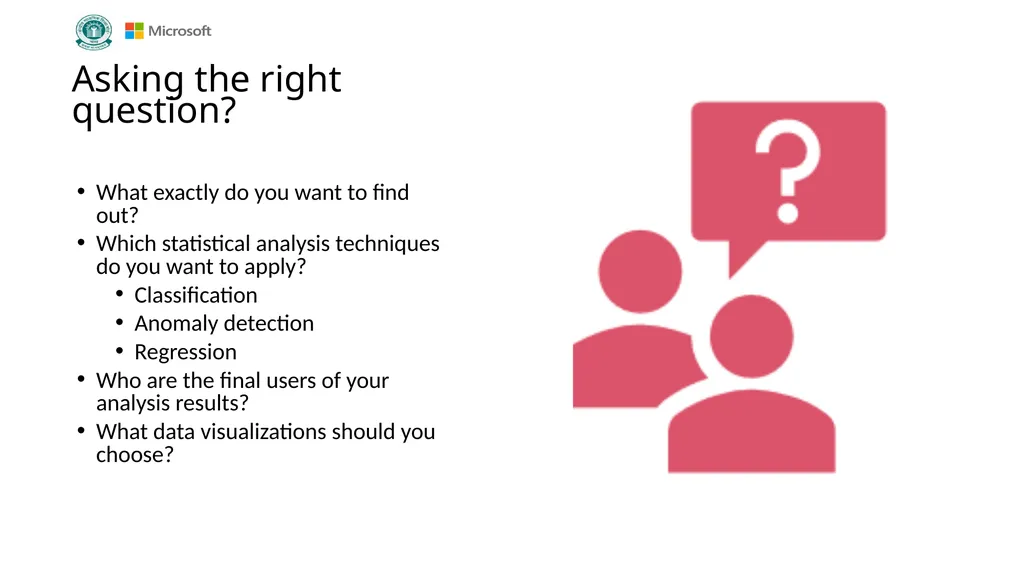
slide25. Asking the right question? What exactly do you want to find out?
Which statistical analysis techniques do you want to apply?
Classification
Anomaly detection
Regression
Who are the final users of your analysis results?
What data visualizations should you choose?<br>
slide26. Chapter 4: Data science and AI At the end of this chapter, students will have a brief introduction applications of data science in AI. They will know
Applications of data science
Analytics on text data
Analytics on image data
Overview of AI<br>
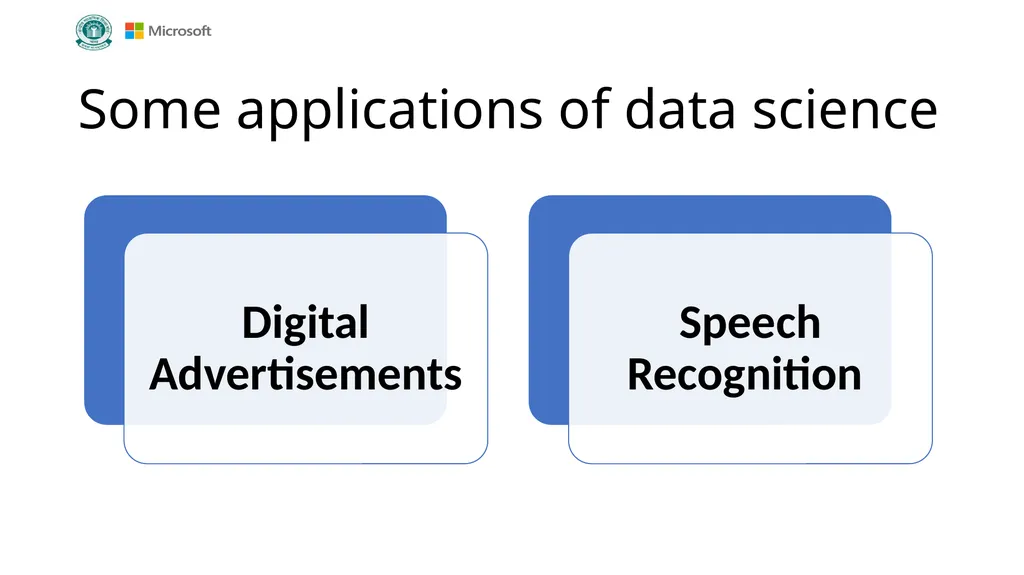
slide27. Some applications of data science<br>
slide28. What is text analytics? Text analytics can be defined as the process of collecting unstructured text from various sources and analyzing and extracting relevant information from it. It can also be used for transforming it into structured information that can then be used in various other ways.<br>
slide29. Analytics on image data Image recognition can be described as a process by which we can process images for identifying people, patterns, logos, objects, or places.<br>
slide30. Overview of AI Artificial Intelligence is defined as the science and engineering of making intelligent machines. AI is a branch of Computer Science which deals with the research and design of intelligent systems that can take inputs from their environment and takes actions based on it as a human being would.<br>
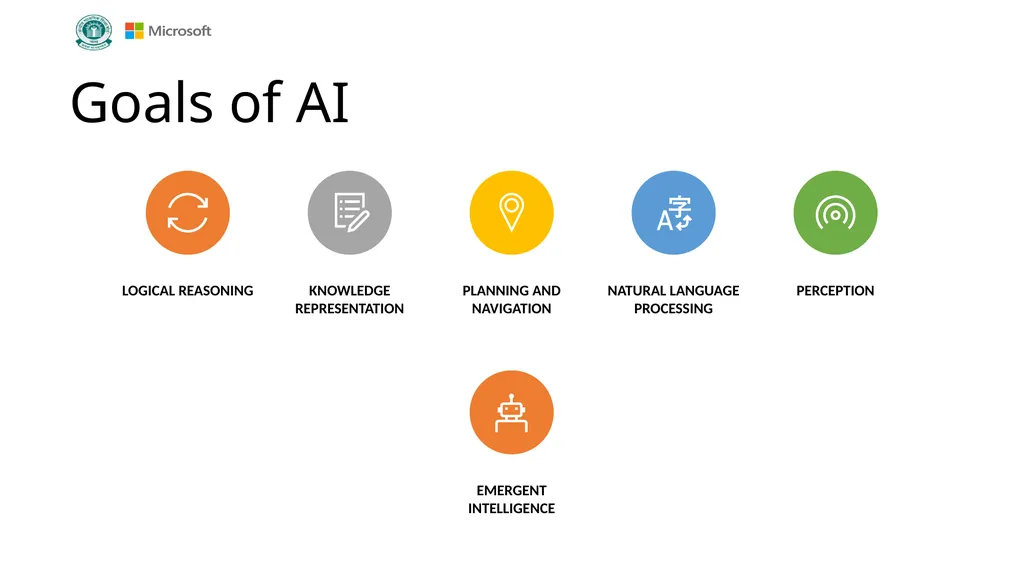
slide31. Goals of AI<br>
slide32. Thank You<br>
slide2. Chapter 1: Introduction to data At the end of this chapter, students will understand what is data. They will know:
What are qualitative and quantitative data?
Difference between discrete and continuous data
Real world applications of data<br>
slide3. Chapter 1: What is data? We often use the term data to refer to computer information
This information is either transmitted or stored
Data comes in numerous forms
Any kind of information may it be in numbers or text, or pictures is termed as Data<br>
slide4. Types of data Data comes in different types. Some of the common types of data include:
Text
Image
Video
Numbers
Spreadsheets
Sound<br>
slide5. Qualitative vs Quantitative data<br>
slide6. Quantitative data can be of two types<br>
slide7. Discrete vs Continuous data<br>
slide8. Real world applications of data<br>
slide9. Chapter 2: Introduction to data science At the end of this chapter, students will have a brief introduction to data science. They will know:
What is data science?
Careers in data science
What data science helps us achieve<br>
slide10. What is data science?<br>
slide11. Careers in data science? Learning data science offers multiple career options. Some of the common job titles for data scientists include
Data Scientist
Business Intelligence Analyst
Data Mining Engineer
Data Architect
Senior Data Scientist<br>
slide12. Careers in data science?<br>
slide13. How data science helps us? Simply stated, data science helps us answer different types of questions from data. Some common questions to ask from data are:
Which class does this belong to - A or B?
Is this an outlier?
What will probably be the value of this variable?
What should be done now?<br>
slide14. Which class does this belong to - A or B? The answers to some questions can only be from a definite number of options.
For example,
Q: Will it rain today?
A: Yes/No
Q: Will the weather be hot or cold?
A: Hot/Cold
To make such predictions, we use a family of algorithms called classification algorithms.<br>
slide15. Is this an outlier? In some cases, the objective is to find outliers or anomalies in data that is otherwise mostly consistent. Some examples of anomaly detections are:
Q: Is this email normal or spam?
Q: You are checking your car tyre pressure. Is the reading normal?
The algorithms that are used for these types of questions are called anomaly detection algorithms.<br>
slide16. What will probably be the value of this variable? There are scenarios in which we must predict numerical values of a variable based on historic data. Some examples are:
Q: How much rainfall will we receive this year?
A: 100 mm
Q: How many runs will the winning team score?
A: 320
The kind of algorithms that can predict these values are called regression algorithms.<br>
slide17. What should be done now? This question usually solves the problems of autonomous robots or self-driving cars that need to make decisions based on changes in external factors. Machine learning helps to solve such problems with the help of reinforcement learning.<br>
slide18. Chapter 3: Data visualization At the end of this chapter, students will have a brief introduction to data visualizations. They will know:
What is data visualization?
Examples of data visualization
The importance of visualization
Collecting relevant data
Asking the right question
Predict an answer<br>
slide19. What is data visualization?<br>
slide20. Common types of data visualizations? Common types of data visualizations are:
Charts
Graphs
Tables
Maps
Histograms<br>
slide21. Data visualization using Pie chart Let us consider, we have the food item preference of 50 students. When visualized using Pie Charts it will look like below<br>
slide22. Data visualization using Line chart Below data shows the number of students present in the class for one week. When visualized using Line Chart it will look like below<br>
slide23. Data visualization using Bar chart Below data shows the number of students present in the class for one week. When visualized using Bar Chart it will look like below<br>
slide24. Pre-requisites for data collection<br>
slide25. Asking the right question? What exactly do you want to find out?
Which statistical analysis techniques do you want to apply?
Classification
Anomaly detection
Regression
Who are the final users of your analysis results?
What data visualizations should you choose?<br>
slide26. Chapter 4: Data science and AI At the end of this chapter, students will have a brief introduction applications of data science in AI. They will know
Applications of data science
Analytics on text data
Analytics on image data
Overview of AI<br>
slide27. Some applications of data science<br>
slide28. What is text analytics? Text analytics can be defined as the process of collecting unstructured text from various sources and analyzing and extracting relevant information from it. It can also be used for transforming it into structured information that can then be used in various other ways.<br>
slide29. Analytics on image data Image recognition can be described as a process by which we can process images for identifying people, patterns, logos, objects, or places.<br>
slide30. Overview of AI Artificial Intelligence is defined as the science and engineering of making intelligent machines. AI is a branch of Computer Science which deals with the research and design of intelligent systems that can take inputs from their environment and takes actions based on it as a human being would.<br>
slide31. Goals of AI<br>
slide32. Thank You<br>