GraphicalVisual Abstracts INSTRUCTIONS Creating Your GraphicalVisual Abstract Select one of the provided templates. (The structured templates are provided as guides, but the blank template may also be used.) Depict the research in clean,
"Graphical/Visual Abstracts INSTRUCTIONS Creating" is the property of its rightful owner. Permission is granted to
download and print the materials on this website for personal, non-commercial use only, and to display it
on your personal computer provided you do not modify the materials and that you retain all copyright
notices contained in the materials. By downloading content from our website, you accept the terms of this
agreement.
Presentation Transcript
01
Graphical/Visual Abstracts<br>
02
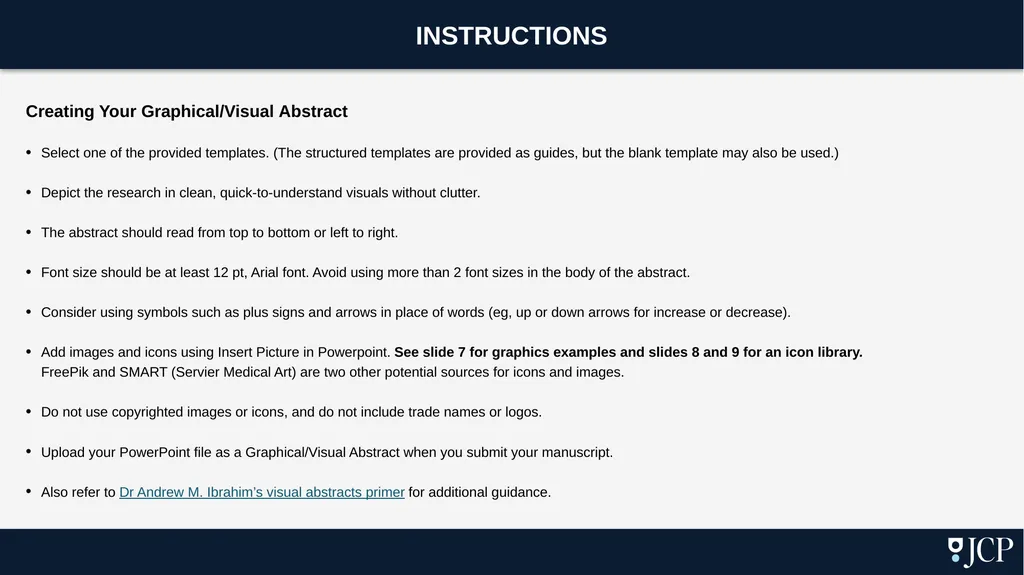
INSTRUCTIONS Creating Your Graphical/Visual Abstract
Select one of the provided templates. (The structured templates are provided as guides, but the blank template may also be used.)
Depict the research in clean, quick-to-understand visuals without clutter.
The abstract should read from top to bottom or left to right.
Font size should be at least 12 pt, Arial font. Avoid using more than 2 font sizes in the body of the abstract.
Consider using symbols such as plus signs and arrows in place of words (eg, up or down arrows for increase or decrease).
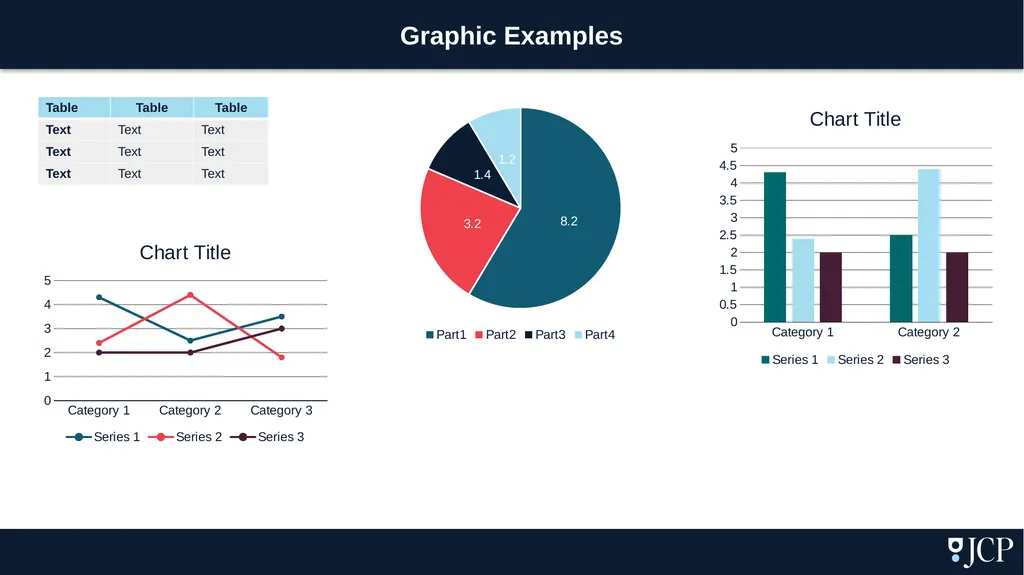
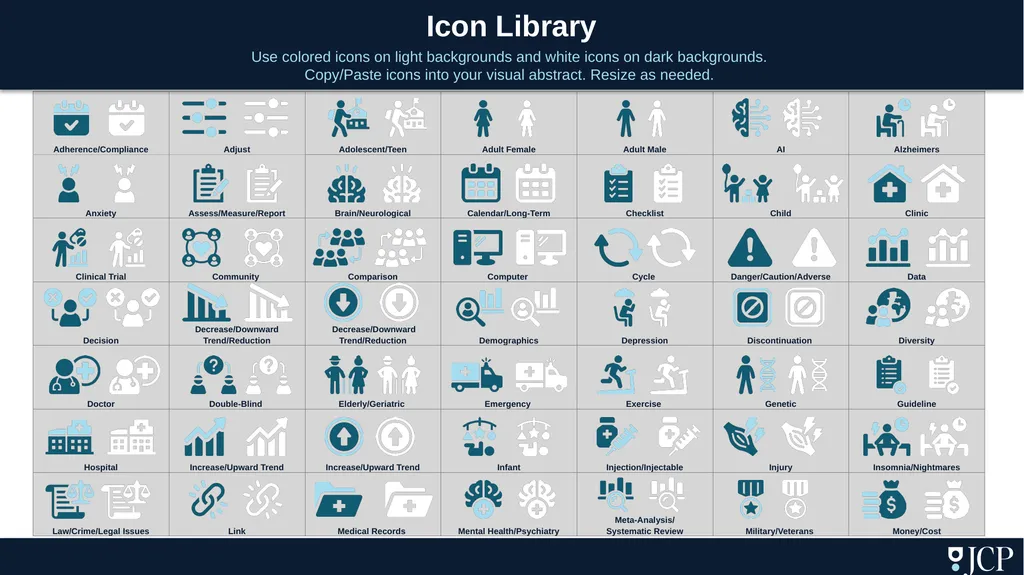
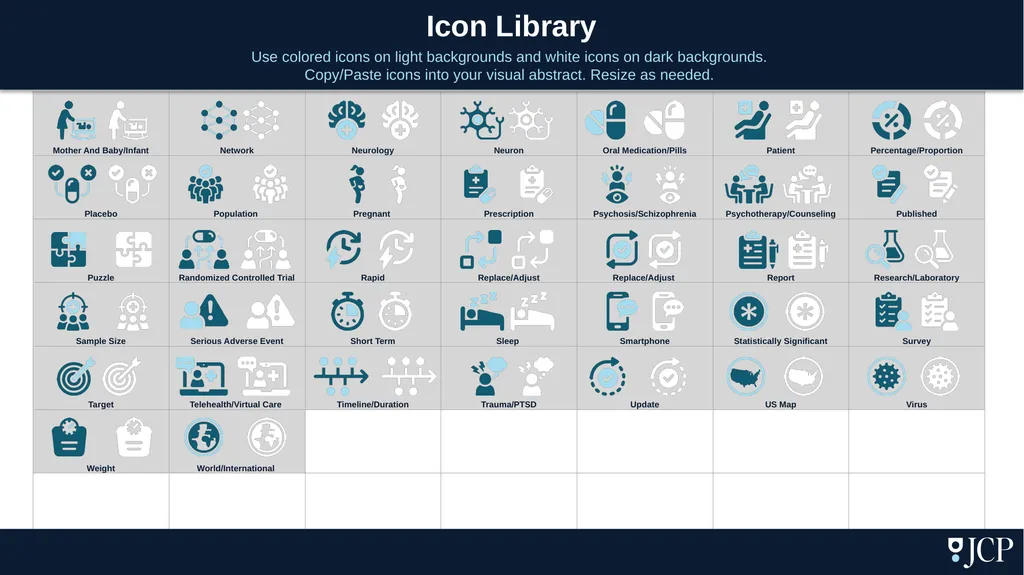
Add images and icons using Insert Picture in Powerpoint. See slide 7 for graphics examples and slides 8 and 9 for an icon library. FreePik and SMART (Servier Medical Art) are two other potential sources for icons and images.
Do not use copyrighted images or icons, and do not include trade names or logos.
Upload your PowerPoint file as a Graphical/Visual Abstract when you submit your manuscript.
Also refer to Dr Andrew M. Ibrahim’s visual abstracts primer for additional guidance.<br>
03
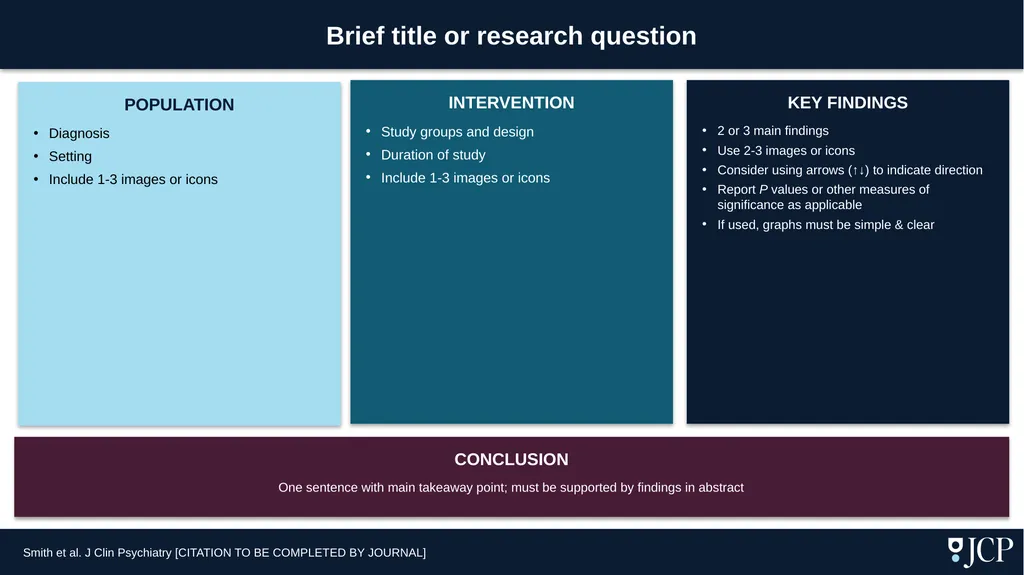
Brief title or research question POPULATION
Diagnosis
Setting
Include 1-3 images or icons INTERVENTION
Study groups and design
Duration of study
Include 1-3 images or icons KEY FINDINGS
2 or 3 main findings
Use 2-3 images or icons
Consider using arrows (↑↓) to indicate direction
Report P values or other measures of significance as applicable
If used, graphs must be simple & clear CONCLUSION
One sentence with main takeaway point; must be supported by findings in abstract Smith et al. J Clin Psychiatry [CITATION TO BE COMPLETED BY JOURNAL]<br>
04
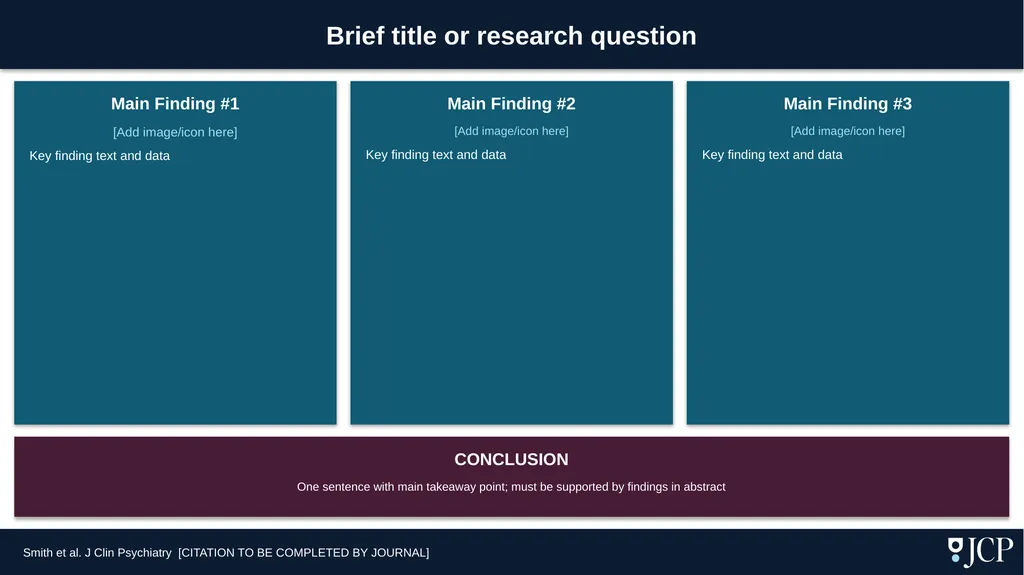
Main Finding #1
[Add image/icon here]
Key finding text and data Main Finding #2
[Add image/icon here]
Key finding text and data Main Finding #3
[Add image/icon here]
Key finding text and data Brief title or research question Smith et al. J Clin Psychiatry [CITATION TO BE COMPLETED BY JOURNAL] CONCLUSION
One sentence with main takeaway point; must be supported by findings in abstract<br>
05
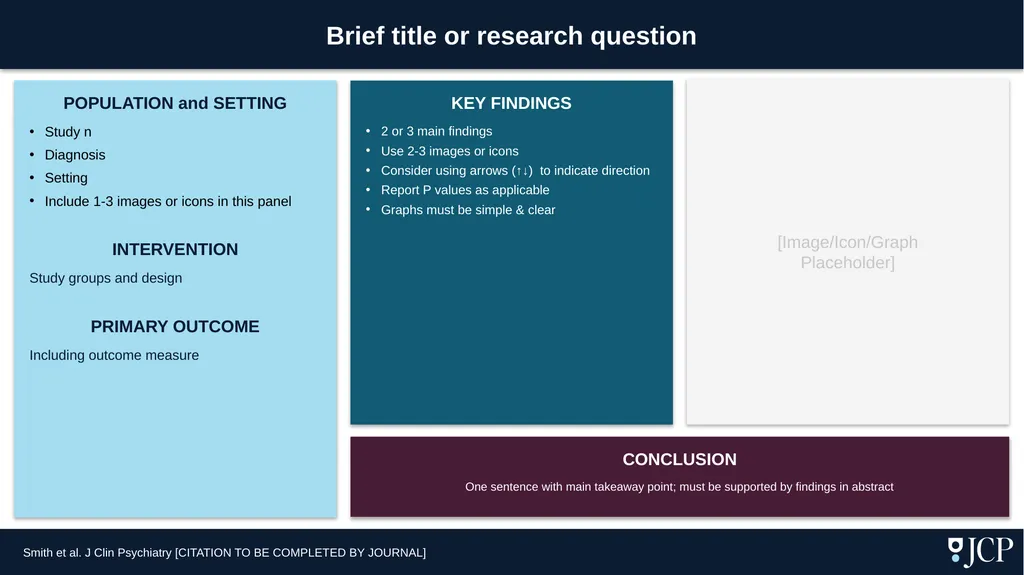
Brief title or research question KEY FINDINGS
2 or 3 main findings
Use 2-3 images or icons
Consider using arrows (↑↓) to indicate direction
Report P values as applicable
Graphs must be simple & clear [Image/Icon/Graph Placeholder] Smith et al. J Clin Psychiatry [CITATION TO BE COMPLETED BY JOURNAL] POPULATION and SETTING
Study n
Diagnosis
Setting
Include 1-3 images or icons in this panel
INTERVENTION
Study groups and design
PRIMARY OUTCOME
Including outcome measure CONCLUSION
One sentence with main takeaway point; must be supported by findings in abstract<br>
06
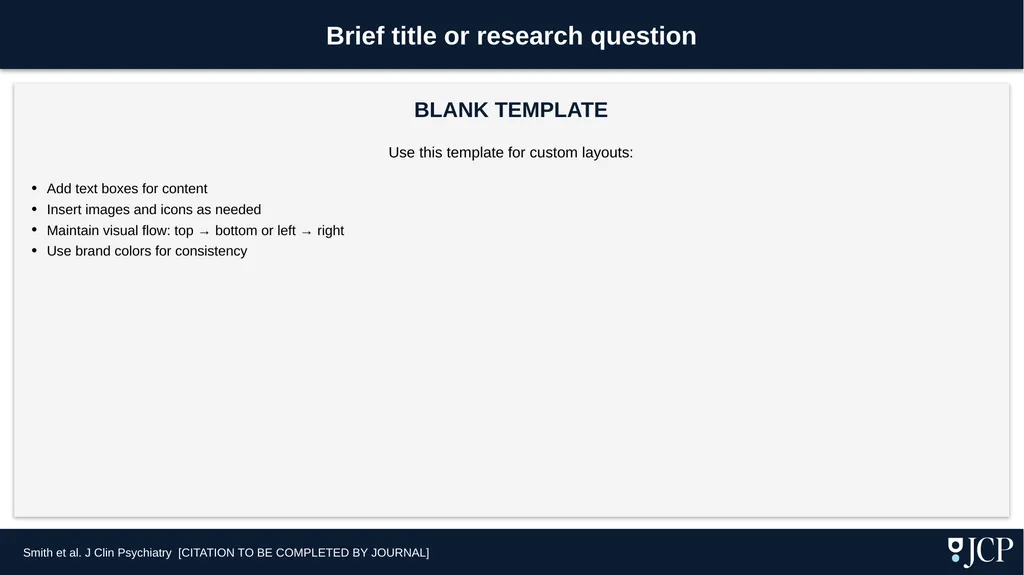
BLANK TEMPLATE
Use this template for custom layouts:
Add text boxes for content
Insert images and icons as needed
Maintain visual flow: top → bottom or left → right
Use brand colors for consistency Brief title or research question Smith et al. J Clin Psychiatry [CITATION TO BE COMPLETED BY JOURNAL]<br>
07
Graphic Examples<br>
08
Icon Library
Use colored icons on light backgrounds and white icons on dark backgrounds. Copy/Paste icons into your visual abstract. Resize as needed.<br>
09
Icon Library
Use colored icons on light backgrounds and white icons on dark backgrounds. Copy/Paste icons into your visual abstract. Resize as needed.<br>