
Graphics Generator Webinar #1 AHPS Products Hank
PM
Published · 47 slides · 0 views

1 / 1

Description
Graphics Generator Webinar 1 AHPS Products Hank Herr Objective of Webinars: Assist RFCs in moving off of ESPADP FogBugz 1606: Changes to AHPS templates Including HS Ensembles Including Thresholds Adding a Rating Curve Axis Creating a
Related Topics
Share
Embed code
Download this presentation From Below
"Graphics Generator Webinar #1 AHPS Products Hank" is the property of its rightful owner. Permission is granted to download and print the materials on this website for personal, non-commercial use only, and to display it on your personal computer provided you do not modify the materials and that you retain all copyright notices contained in the materials. By downloading content from our website, you accept the terms of this agreement.
Presentation Transcript
01
Graphics Generator
Webinar #1 AHPS Products Hank Herr<br>
02
Objective of Webinars: Assist RFCs in moving off of ESPADP
FogBugz 1606: Changes to AHPS templates
Including HS Ensembles
Including Thresholds
Adding a Rating Curve Axis
Creating a Workflow
Tabular Output
Questions? Outline Office of Hydrologic Development
Silver Spring, MD ‹#›<br>
FogBugz 1606: Changes to AHPS templates
Including HS Ensembles
Including Thresholds
Adding a Rating Curve Axis
Creating a Workflow
Tabular Output
Questions? Outline Office of Hydrologic Development
Silver Spring, MD ‹#›<br>
03
This webinar makes use of the GraphGen Editor Panel
Products and settings XML will not be edited during this presentation
Why? What are the advantages of the Editor?
The XML was never designed to edited by hand
Templates and settings were originally going to be stored invisibly within the CHPS database
No schema has been delivered
The Editor removes the possibility of bad XML configuration
The Editor provides immediate feedback for any changes made
XML editing requires that templates and settings be reloaded/refreshed with every change
The Editor makes it easy to spot when and where problems occur
Tabs indicate if errors are found
Error messages are displayed in the right-hand panels and Logs Panel
Other features allow for readily identifying issues with thresholds, rating curves, etc.
When is it reasonable to edit the XML by hand?
If you create a new product that appears much like an existing product, it may be easier to create it through manually editing the XML
Hank’s Opinion: I would still use the Editor and think about creating referenced templates
If you need to make a change to many templates at one time that can be done through a simple find-replace in the XML ‹#› GraphGen Editor vs. XML Office of Hydrologic Development
Silver Spring, MD<br>
Products and settings XML will not be edited during this presentation
Why? What are the advantages of the Editor?
The XML was never designed to edited by hand
Templates and settings were originally going to be stored invisibly within the CHPS database
No schema has been delivered
The Editor removes the possibility of bad XML configuration
The Editor provides immediate feedback for any changes made
XML editing requires that templates and settings be reloaded/refreshed with every change
The Editor makes it easy to spot when and where problems occur
Tabs indicate if errors are found
Error messages are displayed in the right-hand panels and Logs Panel
Other features allow for readily identifying issues with thresholds, rating curves, etc.
When is it reasonable to edit the XML by hand?
If you create a new product that appears much like an existing product, it may be easier to create it through manually editing the XML
Hank’s Opinion: I would still use the Editor and think about creating referenced templates
If you need to make a change to many templates at one time that can be done through a simple find-replace in the XML ‹#› GraphGen Editor vs. XML Office of Hydrologic Development
Silver Spring, MD<br>
04
FogBugz 1606 includes changes to the AHPS templates to be delivered with CHPS 5.1.1
Fixed the legend title for the spaghetti plots
Ensured that all volume AHPS aggregations are preceded by a 24-hour daily mean computation
Fix will result in a slight change in computed volumes whenever the flow recorded at T0 is not included in the ESP ensemble
You should either import the new templates delivered with the next release or implement the changes yourself
See the FogBugz for instructions on making the change yourself ‹#› FogBugz 1606 Office of Hydrologic Development
Silver Spring, MD<br>
Fixed the legend title for the spaghetti plots
Ensured that all volume AHPS aggregations are preceded by a 24-hour daily mean computation
Fix will result in a slight change in computed volumes whenever the flow recorded at T0 is not included in the ESP ensemble
You should either import the new templates delivered with the next release or implement the changes yourself
See the FogBugz for instructions on making the change yourself ‹#› FogBugz 1606 Office of Hydrologic Development
Silver Spring, MD<br>
05
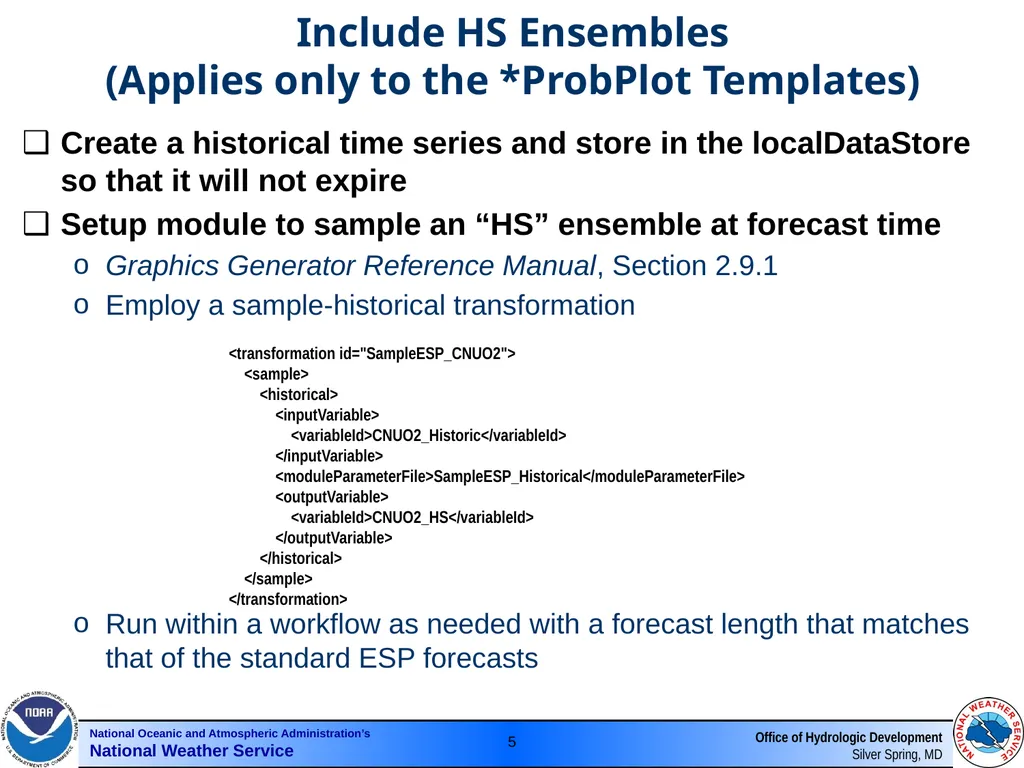
Create a historical time series and store in the localDataStore so that it will not expire
Setup module to sample an “HS” ensemble at forecast time
Graphics Generator Reference Manual, Section 2.9.1
Employ a sample-historical transformation
Run within a workflow as needed with a forecast length that matches that of the standard ESP forecasts ‹#› Include HS Ensembles (Applies only to the *ProbPlot Templates) Office of Hydrologic Development
Silver Spring, MD <transformation id="SampleESP_CNUO2">
<sample>
<historical>
<inputVariable>
<variableId>CNUO2_Historic</variableId>
</inputVariable>
<moduleParameterFile>SampleESP_Historical</moduleParameterFile>
<outputVariable>
<variableId>CNUO2_HS</variableId>
</outputVariable>
</historical>
</sample>
</transformation><br>
Setup module to sample an “HS” ensemble at forecast time
Graphics Generator Reference Manual, Section 2.9.1
Employ a sample-historical transformation
Run within a workflow as needed with a forecast length that matches that of the standard ESP forecasts ‹#› Include HS Ensembles (Applies only to the *ProbPlot Templates) Office of Hydrologic Development
Silver Spring, MD <transformation id="SampleESP_CNUO2">
<sample>
<historical>
<inputVariable>
<variableId>CNUO2_Historic</variableId>
</inputVariable>
<moduleParameterFile>SampleESP_Historical</moduleParameterFile>
<outputVariable>
<variableId>CNUO2_HS</variableId>
</outputVariable>
</historical>
</sample>
</transformation><br>
06
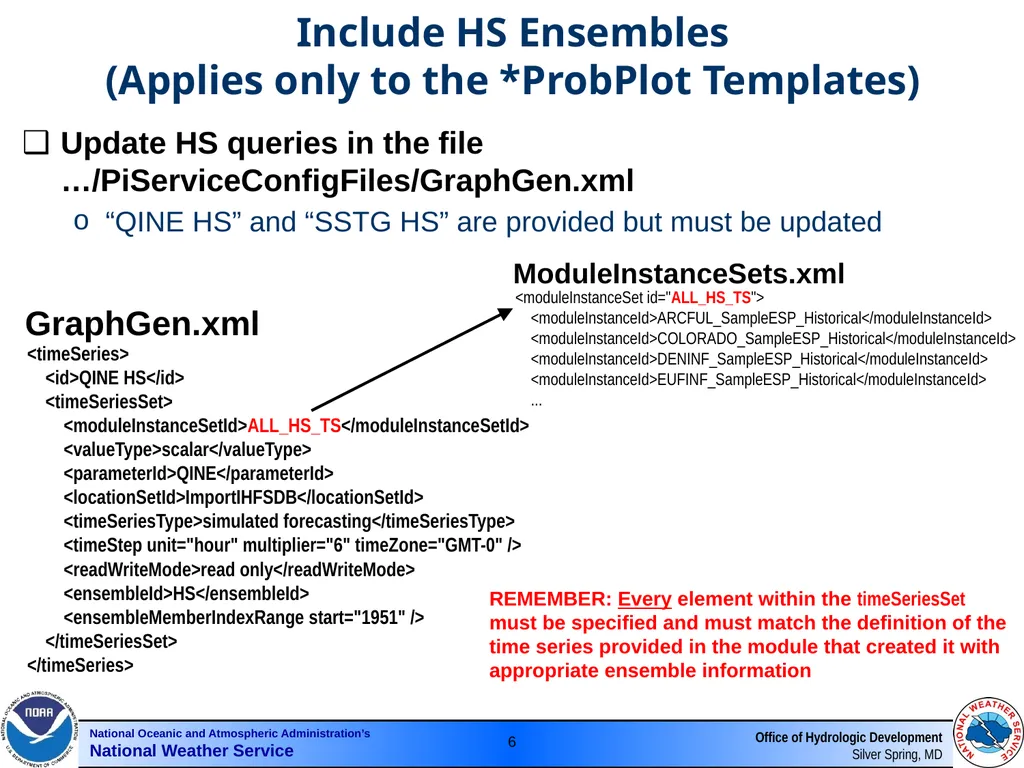
Update HS queries in the file …/PiServiceConfigFiles/GraphGen.xml
“QINE HS” and “SSTG HS” are provided but must be updated ‹#› Include HS Ensembles (Applies only to the *ProbPlot Templates) Office of Hydrologic Development
Silver Spring, MD <timeSeries>
<id>QINE HS</id>
<timeSeriesSet>
<moduleInstanceSetId>ALL_HS_TS</moduleInstanceSetId>
<valueType>scalar</valueType>
<parameterId>QINE</parameterId>
<locationSetId>ImportIHFSDB</locationSetId>
<timeSeriesType>simulated forecasting</timeSeriesType>
<timeStep unit="hour" multiplier="6" timeZone="GMT-0" />
<readWriteMode>read only</readWriteMode>
<ensembleId>HS</ensembleId>
<ensembleMemberIndexRange start="1951" />
</timeSeriesSet>
</timeSeries> <moduleInstanceSet id="ALL_HS_TS">
<moduleInstanceId>ARCFUL_SampleESP_Historical</moduleInstanceId>
<moduleInstanceId>COLORADO_SampleESP_Historical</moduleInstanceId>
<moduleInstanceId>DENINF_SampleESP_Historical</moduleInstanceId>
<moduleInstanceId>EUFINF_SampleESP_Historical</moduleInstanceId>
... ModuleInstanceSets.xml GraphGen.xml REMEMBER: Every element within the timeSeriesSet must be specified and must match the definition of the time series provided in the module that created it with appropriate ensemble information<br>
“QINE HS” and “SSTG HS” are provided but must be updated ‹#› Include HS Ensembles (Applies only to the *ProbPlot Templates) Office of Hydrologic Development
Silver Spring, MD <timeSeries>
<id>QINE HS</id>
<timeSeriesSet>
<moduleInstanceSetId>ALL_HS_TS</moduleInstanceSetId>
<valueType>scalar</valueType>
<parameterId>QINE</parameterId>
<locationSetId>ImportIHFSDB</locationSetId>
<timeSeriesType>simulated forecasting</timeSeriesType>
<timeStep unit="hour" multiplier="6" timeZone="GMT-0" />
<readWriteMode>read only</readWriteMode>
<ensembleId>HS</ensembleId>
<ensembleMemberIndexRange start="1951" />
</timeSeriesSet>
</timeSeries> <moduleInstanceSet id="ALL_HS_TS">
<moduleInstanceId>ARCFUL_SampleESP_Historical</moduleInstanceId>
<moduleInstanceId>COLORADO_SampleESP_Historical</moduleInstanceId>
<moduleInstanceId>DENINF_SampleESP_Historical</moduleInstanceId>
<moduleInstanceId>EUFINF_SampleESP_Historical</moduleInstanceId>
... ModuleInstanceSets.xml GraphGen.xml REMEMBER: Every element within the timeSeriesSet must be specified and must match the definition of the time series provided in the module that created it with appropriate ensemble information<br>
07
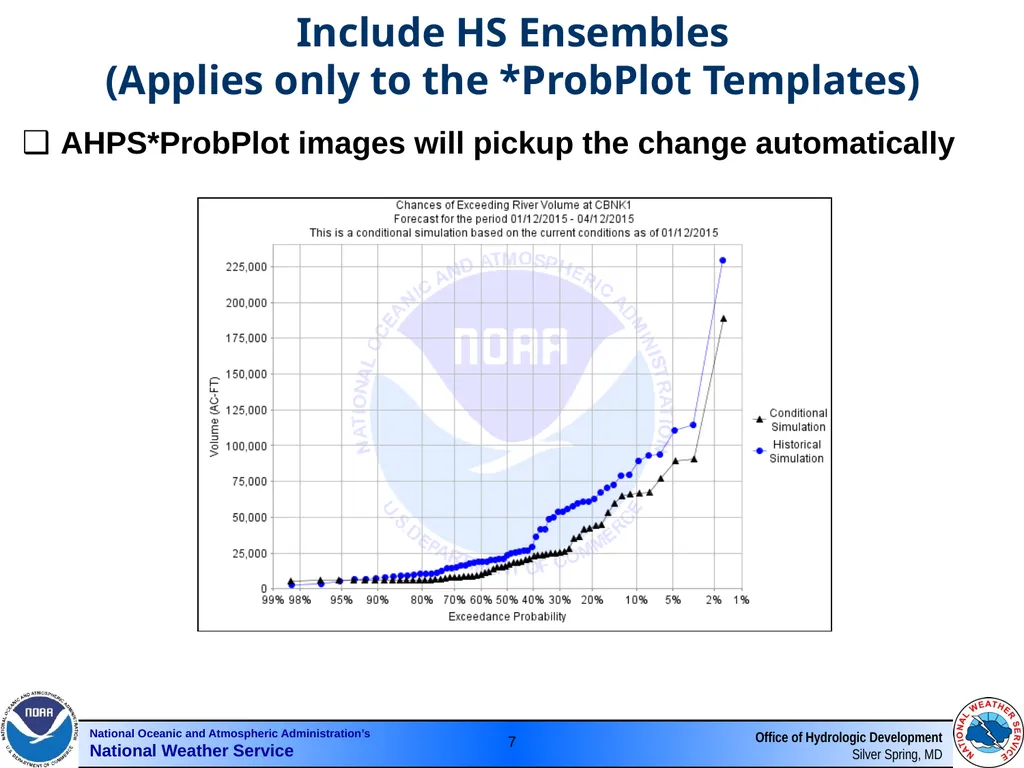
AHPS*ProbPlot images will pickup the change automatically ‹#› Include HS Ensembles
(Applies only to the *ProbPlot Templates) Office of Hydrologic Development
Silver Spring, MD<br>
Silver Spring, MD<br>
08
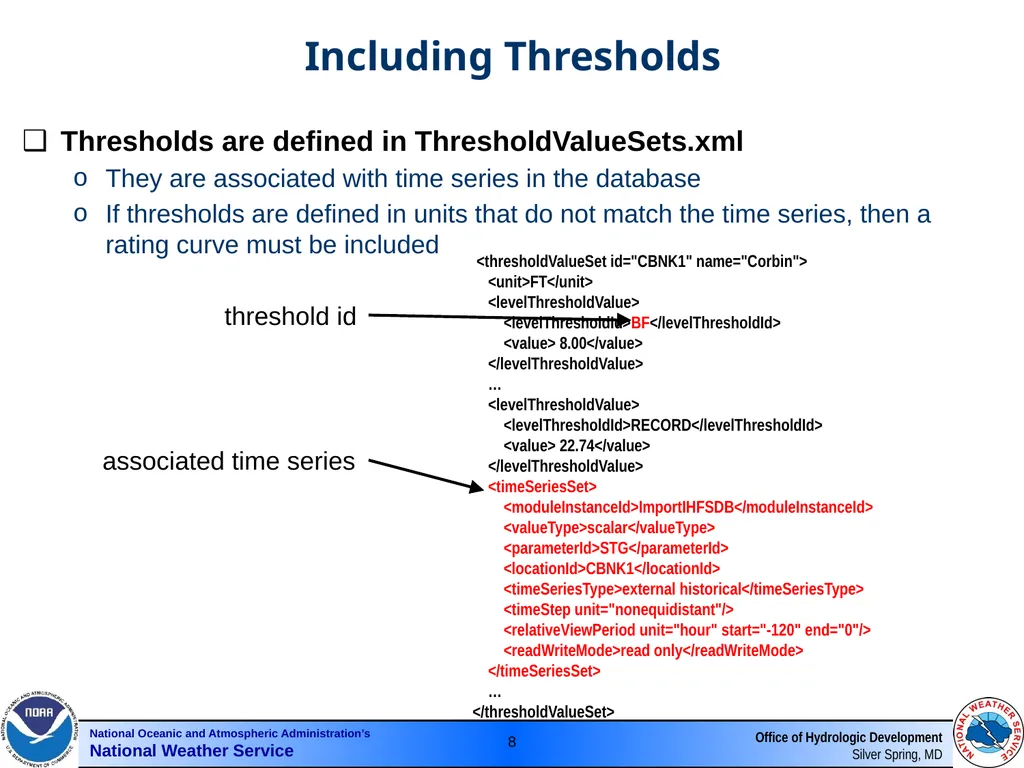
Thresholds are defined in ThresholdValueSets.xml
They are associated with time series in the database
If thresholds are defined in units that do not match the time series, then a rating curve must be included ‹#› Including Thresholds Office of Hydrologic Development
Silver Spring, MD <thresholdValueSet id="CBNK1" name="Corbin">
<unit>FT</unit>
<levelThresholdValue>
<levelThresholdId>BF</levelThresholdId>
<value> 8.00</value>
</levelThresholdValue>
…
<levelThresholdValue>
<levelThresholdId>RECORD</levelThresholdId>
<value> 22.74</value>
</levelThresholdValue>
<timeSeriesSet>
<moduleInstanceId>ImportIHFSDB</moduleInstanceId>
<valueType>scalar</valueType>
<parameterId>STG</parameterId>
<locationId>CBNK1</locationId>
<timeSeriesType>external historical</timeSeriesType>
<timeStep unit="nonequidistant"/>
<relativeViewPeriod unit="hour" start="-120" end="0"/>
<readWriteMode>read only</readWriteMode>
</timeSeriesSet>
…
</thresholdValueSet> threshold id associated time series<br>
They are associated with time series in the database
If thresholds are defined in units that do not match the time series, then a rating curve must be included ‹#› Including Thresholds Office of Hydrologic Development
Silver Spring, MD <thresholdValueSet id="CBNK1" name="Corbin">
<unit>FT</unit>
<levelThresholdValue>
<levelThresholdId>BF</levelThresholdId>
<value> 8.00</value>
</levelThresholdValue>
…
<levelThresholdValue>
<levelThresholdId>RECORD</levelThresholdId>
<value> 22.74</value>
</levelThresholdValue>
<timeSeriesSet>
<moduleInstanceId>ImportIHFSDB</moduleInstanceId>
<valueType>scalar</valueType>
<parameterId>STG</parameterId>
<locationId>CBNK1</locationId>
<timeSeriesType>external historical</timeSeriesType>
<timeStep unit="nonequidistant"/>
<relativeViewPeriod unit="hour" start="-120" end="0"/>
<readWriteMode>read only</readWriteMode>
</timeSeriesSet>
…
</thresholdValueSet> threshold id associated time series<br>
09
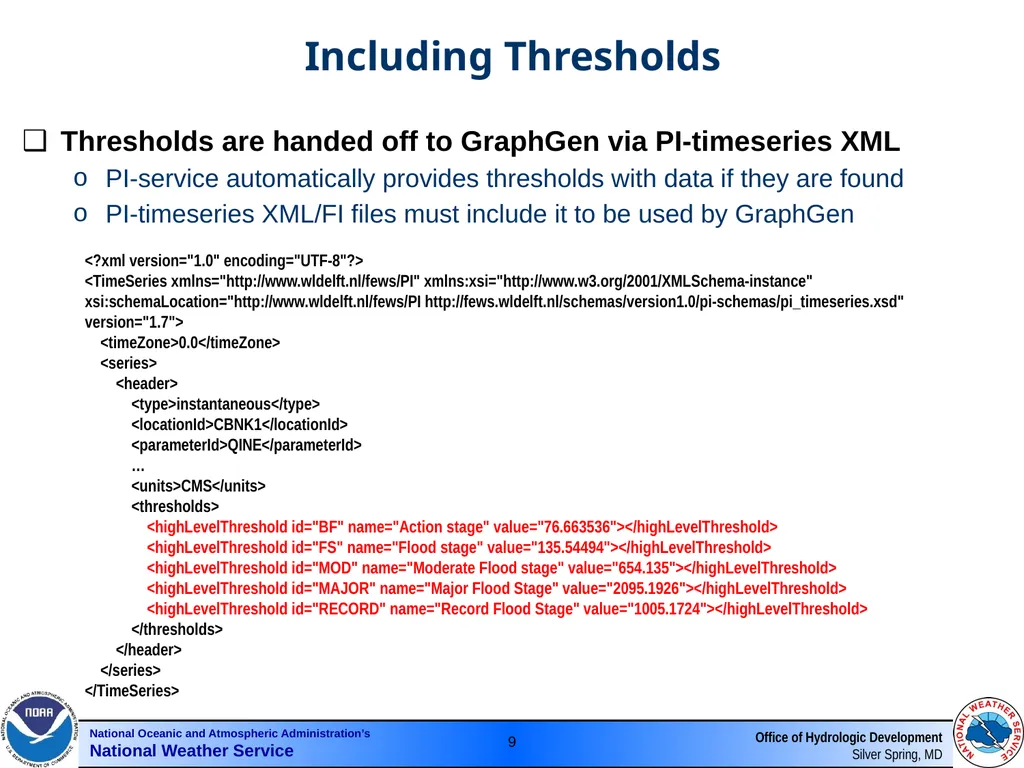
Thresholds are handed off to GraphGen via PI-timeseries XML
PI-service automatically provides thresholds with data if they are found
PI-timeseries XML/FI files must include it to be used by GraphGen ‹#› Including Thresholds Office of Hydrologic Development
Silver Spring, MD <?xml version="1.0" encoding="UTF-8"?>
<TimeSeries xmlns="http://www.wldelft.nl/fews/PI" xmlns:xsi="http://www.w3.org/2001/XMLSchema-instance" xsi:schemaLocation="http://www.wldelft.nl/fews/PI http://fews.wldelft.nl/schemas/version1.0/pi-schemas/pi_timeseries.xsd" version="1.7">
<timeZone>0.0</timeZone>
<series>
<header>
<type>instantaneous</type>
<locationId>CBNK1</locationId>
<parameterId>QINE</parameterId>
…
<units>CMS</units>
<thresholds>
<highLevelThreshold id="BF" name="Action stage" value="76.663536"></highLevelThreshold>
<highLevelThreshold id="FS" name="Flood stage" value="135.54494"></highLevelThreshold>
<highLevelThreshold id="MOD" name="Moderate Flood stage" value="654.135"></highLevelThreshold>
<highLevelThreshold id="MAJOR" name="Major Flood Stage" value="2095.1926"></highLevelThreshold>
<highLevelThreshold id="RECORD" name="Record Flood Stage" value="1005.1724"></highLevelThreshold>
</thresholds>
</header>
</series>
</TimeSeries><br>
PI-service automatically provides thresholds with data if they are found
PI-timeseries XML/FI files must include it to be used by GraphGen ‹#› Including Thresholds Office of Hydrologic Development
Silver Spring, MD <?xml version="1.0" encoding="UTF-8"?>
<TimeSeries xmlns="http://www.wldelft.nl/fews/PI" xmlns:xsi="http://www.w3.org/2001/XMLSchema-instance" xsi:schemaLocation="http://www.wldelft.nl/fews/PI http://fews.wldelft.nl/schemas/version1.0/pi-schemas/pi_timeseries.xsd" version="1.7">
<timeZone>0.0</timeZone>
<series>
<header>
<type>instantaneous</type>
<locationId>CBNK1</locationId>
<parameterId>QINE</parameterId>
…
<units>CMS</units>
<thresholds>
<highLevelThreshold id="BF" name="Action stage" value="76.663536"></highLevelThreshold>
<highLevelThreshold id="FS" name="Flood stage" value="135.54494"></highLevelThreshold>
<highLevelThreshold id="MOD" name="Moderate Flood stage" value="654.135"></highLevelThreshold>
<highLevelThreshold id="MAJOR" name="Major Flood Stage" value="2095.1926"></highLevelThreshold>
<highLevelThreshold id="RECORD" name="Record Flood Stage" value="1005.1724"></highLevelThreshold>
</thresholds>
</header>
</series>
</TimeSeries><br>
10
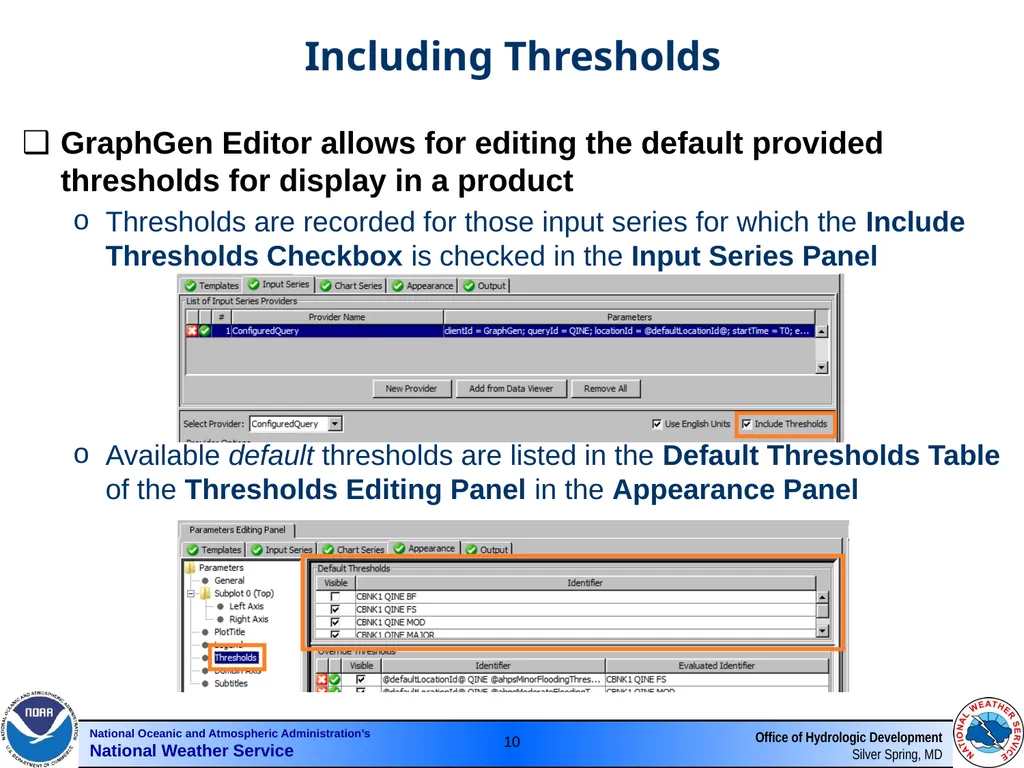
GraphGen Editor allows for editing the default provided thresholds for display in a product
Thresholds are recorded for those input series for which the Include Thresholds Checkbox is checked in the Input Series Panel
Available default thresholds are listed in the Default Thresholds Table of the Thresholds Editing Panel in the Appearance Panel ‹#› Including Thresholds Office of Hydrologic Development
Silver Spring, MD<br>
Thresholds are recorded for those input series for which the Include Thresholds Checkbox is checked in the Input Series Panel
Available default thresholds are listed in the Default Thresholds Table of the Thresholds Editing Panel in the Appearance Panel ‹#› Including Thresholds Office of Hydrologic Development
Silver Spring, MD<br>
11
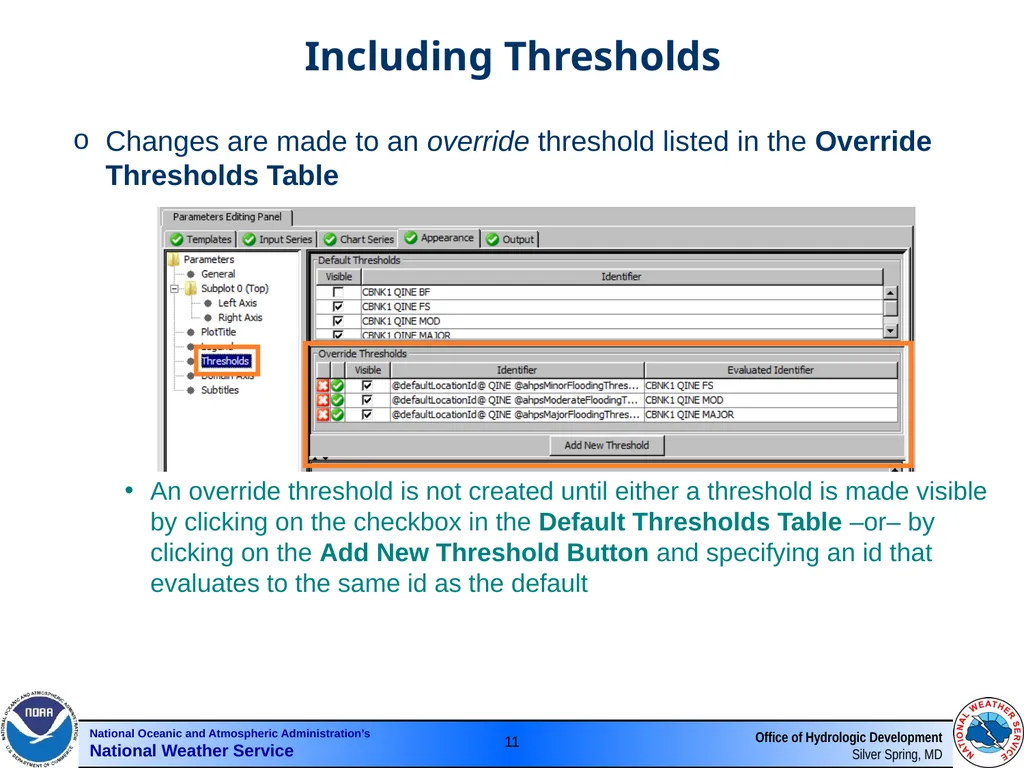
Changes are made to an override threshold listed in the Override Thresholds Table
An override threshold is not created until either a threshold is made visible by clicking on the checkbox in the Default Thresholds Table –or– by clicking on the Add New Threshold Button and specifying an id that evaluates to the same id as the default ‹#› Including Thresholds Office of Hydrologic Development
Silver Spring, MD<br>
An override threshold is not created until either a threshold is made visible by clicking on the checkbox in the Default Thresholds Table –or– by clicking on the Add New Threshold Button and specifying an id that evaluates to the same id as the default ‹#› Including Thresholds Office of Hydrologic Development
Silver Spring, MD<br>
12
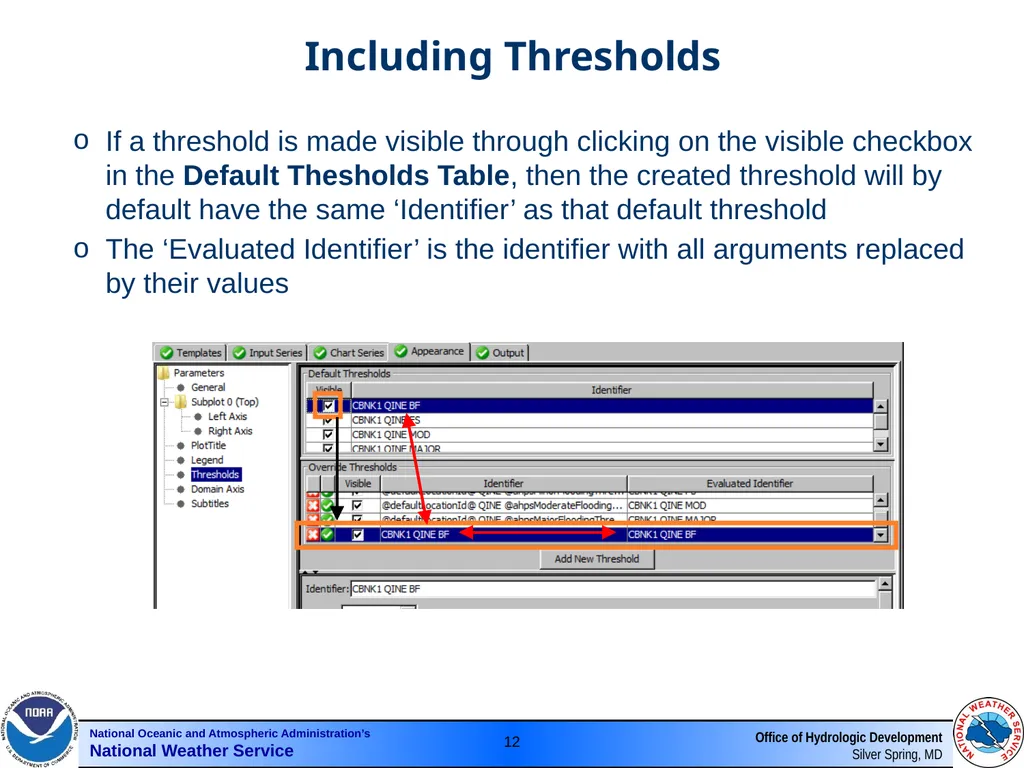
If a threshold is made visible through clicking on the visible checkbox in the Default Thesholds Table, then the created threshold will by default have the same ‘Identifier’ as that default threshold
The ‘Evaluated Identifier’ is the identifier with all arguments replaced by their values ‹#› Including Thresholds Office of Hydrologic Development
Silver Spring, MD<br>
The ‘Evaluated Identifier’ is the identifier with all arguments replaced by their values ‹#› Including Thresholds Office of Hydrologic Development
Silver Spring, MD<br>
13
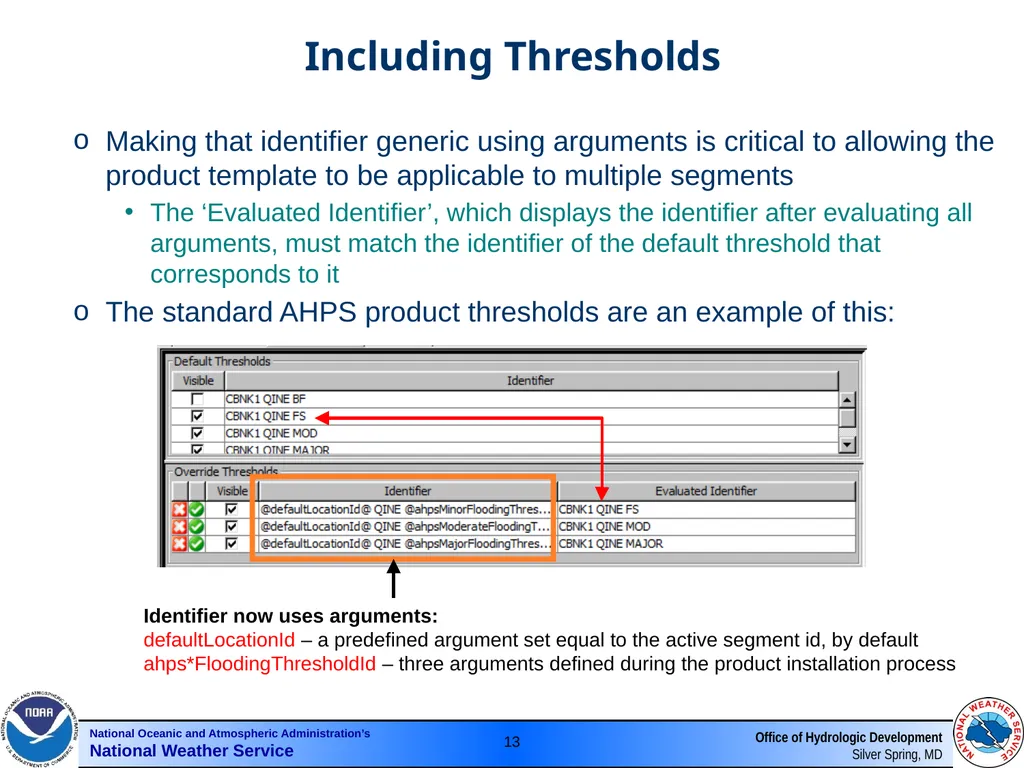
Making that identifier generic using arguments is critical to allowing the product template to be applicable to multiple segments
The ‘Evaluated Identifier’, which displays the identifier after evaluating all arguments, must match the identifier of the default threshold that corresponds to it
The standard AHPS product thresholds are an example of this: ‹#› Including Thresholds Office of Hydrologic Development
Silver Spring, MD Identifier now uses arguments:
defaultLocationId – a predefined argument set equal to the active segment id, by default
ahps*FloodingThresholdId – three arguments defined during the product installation process<br>
The ‘Evaluated Identifier’, which displays the identifier after evaluating all arguments, must match the identifier of the default threshold that corresponds to it
The standard AHPS product thresholds are an example of this: ‹#› Including Thresholds Office of Hydrologic Development
Silver Spring, MD Identifier now uses arguments:
defaultLocationId – a predefined argument set equal to the active segment id, by default
ahps*FloodingThresholdId – three arguments defined during the product installation process<br>
14
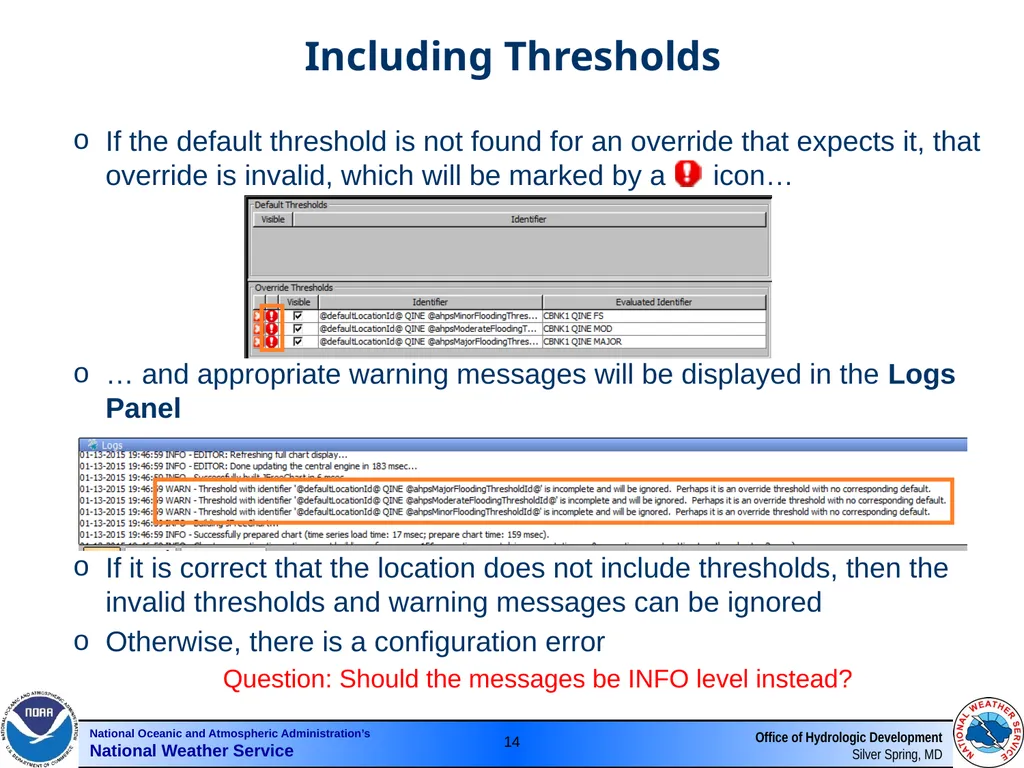
If the default threshold is not found for an override that expects it, that override is invalid, which will be marked by a icon…
… and appropriate warning messages will be displayed in the Logs Panel
If it is correct that the location does not include thresholds, then the invalid thresholds and warning messages can be ignored
Otherwise, there is a configuration error
Question: Should the messages be INFO level instead? ‹#› Including Thresholds Office of Hydrologic Development
Silver Spring, MD<br>
… and appropriate warning messages will be displayed in the Logs Panel
If it is correct that the location does not include thresholds, then the invalid thresholds and warning messages can be ignored
Otherwise, there is a configuration error
Question: Should the messages be INFO level instead? ‹#› Including Thresholds Office of Hydrologic Development
Silver Spring, MD<br>
15
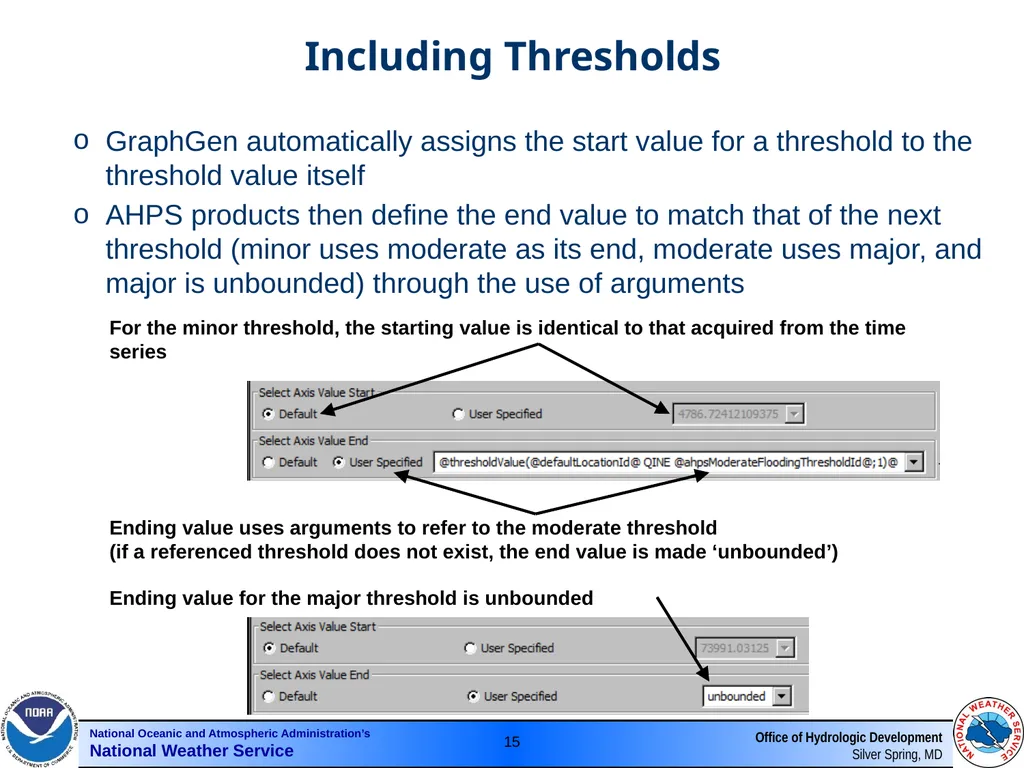
GraphGen automatically assigns the start value for a threshold to the threshold value itself
AHPS products then define the end value to match that of the next threshold (minor uses moderate as its end, moderate uses major, and major is unbounded) through the use of arguments ‹#› Including Thresholds Office of Hydrologic Development
Silver Spring, MD For the minor threshold, the starting value is identical to that acquired from the time series Ending value uses arguments to refer to the moderate threshold
(if a referenced threshold does not exist, the end value is made ‘unbounded’) Ending value for the major threshold is unbounded<br>
AHPS products then define the end value to match that of the next threshold (minor uses moderate as its end, moderate uses major, and major is unbounded) through the use of arguments ‹#› Including Thresholds Office of Hydrologic Development
Silver Spring, MD For the minor threshold, the starting value is identical to that acquired from the time series Ending value uses arguments to refer to the moderate threshold
(if a referenced threshold does not exist, the end value is made ‘unbounded’) Ending value for the major threshold is unbounded<br>
16
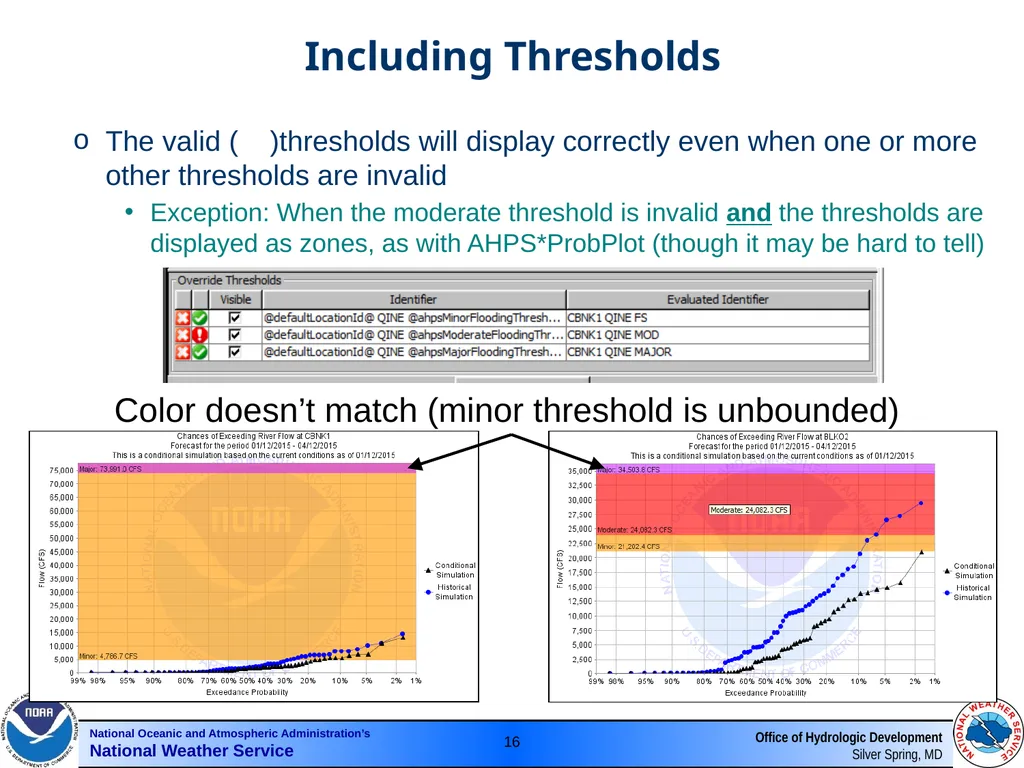
The valid ( )thresholds will display correctly even when one or more other thresholds are invalid
Exception: When the moderate threshold is invalid and the thresholds are displayed as zones, as with AHPS*ProbPlot (though it may be hard to tell) ‹#› Including Thresholds Office of Hydrologic Development
Silver Spring, MD Color doesn’t match (minor threshold is unbounded)<br>
Exception: When the moderate threshold is invalid and the thresholds are displayed as zones, as with AHPS*ProbPlot (though it may be hard to tell) ‹#› Including Thresholds Office of Hydrologic Development
Silver Spring, MD Color doesn’t match (minor threshold is unbounded)<br>
17
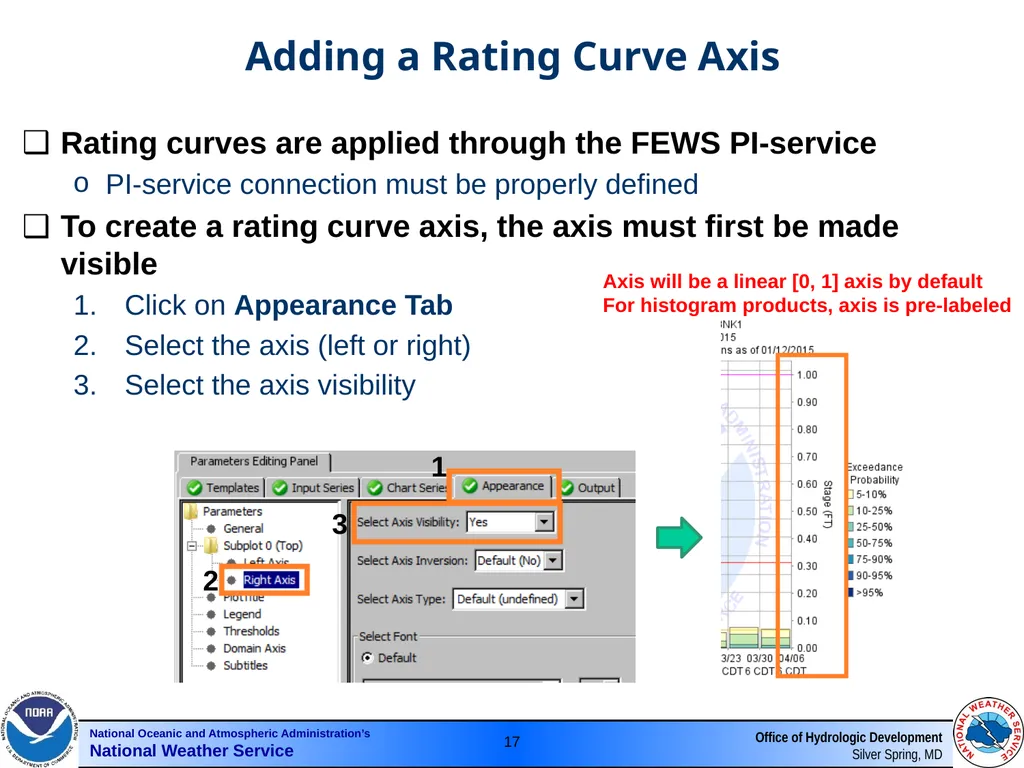
Rating curves are applied through the FEWS PI-service
PI-service connection must be properly defined
To create a rating curve axis, the axis must first be made visible
Click on Appearance Tab
Select the axis (left or right)
Select the axis visibility ‹#› Adding a Rating Curve Axis Office of Hydrologic Development
Silver Spring, MD 1 2 3 Axis will be a linear [0, 1] axis by default
For histogram products, axis is pre-labeled<br>
PI-service connection must be properly defined
To create a rating curve axis, the axis must first be made visible
Click on Appearance Tab
Select the axis (left or right)
Select the axis visibility ‹#› Adding a Rating Curve Axis Office of Hydrologic Development
Silver Spring, MD 1 2 3 Axis will be a linear [0, 1] axis by default
For histogram products, axis is pre-labeled<br>
18
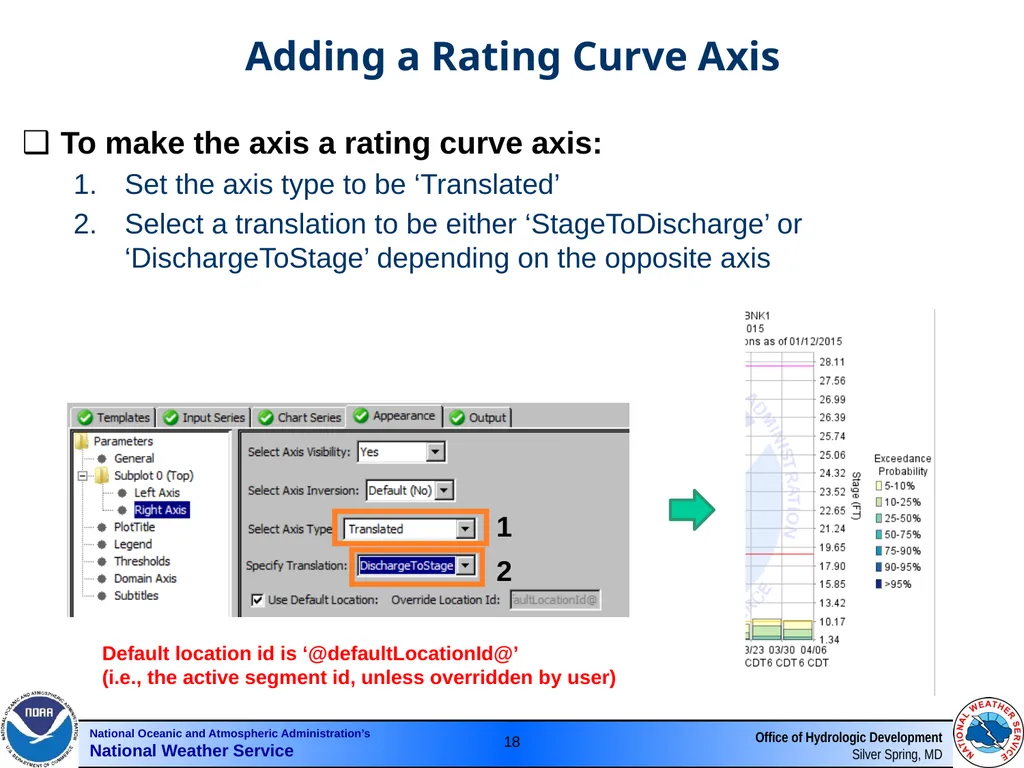
To make the axis a rating curve axis:
Set the axis type to be ‘Translated’
Select a translation to be either ‘StageToDischarge’ or ‘DischargeToStage’ depending on the opposite axis ‹#› Adding a Rating Curve Axis Office of Hydrologic Development
Silver Spring, MD 1 2 Default location id is ‘@defaultLocationId@’
(i.e., the active segment id, unless overridden by user)<br>
Set the axis type to be ‘Translated’
Select a translation to be either ‘StageToDischarge’ or ‘DischargeToStage’ depending on the opposite axis ‹#› Adding a Rating Curve Axis Office of Hydrologic Development
Silver Spring, MD 1 2 Default location id is ‘@defaultLocationId@’
(i.e., the active segment id, unless overridden by user)<br>
19
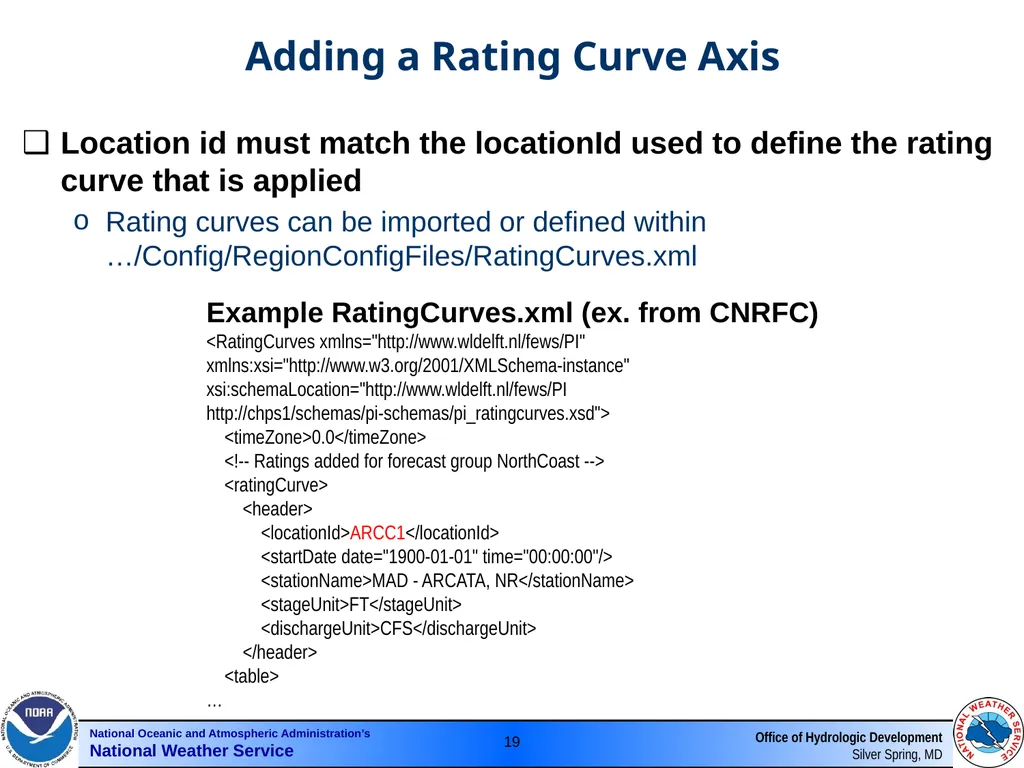
Location id must match the locationId used to define the rating curve that is applied
Rating curves can be imported or defined within …/Config/RegionConfigFiles/RatingCurves.xml ‹#› Adding a Rating Curve Axis Office of Hydrologic Development
Silver Spring, MD Example RatingCurves.xml (ex. from CNRFC)
<RatingCurves xmlns="http://www.wldelft.nl/fews/PI" xmlns:xsi="http://www.w3.org/2001/XMLSchema-instance" xsi:schemaLocation="http://www.wldelft.nl/fews/PI http://chps1/schemas/pi-schemas/pi_ratingcurves.xsd">
<timeZone>0.0</timeZone>
<!-- Ratings added for forecast group NorthCoast -->
<ratingCurve>
<header>
<locationId>ARCC1</locationId>
<startDate date="1900-01-01" time="00:00:00"/>
<stationName>MAD - ARCATA, NR</stationName>
<stageUnit>FT</stageUnit>
<dischargeUnit>CFS</dischargeUnit>
</header>
<table>
…<br>
Rating curves can be imported or defined within …/Config/RegionConfigFiles/RatingCurves.xml ‹#› Adding a Rating Curve Axis Office of Hydrologic Development
Silver Spring, MD Example RatingCurves.xml (ex. from CNRFC)
<RatingCurves xmlns="http://www.wldelft.nl/fews/PI" xmlns:xsi="http://www.w3.org/2001/XMLSchema-instance" xsi:schemaLocation="http://www.wldelft.nl/fews/PI http://chps1/schemas/pi-schemas/pi_ratingcurves.xsd">
<timeZone>0.0</timeZone>
<!-- Ratings added for forecast group NorthCoast -->
<ratingCurve>
<header>
<locationId>ARCC1</locationId>
<startDate date="1900-01-01" time="00:00:00"/>
<stationName>MAD - ARCATA, NR</stationName>
<stageUnit>FT</stageUnit>
<dischargeUnit>CFS</dischargeUnit>
</header>
<table>
…<br>
20
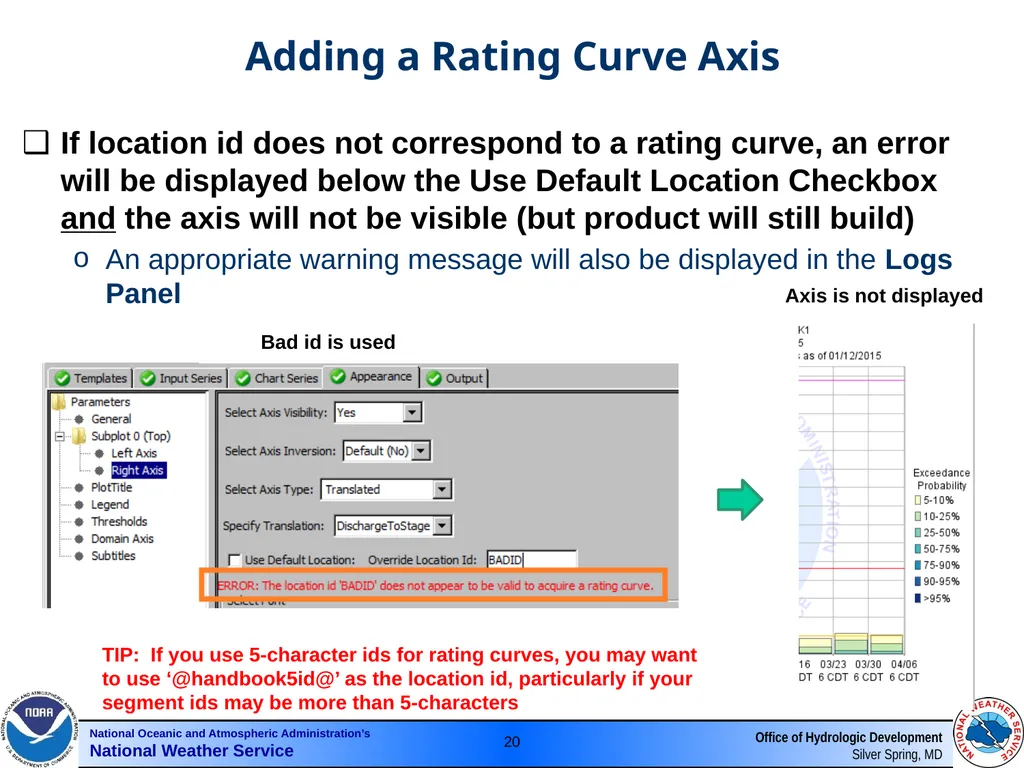
If location id does not correspond to a rating curve, an error will be displayed below the Use Default Location Checkbox and the axis will not be visible (but product will still build)
An appropriate warning message will also be displayed in the Logs Panel ‹#› Adding a Rating Curve Axis Office of Hydrologic Development
Silver Spring, MD Axis is not displayed Bad id is used TIP: If you use 5-character ids for rating curves, you may want to use ‘@handbook5id@’ as the location id, particularly if your segment ids may be more than 5-characters<br>
An appropriate warning message will also be displayed in the Logs Panel ‹#› Adding a Rating Curve Axis Office of Hydrologic Development
Silver Spring, MD Axis is not displayed Bad id is used TIP: If you use 5-character ids for rating curves, you may want to use ‘@handbook5id@’ as the location id, particularly if your segment ids may be more than 5-characters<br>
21
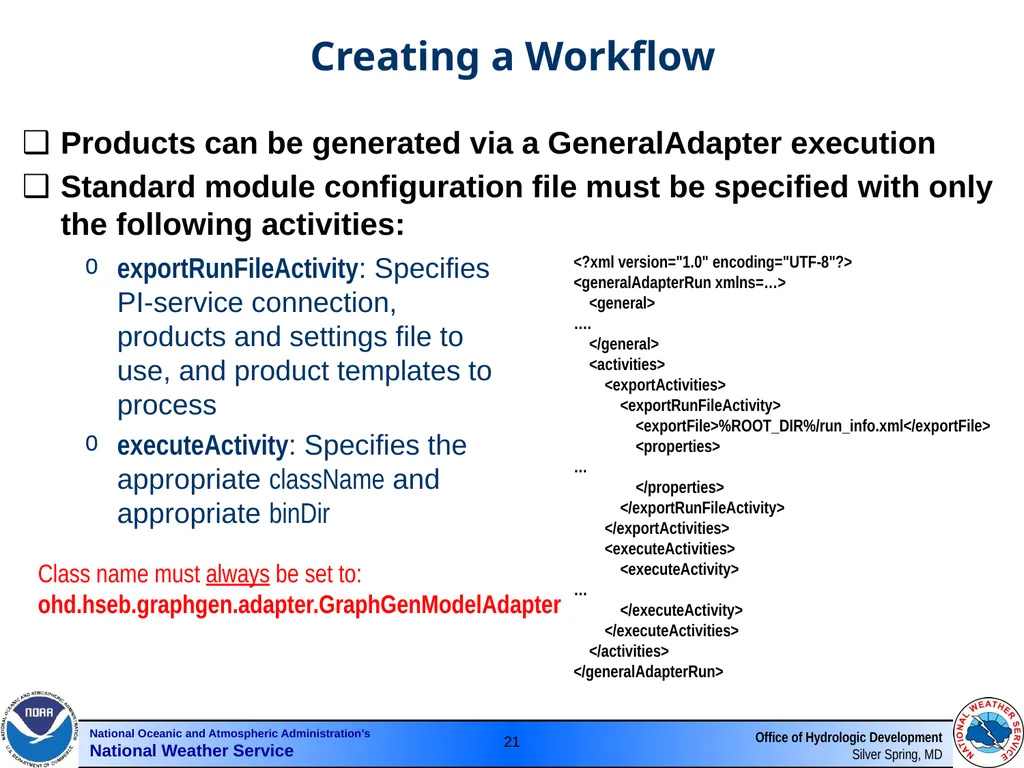
Products can be generated via a GeneralAdapter execution
Standard module configuration file must be specified with only the following activities: ‹#› Creating a Workflow Office of Hydrologic Development
Silver Spring, MD <?xml version="1.0" encoding="UTF-8"?>
<generalAdapterRun xmlns=…>
<general>
….
</general>
<activities>
<exportActivities>
<exportRunFileActivity>
<exportFile>%ROOT_DIR%/run_info.xml</exportFile>
<properties>
…
</properties>
</exportRunFileActivity>
</exportActivities>
<executeActivities>
<executeActivity>
…
</executeActivity>
</executeActivities>
</activities>
</generalAdapterRun> exportRunFileActivity: Specifies PI-service connection, products and settings file to use, and product templates to process
executeActivity: Specifies the appropriate className and appropriate binDir Class name must always be set to: ohd.hseb.graphgen.adapter.GraphGenModelAdapter<br>
Standard module configuration file must be specified with only the following activities: ‹#› Creating a Workflow Office of Hydrologic Development
Silver Spring, MD <?xml version="1.0" encoding="UTF-8"?>
<generalAdapterRun xmlns=…>
<general>
….
</general>
<activities>
<exportActivities>
<exportRunFileActivity>
<exportFile>%ROOT_DIR%/run_info.xml</exportFile>
<properties>
…
</properties>
</exportRunFileActivity>
</exportActivities>
<executeActivities>
<executeActivity>
…
</executeActivity>
</executeActivities>
</activities>
</generalAdapterRun> exportRunFileActivity: Specifies PI-service connection, products and settings file to use, and product templates to process
executeActivity: Specifies the appropriate className and appropriate binDir Class name must always be set to: ohd.hseb.graphgen.adapter.GraphGenModelAdapter<br>
22
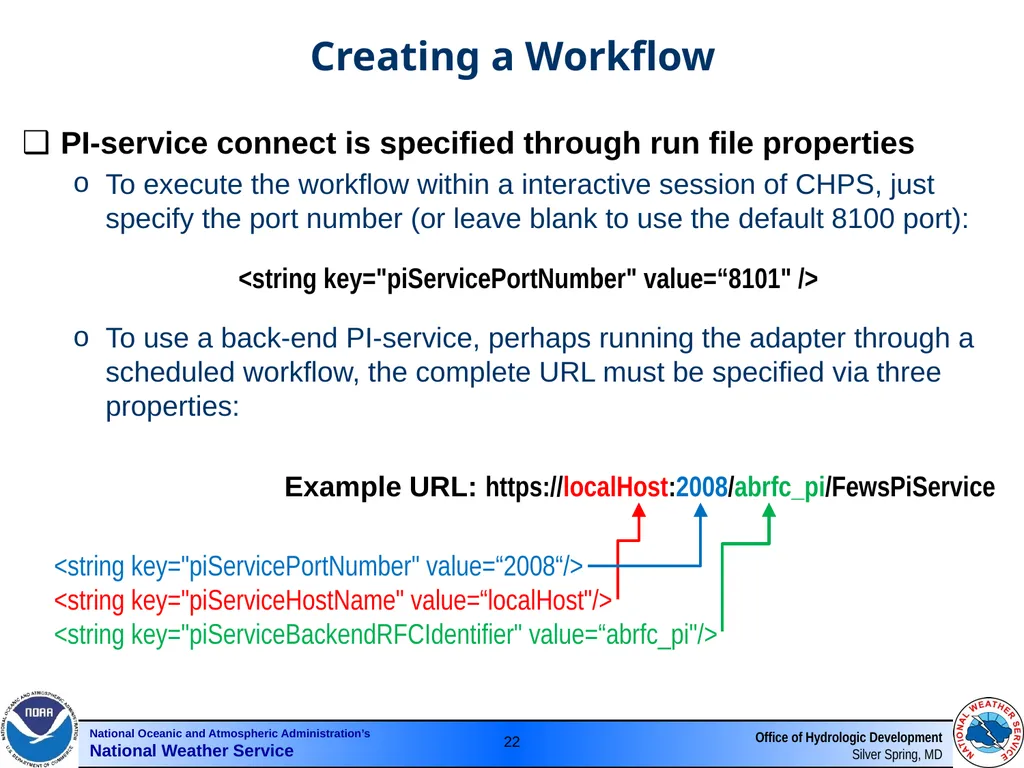
PI-service connect is specified through run file properties
To execute the workflow within a interactive session of CHPS, just specify the port number (or leave blank to use the default 8100 port):
To use a back-end PI-service, perhaps running the adapter through a scheduled workflow, the complete URL must be specified via three properties: ‹#› Creating a Workflow Office of Hydrologic Development
Silver Spring, MD <string key="piServicePortNumber" value=“8101" /> Example URL: https://localHost:2008/abrfc_pi/FewsPiService <string key="piServicePortNumber" value=“2008“/>
<string key="piServiceHostName" value=“localHost"/>
<string key="piServiceBackendRFCIdentifier" value=“abrfc_pi"/><br>
To execute the workflow within a interactive session of CHPS, just specify the port number (or leave blank to use the default 8100 port):
To use a back-end PI-service, perhaps running the adapter through a scheduled workflow, the complete URL must be specified via three properties: ‹#› Creating a Workflow Office of Hydrologic Development
Silver Spring, MD <string key="piServicePortNumber" value=“8101" /> Example URL: https://localHost:2008/abrfc_pi/FewsPiService <string key="piServicePortNumber" value=“2008“/>
<string key="piServiceHostName" value=“localHost"/>
<string key="piServiceBackendRFCIdentifier" value=“abrfc_pi"/><br>
23
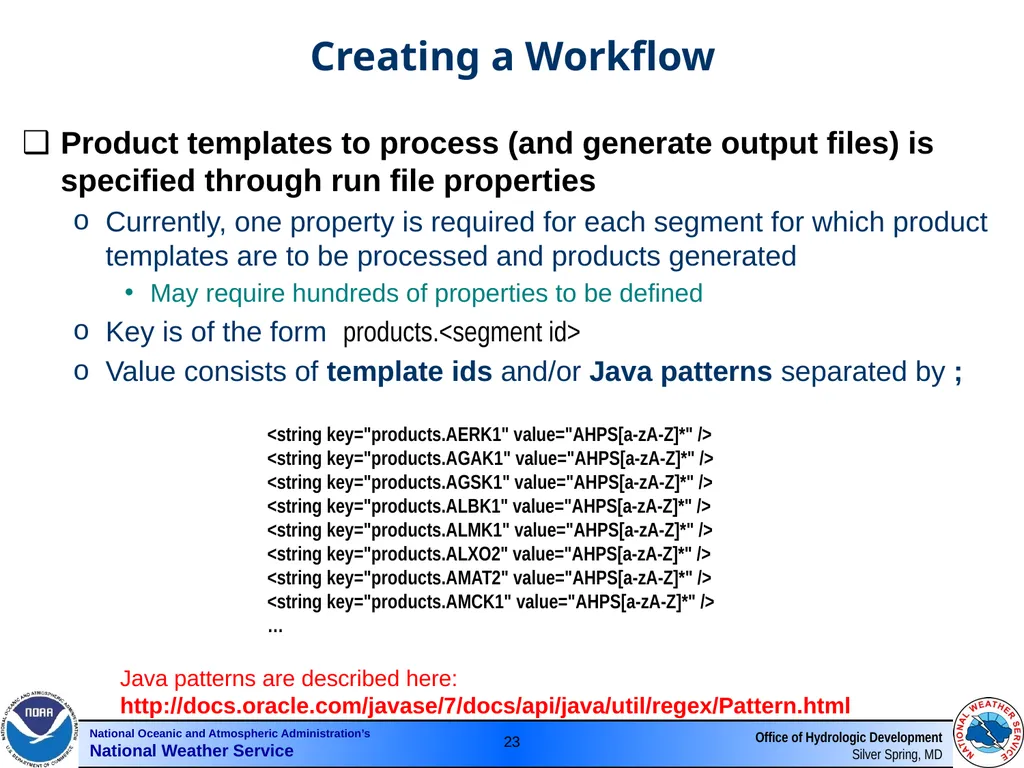
Product templates to process (and generate output files) is specified through run file properties
Currently, one property is required for each segment for which product templates are to be processed and products generated
May require hundreds of properties to be defined
Key is of the form products.<segment id>
Value consists of template ids and/or Java patterns separated by ; ‹#› Creating a Workflow Office of Hydrologic Development
Silver Spring, MD <string key="products.AERK1" value="AHPS[a-zA-Z]*" />
<string key="products.AGAK1" value="AHPS[a-zA-Z]*" />
<string key="products.AGSK1" value="AHPS[a-zA-Z]*" />
<string key="products.ALBK1" value="AHPS[a-zA-Z]*" />
<string key="products.ALMK1" value="AHPS[a-zA-Z]*" />
<string key="products.ALXO2" value="AHPS[a-zA-Z]*" />
<string key="products.AMAT2" value="AHPS[a-zA-Z]*" />
<string key="products.AMCK1" value="AHPS[a-zA-Z]*" />
… Java patterns are described here:
http://docs.oracle.com/javase/7/docs/api/java/util/regex/Pattern.html<br>
Currently, one property is required for each segment for which product templates are to be processed and products generated
May require hundreds of properties to be defined
Key is of the form products.<segment id>
Value consists of template ids and/or Java patterns separated by ; ‹#› Creating a Workflow Office of Hydrologic Development
Silver Spring, MD <string key="products.AERK1" value="AHPS[a-zA-Z]*" />
<string key="products.AGAK1" value="AHPS[a-zA-Z]*" />
<string key="products.AGSK1" value="AHPS[a-zA-Z]*" />
<string key="products.ALBK1" value="AHPS[a-zA-Z]*" />
<string key="products.ALMK1" value="AHPS[a-zA-Z]*" />
<string key="products.ALXO2" value="AHPS[a-zA-Z]*" />
<string key="products.AMAT2" value="AHPS[a-zA-Z]*" />
<string key="products.AMCK1" value="AHPS[a-zA-Z]*" />
… Java patterns are described here:
http://docs.oracle.com/javase/7/docs/api/java/util/regex/Pattern.html<br>
24
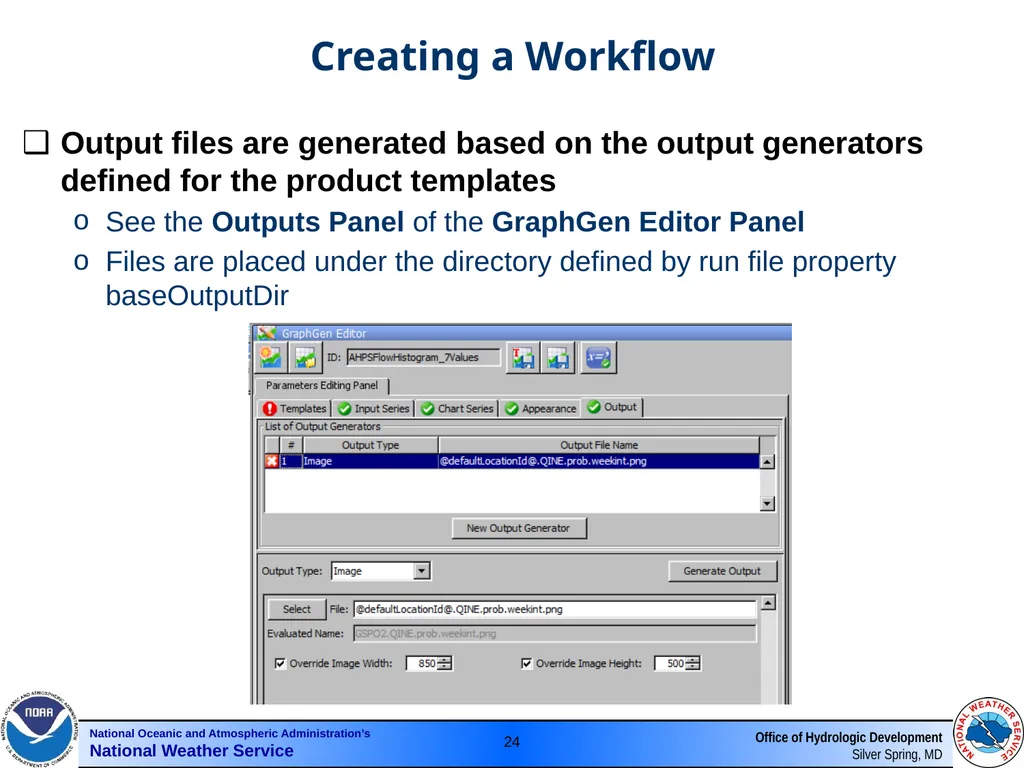
Output files are generated based on the output generators defined for the product templates
See the Outputs Panel of the GraphGen Editor Panel
Files are placed under the directory defined by run file property baseOutputDir ‹#› Creating a Workflow Office of Hydrologic Development
Silver Spring, MD<br>
See the Outputs Panel of the GraphGen Editor Panel
Files are placed under the directory defined by run file property baseOutputDir ‹#› Creating a Workflow Office of Hydrologic Development
Silver Spring, MD<br>
25
FB 1619: Enhancement in next CHPS release (OHD-CORE-CHPS 4.2.a) will allow for specify products through a PI-service query
Query is specified via a getSegmentsFromQuery property:
Value specifies a file within …/Config/PiServiceConfigFiles (.xml optional; referred to as clientId in the GraphGen Editor Panel) and the id of the query to perform
Products are specified through a products property with no suffix
What does it do?
Query is executed and locationIds are extracted from the time series headers acquired (data is not acquired)
Those locationIds are assumed to correspond to segment ids and, therefore, defaultLocationId arguments
Results will incorporate id-mappings, so in most cases locations will correspond to segment ids
If you have defined location sets that correspond to the segments for which to generate products (after id-mapping is applied), then you can define all of the product templates to process using only these two properties ‹#› Creating a Workflow Office of Hydrologic Development
Silver Spring, MD <string key="products " value="AHPS[a-zA-Z]*" /> <string key="getSegmentsFromQuery" value="GraphGen; QINE"/><br>
Query is specified via a getSegmentsFromQuery property:
Value specifies a file within …/Config/PiServiceConfigFiles (.xml optional; referred to as clientId in the GraphGen Editor Panel) and the id of the query to perform
Products are specified through a products property with no suffix
What does it do?
Query is executed and locationIds are extracted from the time series headers acquired (data is not acquired)
Those locationIds are assumed to correspond to segment ids and, therefore, defaultLocationId arguments
Results will incorporate id-mappings, so in most cases locations will correspond to segment ids
If you have defined location sets that correspond to the segments for which to generate products (after id-mapping is applied), then you can define all of the product templates to process using only these two properties ‹#› Creating a Workflow Office of Hydrologic Development
Silver Spring, MD <string key="products " value="AHPS[a-zA-Z]*" /> <string key="getSegmentsFromQuery" value="GraphGen; QINE"/><br>
26
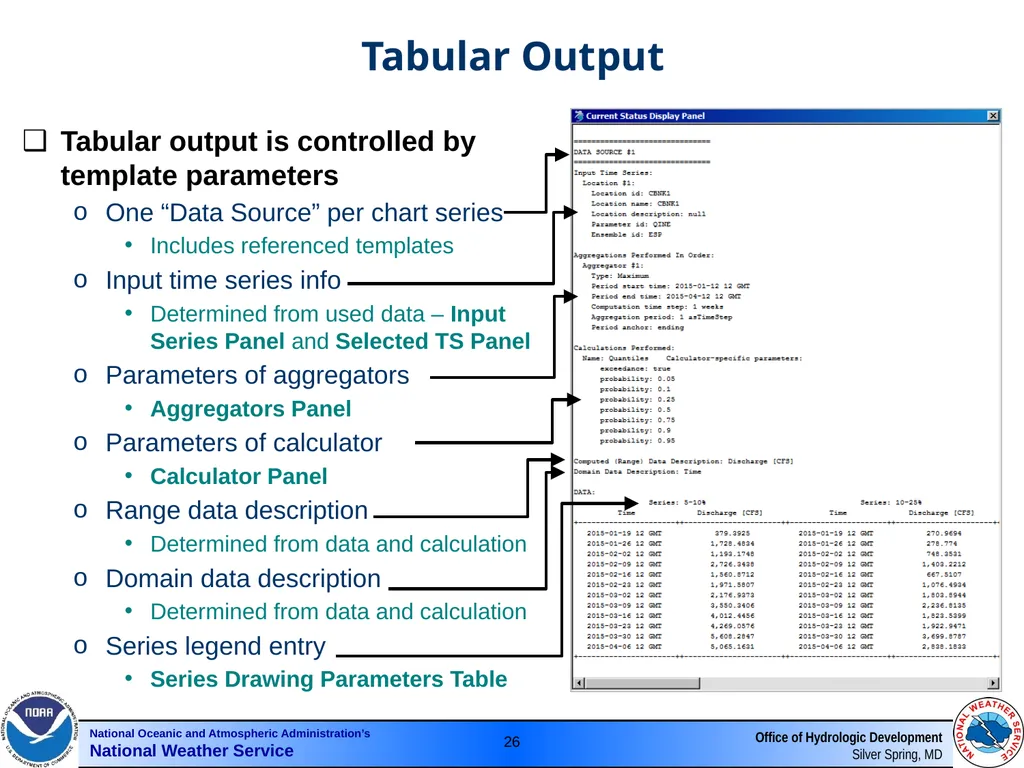
Tabular output is controlled by template parameters
One “Data Source” per chart series
Includes referenced templates
Input time series info
Determined from used data – Input Series Panel and Selected TS Panel
Parameters of aggregators
Aggregators Panel
Parameters of calculator
Calculator Panel
Range data description
Determined from data and calculation
Domain data description
Determined from data and calculation
Series legend entry
Series Drawing Parameters Table ‹#› Tabular Output Office of Hydrologic Development
Silver Spring, MD<br>
One “Data Source” per chart series
Includes referenced templates
Input time series info
Determined from used data – Input Series Panel and Selected TS Panel
Parameters of aggregators
Aggregators Panel
Parameters of calculator
Calculator Panel
Range data description
Determined from data and calculation
Domain data description
Determined from data and calculation
Series legend entry
Series Drawing Parameters Table ‹#› Tabular Output Office of Hydrologic Development
Silver Spring, MD<br>
27
Topic of GraphGen Webinar #2:
LRO product ‹#› Questions? Office of Hydrologic Development
Silver Spring, MD<br>
LRO product ‹#› Questions? Office of Hydrologic Development
Silver Spring, MD<br>
28
Appendix<br>
29
Using ID-Mapping in PI-service Config Files
Importing and Moving Templates
Creating Templates for Other Data Types ‹#› Outline Office of Hydrologic Development
Silver Spring, MD<br>
Importing and Moving Templates
Creating Templates for Other Data Types ‹#› Outline Office of Hydrologic Development
Silver Spring, MD<br>
30
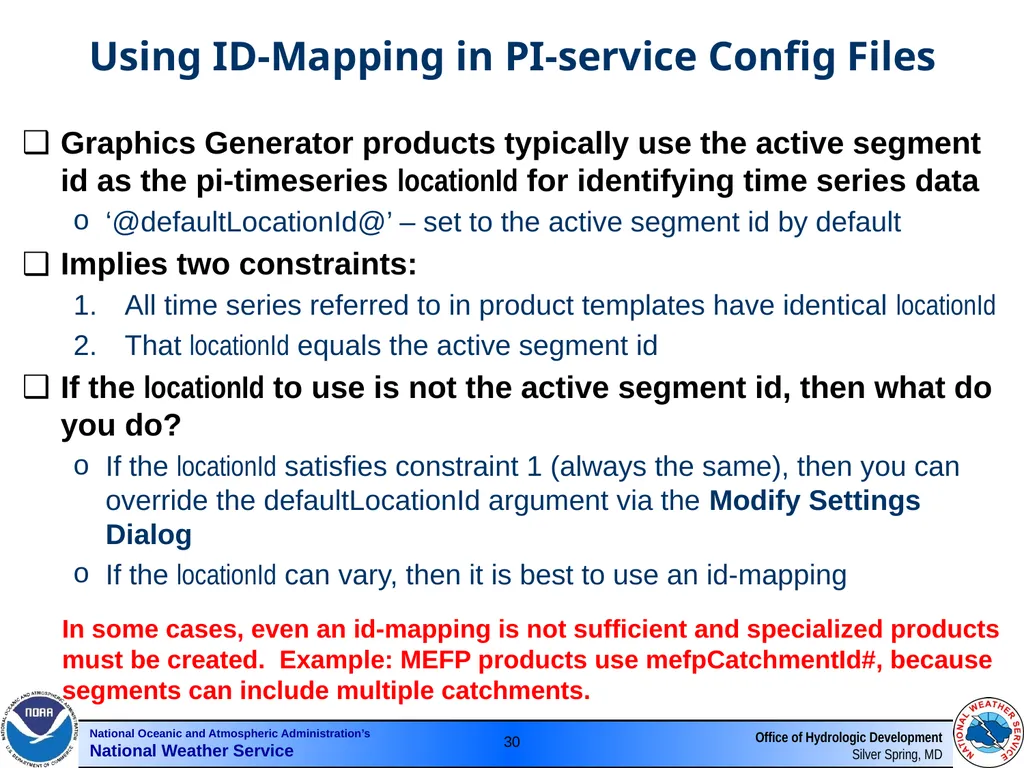
Graphics Generator products typically use the active segment id as the pi-timeseries locationId for identifying time series data
‘@defaultLocationId@’ – set to the active segment id by default
Implies two constraints:
All time series referred to in product templates have identical locationId
That locationId equals the active segment id
If the locationId to use is not the active segment id, then what do you do?
If the locationId satisfies constraint 1 (always the same), then you can override the defaultLocationId argument via the Modify Settings Dialog
If the locationId can vary, then it is best to use an id-mapping ‹#› Using ID-Mapping in PI-service Config Files Office of Hydrologic Development
Silver Spring, MD In some cases, even an id-mapping is not sufficient and specialized products must be created. Example: MEFP products use mefpCatchmentId#, because segments can include multiple catchments.<br>
‘@defaultLocationId@’ – set to the active segment id by default
Implies two constraints:
All time series referred to in product templates have identical locationId
That locationId equals the active segment id
If the locationId to use is not the active segment id, then what do you do?
If the locationId satisfies constraint 1 (always the same), then you can override the defaultLocationId argument via the Modify Settings Dialog
If the locationId can vary, then it is best to use an id-mapping ‹#› Using ID-Mapping in PI-service Config Files Office of Hydrologic Development
Silver Spring, MD In some cases, even an id-mapping is not sufficient and specialized products must be created. Example: MEFP products use mefpCatchmentId#, because segments can include multiple catchments.<br>
31
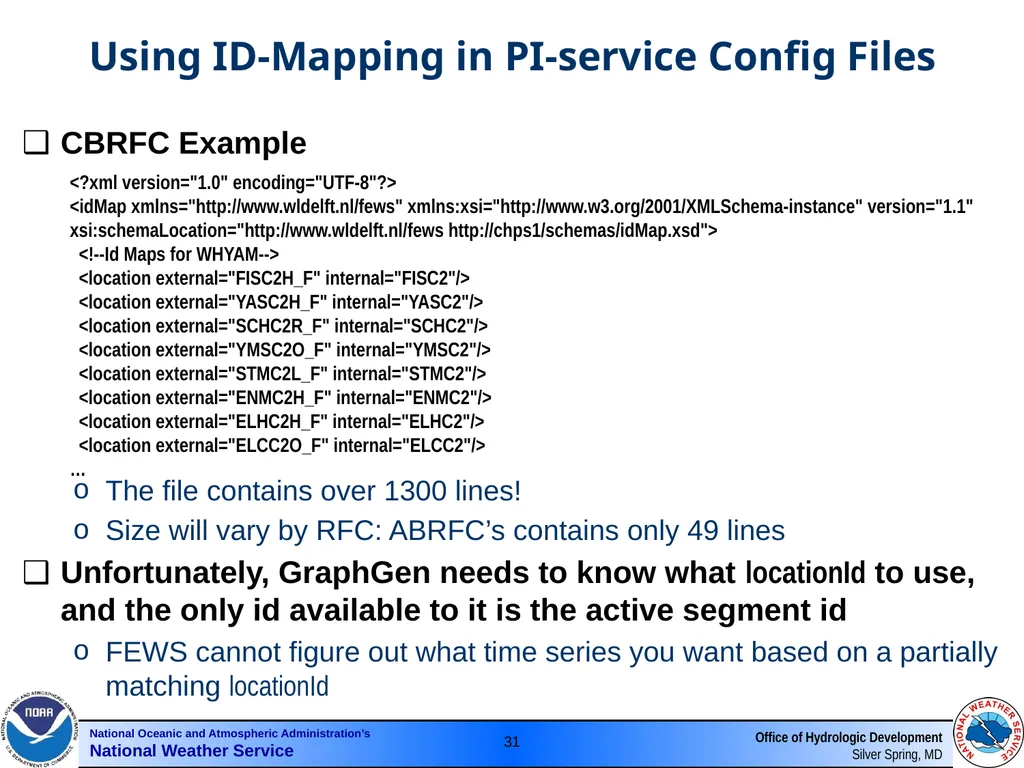
CBRFC Example
The file contains over 1300 lines!
Size will vary by RFC: ABRFC’s contains only 49 lines
Unfortunately, GraphGen needs to know what locationId to use, and the only id available to it is the active segment id
FEWS cannot figure out what time series you want based on a partially matching locationId ‹#› Using ID-Mapping in PI-service Config Files Office of Hydrologic Development
Silver Spring, MD <?xml version="1.0" encoding="UTF-8"?>
<idMap xmlns="http://www.wldelft.nl/fews" xmlns:xsi="http://www.w3.org/2001/XMLSchema-instance" version="1.1" xsi:schemaLocation="http://www.wldelft.nl/fews http://chps1/schemas/idMap.xsd">
<!--Id Maps for WHYAM-->
<location external="FISC2H_F" internal="FISC2"/>
<location external="YASC2H_F" internal="YASC2"/>
<location external="SCHC2R_F" internal="SCHC2"/>
<location external="YMSC2O_F" internal="YMSC2"/>
<location external="STMC2L_F" internal="STMC2"/>
<location external="ENMC2H_F" internal="ENMC2"/>
<location external="ELHC2H_F" internal="ELHC2"/>
<location external="ELCC2O_F" internal="ELCC2"/>
…<br>
The file contains over 1300 lines!
Size will vary by RFC: ABRFC’s contains only 49 lines
Unfortunately, GraphGen needs to know what locationId to use, and the only id available to it is the active segment id
FEWS cannot figure out what time series you want based on a partially matching locationId ‹#› Using ID-Mapping in PI-service Config Files Office of Hydrologic Development
Silver Spring, MD <?xml version="1.0" encoding="UTF-8"?>
<idMap xmlns="http://www.wldelft.nl/fews" xmlns:xsi="http://www.w3.org/2001/XMLSchema-instance" version="1.1" xsi:schemaLocation="http://www.wldelft.nl/fews http://chps1/schemas/idMap.xsd">
<!--Id Maps for WHYAM-->
<location external="FISC2H_F" internal="FISC2"/>
<location external="YASC2H_F" internal="YASC2"/>
<location external="SCHC2R_F" internal="SCHC2"/>
<location external="YMSC2O_F" internal="YMSC2"/>
<location external="STMC2L_F" internal="STMC2"/>
<location external="ENMC2H_F" internal="ENMC2"/>
<location external="ELHC2H_F" internal="ELHC2"/>
<location external="ELCC2O_F" internal="ELCC2"/>
…<br>
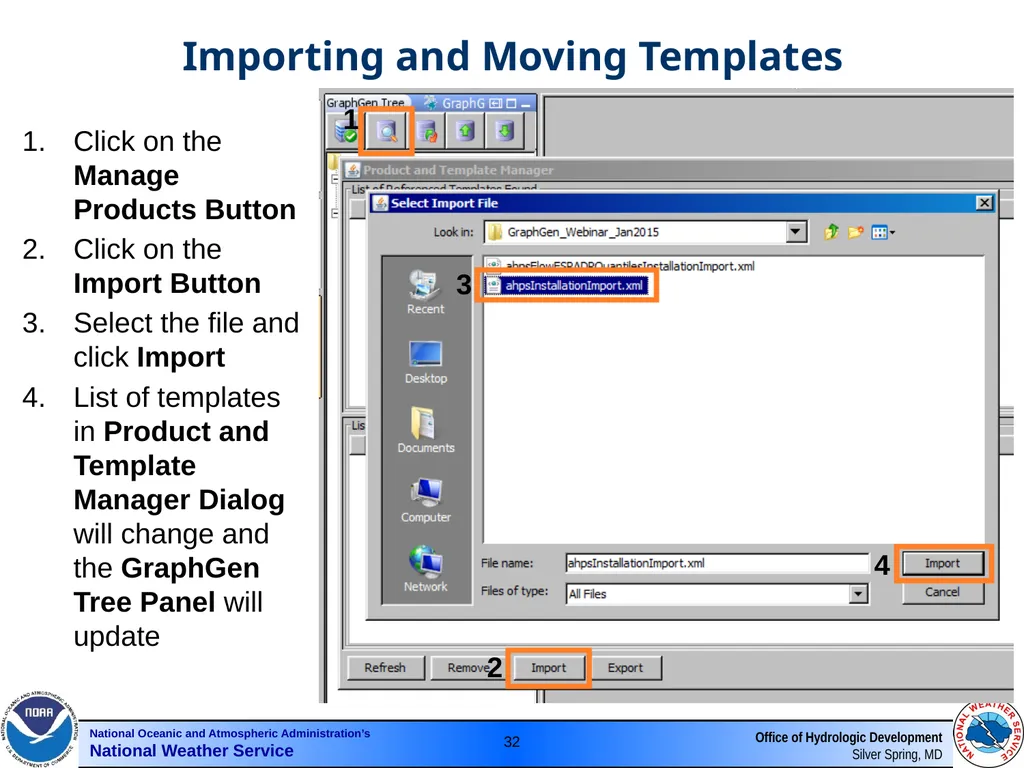
32
Click on the Manage Products Button
Click on the Import Button
Select the file and click Import
List of templates in Product and Template Manager Dialog will change and the GraphGen Tree Panel will update ‹#› Importing and Moving Templates Office of Hydrologic Development
Silver Spring, MD 1 2 4 3<br>
Click on the Import Button
Select the file and click Import
List of templates in Product and Template Manager Dialog will change and the GraphGen Tree Panel will update ‹#› Importing and Moving Templates Office of Hydrologic Development
Silver Spring, MD 1 2 4 3<br>
33
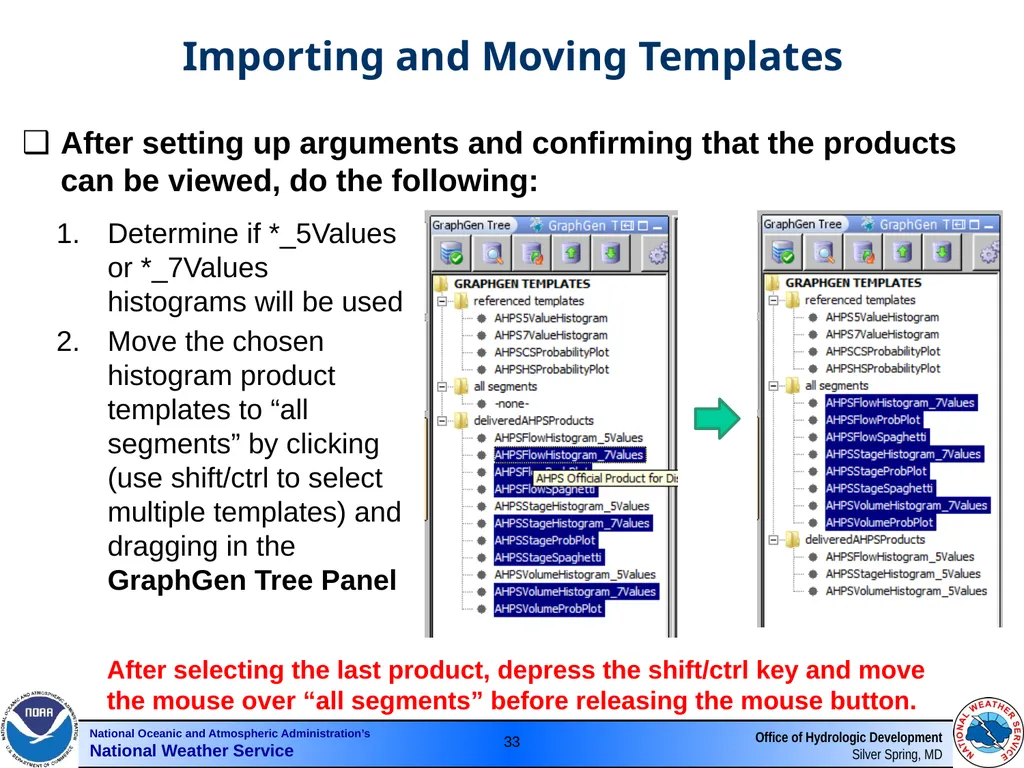
After setting up arguments and confirming that the products can be viewed, do the following: ‹#› Importing and Moving Templates Office of Hydrologic Development
Silver Spring, MD Determine if *_5Values or *_7Values histograms will be used
Move the chosen histogram product templates to “all segments” by clicking (use shift/ctrl to select multiple templates) and dragging in the GraphGen Tree Panel After selecting the last product, depress the shift/ctrl key and move the mouse over “all segments” before releasing the mouse button.<br>
Silver Spring, MD Determine if *_5Values or *_7Values histograms will be used
Move the chosen histogram product templates to “all segments” by clicking (use shift/ctrl to select multiple templates) and dragging in the GraphGen Tree Panel After selecting the last product, depress the shift/ctrl key and move the mouse over “all segments” before releasing the mouse button.<br>
34
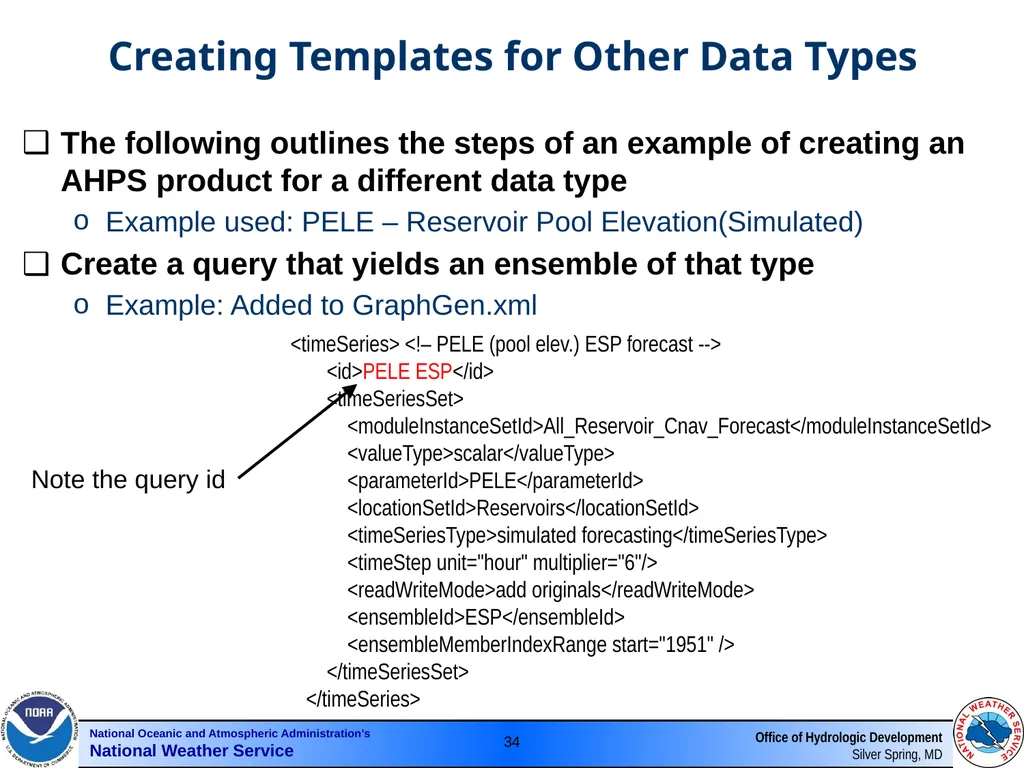
The following outlines the steps of an example of creating an AHPS product for a different data type
Example used: PELE – Reservoir Pool Elevation(Simulated)
Create a query that yields an ensemble of that type
Example: Added to GraphGen.xml ‹#› Creating Templates for Other Data Types Office of Hydrologic Development
Silver Spring, MD <timeSeries> <!– PELE (pool elev.) ESP forecast -->
<id>PELE ESP</id>
<timeSeriesSet>
<moduleInstanceSetId>All_Reservoir_Cnav_Forecast</moduleInstanceSetId>
<valueType>scalar</valueType>
<parameterId>PELE</parameterId>
<locationSetId>Reservoirs</locationSetId>
<timeSeriesType>simulated forecasting</timeSeriesType>
<timeStep unit="hour" multiplier="6"/>
<readWriteMode>add originals</readWriteMode>
<ensembleId>ESP</ensembleId>
<ensembleMemberIndexRange start="1951" />
</timeSeriesSet>
</timeSeries> Note the query id<br>
Example used: PELE – Reservoir Pool Elevation(Simulated)
Create a query that yields an ensemble of that type
Example: Added to GraphGen.xml ‹#› Creating Templates for Other Data Types Office of Hydrologic Development
Silver Spring, MD <timeSeries> <!– PELE (pool elev.) ESP forecast -->
<id>PELE ESP</id>
<timeSeriesSet>
<moduleInstanceSetId>All_Reservoir_Cnav_Forecast</moduleInstanceSetId>
<valueType>scalar</valueType>
<parameterId>PELE</parameterId>
<locationSetId>Reservoirs</locationSetId>
<timeSeriesType>simulated forecasting</timeSeriesType>
<timeStep unit="hour" multiplier="6"/>
<readWriteMode>add originals</readWriteMode>
<ensembleId>ESP</ensembleId>
<ensembleMemberIndexRange start="1951" />
</timeSeriesSet>
</timeSeries> Note the query id<br>
35
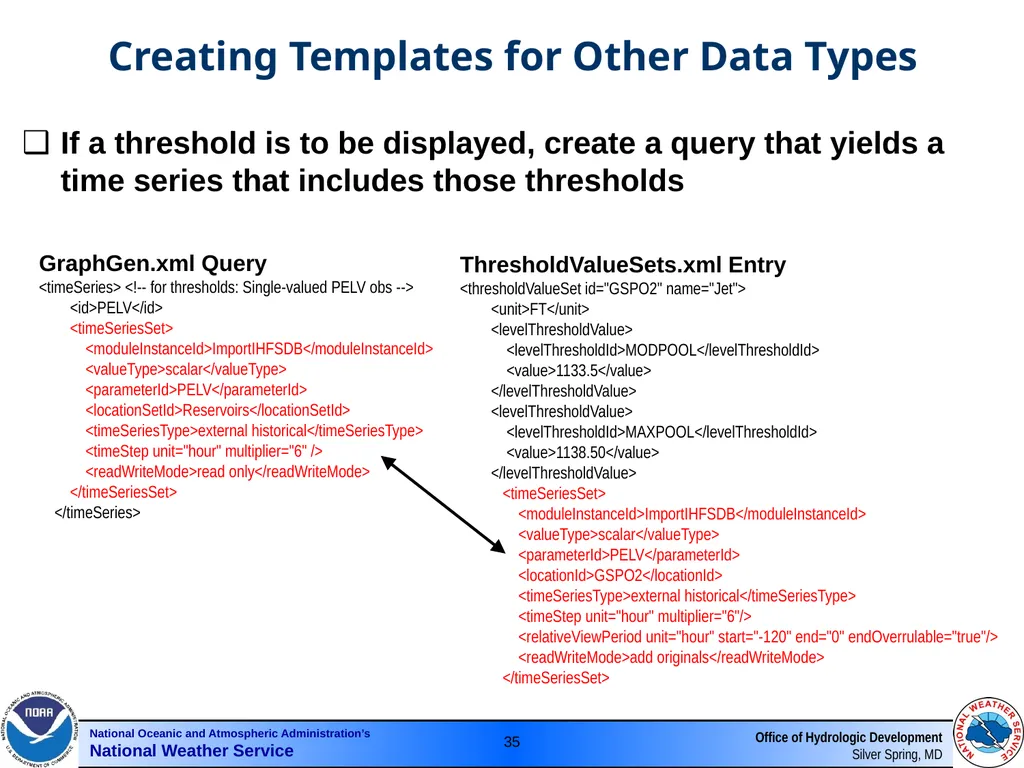
If a threshold is to be displayed, create a query that yields a time series that includes those thresholds ‹#› Creating Templates for Other Data Types Office of Hydrologic Development
Silver Spring, MD GraphGen.xml Query
<timeSeries> <!-- for thresholds: Single-valued PELV obs -->
<id>PELV</id>
<timeSeriesSet>
<moduleInstanceId>ImportIHFSDB</moduleInstanceId>
<valueType>scalar</valueType>
<parameterId>PELV</parameterId>
<locationSetId>Reservoirs</locationSetId>
<timeSeriesType>external historical</timeSeriesType>
<timeStep unit="hour" multiplier="6" />
<readWriteMode>read only</readWriteMode>
</timeSeriesSet>
</timeSeries> ThresholdValueSets.xml Entry
<thresholdValueSet id="GSPO2" name="Jet">
<unit>FT</unit>
<levelThresholdValue>
<levelThresholdId>MODPOOL</levelThresholdId>
<value>1133.5</value>
</levelThresholdValue>
<levelThresholdValue>
<levelThresholdId>MAXPOOL</levelThresholdId>
<value>1138.50</value>
</levelThresholdValue>
<timeSeriesSet>
<moduleInstanceId>ImportIHFSDB</moduleInstanceId>
<valueType>scalar</valueType>
<parameterId>PELV</parameterId>
<locationId>GSPO2</locationId>
<timeSeriesType>external historical</timeSeriesType>
<timeStep unit="hour" multiplier="6"/>
<relativeViewPeriod unit="hour" start="-120" end="0" endOverrulable="true"/>
<readWriteMode>add originals</readWriteMode>
</timeSeriesSet><br>
Silver Spring, MD GraphGen.xml Query
<timeSeries> <!-- for thresholds: Single-valued PELV obs -->
<id>PELV</id>
<timeSeriesSet>
<moduleInstanceId>ImportIHFSDB</moduleInstanceId>
<valueType>scalar</valueType>
<parameterId>PELV</parameterId>
<locationSetId>Reservoirs</locationSetId>
<timeSeriesType>external historical</timeSeriesType>
<timeStep unit="hour" multiplier="6" />
<readWriteMode>read only</readWriteMode>
</timeSeriesSet>
</timeSeries> ThresholdValueSets.xml Entry
<thresholdValueSet id="GSPO2" name="Jet">
<unit>FT</unit>
<levelThresholdValue>
<levelThresholdId>MODPOOL</levelThresholdId>
<value>1133.5</value>
</levelThresholdValue>
<levelThresholdValue>
<levelThresholdId>MAXPOOL</levelThresholdId>
<value>1138.50</value>
</levelThresholdValue>
<timeSeriesSet>
<moduleInstanceId>ImportIHFSDB</moduleInstanceId>
<valueType>scalar</valueType>
<parameterId>PELV</parameterId>
<locationId>GSPO2</locationId>
<timeSeriesType>external historical</timeSeriesType>
<timeStep unit="hour" multiplier="6"/>
<relativeViewPeriod unit="hour" start="-120" end="0" endOverrulable="true"/>
<readWriteMode>add originals</readWriteMode>
</timeSeriesSet><br>
36
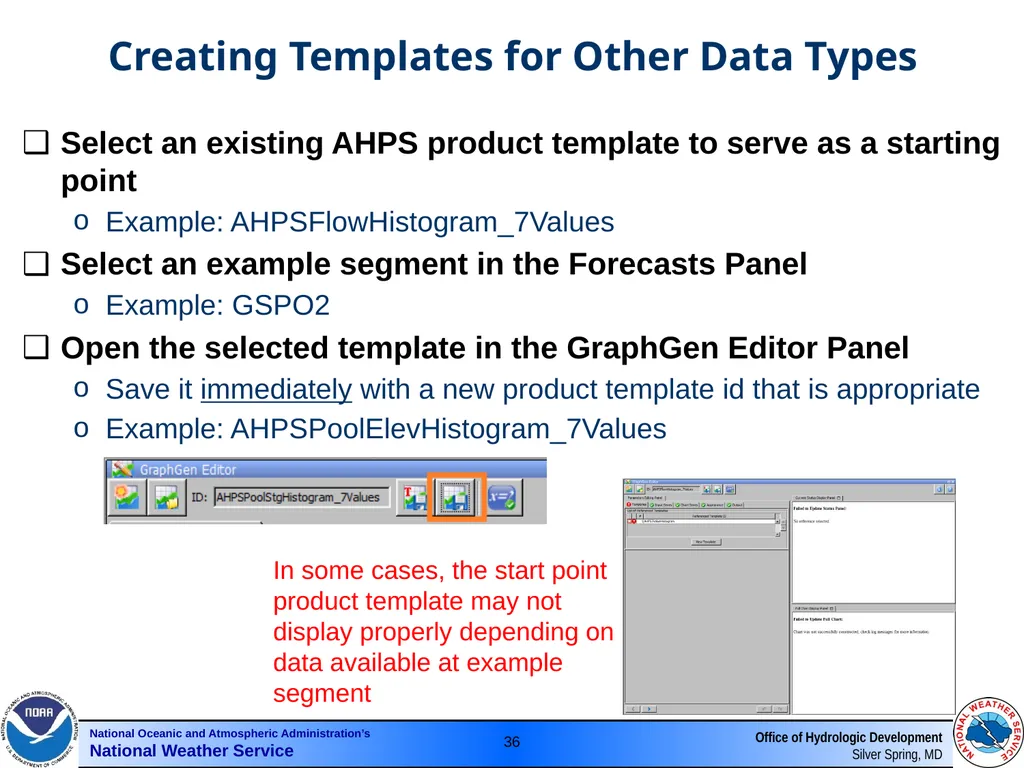
Select an existing AHPS product template to serve as a starting point
Example: AHPSFlowHistogram_7Values
Select an example segment in the Forecasts Panel
Example: GSPO2
Open the selected template in the GraphGen Editor Panel
Save it immediately with a new product template id that is appropriate
Example: AHPSPoolElevHistogram_7Values ‹#› Creating Templates for Other Data Types Office of Hydrologic Development
Silver Spring, MD In some cases, the start point product template may not display properly depending on data available at example segment<br>
Example: AHPSFlowHistogram_7Values
Select an example segment in the Forecasts Panel
Example: GSPO2
Open the selected template in the GraphGen Editor Panel
Save it immediately with a new product template id that is appropriate
Example: AHPSPoolElevHistogram_7Values ‹#› Creating Templates for Other Data Types Office of Hydrologic Development
Silver Spring, MD In some cases, the start point product template may not display properly depending on data available at example segment<br>
37
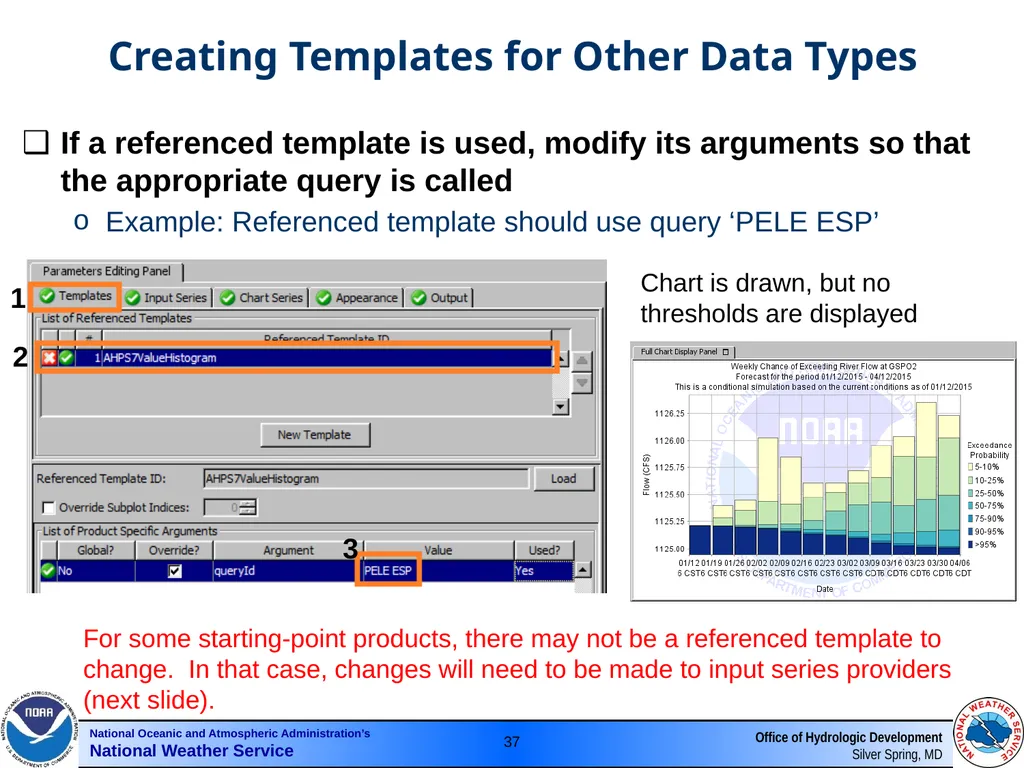
If a referenced template is used, modify its arguments so that the appropriate query is called
Example: Referenced template should use query ‘PELE ESP’ ‹#› Creating Templates for Other Data Types Office of Hydrologic Development
Silver Spring, MD Chart is drawn, but no thresholds are displayed For some starting-point products, there may not be a referenced template to change. In that case, changes will need to be made to input series providers (next slide). 1 2 3<br>
Example: Referenced template should use query ‘PELE ESP’ ‹#› Creating Templates for Other Data Types Office of Hydrologic Development
Silver Spring, MD Chart is drawn, but no thresholds are displayed For some starting-point products, there may not be a referenced template to change. In that case, changes will need to be made to input series providers (next slide). 1 2 3<br>
38
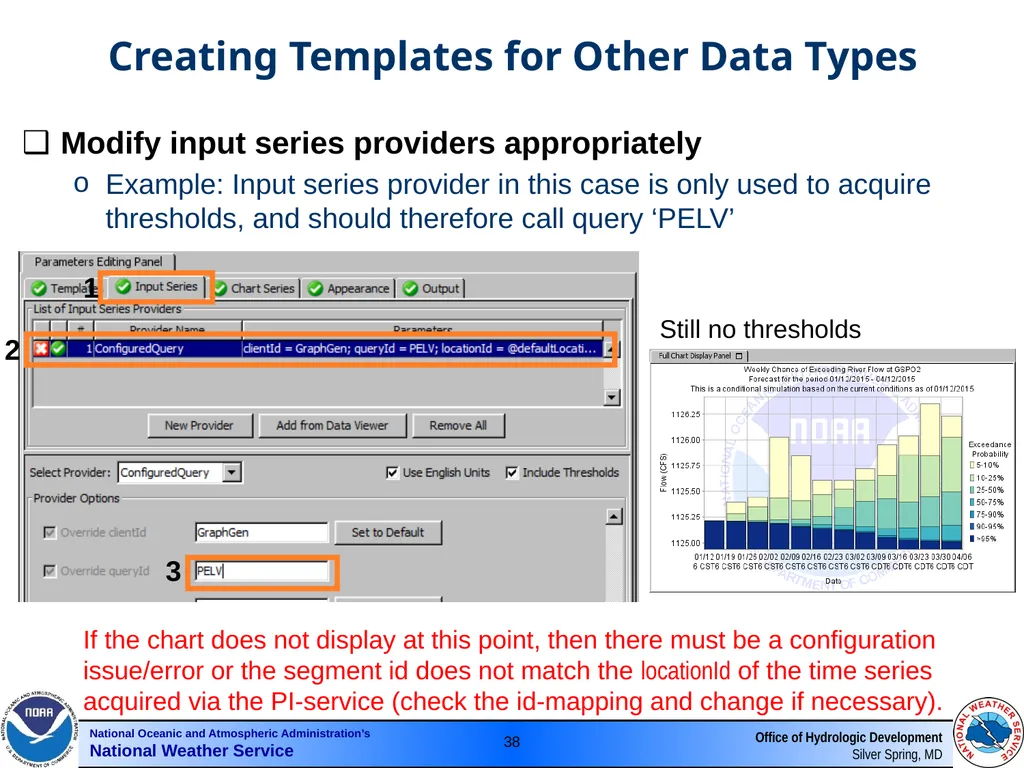
Modify input series providers appropriately
Example: Input series provider in this case is only used to acquire thresholds, and should therefore call query ‘PELV’ ‹#› Creating Templates for Other Data Types Office of Hydrologic Development
Silver Spring, MD Still no thresholds If the chart does not display at this point, then there must be a configuration issue/error or the segment id does not match the locationId of the time series acquired via the PI-service (check the id-mapping and change if necessary). 1 2 3<br>
Example: Input series provider in this case is only used to acquire thresholds, and should therefore call query ‘PELV’ ‹#› Creating Templates for Other Data Types Office of Hydrologic Development
Silver Spring, MD Still no thresholds If the chart does not display at this point, then there must be a configuration issue/error or the segment id does not match the locationId of the time series acquired via the PI-service (check the id-mapping and change if necessary). 1 2 3<br>
39
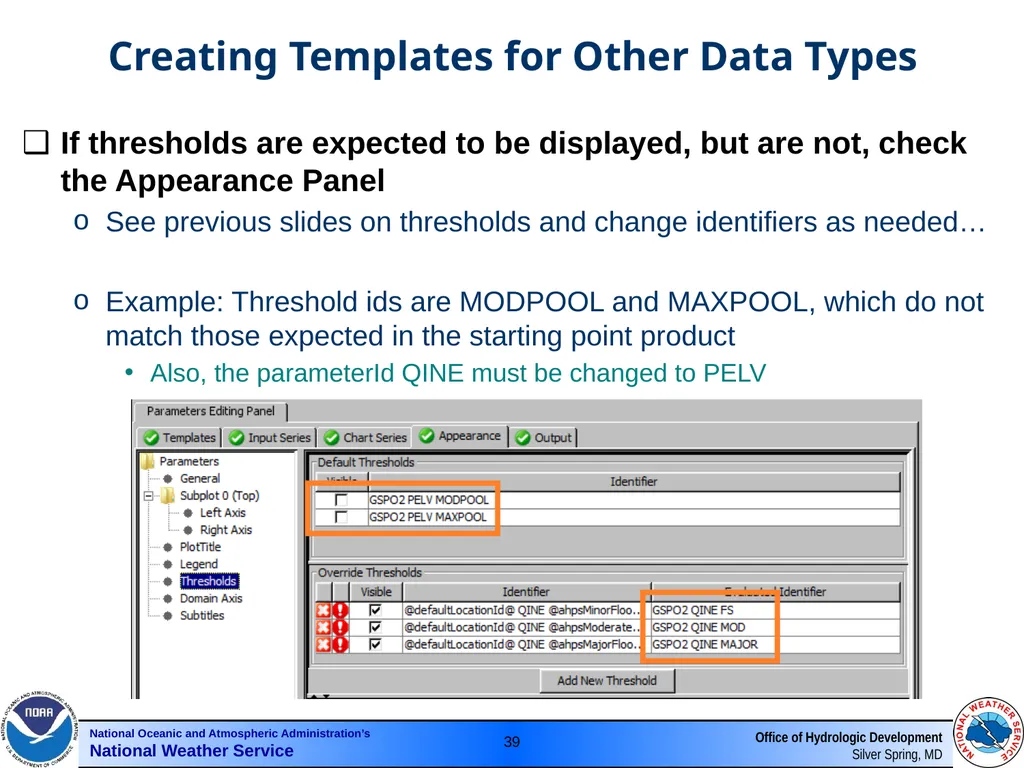
If thresholds are expected to be displayed, but are not, check the Appearance Panel
See previous slides on thresholds and change identifiers as needed…
Example: Threshold ids are MODPOOL and MAXPOOL, which do not match those expected in the starting point product
Also, the parameterId QINE must be changed to PELV ‹#› Creating Templates for Other Data Types Office of Hydrologic Development
Silver Spring, MD<br>
See previous slides on thresholds and change identifiers as needed…
Example: Threshold ids are MODPOOL and MAXPOOL, which do not match those expected in the starting point product
Also, the parameterId QINE must be changed to PELV ‹#› Creating Templates for Other Data Types Office of Hydrologic Development
Silver Spring, MD<br>
40
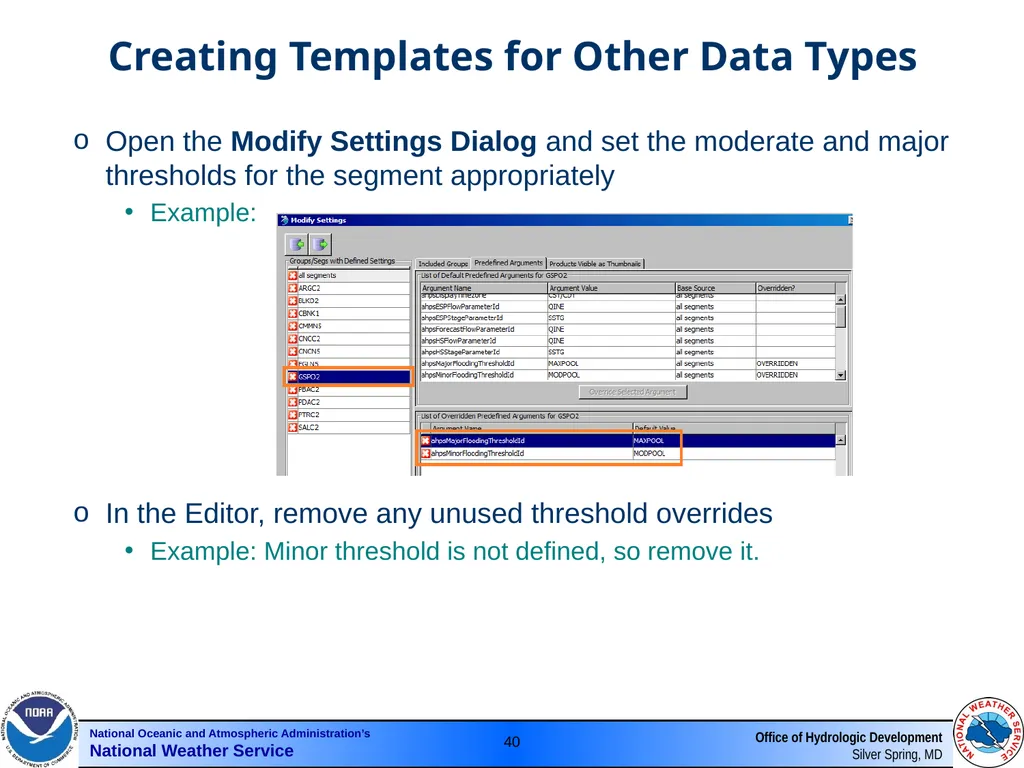
Open the Modify Settings Dialog and set the moderate and major thresholds for the segment appropriately
Example:
In the Editor, remove any unused threshold overrides
Example: Minor threshold is not defined, so remove it. ‹#› Creating Templates for Other Data Types Office of Hydrologic Development
Silver Spring, MD<br>
Example:
In the Editor, remove any unused threshold overrides
Example: Minor threshold is not defined, so remove it. ‹#› Creating Templates for Other Data Types Office of Hydrologic Development
Silver Spring, MD<br>
41
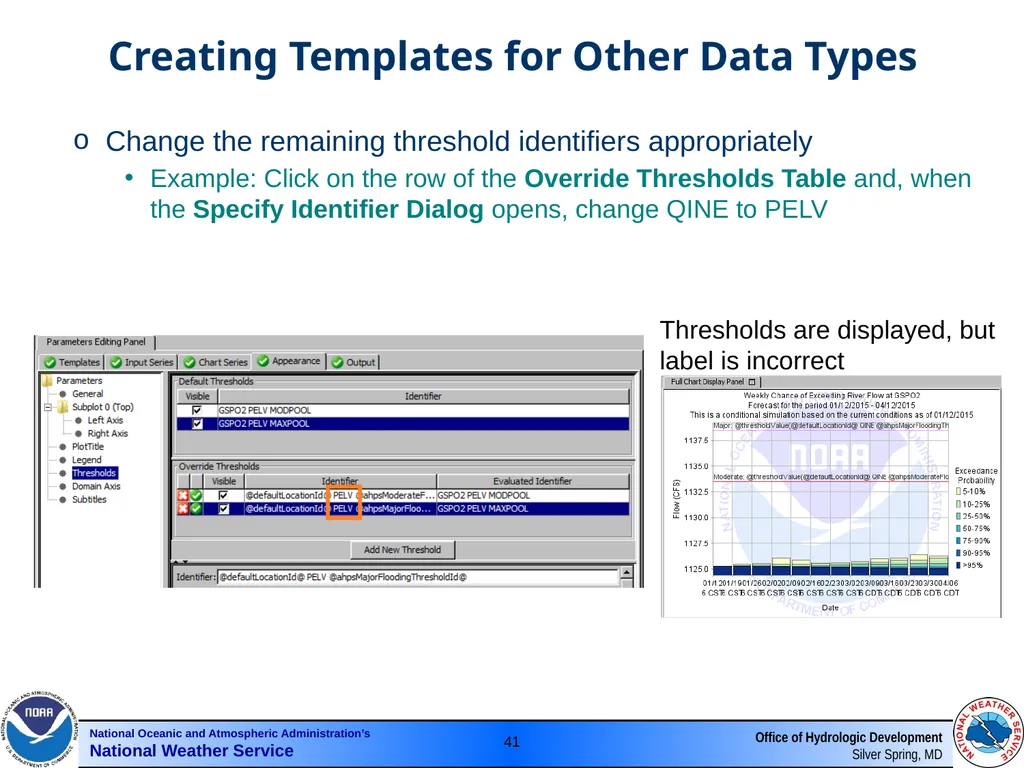
Change the remaining threshold identifiers appropriately
Example: Click on the row of the Override Thresholds Table and, when the Specify Identifier Dialog opens, change QINE to PELV ‹#› Creating Templates for Other Data Types Office of Hydrologic Development
Silver Spring, MD Thresholds are displayed, but label is incorrect<br>
Example: Click on the row of the Override Thresholds Table and, when the Specify Identifier Dialog opens, change QINE to PELV ‹#› Creating Templates for Other Data Types Office of Hydrologic Development
Silver Spring, MD Thresholds are displayed, but label is incorrect<br>
42
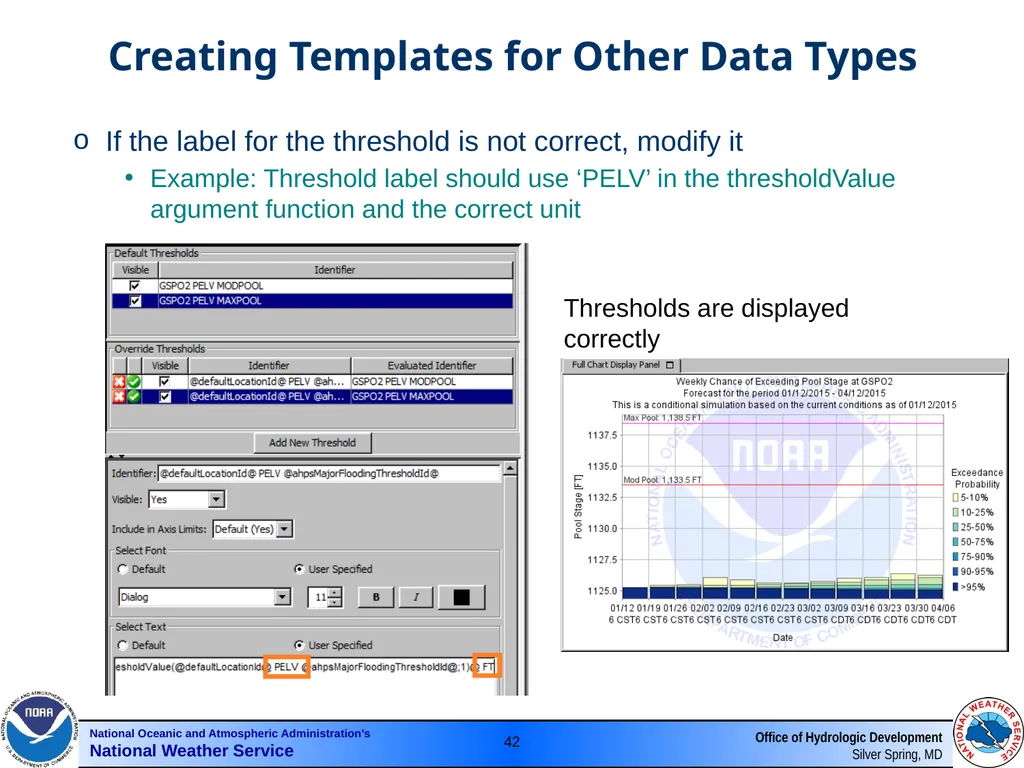
If the label for the threshold is not correct, modify it
Example: Threshold label should use ‘PELV’ in the thresholdValue argument function and the correct unit ‹#› Creating Templates for Other Data Types Office of Hydrologic Development
Silver Spring, MD Thresholds are displayed correctly<br>
Example: Threshold label should use ‘PELV’ in the thresholdValue argument function and the correct unit ‹#› Creating Templates for Other Data Types Office of Hydrologic Development
Silver Spring, MD Thresholds are displayed correctly<br>
43
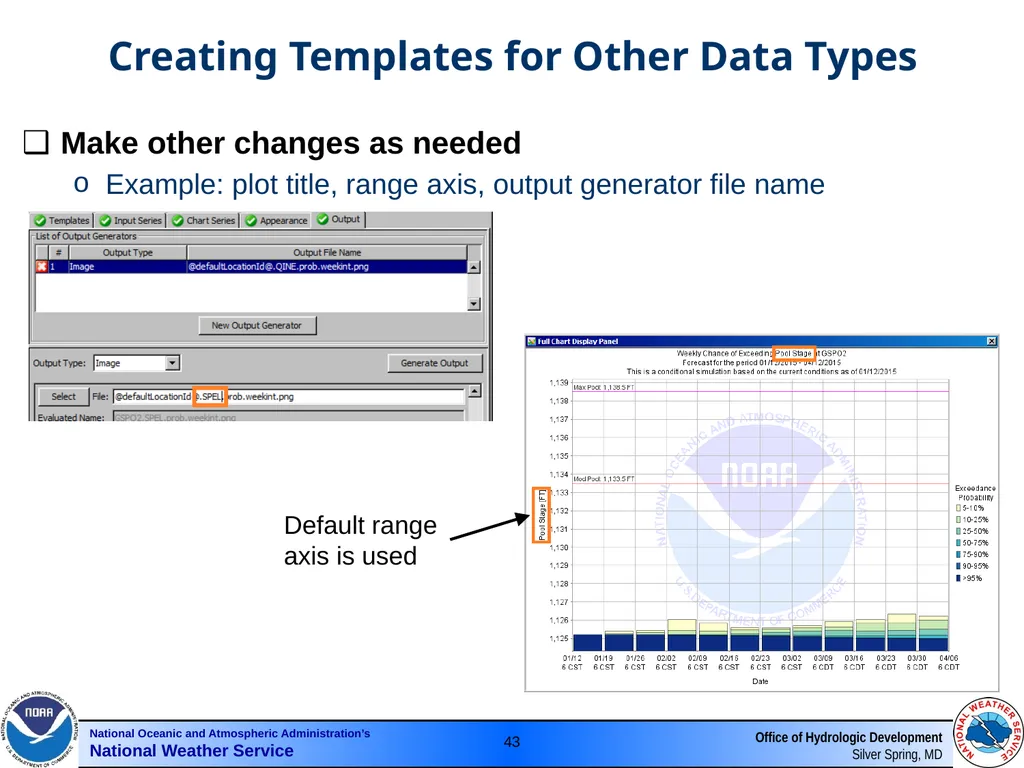
Make other changes as needed
Example: plot title, range axis, output generator file name ‹#› Creating Templates for Other Data Types Office of Hydrologic Development
Silver Spring, MD Default range axis is used<br>
Example: plot title, range axis, output generator file name ‹#› Creating Templates for Other Data Types Office of Hydrologic Development
Silver Spring, MD Default range axis is used<br>
44
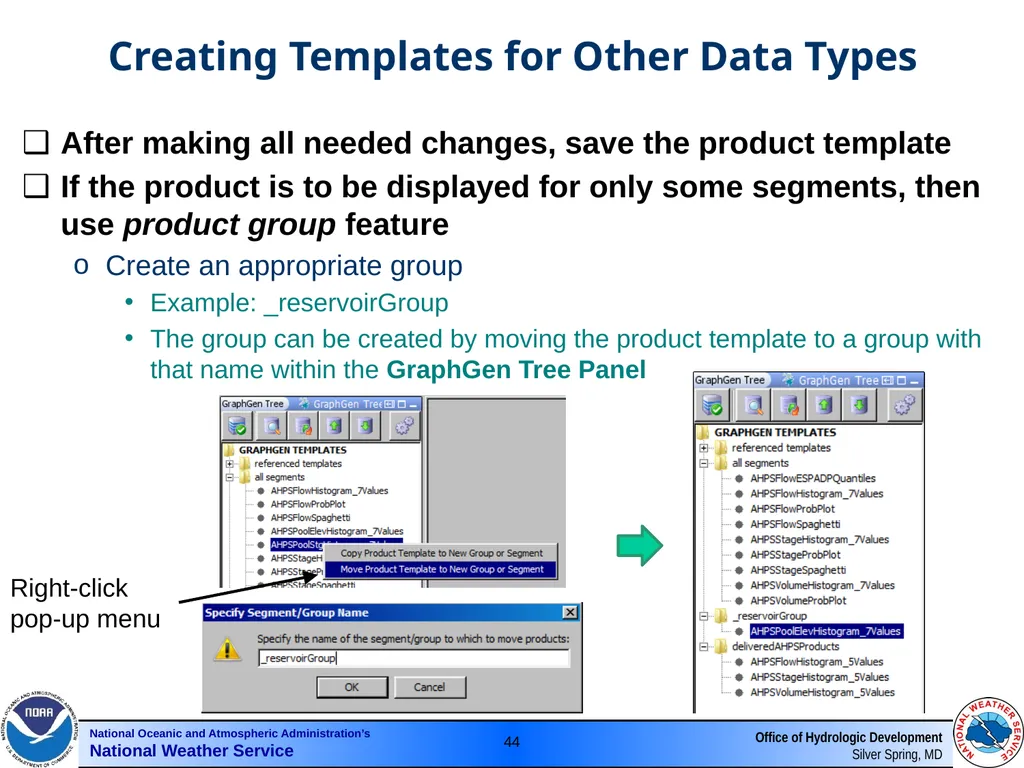
After making all needed changes, save the product template
If the product is to be displayed for only some segments, then use product group feature
Create an appropriate group
Example: _reservoirGroup
The group can be created by moving the product template to a group with that name within the GraphGen Tree Panel ‹#› Creating Templates for Other Data Types Office of Hydrologic Development
Silver Spring, MD Right-click pop-up menu<br>
If the product is to be displayed for only some segments, then use product group feature
Create an appropriate group
Example: _reservoirGroup
The group can be created by moving the product template to a group with that name within the GraphGen Tree Panel ‹#› Creating Templates for Other Data Types Office of Hydrologic Development
Silver Spring, MD Right-click pop-up menu<br>
45
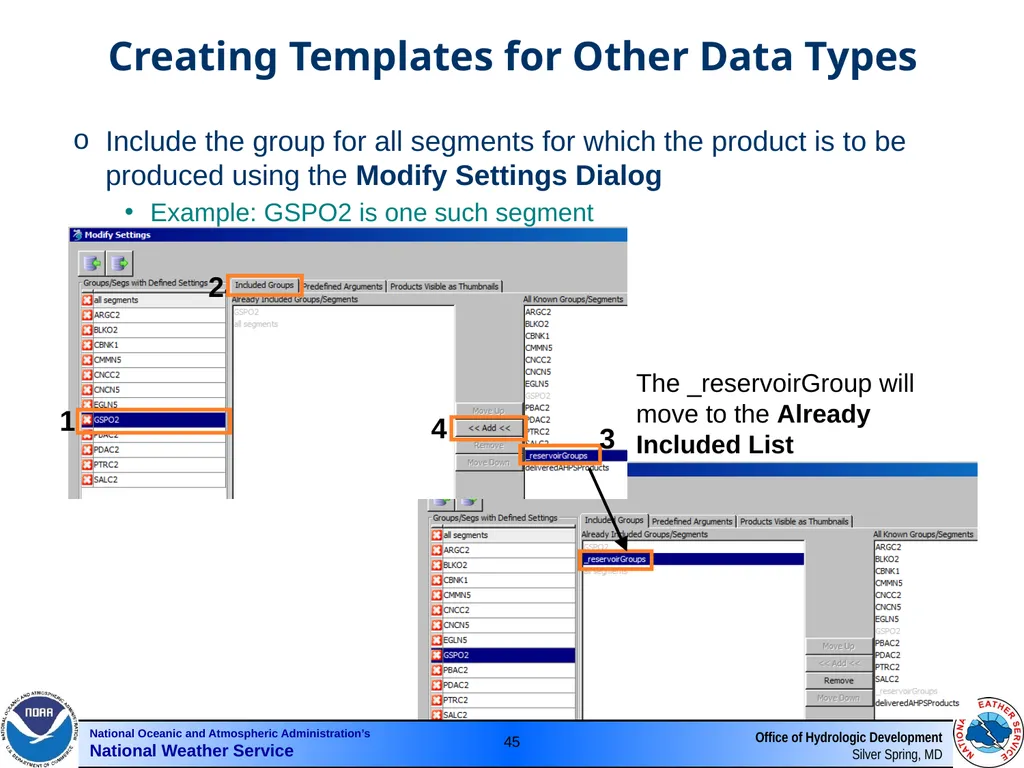
Include the group for all segments for which the product is to be produced using the Modify Settings Dialog
Example: GSPO2 is one such segment ‹#› Creating Templates for Other Data Types Office of Hydrologic Development
Silver Spring, MD 1 2 3 4 The _reservoirGroup will move to the Already Included List<br>
Example: GSPO2 is one such segment ‹#› Creating Templates for Other Data Types Office of Hydrologic Development
Silver Spring, MD 1 2 3 4 The _reservoirGroup will move to the Already Included List<br>
46
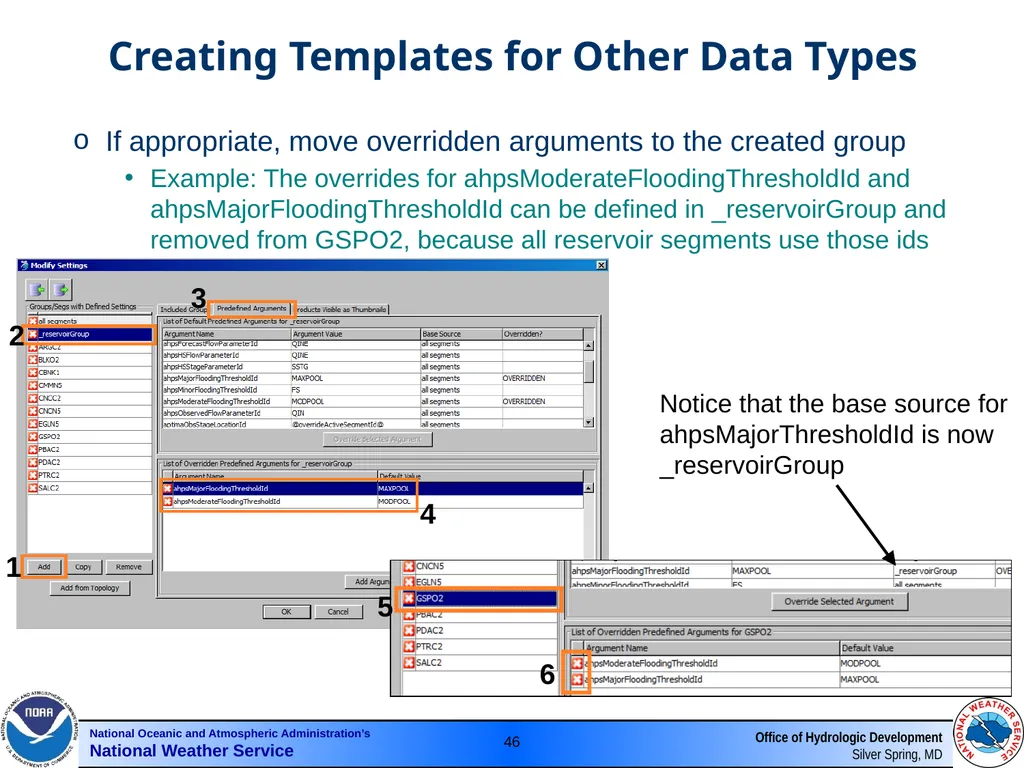
If appropriate, move overridden arguments to the created group
Example: The overrides for ahpsModerateFloodingThresholdId and ahpsMajorFloodingThresholdId can be defined in _reservoirGroup and removed from GSPO2, because all reservoir segments use those ids ‹#› Creating Templates for Other Data Types Office of Hydrologic Development
Silver Spring, MD 1 2 3 4 5 6 Notice that the base source for ahpsMajorThresholdId is now _reservoirGroup<br>
Example: The overrides for ahpsModerateFloodingThresholdId and ahpsMajorFloodingThresholdId can be defined in _reservoirGroup and removed from GSPO2, because all reservoir segments use those ids ‹#› Creating Templates for Other Data Types Office of Hydrologic Development
Silver Spring, MD 1 2 3 4 5 6 Notice that the base source for ahpsMajorThresholdId is now _reservoirGroup<br>
47
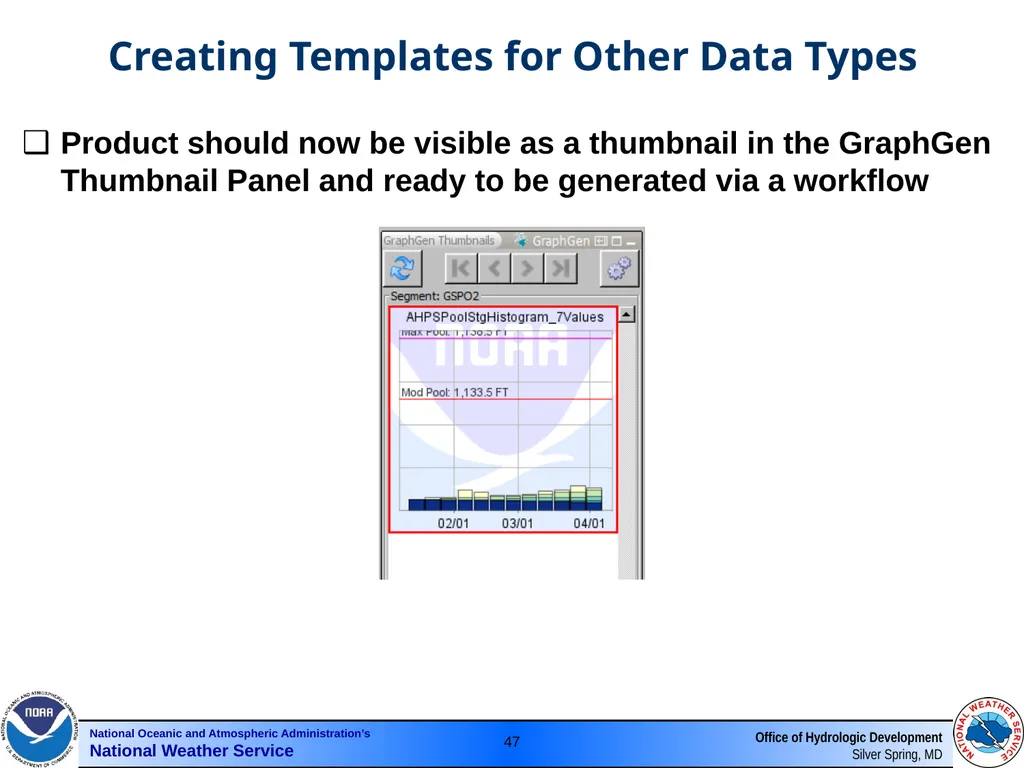
Product should now be visible as a thumbnail in the GraphGen Thumbnail Panel and ready to be generated via a workflow ‹#› Creating Templates for Other Data Types Office of Hydrologic Development
Silver Spring, MD<br>
Silver Spring, MD<br>