GRSB Nature Positive Goal Joint Working Group Meeting March 21, 2022 Goal: By 2030, GRSB and its members will ensure the beef value chain is a net-positive contributor to nature Interim Milestone: By 2023, GRSB and its members will be able
"GRSB Nature Positive Goal Joint Working Group" is the property of its rightful owner. Permission is granted to
download and print the materials on this website for personal, non-commercial use only, and to display it
on your personal computer provided you do not modify the materials and that you retain all copyright
notices contained in the materials. By downloading content from our website, you accept the terms of this
agreement.
Presentation Transcript
01
GRSB Nature Positive Goal
Joint Working Group Meeting March 21, 2022<br>
02
Goal: By 2030, GRSB and its members will ensure the beef value chain is a net-positive contributor to nature Interim Milestone: By 2023, GRSB and its members will be able to measure, track, report, and verify regional and global metrics that will clearly and transparently demonstrate progress and results toward this goal<br>
03
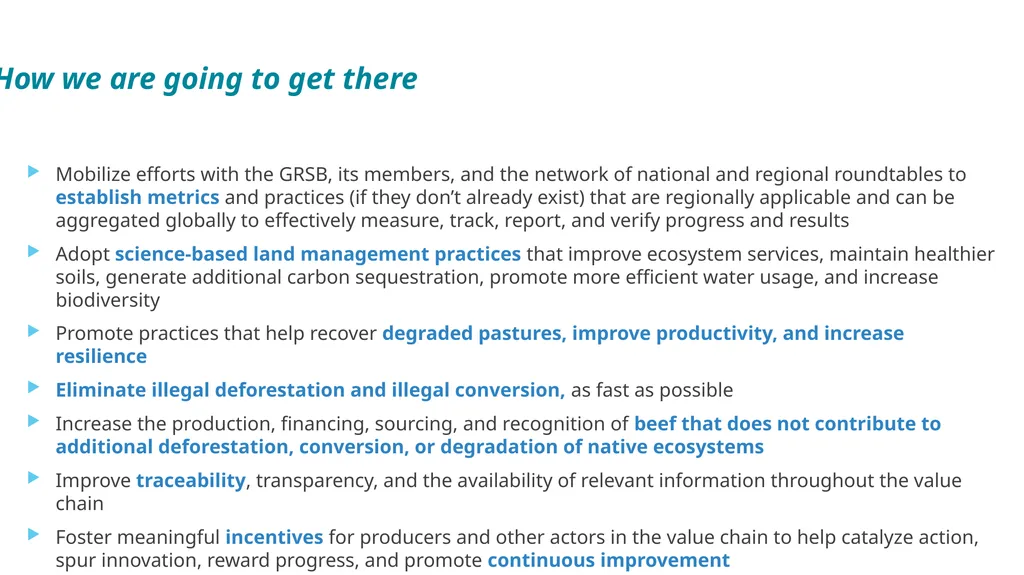
Mobilize efforts with the GRSB, its members, and the network of national and regional roundtables to establish metrics and practices (if they don’t already exist) that are regionally applicable and can be aggregated globally to effectively measure, track, report, and verify progress and results
Adopt science-based land management practices that improve ecosystem services, maintain healthier soils, generate additional carbon sequestration, promote more efficient water usage, and increase biodiversity
Promote practices that help recover degraded pastures, improve productivity, and increase resilience
Eliminate illegal deforestation and illegal conversion, as fast as possible
Increase the production, financing, sourcing, and recognition of beef that does not contribute to additional deforestation, conversion, or degradation of native ecosystems
Improve traceability, transparency, and the availability of relevant information throughout the value chain
Foster meaningful incentives for producers and other actors in the value chain to help catalyze action, spur innovation, reward progress, and promote continuous improvement How we are going to get there<br>
04
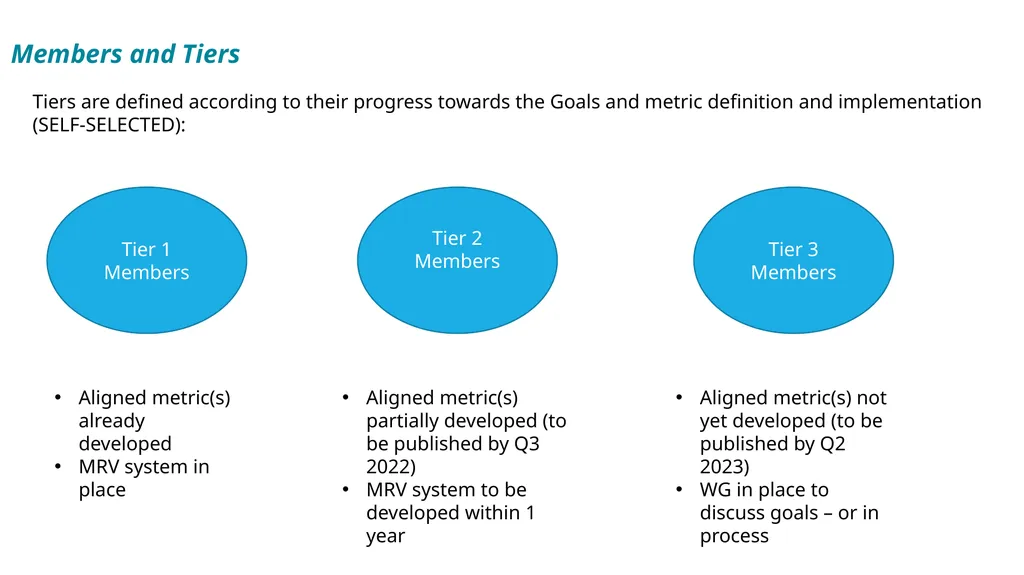
Tiers are defined according to their progress towards the Goals and metric definition and implementation (SELF-SELECTED): Tier 1 Members Tier 2 Members Tier 3 Members Members and Tiers Aligned metric(s) already developed
MRV system in place Aligned metric(s) partially developed (to be published by Q3 2022)
MRV system to be developed within 1 year Aligned metric(s) not yet developed (to be published by Q2 2023)
WG in place to discuss goals – or in process<br>
05
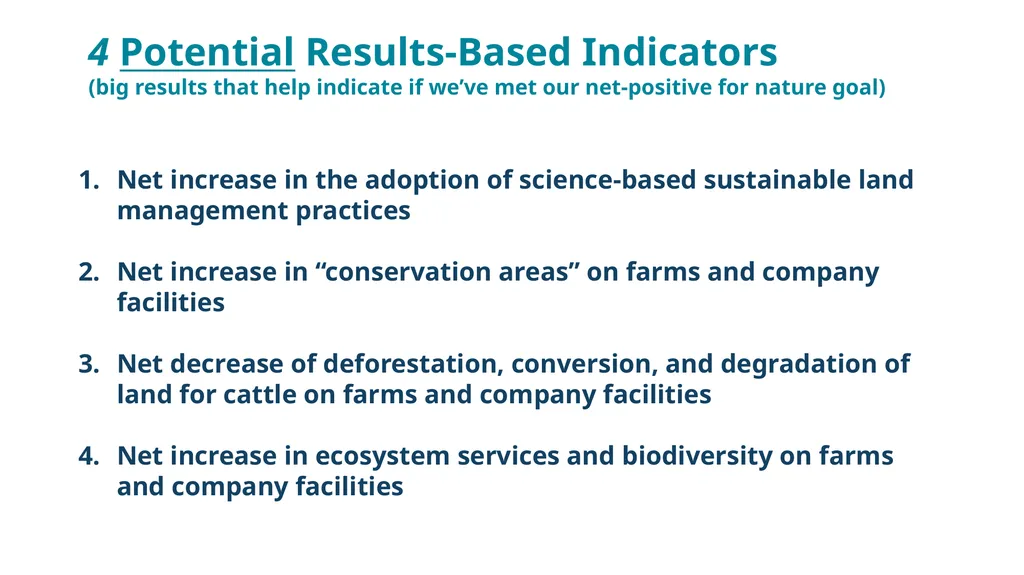
Net increase in the adoption of science-based sustainable land management practices
Net increase in “conservation areas” on farms and company facilities
Net decrease of deforestation, conversion, and degradation of land for cattle on farms and company facilities
Net increase in ecosystem services and biodiversity on farms and company facilities 4 Potential Results-Based Indicators
(big results that help indicate if we’ve met our net-positive for nature goal)<br>
06
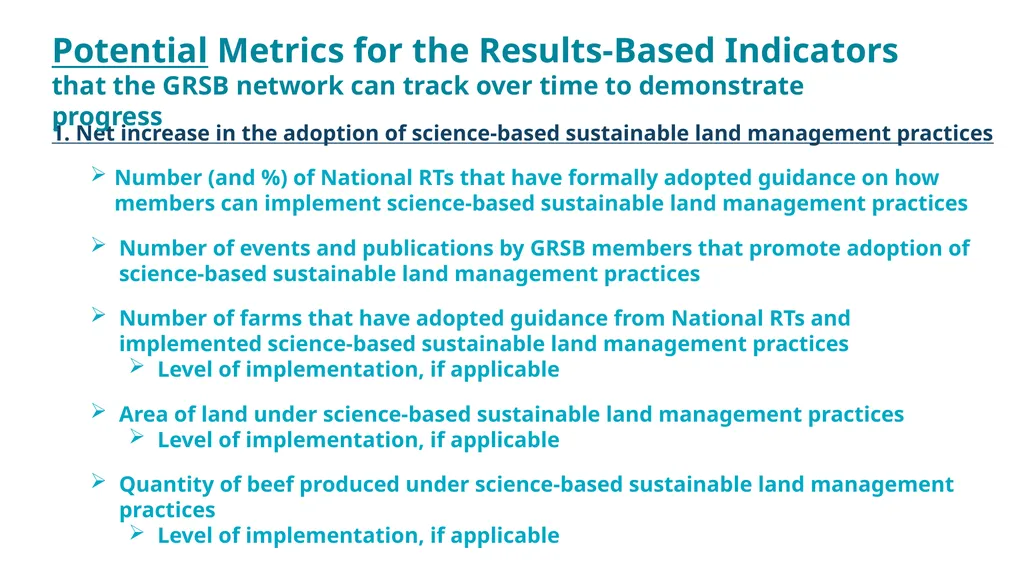
1. Net increase in the adoption of science-based sustainable land management practices
Number (and %) of National RTs that have formally adopted guidance on how members can implement science-based sustainable land management practices
Number of events and publications by GRSB members that promote adoption of science-based sustainable land management practices
Number of farms that have adopted guidance from National RTs and implemented science-based sustainable land management practices
Level of implementation, if applicable
Area of land under science-based sustainable land management practices
Level of implementation, if applicable
Quantity of beef produced under science-based sustainable land management practices
Level of implementation, if applicable Potential Metrics for the Results-Based Indicators
that the GRSB network can track over time to demonstrate progress<br>
07
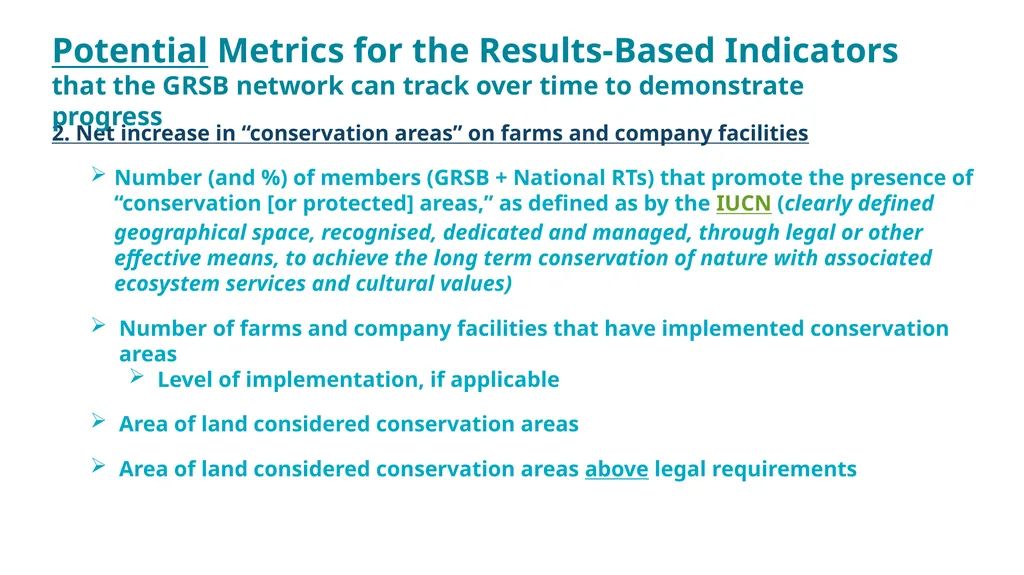
2. Net increase in “conservation areas” on farms and company facilities
Number (and %) of members (GRSB + National RTs) that promote the presence of “conservation [or protected] areas,” as defined as by the IUCN (clearly defined geographical space, recognised, dedicated and managed, through legal or other effective means, to achieve the long term conservation of nature with associated ecosystem services and cultural values)
Number of farms and company facilities that have implemented conservation areas
Level of implementation, if applicable
Area of land considered conservation areas
Area of land considered conservation areas above legal requirements Potential Metrics for the Results-Based Indicators
that the GRSB network can track over time to demonstrate progress<br>
08
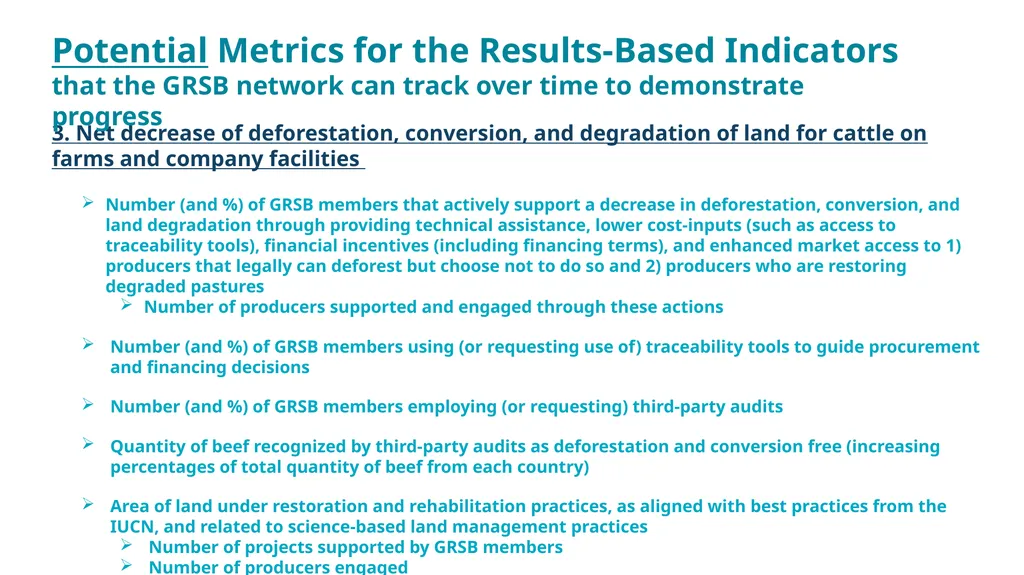
3. Net decrease of deforestation, conversion, and degradation of land for cattle on farms and company facilities Potential Metrics for the Results-Based Indicators
that the GRSB network can track over time to demonstrate progress Number (and %) of GRSB members that actively support a decrease in deforestation, conversion, and land degradation through providing technical assistance, lower cost-inputs (such as access to traceability tools), financial incentives (including financing terms), and enhanced market access to 1) producers that legally can deforest but choose not to do so and 2) producers who are restoring degraded pastures
Number of producers supported and engaged through these actions
Number (and %) of GRSB members using (or requesting use of) traceability tools to guide procurement and financing decisions
Number (and %) of GRSB members employing (or requesting) third-party audits
Quantity of beef recognized by third-party audits as deforestation and conversion free (increasing percentages of total quantity of beef from each country)
Area of land under restoration and rehabilitation practices, as aligned with best practices from the IUCN, and related to science-based land management practices
Number of projects supported by GRSB members
Number of producers engaged<br>
09
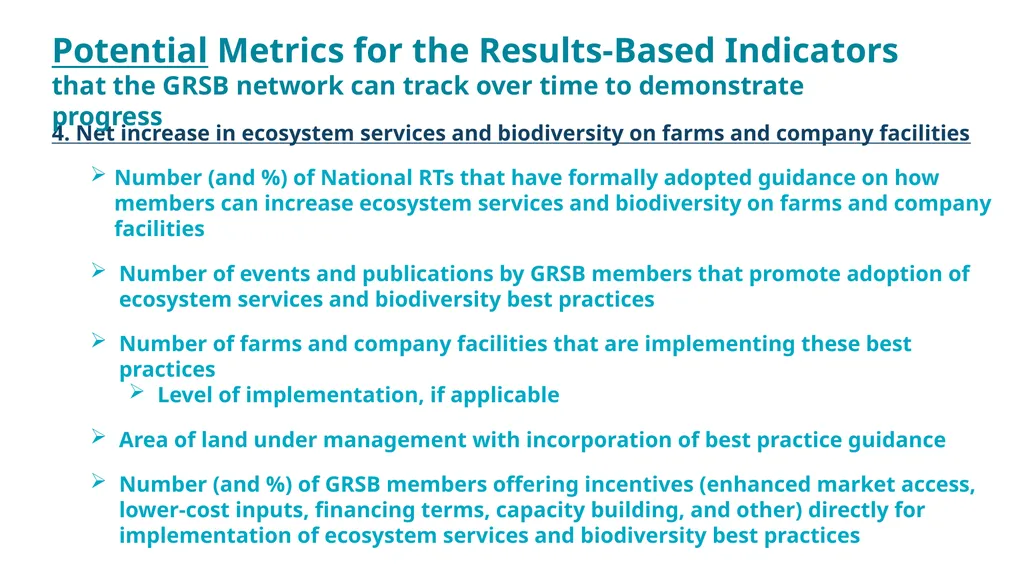
4. Net increase in ecosystem services and biodiversity on farms and company facilities
Number (and %) of National RTs that have formally adopted guidance on how members can increase ecosystem services and biodiversity on farms and company facilities
Number of events and publications by GRSB members that promote adoption of ecosystem services and biodiversity best practices
Number of farms and company facilities that are implementing these best practices
Level of implementation, if applicable
Area of land under management with incorporation of best practice guidance
Number (and %) of GRSB members offering incentives (enhanced market access, lower-cost inputs, financing terms, capacity building, and other) directly for implementation of ecosystem services and biodiversity best practices Potential Metrics for the Results-Based Indicators
that the GRSB network can track over time to demonstrate progress<br>