
Hands-On Performance with the Windows Performance

Description: Hands-On Performance with the Windows Performance Toolkit Erik Holt Senior Program Manager Lead Microsoft Corporation Objectives Learn how to analyze systems in production environments Learn about the Windows Performance Toolkit (WPT)
Related Topics
Download Presentation
"Hands-On Performance with the Windows Performance" is the property of its rightful owner. Permission is granted to download and print the materials on this website for personal, non-commercial use only, and to display it on your personal computer provided you do not modify the materials and that you retain all copyright notices contained in the materials. By downloading content from our website, you accept the terms of this agreement.
Presentation Transcript
slide2. Hands-On Performance
with the Windows Performance Toolkit Erik Holt
Senior Program Manager Lead
Microsoft Corporation<br>
slide3. Objectives Learn how to analyze systems in production environments
Learn about the Windows® Performance Toolkit (WPT)
Learn how to collect a performance trace
Learn how to perform basic analysis of a performance trace<br>
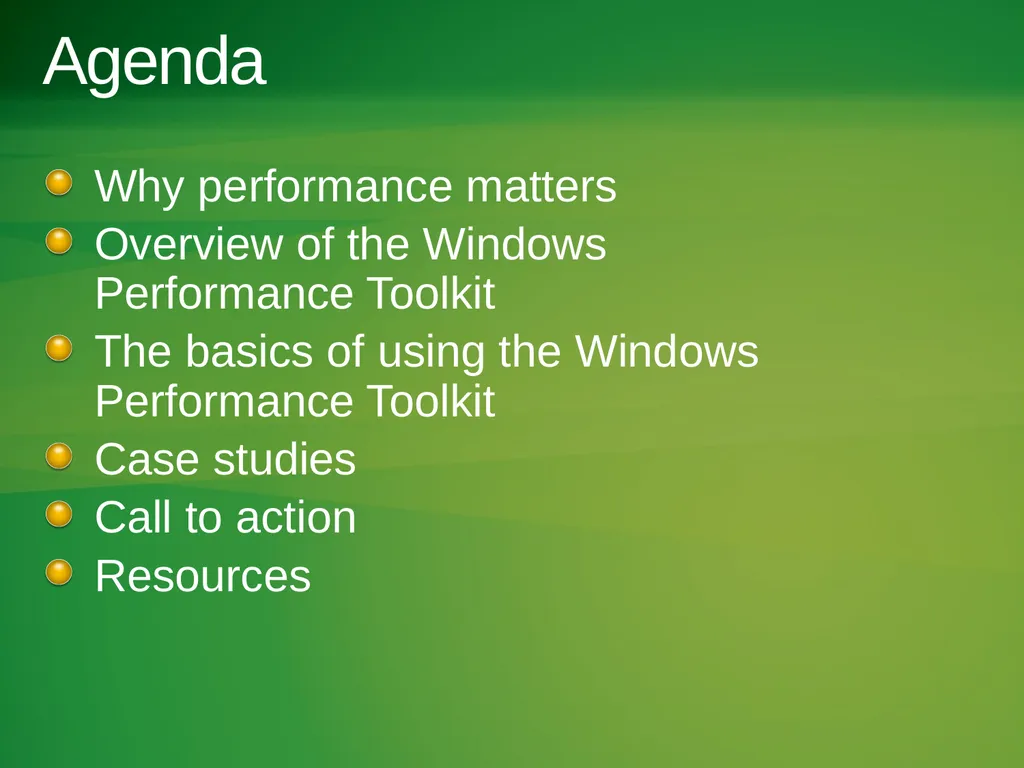
slide4. Agenda Why performance matters
Overview of the Windows Performance Toolkit
The basics of using the Windows Performance Toolkit
Case studies
Call to action
Resources<br>
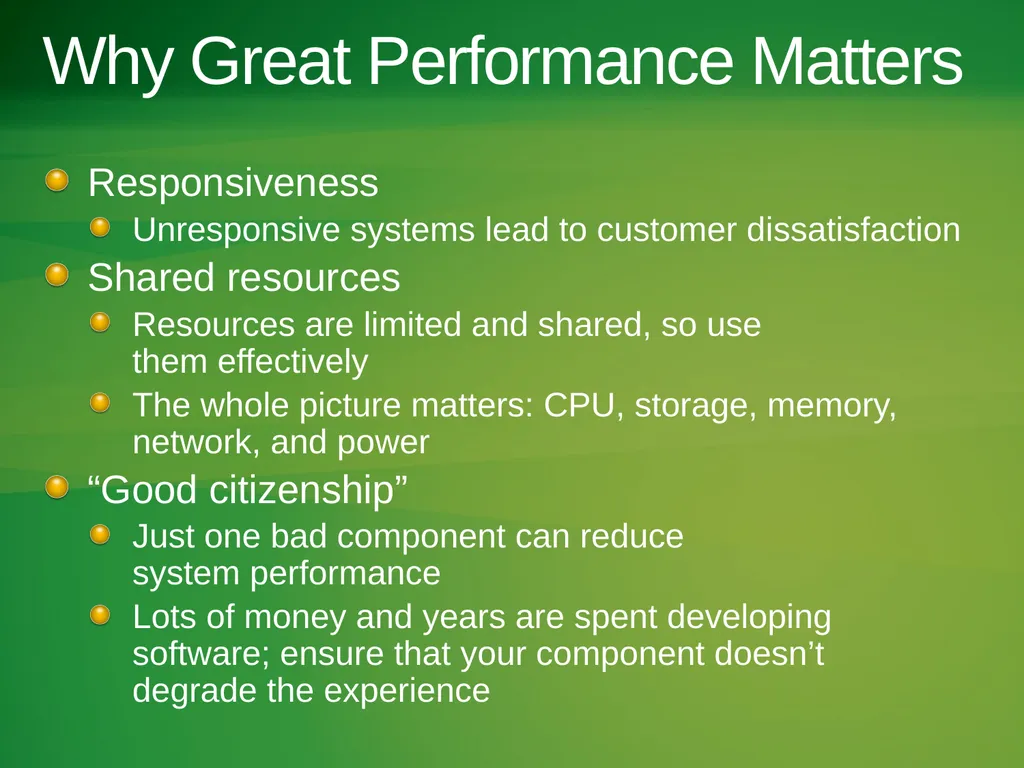
slide5. Why Great Performance Matters Responsiveness
Unresponsive systems lead to customer dissatisfaction
Shared resources
Resources are limited and shared, so use them effectively
The whole picture matters: CPU, storage, memory, network, and power
“Good citizenship”
Just one bad component can reduce system performance
Lots of money and years are spent developing software; ensure that your component doesn’t degrade the experience<br>
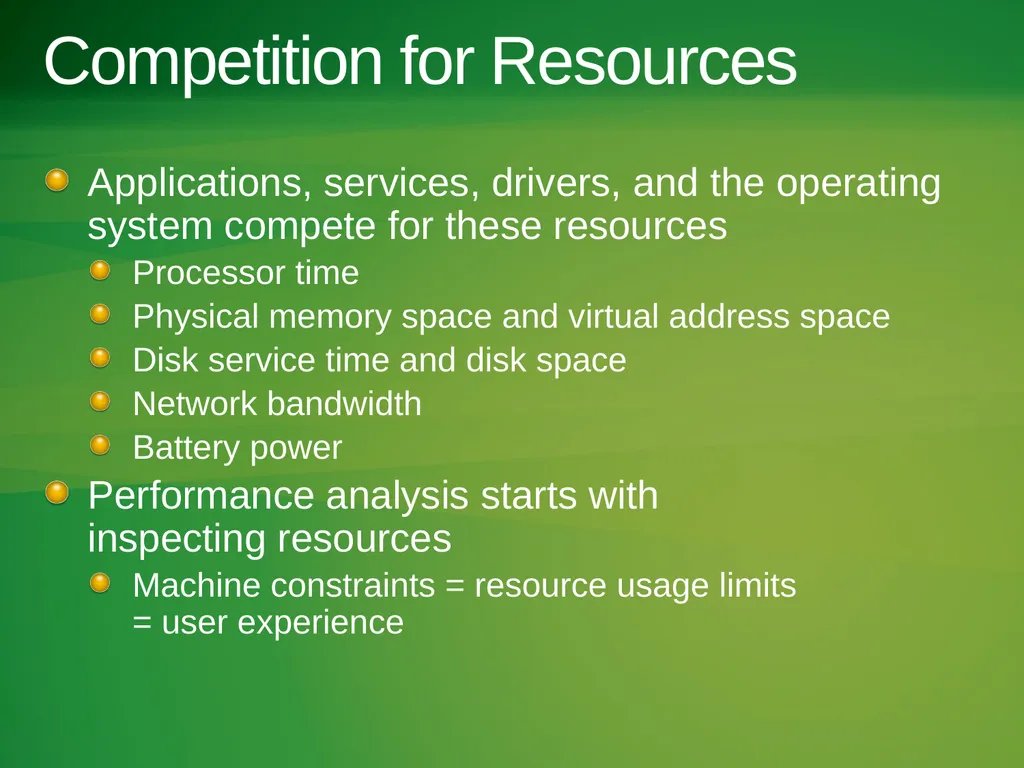
slide6. Competition for Resources Applications, services, drivers, and the operating system compete for these resources
Processor time
Physical memory space and virtual address space
Disk service time and disk space
Network bandwidth
Battery power
Performance analysis starts with inspecting resources
Machine constraints = resource usage limits = user experience<br>
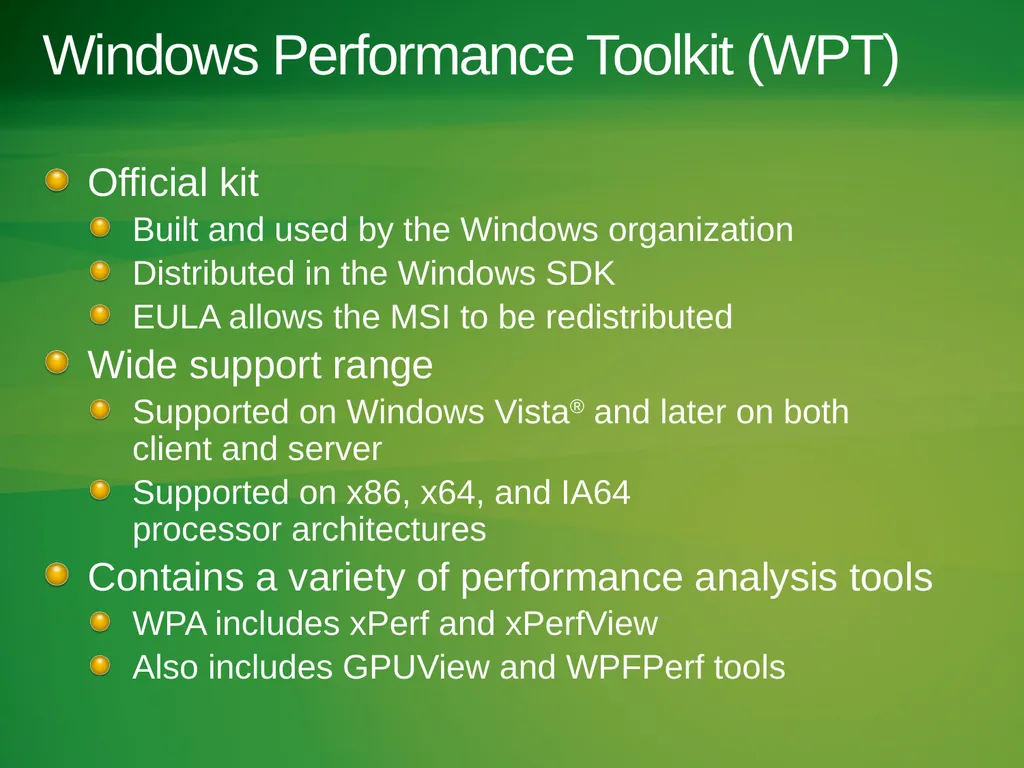
slide7. Windows Performance Toolkit (WPT) Official kit
Built and used by the Windows organization
Distributed in the Windows SDK
EULA allows the MSI to be redistributed
Wide support range
Supported on Windows Vista® and later on both client and server
Supported on x86, x64, and IA64 processor architectures
Contains a variety of performance analysis tools
WPA includes xPerf and xPerfView
Also includes GPUView and WPFPerf tools<br>
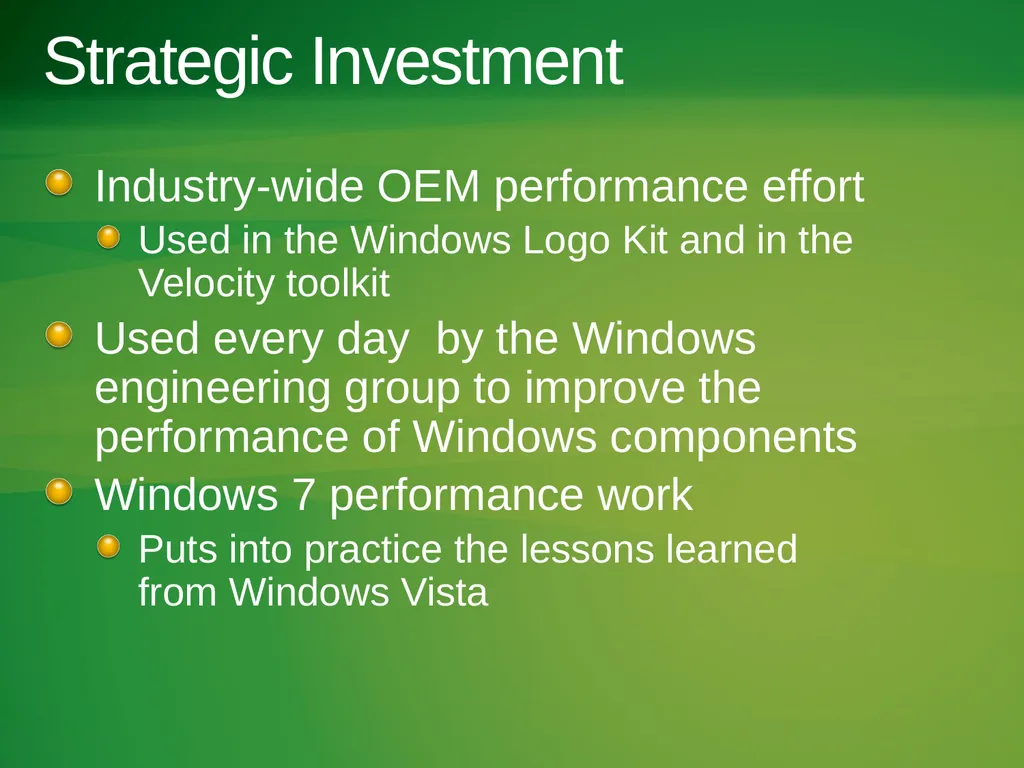
slide8. Strategic Investment Industry-wide OEM performance effort
Used in the Windows Logo Kit and in the Velocity toolkit
Used every day by the Windows engineering group to improve the performance of Windows components
Windows 7 performance work
Puts into practice the lessons learned from Windows Vista<br>
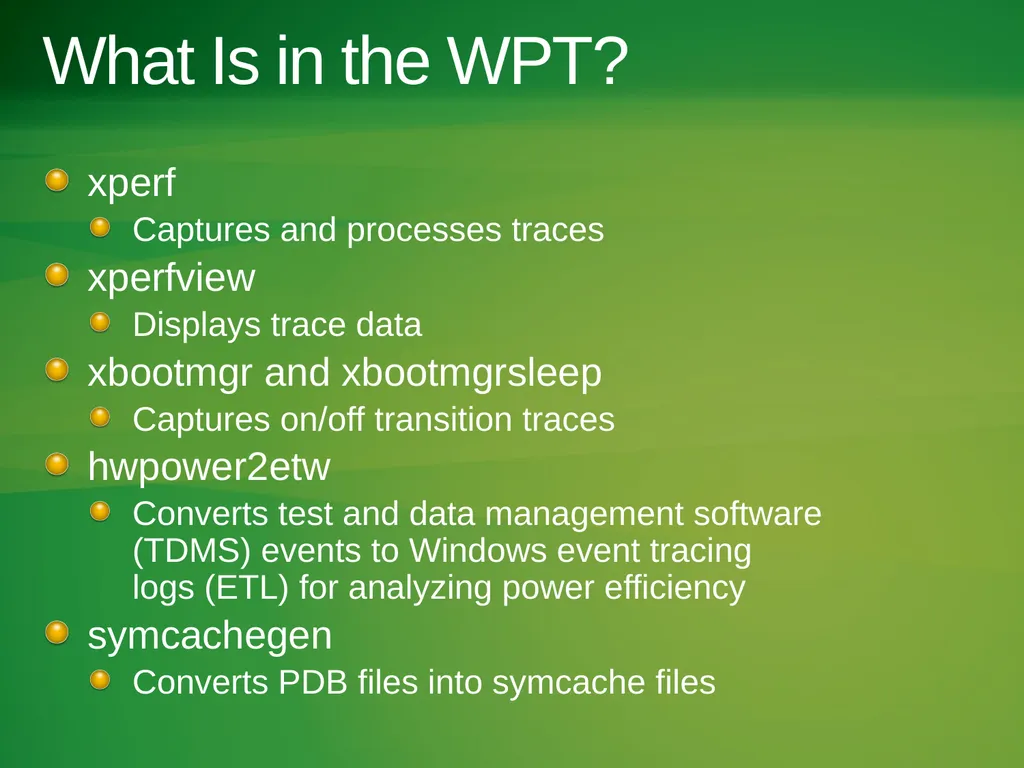
slide9. What Is in the WPT? xperf
Captures and processes traces
xperfview
Displays trace data
xbootmgr and xbootmgrsleep
Captures on/off transition traces
hwpower2etw
Converts test and data management software (TDMS) events to Windows event tracing logs (ETL) for analyzing power efficiency
symcachegen
Converts PDB files into symcache files<br>
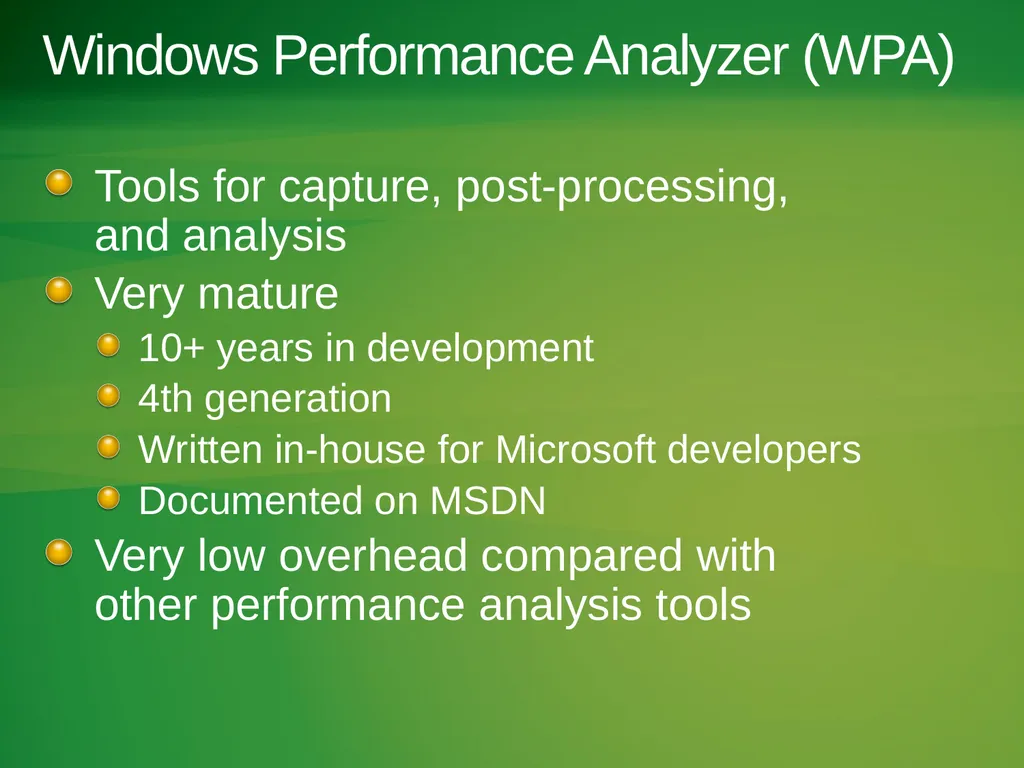
slide10. Windows Performance Analyzer (WPA) Tools for capture, post-processing, and analysis
Very mature
10+ years in development
4th generation
Written in-house for Microsoft developers
Documented on MSDN
Very low overhead compared with other performance analysis tools<br>
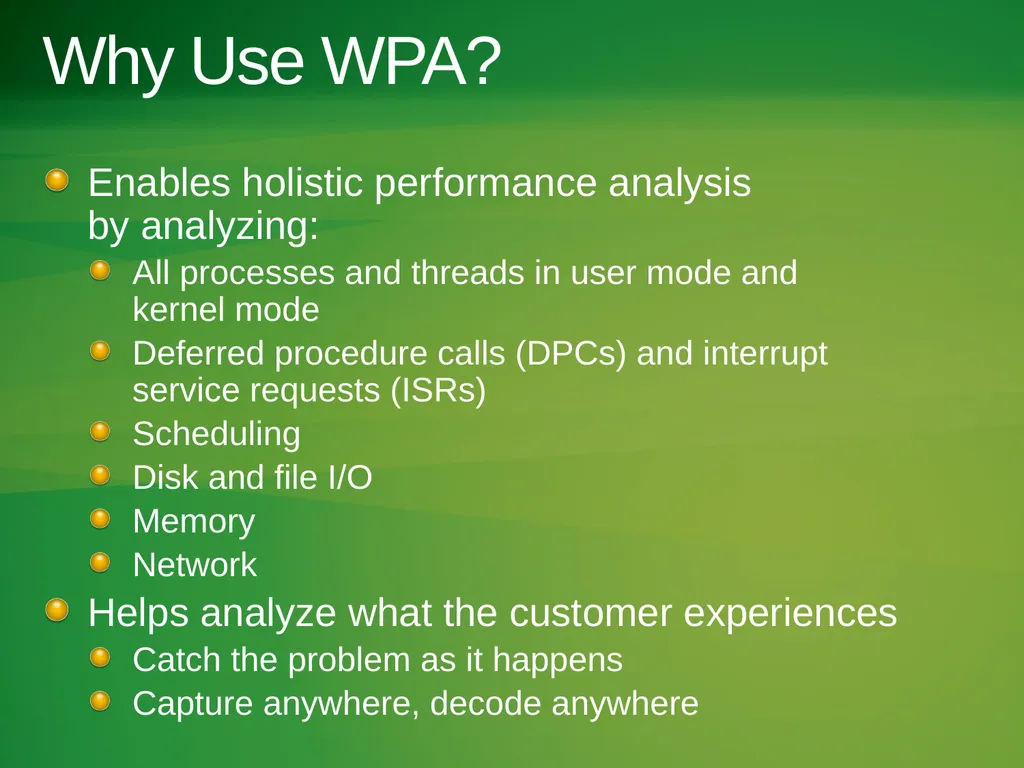
slide11. Why Use WPA? Enables holistic performance analysis by analyzing:
All processes and threads in user mode and kernel mode
Deferred procedure calls (DPCs) and interrupt service requests (ISRs)
Scheduling
Disk and file I/O
Memory
Network
Helps analyze what the customer experiences
Catch the problem as it happens
Capture anywhere, decode anywhere<br>
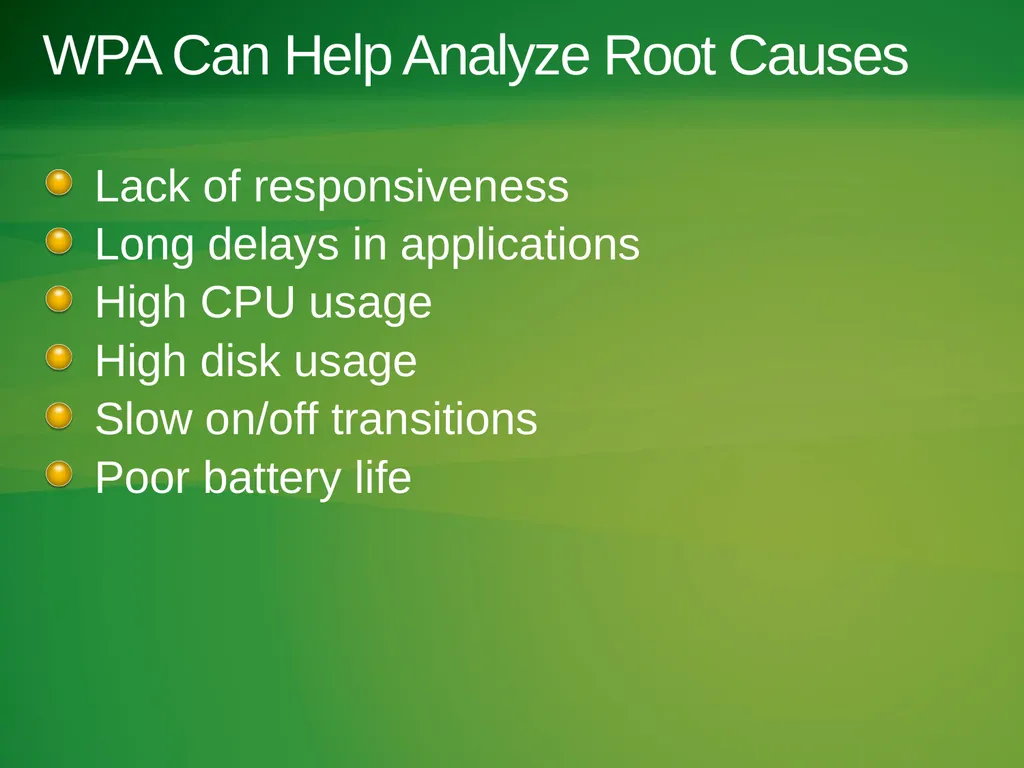
slide12. WPA Can Help Analyze Root Causes Lack of responsiveness
Long delays in applications
High CPU usage
High disk usage
Slow on/off transitions
Poor battery life<br>
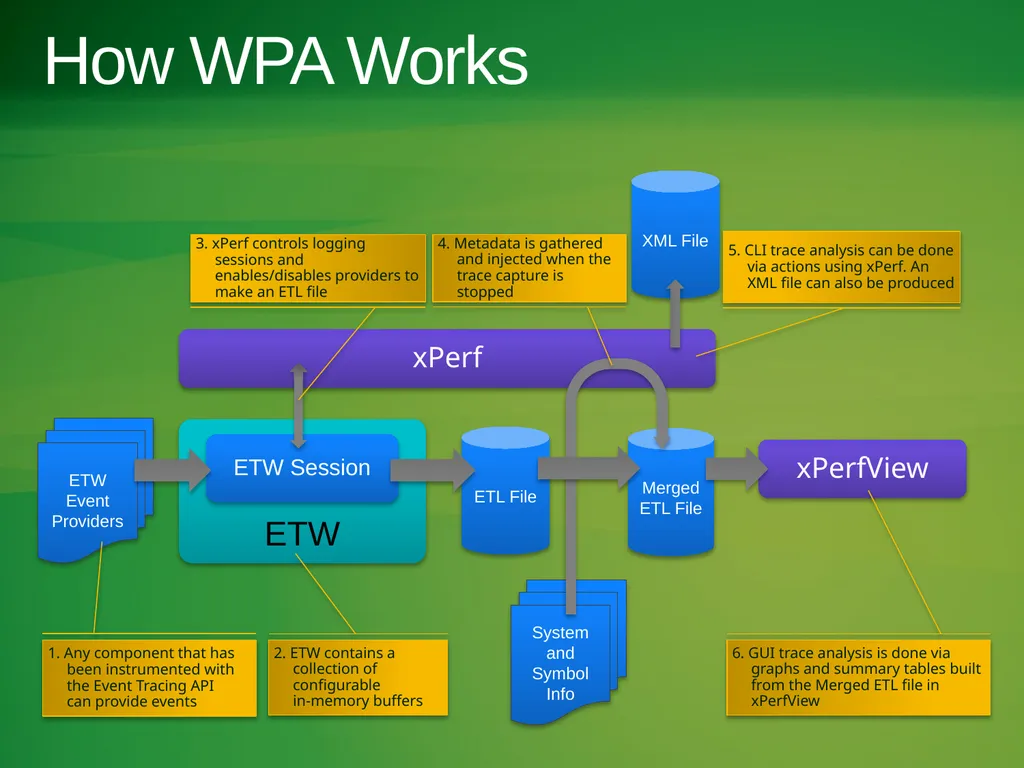
slide13. ETW How WPA Works ETL File ETW Session ETW Event Providers Merged ETL File XML File System and Symbol Info xPerfView xPerf 2. ETW contains a collection of configurable in-memory buffers 1. Any component that has been instrumented with the Event Tracing API can provide events 3. xPerf controls logging sessions and enables/disables providers to make an ETL file 6. GUI trace analysis is done via graphs and summary tables built from the Merged ETL file in xPerfView 5. CLI trace analysis can be done via actions using xPerf. An XML file can also be produced 4. Metadata is gathered and injected when the trace capture is stopped<br>
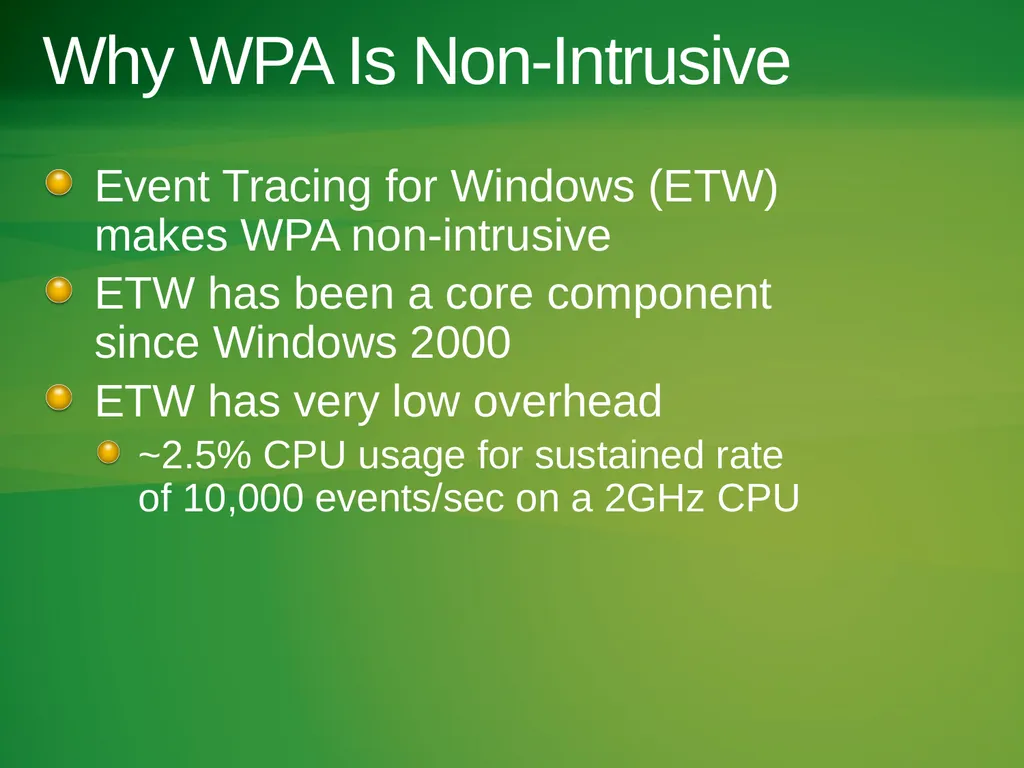
slide14. Why WPA Is Non-Intrusive Event Tracing for Windows (ETW) makes WPA non-intrusive
ETW has been a core component since Windows 2000
ETW has very low overhead
~2.5% CPU usage for sustained rate of 10,000 events/sec on a 2GHz CPU<br>
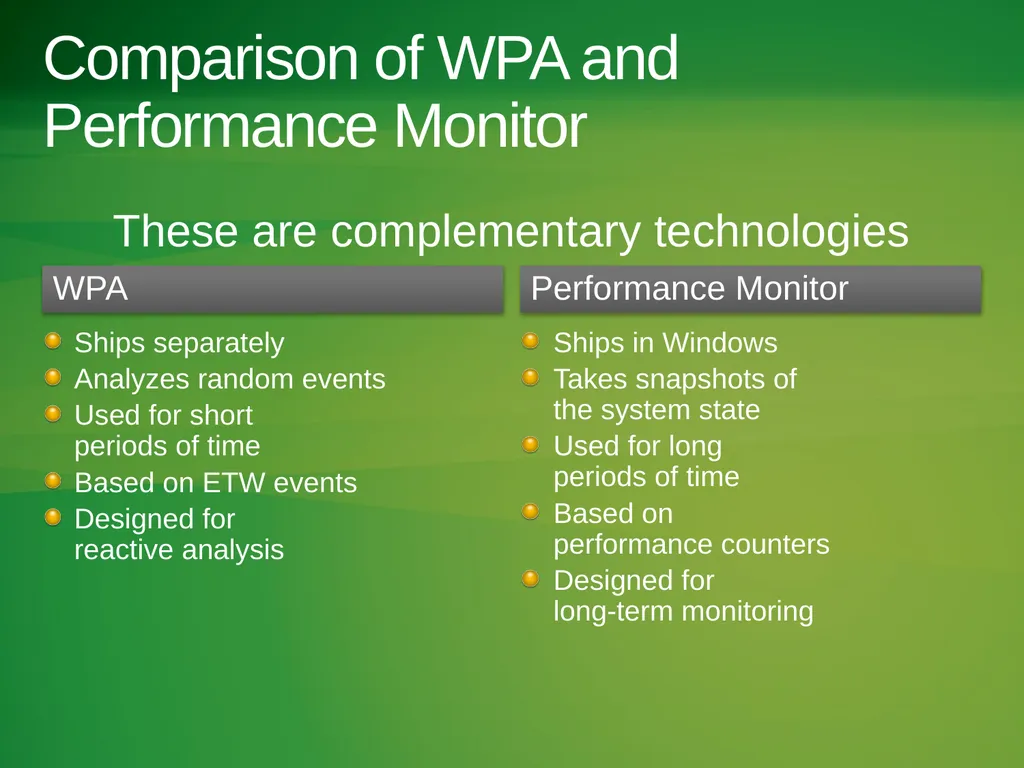
slide15. Comparison of WPA and Performance Monitor WPA Ships separately
Analyzes random events
Used for short periods of time
Based on ETW events
Designed for reactive analysis Performance Monitor Ships in Windows
Takes snapshots of the system state
Used for long periods of time
Based on performance counters
Designed for long-term monitoring These are complementary technologies<br>
slide16. New Features in WPT 4.8 Search in summary tables
Memory analysis: pool, heap, CONTMEMGEN
Energy efficiency analysis
Disk idle analysis
Improvements to the CPU idle histogram analysis
Spinlock analysis
256-processor support
Customizable summary table layout UI profiles
Selection-based filtering in summary tables<br>
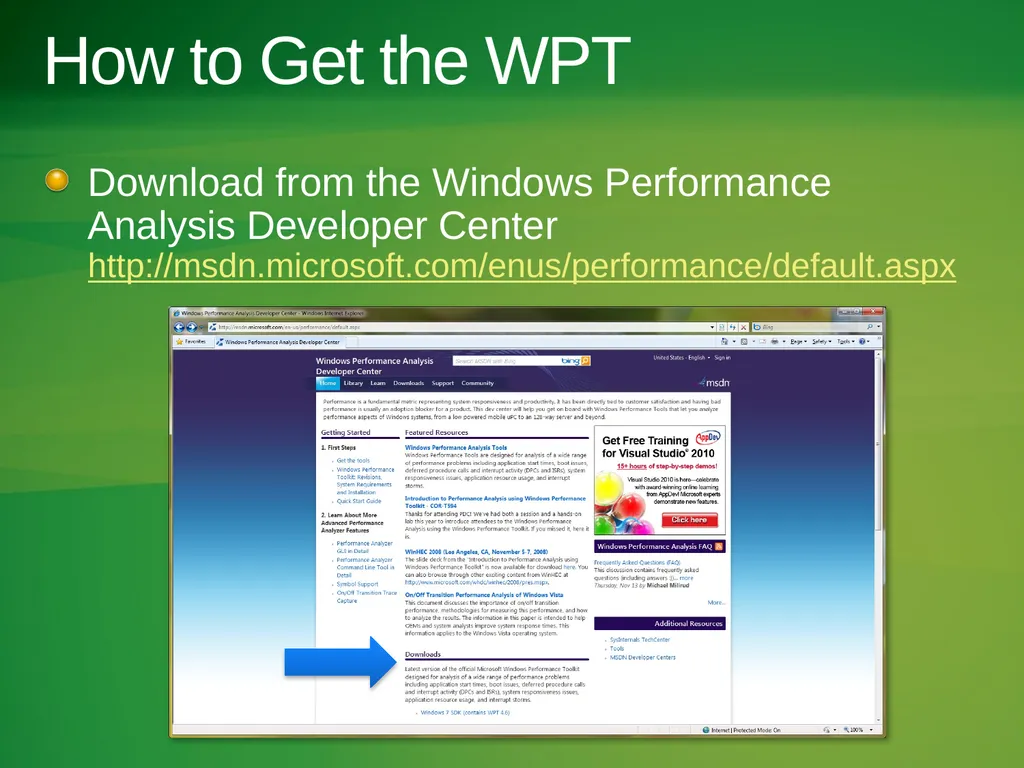
slide17. How to Get the WPT Download from the Windows Performance Analysis Developer Center http://msdn.microsoft.com/enus/performance/default.aspx<br>
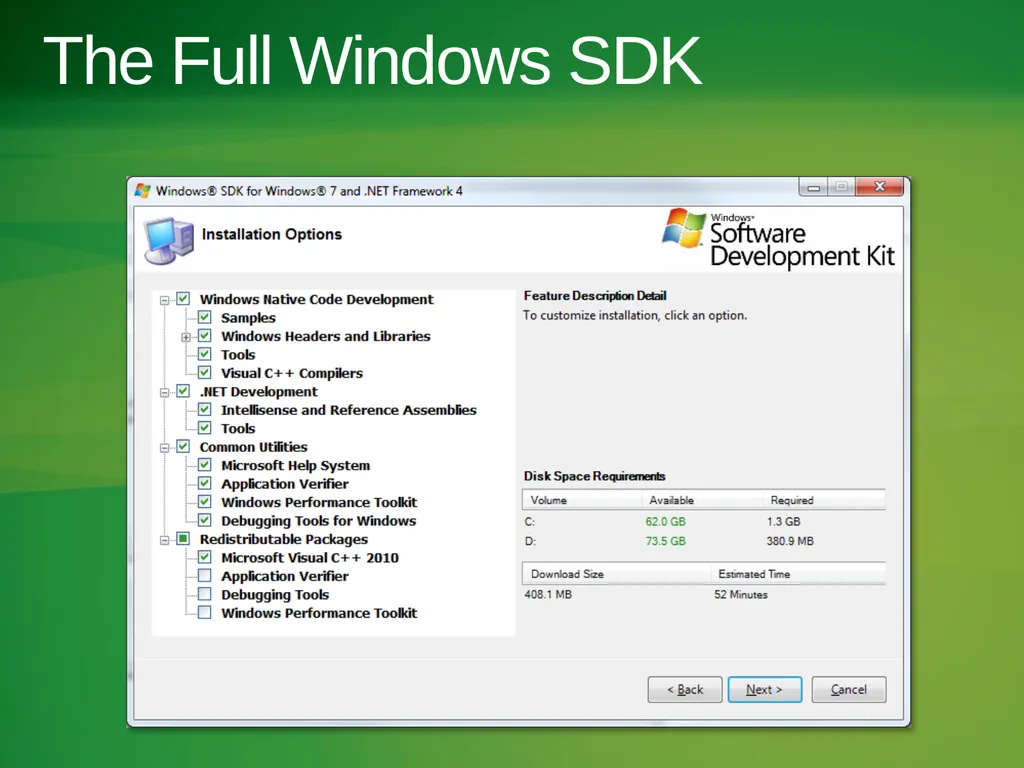
slide18. The Full Windows SDK<br>
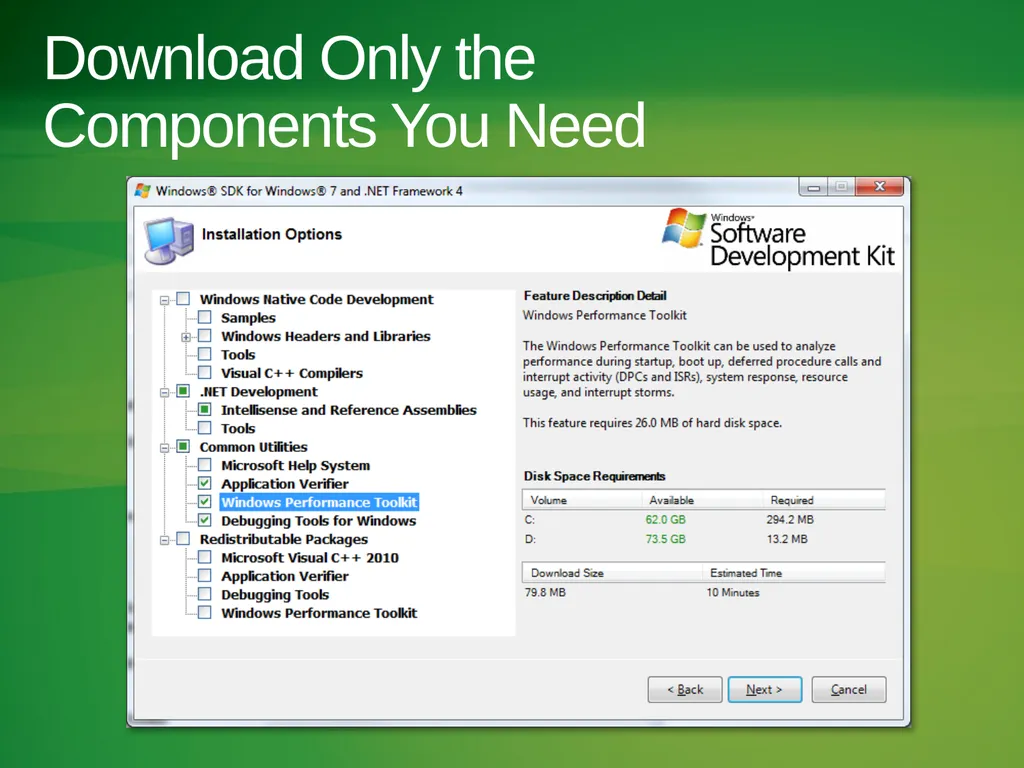
slide19. Download Only the Components You Need<br>
slide20. Performance Analyzer Preview demo<br>
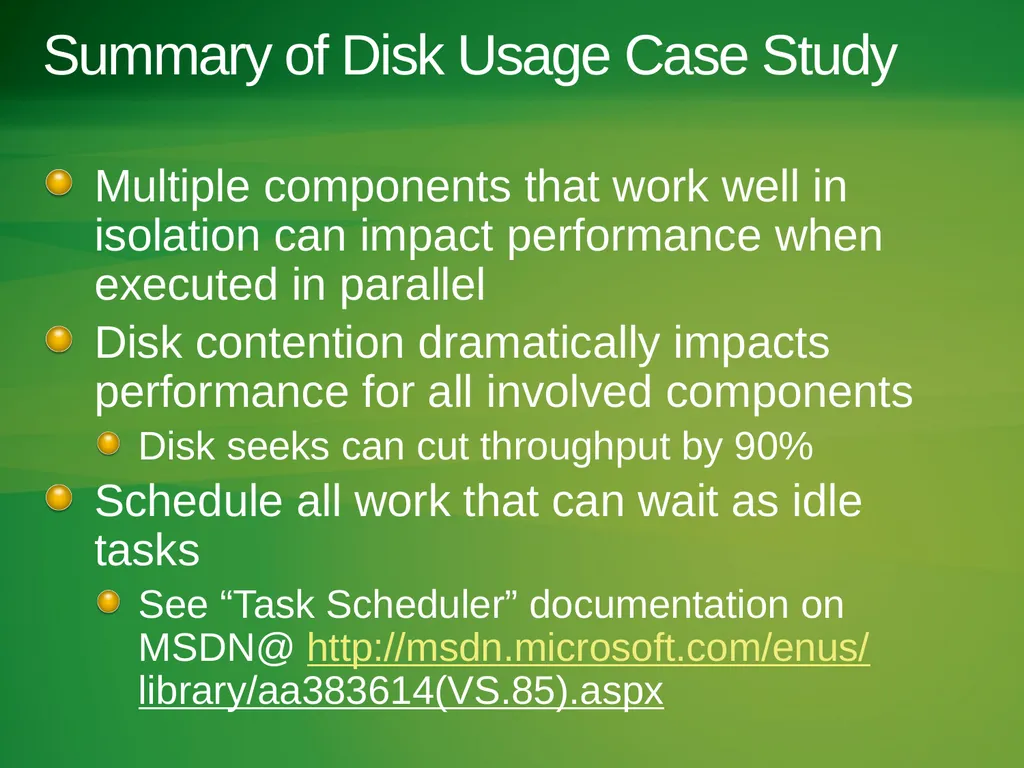
slide21. Summary of Disk Usage Case Study Multiple components that work well in isolation can impact performance when executed in parallel
Disk contention dramatically impacts performance for all involved components
Disk seeks can cut throughput by 90%
Schedule all work that can wait as idle tasks
See “Task Scheduler” documentation on MSDN@ http://msdn.microsoft.com/enus/ library/aa383614(VS.85).aspx<br>
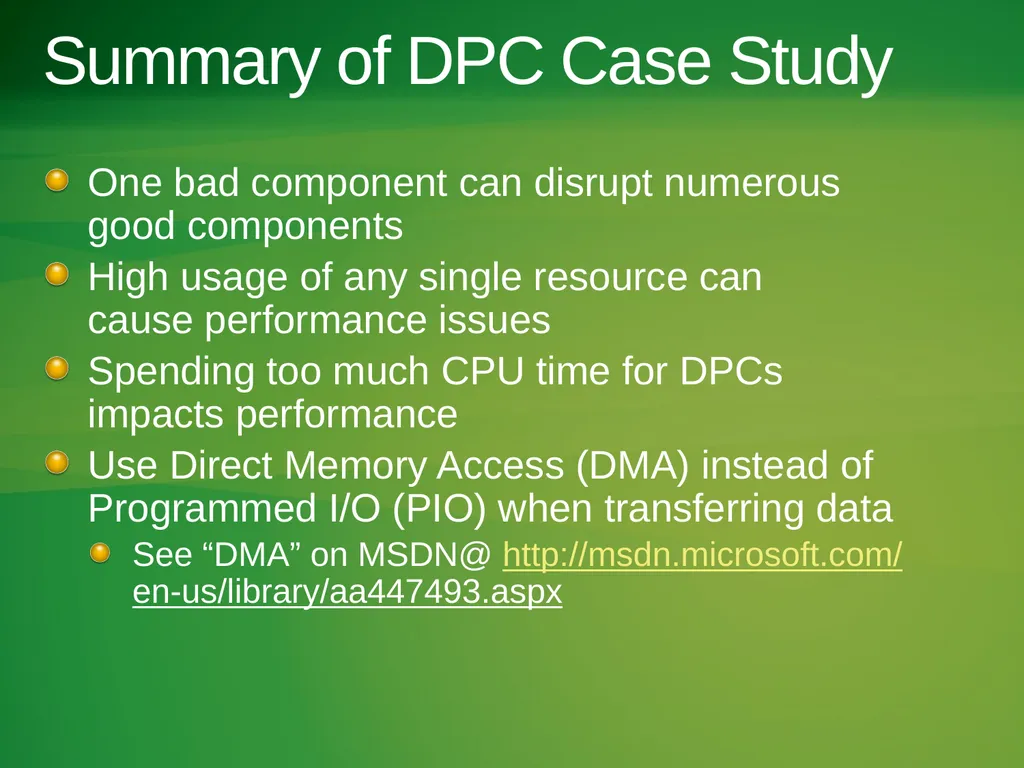
slide22. Summary of DPC Case Study One bad component can disrupt numerous good components
High usage of any single resource can cause performance issues
Spending too much CPU time for DPCs impacts performance
Use Direct Memory Access (DMA) instead of Programmed I/O (PIO) when transferring data
See “DMA” on MSDN@ http://msdn.microsoft.com/ en-us/library/aa447493.aspx<br>
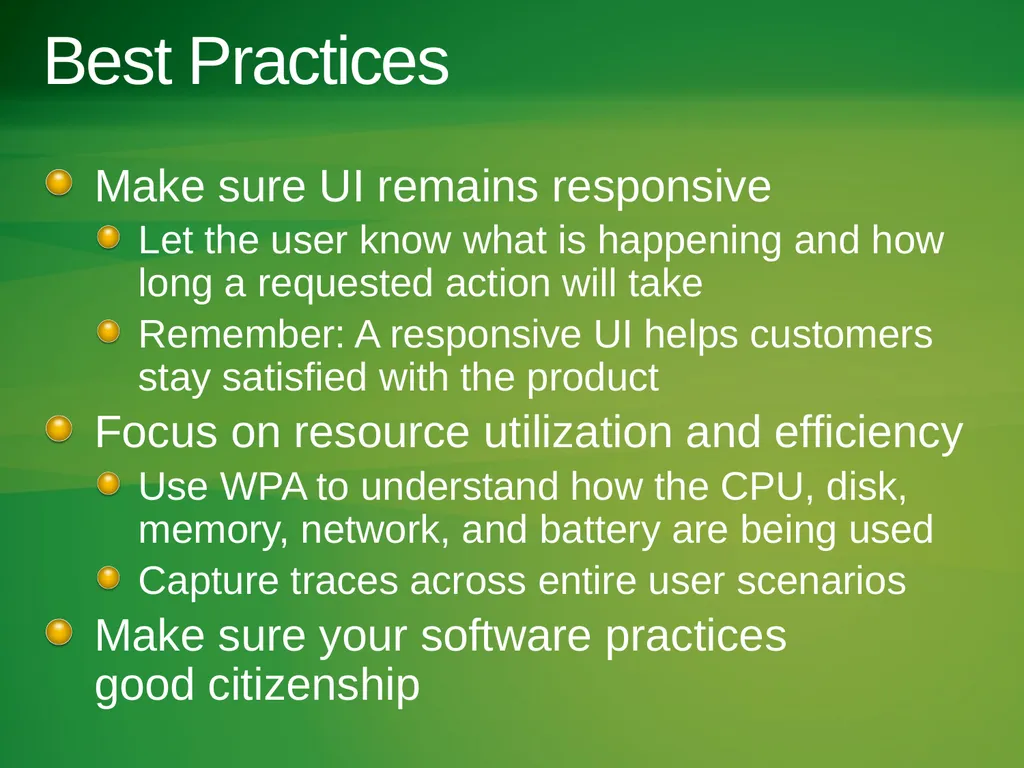
slide23. Best Practices Make sure UI remains responsive
Let the user know what is happening and how long a requested action will take
Remember: A responsive UI helps customers stay satisfied with the product
Focus on resource utilization and efficiency
Use WPA to understand how the CPU, disk, memory, network, and battery are being used
Capture traces across entire user scenarios
Make sure your software practices good citizenship<br>
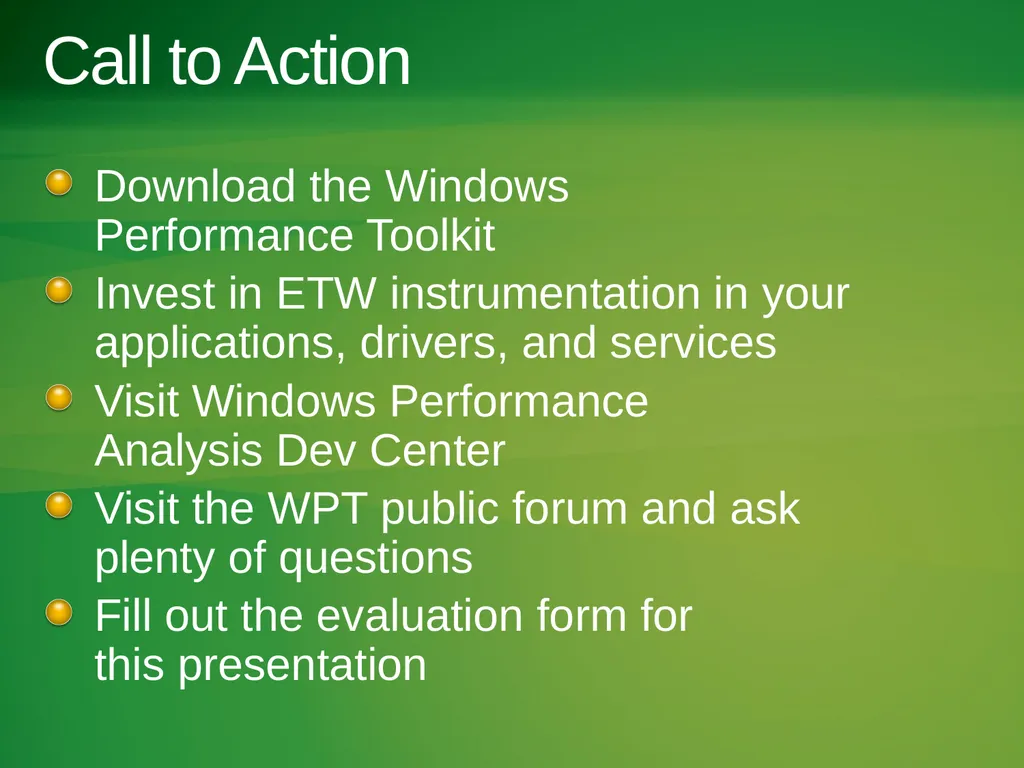
slide24. Call to Action Download the Windows Performance Toolkit
Invest in ETW instrumentation in your applications, drivers, and services
Visit Windows Performance Analysis Dev Center
Visit the WPT public forum and ask plenty of questions
Fill out the evaluation form for this presentation<br>
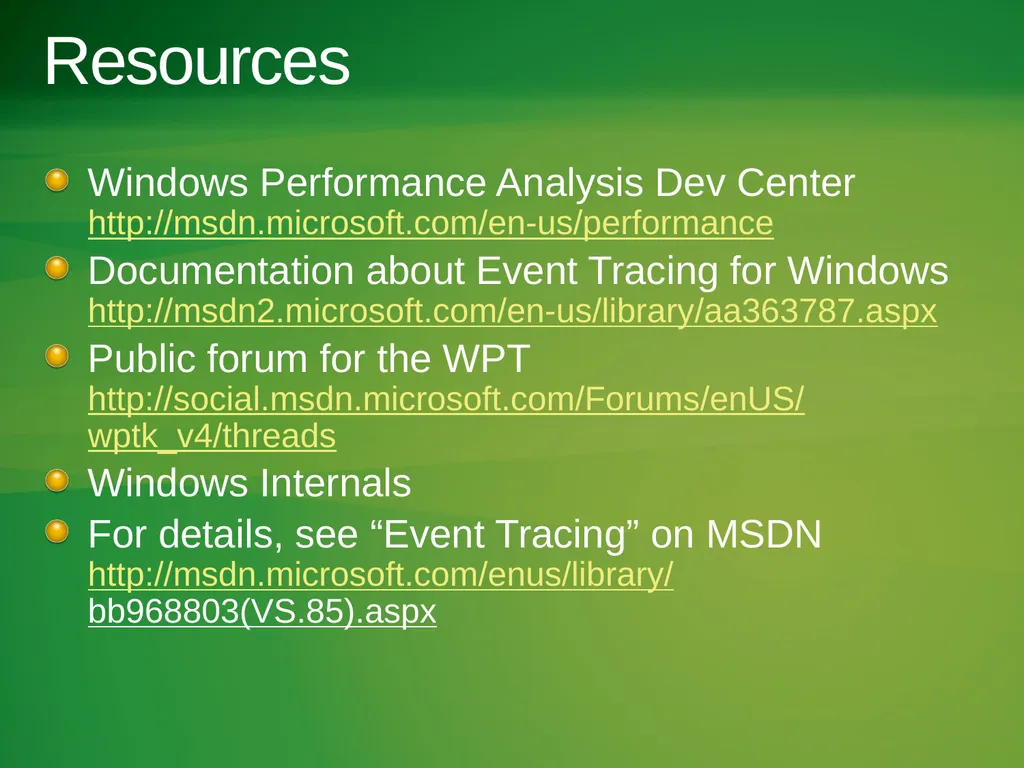
slide25. Resources Windows Performance Analysis Dev Center http://msdn.microsoft.com/en-us/performance
Documentation about Event Tracing for Windows http://msdn2.microsoft.com/en-us/library/aa363787.aspx
Public forum for the WPT http://social.msdn.microsoft.com/Forums/enUS/ wptk_v4/threads
Windows Internals
For details, see “Event Tracing” on MSDN http://msdn.microsoft.com/enus/library/ bb968803(VS.85).aspx<br>
slide26. © 2010 Microsoft Corporation. All rights reserved. Microsoft, Windows, Windows Vista and other product names are or may be registered trademarks and/or trademarks in the U.S. and/or other countries.
The information herein is for informational purposes only and represents the current view of Microsoft Corporation as of the date of this presentation. Because Microsoft must respond to changing market conditions, it should not be interpreted to be a commitment on the part of Microsoft, and Microsoft cannot guarantee the accuracy of any information provided after the date of this presentation.
MICROSOFT MAKES NO WARRANTIES, EXPRESS, IMPLIED OR STATUTORY, AS TO THE INFORMATION IN THIS PRESENTATION.<br>
Senior Program Manager Lead
Microsoft Corporation<br>
slide3. Objectives Learn how to analyze systems in production environments
Learn about the Windows® Performance Toolkit (WPT)
Learn how to collect a performance trace
Learn how to perform basic analysis of a performance trace<br>
slide4. Agenda Why performance matters
Overview of the Windows Performance Toolkit
The basics of using the Windows Performance Toolkit
Case studies
Call to action
Resources<br>
slide5. Why Great Performance Matters Responsiveness
Unresponsive systems lead to customer dissatisfaction
Shared resources
Resources are limited and shared, so use them effectively
The whole picture matters: CPU, storage, memory, network, and power
“Good citizenship”
Just one bad component can reduce system performance
Lots of money and years are spent developing software; ensure that your component doesn’t degrade the experience<br>
slide6. Competition for Resources Applications, services, drivers, and the operating system compete for these resources
Processor time
Physical memory space and virtual address space
Disk service time and disk space
Network bandwidth
Battery power
Performance analysis starts with inspecting resources
Machine constraints = resource usage limits = user experience<br>
slide7. Windows Performance Toolkit (WPT) Official kit
Built and used by the Windows organization
Distributed in the Windows SDK
EULA allows the MSI to be redistributed
Wide support range
Supported on Windows Vista® and later on both client and server
Supported on x86, x64, and IA64 processor architectures
Contains a variety of performance analysis tools
WPA includes xPerf and xPerfView
Also includes GPUView and WPFPerf tools<br>
slide8. Strategic Investment Industry-wide OEM performance effort
Used in the Windows Logo Kit and in the Velocity toolkit
Used every day by the Windows engineering group to improve the performance of Windows components
Windows 7 performance work
Puts into practice the lessons learned from Windows Vista<br>
slide9. What Is in the WPT? xperf
Captures and processes traces
xperfview
Displays trace data
xbootmgr and xbootmgrsleep
Captures on/off transition traces
hwpower2etw
Converts test and data management software (TDMS) events to Windows event tracing logs (ETL) for analyzing power efficiency
symcachegen
Converts PDB files into symcache files<br>
slide10. Windows Performance Analyzer (WPA) Tools for capture, post-processing, and analysis
Very mature
10+ years in development
4th generation
Written in-house for Microsoft developers
Documented on MSDN
Very low overhead compared with other performance analysis tools<br>
slide11. Why Use WPA? Enables holistic performance analysis by analyzing:
All processes and threads in user mode and kernel mode
Deferred procedure calls (DPCs) and interrupt service requests (ISRs)
Scheduling
Disk and file I/O
Memory
Network
Helps analyze what the customer experiences
Catch the problem as it happens
Capture anywhere, decode anywhere<br>
slide12. WPA Can Help Analyze Root Causes Lack of responsiveness
Long delays in applications
High CPU usage
High disk usage
Slow on/off transitions
Poor battery life<br>
slide13. ETW How WPA Works ETL File ETW Session ETW Event Providers Merged ETL File XML File System and Symbol Info xPerfView xPerf 2. ETW contains a collection of configurable in-memory buffers 1. Any component that has been instrumented with the Event Tracing API can provide events 3. xPerf controls logging sessions and enables/disables providers to make an ETL file 6. GUI trace analysis is done via graphs and summary tables built from the Merged ETL file in xPerfView 5. CLI trace analysis can be done via actions using xPerf. An XML file can also be produced 4. Metadata is gathered and injected when the trace capture is stopped<br>
slide14. Why WPA Is Non-Intrusive Event Tracing for Windows (ETW) makes WPA non-intrusive
ETW has been a core component since Windows 2000
ETW has very low overhead
~2.5% CPU usage for sustained rate of 10,000 events/sec on a 2GHz CPU<br>
slide15. Comparison of WPA and Performance Monitor WPA Ships separately
Analyzes random events
Used for short periods of time
Based on ETW events
Designed for reactive analysis Performance Monitor Ships in Windows
Takes snapshots of the system state
Used for long periods of time
Based on performance counters
Designed for long-term monitoring These are complementary technologies<br>
slide16. New Features in WPT 4.8 Search in summary tables
Memory analysis: pool, heap, CONTMEMGEN
Energy efficiency analysis
Disk idle analysis
Improvements to the CPU idle histogram analysis
Spinlock analysis
256-processor support
Customizable summary table layout UI profiles
Selection-based filtering in summary tables<br>
slide17. How to Get the WPT Download from the Windows Performance Analysis Developer Center http://msdn.microsoft.com/enus/performance/default.aspx<br>
slide18. The Full Windows SDK<br>
slide19. Download Only the Components You Need<br>
slide20. Performance Analyzer Preview demo<br>
slide21. Summary of Disk Usage Case Study Multiple components that work well in isolation can impact performance when executed in parallel
Disk contention dramatically impacts performance for all involved components
Disk seeks can cut throughput by 90%
Schedule all work that can wait as idle tasks
See “Task Scheduler” documentation on MSDN@ http://msdn.microsoft.com/enus/ library/aa383614(VS.85).aspx<br>
slide22. Summary of DPC Case Study One bad component can disrupt numerous good components
High usage of any single resource can cause performance issues
Spending too much CPU time for DPCs impacts performance
Use Direct Memory Access (DMA) instead of Programmed I/O (PIO) when transferring data
See “DMA” on MSDN@ http://msdn.microsoft.com/ en-us/library/aa447493.aspx<br>
slide23. Best Practices Make sure UI remains responsive
Let the user know what is happening and how long a requested action will take
Remember: A responsive UI helps customers stay satisfied with the product
Focus on resource utilization and efficiency
Use WPA to understand how the CPU, disk, memory, network, and battery are being used
Capture traces across entire user scenarios
Make sure your software practices good citizenship<br>
slide24. Call to Action Download the Windows Performance Toolkit
Invest in ETW instrumentation in your applications, drivers, and services
Visit Windows Performance Analysis Dev Center
Visit the WPT public forum and ask plenty of questions
Fill out the evaluation form for this presentation<br>
slide25. Resources Windows Performance Analysis Dev Center http://msdn.microsoft.com/en-us/performance
Documentation about Event Tracing for Windows http://msdn2.microsoft.com/en-us/library/aa363787.aspx
Public forum for the WPT http://social.msdn.microsoft.com/Forums/enUS/ wptk_v4/threads
Windows Internals
For details, see “Event Tracing” on MSDN http://msdn.microsoft.com/enus/library/ bb968803(VS.85).aspx<br>
slide26. © 2010 Microsoft Corporation. All rights reserved. Microsoft, Windows, Windows Vista and other product names are or may be registered trademarks and/or trademarks in the U.S. and/or other countries.
The information herein is for informational purposes only and represents the current view of Microsoft Corporation as of the date of this presentation. Because Microsoft must respond to changing market conditions, it should not be interpreted to be a commitment on the part of Microsoft, and Microsoft cannot guarantee the accuracy of any information provided after the date of this presentation.
MICROSOFT MAKES NO WARRANTIES, EXPRESS, IMPLIED OR STATUTORY, AS TO THE INFORMATION IN THIS PRESENTATION.<br>