Impact and Variability of Cloud Types on Earth's
Description: Impact and Variability of Cloud Types on Earths Top-of-Atmosphere Energy Balance in the Tropics Kuan-Man Xu1, Moguo Sun2 11. NASA Langley Research Center, Hampton, VA, USA 2. Analytical Mechanics Associates, Inc.Langley Research Center
Related Topics
Download Presentation
"Impact and Variability of Cloud Types on Earth's" is the property of its rightful owner. Permission is granted to download and print the materials on this website for personal, non-commercial use only, and to display it on your personal computer provided you do not modify the materials and that you retain all copyright notices contained in the materials. By downloading content from our website, you accept the terms of this agreement.
Presentation Transcript
slide1. Impact and Variability of Cloud Types on Earth's Top-of-Atmosphere Energy Balance in the TropicsKuan-Man Xu1, Moguo Sun2 11. NASA Langley Research Center, Hampton, VA, USA 2. Analytical Mechanics Associates, Inc./Langley Research Center<br>
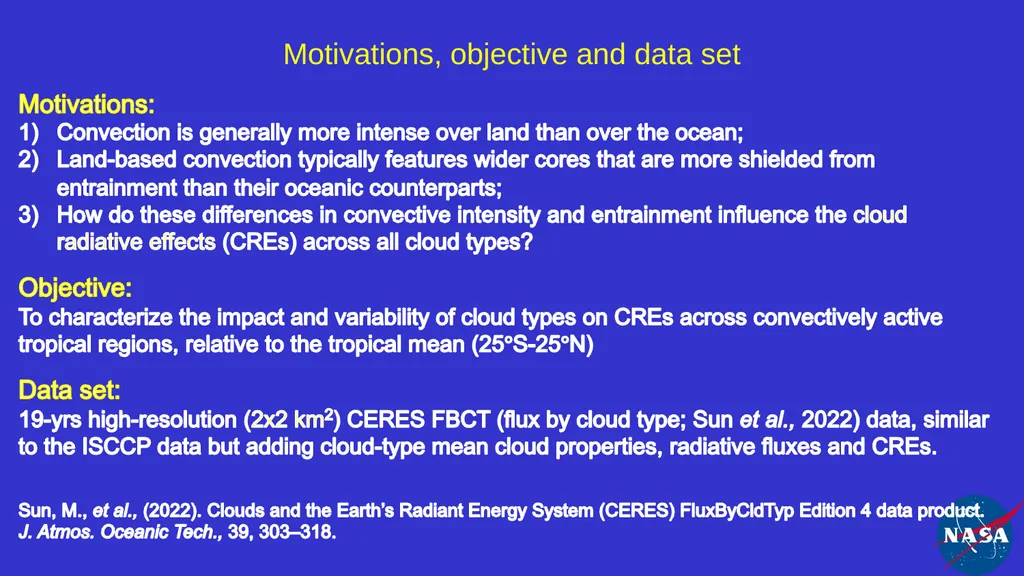
slide2. Motivations, objective and data set<br>
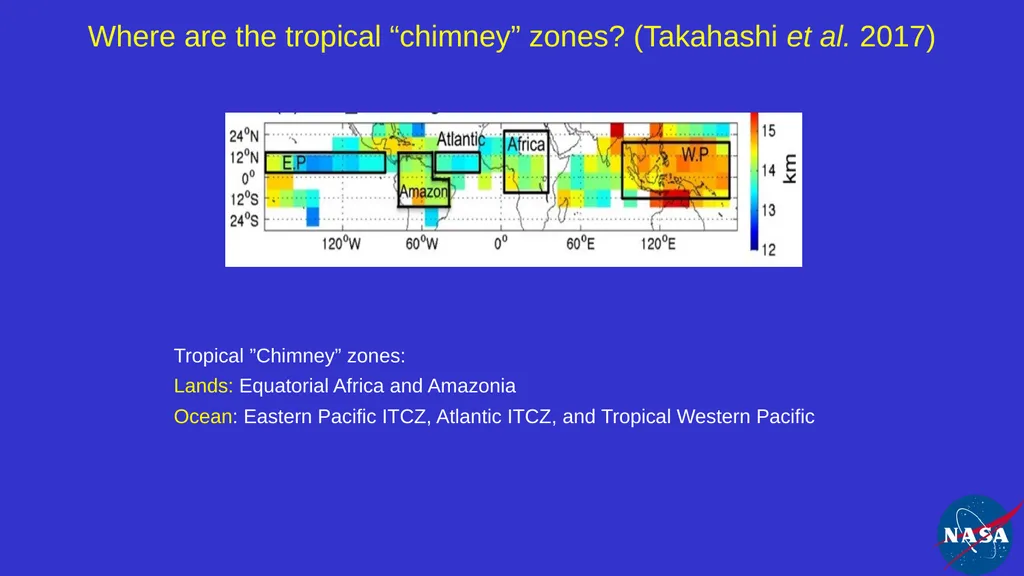
slide3. Where are the tropical “chimney” zones? (Takahashi et al. 2017) Tropical ”Chimney” zones:
Lands: Equatorial Africa and Amazonia
Ocean: Eastern Pacific ITCZ, Atlantic ITCZ, and Tropical Western Pacific<br>
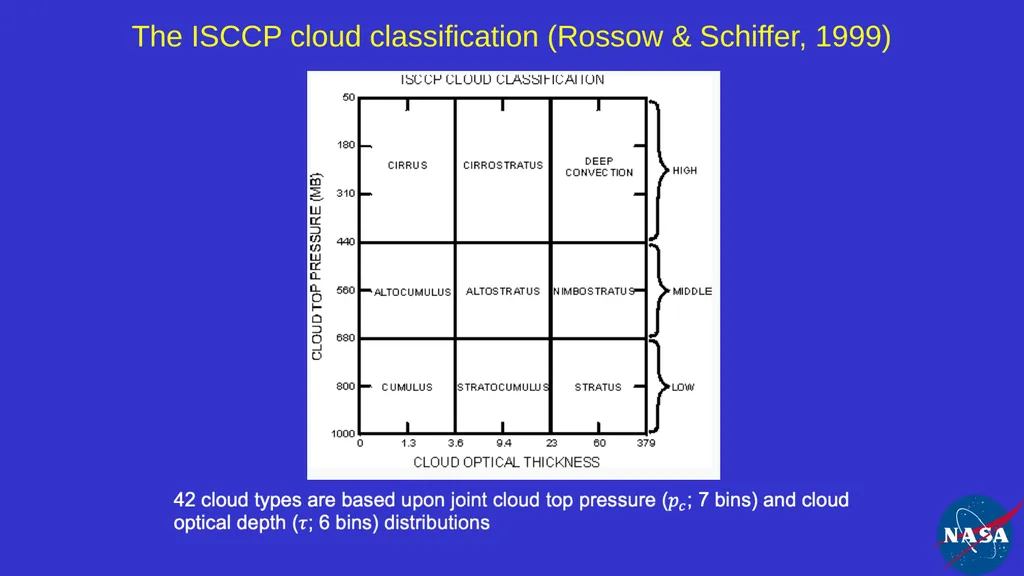
slide4. The ISCCP cloud classification (Rossow & Schiffer, 1999)<br>
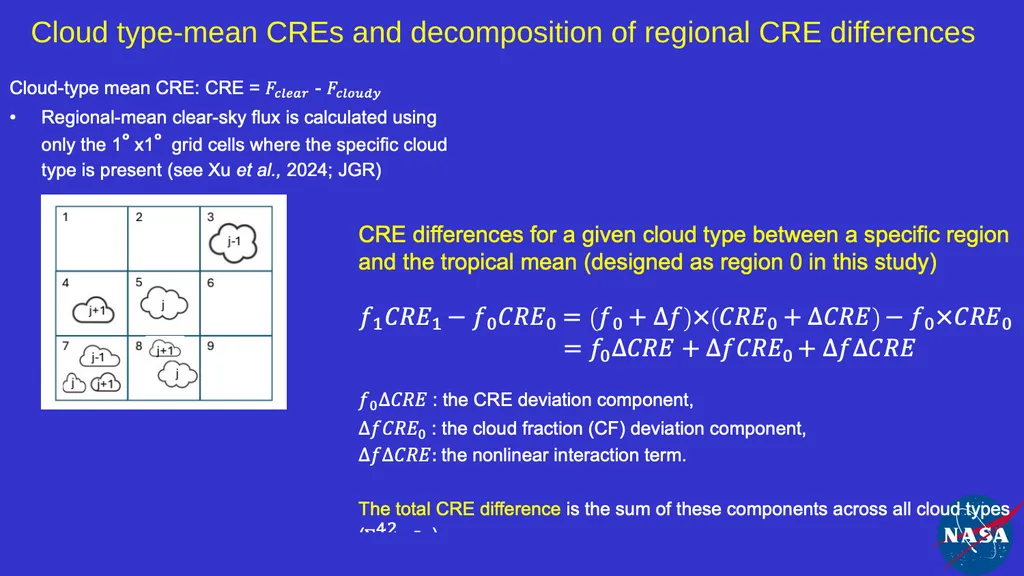
slide5. Cloud type-mean CREs and decomposition of regional CRE differences<br>
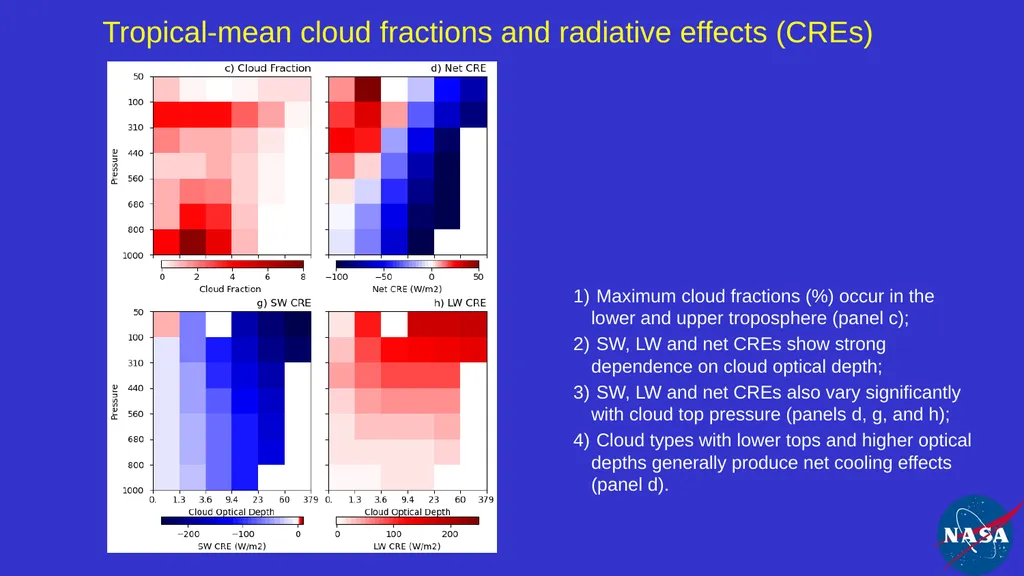
slide6. Tropical-mean cloud fractions and radiative effects (CREs) Maximum cloud fractions (%) occur in the lower and upper troposphere (panel c);
SW, LW and net CREs show strong dependence on cloud optical depth;
SW, LW and net CREs also vary significantly with cloud top pressure (panels d, g, and h);
Cloud types with lower tops and higher optical depths generally produce net cooling effects (panel d).<br>
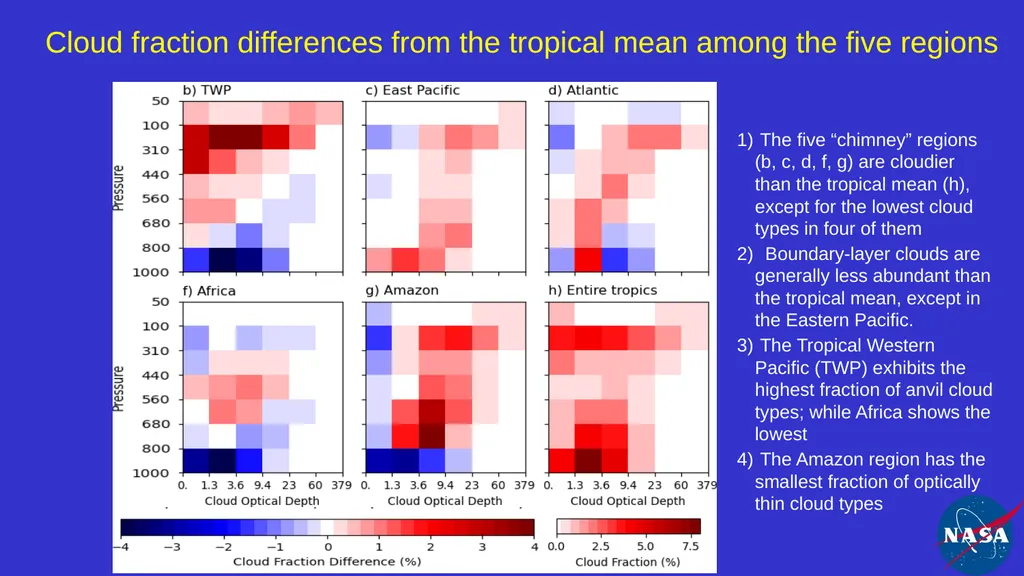
slide7. Cloud fraction differences from the tropical mean among the five regions The five “chimney” regions (b, c, d, f, g) are cloudier than the tropical mean (h), except for the lowest cloud types in four of them
Boundary-layer clouds are generally less abundant than the tropical mean, except in the Eastern Pacific.
The Tropical Western Pacific (TWP) exhibits the highest fraction of anvil cloud types; while Africa shows the lowest
The Amazon region has the smallest fraction of optically thin cloud types<br>
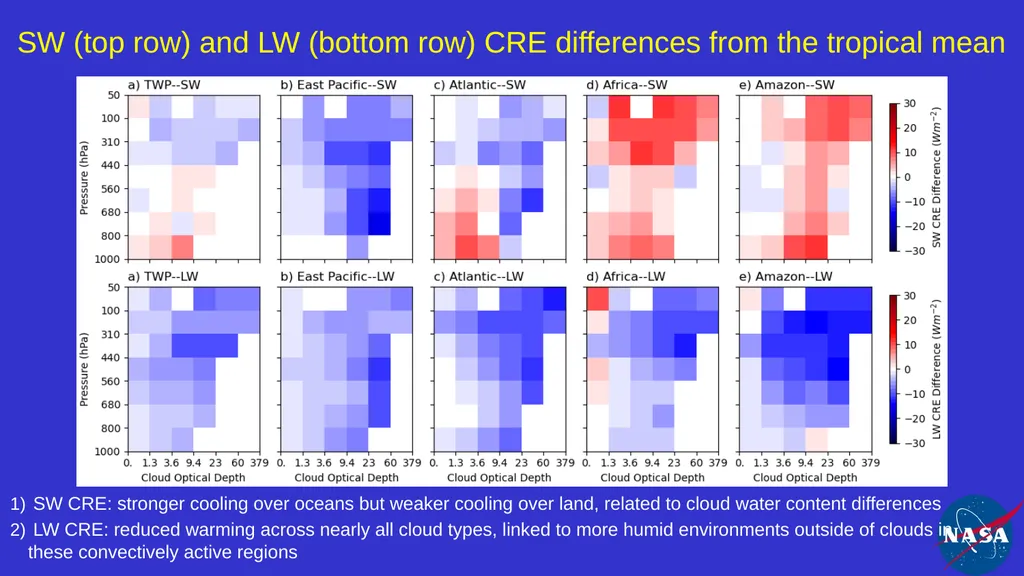
slide8. SW (top row) and LW (bottom row) CRE differences from the tropical mean SW CRE: stronger cooling over oceans but weaker cooling over land, related to cloud water content differences
LW CRE: reduced warming across nearly all cloud types, linked to more humid environments outside of clouds in these convectively active regions<br>
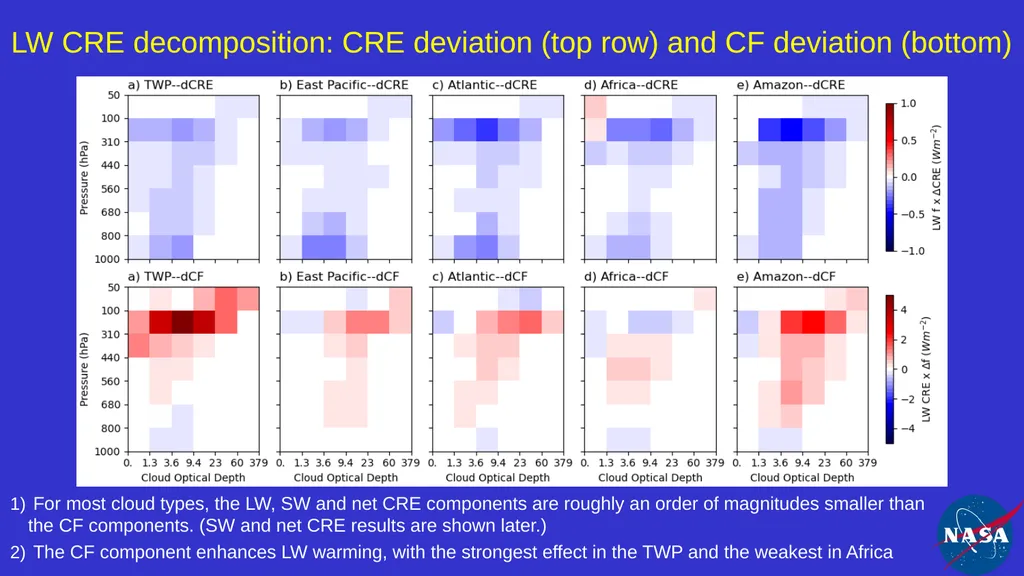
slide9. LW CRE decomposition: CRE deviation (top row) and CF deviation (bottom) For most cloud types, the LW, SW and net CRE components are roughly an order of magnitudes smaller than the CF components. (SW and net CRE results are shown later.)
The CF component enhances LW warming, with the strongest effect in the TWP and the weakest in Africa<br>
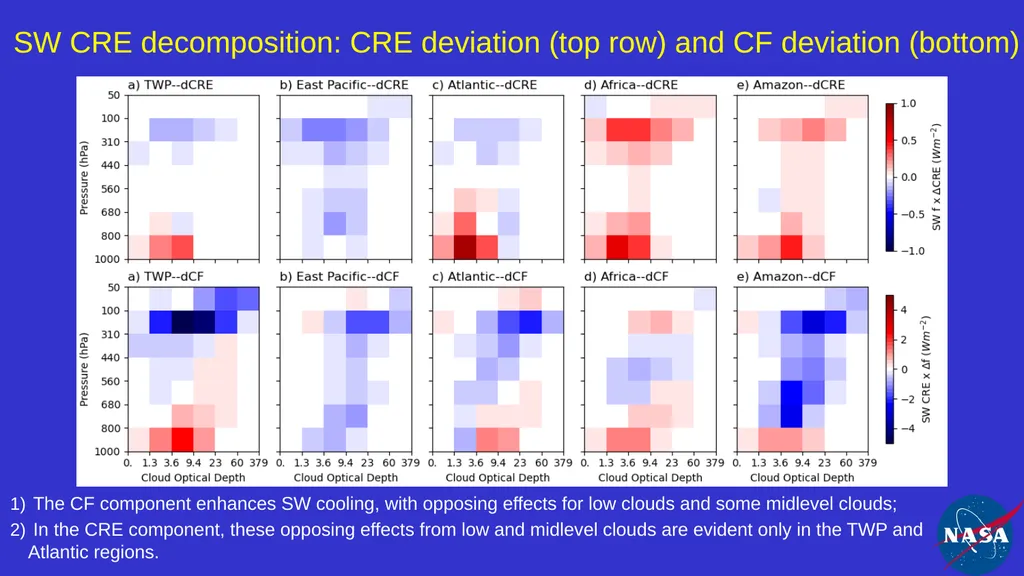
slide10. SW CRE decomposition: CRE deviation (top row) and CF deviation (bottom) The CF component enhances SW cooling, with opposing effects for low clouds and some midlevel clouds;
In the CRE component, these opposing effects from low and midlevel clouds are evident only in the TWP and Atlantic regions.<br>
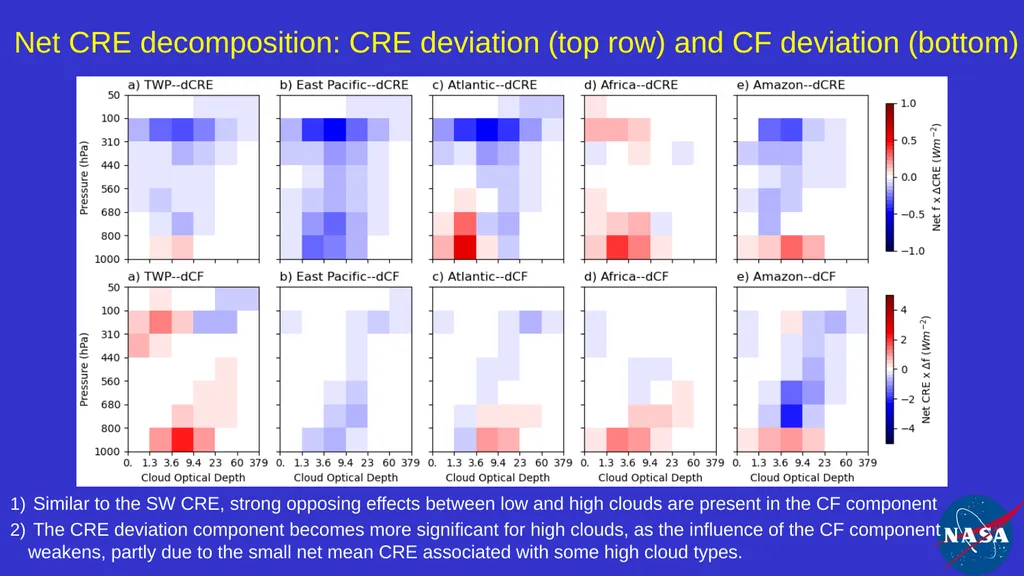
slide11. Net CRE decomposition: CRE deviation (top row) and CF deviation (bottom) Similar to the SW CRE, strong opposing effects between low and high clouds are present in the CF component
The CRE deviation component becomes more significant for high clouds, as the influence of the CF component weakens, partly due to the small net mean CRE associated with some high cloud types.<br>
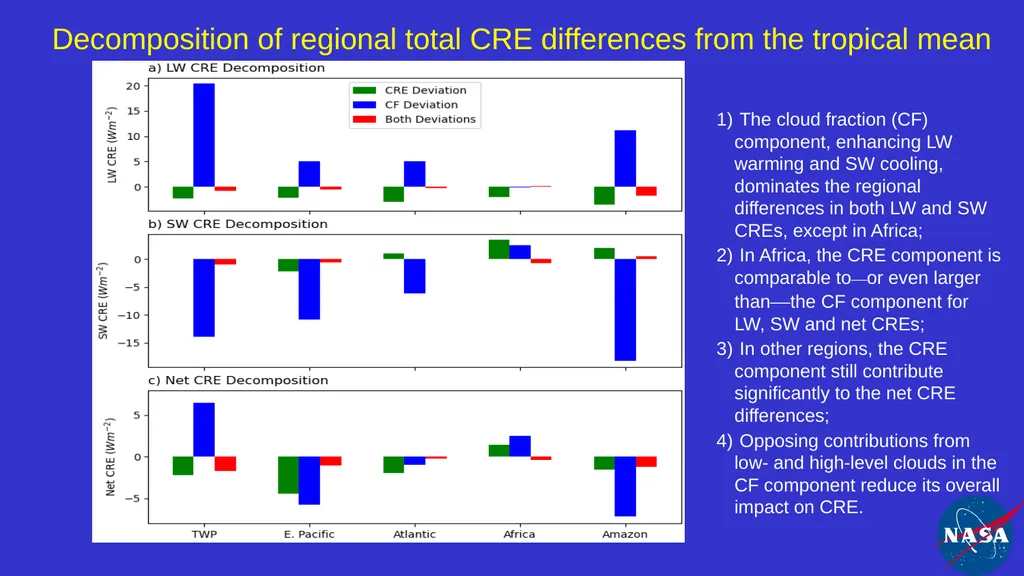
slide12. Decomposition of regional total CRE differences from the tropical mean The cloud fraction (CF) component, enhancing LW warming and SW cooling, dominates the regional differences in both LW and SW CREs, except in Africa;
In Africa, the CRE component is comparable to—or even larger than—the CF component for LW, SW and net CREs;
In other regions, the CRE component still contribute significantly to the net CRE differences;
Opposing contributions from low- and high-level clouds in the CF component reduce its overall impact on CRE.<br>
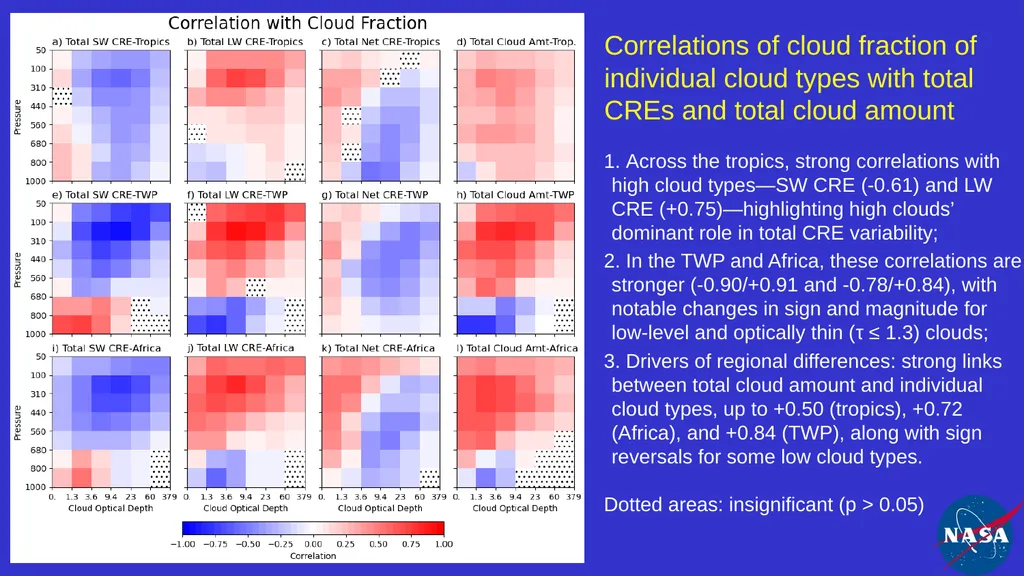
slide13. Across the tropics, strong correlations with high cloud types—SW CRE (-0.61) and LW CRE (+0.75)—highlighting high clouds’ dominant role in total CRE variability;
In the TWP and Africa, these correlations are stronger (-0.90/+0.91 and -0.78/+0.84), with notable changes in sign and magnitude for low-level and optically thin (τ ≤ 1.3) clouds;
Drivers of regional differences: strong links between total cloud amount and individual cloud types, up to +0.50 (tropics), +0.72 (Africa), and +0.84 (TWP), along with sign reversals for some low cloud types.
Dotted areas: insignificant (p > 0.05) Correlations of cloud fraction of individual cloud types with total CREs and total cloud amount<br>
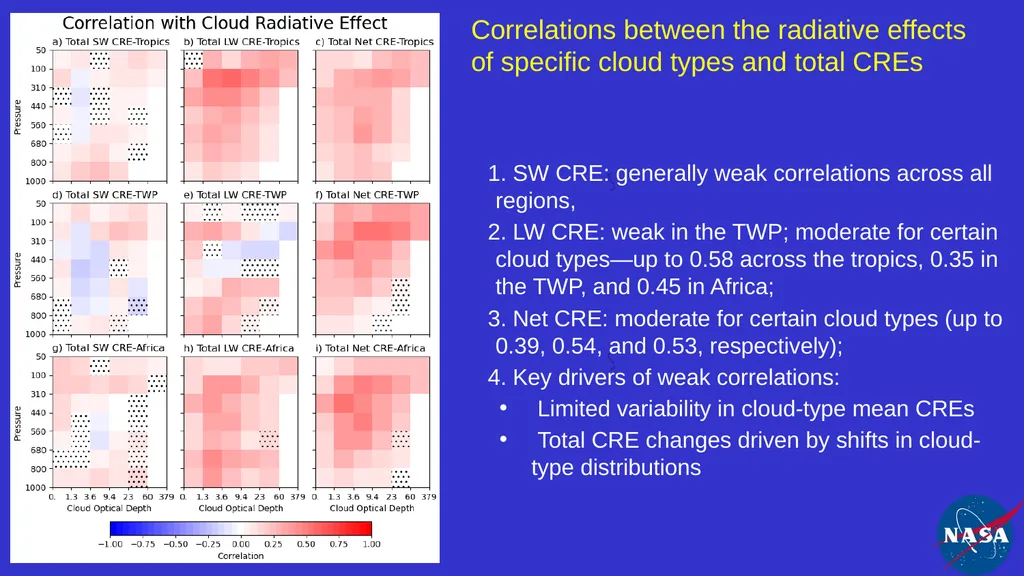
slide14. SW CRE: generally weak correlations across all regions,
LW CRE: weak in the TWP; moderate for certain cloud types—up to 0.58 across the tropics, 0.35 in the TWP, and 0.45 in Africa;
Net CRE: moderate for certain cloud types (up to 0.39, 0.54, and 0.53, respectively);
Key drivers of weak correlations:
Limited variability in cloud-type mean CREs
Total CRE changes driven by shifts in cloud-type distributions Correlations between the radiative effects of specific cloud types and total CREs<br>
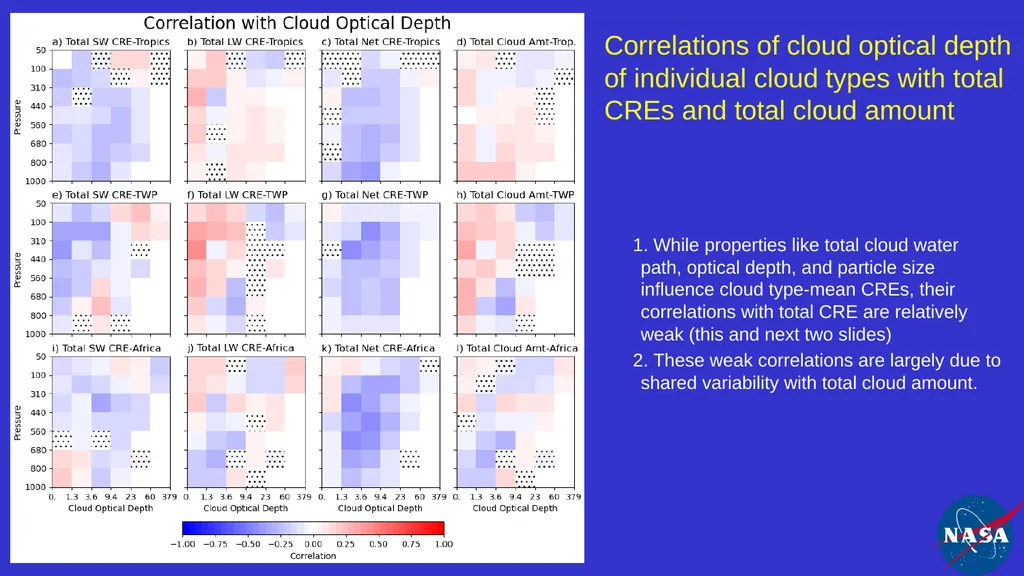
slide15. While properties like total cloud water path, optical depth, and particle size influence cloud type-mean CREs, their correlations with total CRE are relatively weak (this and next two slides)
These weak correlations are largely due to shared variability with total cloud amount. Correlations of cloud optical depth of individual cloud types with total CREs and total cloud amount<br>
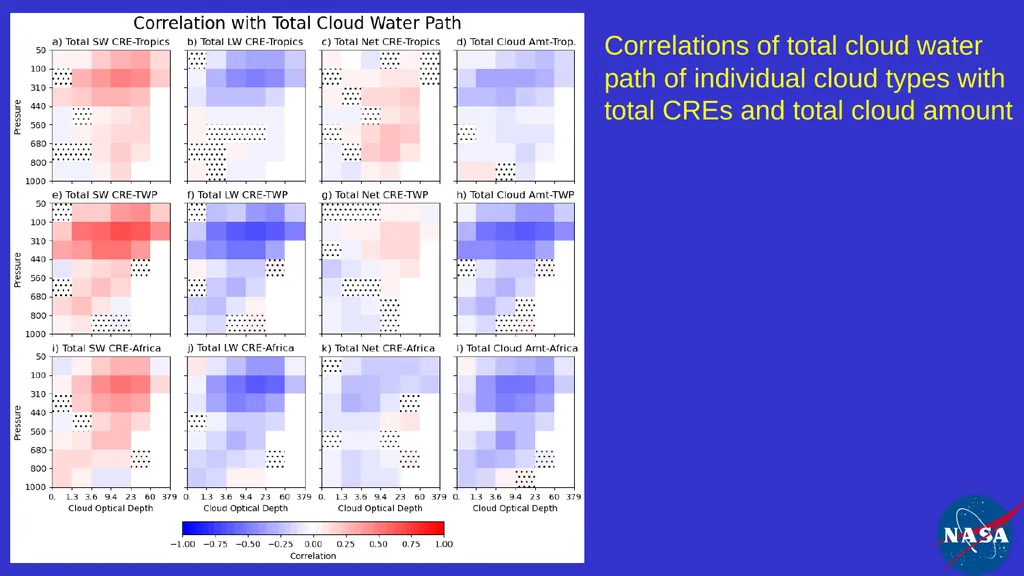
slide16. Correlations of total cloud water path of individual cloud types with total CREs and total cloud amount<br>
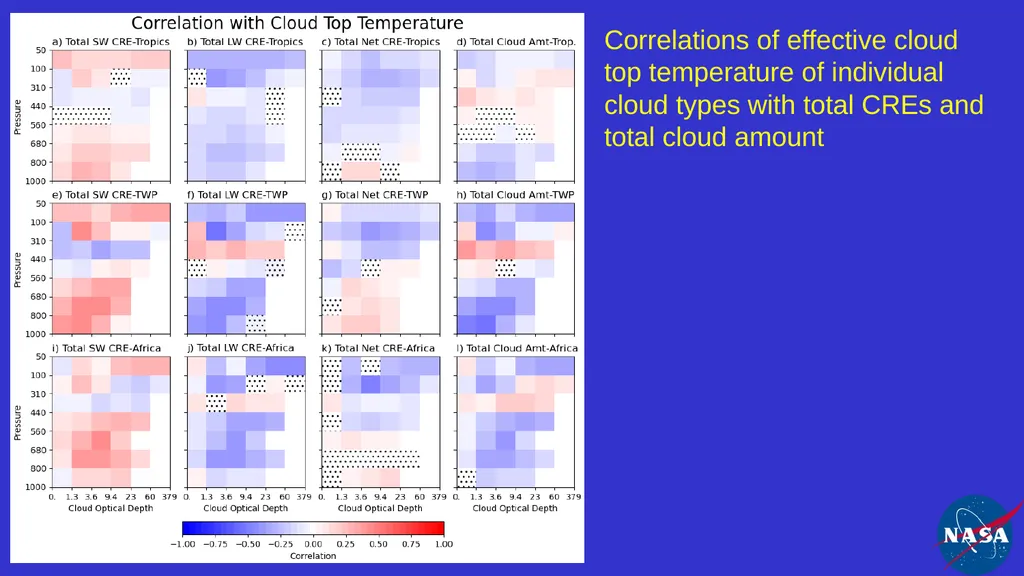
slide17. Correlations of effective cloud top temperature of individual cloud types with total CREs and total cloud amount<br>
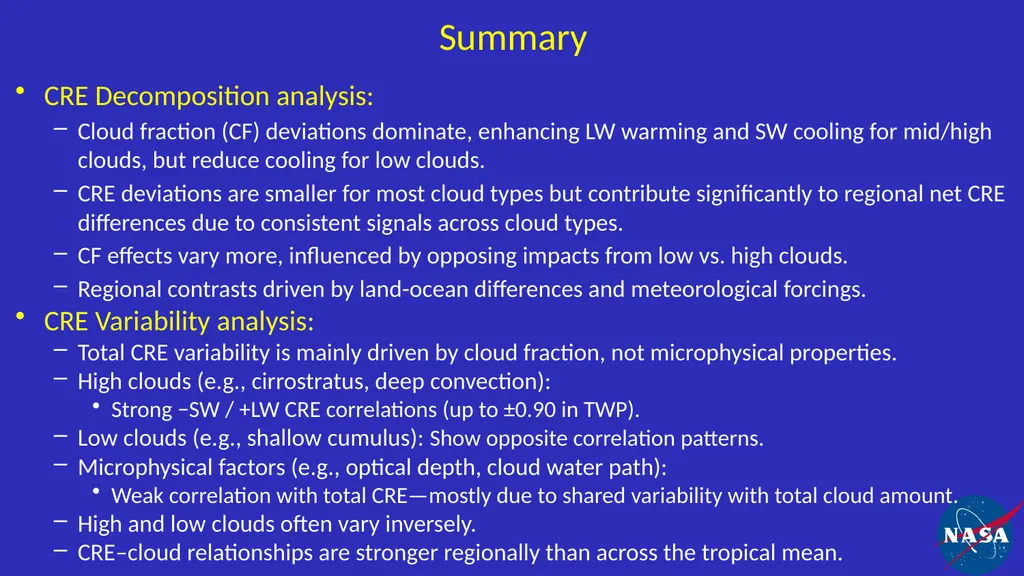
slide18. Summary CRE Decomposition analysis:
Cloud fraction (CF) deviations dominate, enhancing LW warming and SW cooling for mid/high clouds, but reduce cooling for low clouds.
CRE deviations are smaller for most cloud types but contribute significantly to regional net CRE differences due to consistent signals across cloud types.
CF effects vary more, influenced by opposing impacts from low vs. high clouds.
Regional contrasts driven by land-ocean differences and meteorological forcings.
CRE Variability analysis:
Total CRE variability is mainly driven by cloud fraction, not microphysical properties.
High clouds (e.g., cirrostratus, deep convection):
Strong −SW / +LW CRE correlations (up to ±0.90 in TWP).
Low clouds (e.g., shallow cumulus): Show opposite correlation patterns.
Microphysical factors (e.g., optical depth, cloud water path):
Weak correlation with total CRE—mostly due to shared variability with total cloud amount.
High and low clouds often vary inversely.
CRE–cloud relationships are stronger regionally than across the tropical mean.<br>
slide19. Publications Xu, K.-M., Sun, M., & Zhou, Y., (2024), Analysis of the influence of clear-sky fluxes on the cloud-type mean cloud radiative effects in the tropical convectively active regions with CERES satellite data. J. Geophys. Res. Atmos., 129, e2024JD041525. https://doi.org/10.1029/2024JD041525.
Xu, K.-M., Sun, M., & Zhou, Y., (2025), Comparison of cloud-type properties and radiative effect decomposition in tropical convectively active regions using CERES high-resolution data. J. Geophys. Res. Atmos., (submitted).
Xu, K.-M., & Sun, M., (2025): Impact and variability of cloud types on Earth’s top-of-atmosphere energy balance in the Tropics: A 19-Year analysis of high-resolution CERES data. J. Geophys. Res. Atmos., (submitted). 19<br>

slide20. Backup slides<br>
slide2. Motivations, objective and data set<br>
slide3. Where are the tropical “chimney” zones? (Takahashi et al. 2017) Tropical ”Chimney” zones:
Lands: Equatorial Africa and Amazonia
Ocean: Eastern Pacific ITCZ, Atlantic ITCZ, and Tropical Western Pacific<br>
slide4. The ISCCP cloud classification (Rossow & Schiffer, 1999)<br>
slide5. Cloud type-mean CREs and decomposition of regional CRE differences<br>
slide6. Tropical-mean cloud fractions and radiative effects (CREs) Maximum cloud fractions (%) occur in the lower and upper troposphere (panel c);
SW, LW and net CREs show strong dependence on cloud optical depth;
SW, LW and net CREs also vary significantly with cloud top pressure (panels d, g, and h);
Cloud types with lower tops and higher optical depths generally produce net cooling effects (panel d).<br>
slide7. Cloud fraction differences from the tropical mean among the five regions The five “chimney” regions (b, c, d, f, g) are cloudier than the tropical mean (h), except for the lowest cloud types in four of them
Boundary-layer clouds are generally less abundant than the tropical mean, except in the Eastern Pacific.
The Tropical Western Pacific (TWP) exhibits the highest fraction of anvil cloud types; while Africa shows the lowest
The Amazon region has the smallest fraction of optically thin cloud types<br>
slide8. SW (top row) and LW (bottom row) CRE differences from the tropical mean SW CRE: stronger cooling over oceans but weaker cooling over land, related to cloud water content differences
LW CRE: reduced warming across nearly all cloud types, linked to more humid environments outside of clouds in these convectively active regions<br>
slide9. LW CRE decomposition: CRE deviation (top row) and CF deviation (bottom) For most cloud types, the LW, SW and net CRE components are roughly an order of magnitudes smaller than the CF components. (SW and net CRE results are shown later.)
The CF component enhances LW warming, with the strongest effect in the TWP and the weakest in Africa<br>
slide10. SW CRE decomposition: CRE deviation (top row) and CF deviation (bottom) The CF component enhances SW cooling, with opposing effects for low clouds and some midlevel clouds;
In the CRE component, these opposing effects from low and midlevel clouds are evident only in the TWP and Atlantic regions.<br>
slide11. Net CRE decomposition: CRE deviation (top row) and CF deviation (bottom) Similar to the SW CRE, strong opposing effects between low and high clouds are present in the CF component
The CRE deviation component becomes more significant for high clouds, as the influence of the CF component weakens, partly due to the small net mean CRE associated with some high cloud types.<br>
slide12. Decomposition of regional total CRE differences from the tropical mean The cloud fraction (CF) component, enhancing LW warming and SW cooling, dominates the regional differences in both LW and SW CREs, except in Africa;
In Africa, the CRE component is comparable to—or even larger than—the CF component for LW, SW and net CREs;
In other regions, the CRE component still contribute significantly to the net CRE differences;
Opposing contributions from low- and high-level clouds in the CF component reduce its overall impact on CRE.<br>
slide13. Across the tropics, strong correlations with high cloud types—SW CRE (-0.61) and LW CRE (+0.75)—highlighting high clouds’ dominant role in total CRE variability;
In the TWP and Africa, these correlations are stronger (-0.90/+0.91 and -0.78/+0.84), with notable changes in sign and magnitude for low-level and optically thin (τ ≤ 1.3) clouds;
Drivers of regional differences: strong links between total cloud amount and individual cloud types, up to +0.50 (tropics), +0.72 (Africa), and +0.84 (TWP), along with sign reversals for some low cloud types.
Dotted areas: insignificant (p > 0.05) Correlations of cloud fraction of individual cloud types with total CREs and total cloud amount<br>
slide14. SW CRE: generally weak correlations across all regions,
LW CRE: weak in the TWP; moderate for certain cloud types—up to 0.58 across the tropics, 0.35 in the TWP, and 0.45 in Africa;
Net CRE: moderate for certain cloud types (up to 0.39, 0.54, and 0.53, respectively);
Key drivers of weak correlations:
Limited variability in cloud-type mean CREs
Total CRE changes driven by shifts in cloud-type distributions Correlations between the radiative effects of specific cloud types and total CREs<br>
slide15. While properties like total cloud water path, optical depth, and particle size influence cloud type-mean CREs, their correlations with total CRE are relatively weak (this and next two slides)
These weak correlations are largely due to shared variability with total cloud amount. Correlations of cloud optical depth of individual cloud types with total CREs and total cloud amount<br>
slide16. Correlations of total cloud water path of individual cloud types with total CREs and total cloud amount<br>
slide17. Correlations of effective cloud top temperature of individual cloud types with total CREs and total cloud amount<br>
slide18. Summary CRE Decomposition analysis:
Cloud fraction (CF) deviations dominate, enhancing LW warming and SW cooling for mid/high clouds, but reduce cooling for low clouds.
CRE deviations are smaller for most cloud types but contribute significantly to regional net CRE differences due to consistent signals across cloud types.
CF effects vary more, influenced by opposing impacts from low vs. high clouds.
Regional contrasts driven by land-ocean differences and meteorological forcings.
CRE Variability analysis:
Total CRE variability is mainly driven by cloud fraction, not microphysical properties.
High clouds (e.g., cirrostratus, deep convection):
Strong −SW / +LW CRE correlations (up to ±0.90 in TWP).
Low clouds (e.g., shallow cumulus): Show opposite correlation patterns.
Microphysical factors (e.g., optical depth, cloud water path):
Weak correlation with total CRE—mostly due to shared variability with total cloud amount.
High and low clouds often vary inversely.
CRE–cloud relationships are stronger regionally than across the tropical mean.<br>
slide19. Publications Xu, K.-M., Sun, M., & Zhou, Y., (2024), Analysis of the influence of clear-sky fluxes on the cloud-type mean cloud radiative effects in the tropical convectively active regions with CERES satellite data. J. Geophys. Res. Atmos., 129, e2024JD041525. https://doi.org/10.1029/2024JD041525.
Xu, K.-M., Sun, M., & Zhou, Y., (2025), Comparison of cloud-type properties and radiative effect decomposition in tropical convectively active regions using CERES high-resolution data. J. Geophys. Res. Atmos., (submitted).
Xu, K.-M., & Sun, M., (2025): Impact and variability of cloud types on Earth’s top-of-atmosphere energy balance in the Tropics: A 19-Year analysis of high-resolution CERES data. J. Geophys. Res. Atmos., (submitted). 19<br>
slide20. Backup slides<br>