
Industry Analysis ch13 Why Do Industry Analysis?








Description: Industry Analysis ch13 Why Do Industry Analysis? The Purpose: Help find profitable investment opportunities Part of the three-step, top-down plan for valuing individual companies and selecting stocks for a portfolio Why Do Industry
Related Topics
Download Presentation
"Industry Analysis ch13 Why Do Industry Analysis?" is the property of its rightful owner. Permission is granted to download and print the materials on this website for personal, non-commercial use only, and to display it on your personal computer provided you do not modify the materials and that you retain all copyright notices contained in the materials. By downloading content from our website, you accept the terms of this agreement.
Presentation Transcript
slide1. Industry Analysis ch13<br>
slide2. Why Do Industry Analysis? The Purpose:
Help find profitable investment opportunities
Part of the three-step, top-down plan for valuing individual companies and selecting stocks for a portfolio<br>
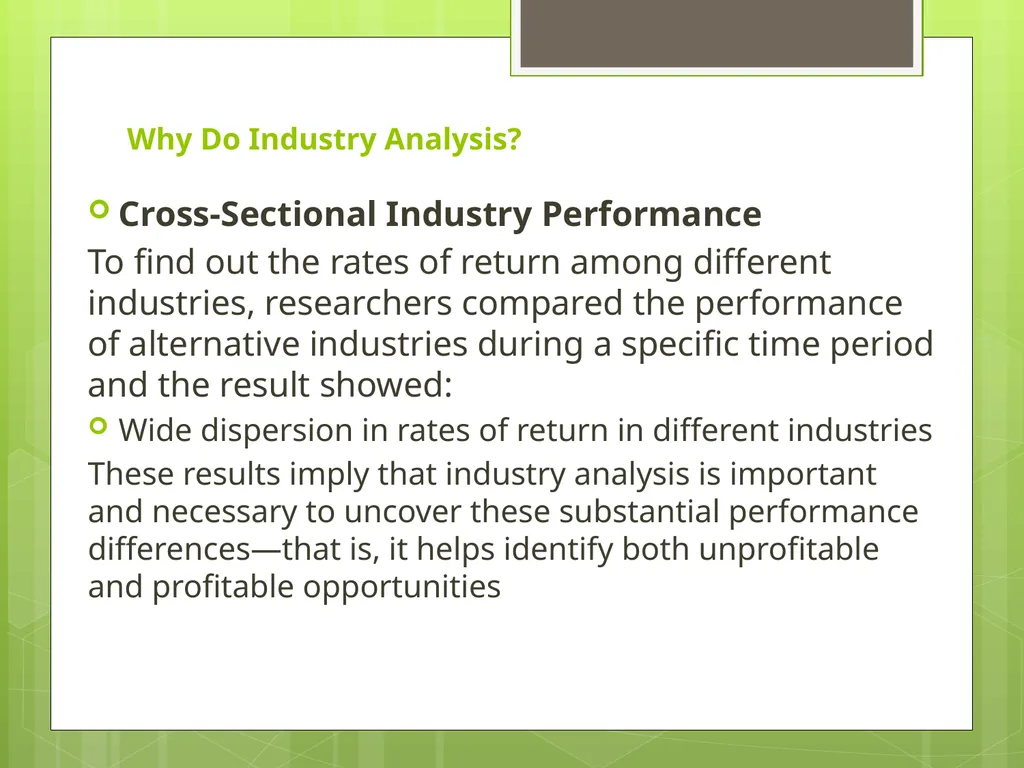
slide3. Why Do Industry Analysis? Cross-Sectional Industry Performance
To find out the rates of return among different industries, researchers compared the performance of alternative industries during a specific time period and the result showed:
Wide dispersion in rates of return in different industries
These results imply that industry analysis is important and necessary to uncover these substantial performance differences—that is, it helps identify both unprofitable and profitable opportunities<br>
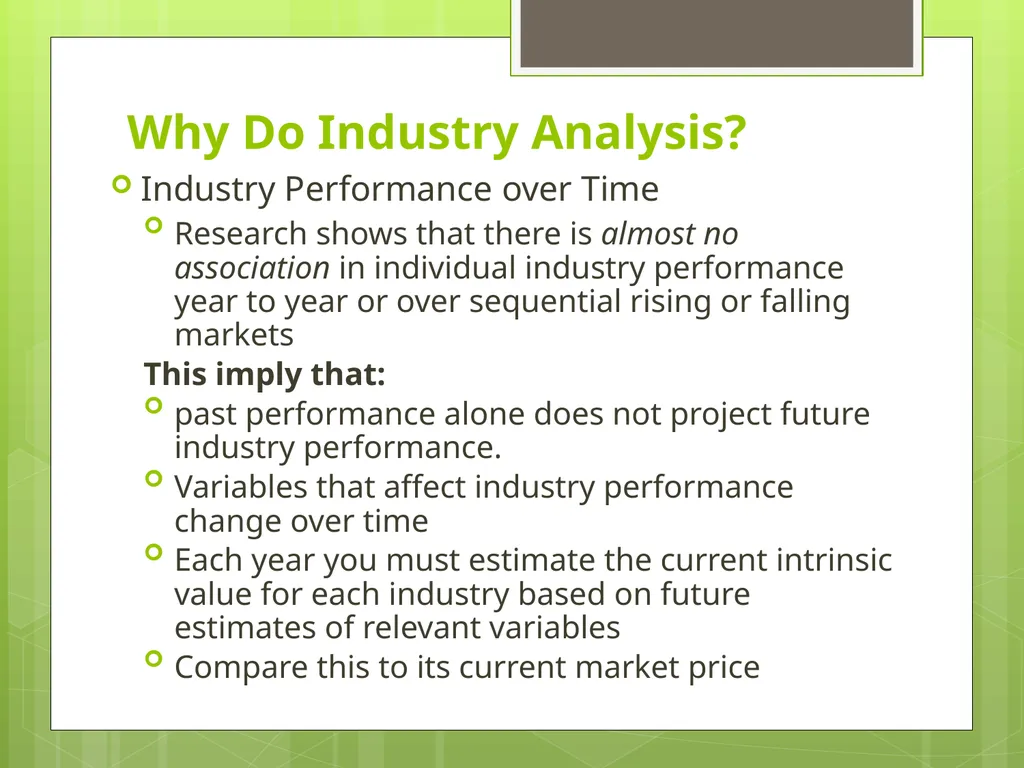
slide4. Why Do Industry Analysis? Industry Performance over Time
Research shows that there is almost no association in individual industry performance year to year or over sequential rising or falling markets
This imply that:
past performance alone does not project future industry performance.
Variables that affect industry performance change over time
Each year you must estimate the current intrinsic value for each industry based on future estimates of relevant variables
Compare this to its current market price<br>
slide5. Why Do Industry Analysis? Performance of Companies within an Industry
There is wide dispersion in the performance of companies within an industry
This reinforces the need for company analysis in addition to industry analysis<br>
slide6. Implication of dispersion within industries Some observers mentioned that industry analysis is useless because all firms in an industry do not move together.
Consistent firm performance in an industry would be ideal, because you would not need to do company analysis<br>
slide7. Implication of dispersion within industries For industries that have a strong, consistent industry influence, such as oil, gold, steel, autos, company analysis is less critical than industry analysis
The fact that there is not a strong industry influence across firms in most industries means that a thorough company analysis is necessary<br>
slide8. Implication of dispersion within industries Still industry analysis is necessary because it is much easier to select a superior company from a good industry than to find a good company in a poor industry
By selecting the best stocks within a strong industry, you avoid the risk that your analysis and selection of the best company in the industry will offset by poor industry performance<br>
slide9. Summary of research on industry analysis During any time period, the returns for different industries vary within a wide range, which means that industry analysis is an important part of the investment process
The rates of return for individual industries vary over time, so we cannot simply extrapolate past industry performance into the future<br>
slide10. Summary of research on industry analysis The rates of return on firms within industries also vary, so analysis of individual companies in an industry is a necessary follow-up to industry analysis.
During any time period, different industries’ risk levels vary within wide ranges, so we must examine and estimate the risk factors for alternative industries.<br>
slide11. Industry analysis process If we want to make an analysis of the economy or the aggregate market , it is necessary to examine the macro-economy for tow reasons:
Although the security market tend to move ahead of the aggregate economy, we know that security market reflect the strength or the weaknesses of the economy.
Most of the variables that determine value for the security markets are macro variables such as interest rates.<br>
slide12. Industry analysis process Therefore, our analysis of the aggregate equity market contained two components, macro-variables and micro analysis of specific variables that affect the valuation.<br>
slide13. Industry analysis process The industry analysis process is similar to the economic analysis.
macroanalysis of the industry to determine: how this industry relates to the business cycle? and what economic variables drive the industry?.
Macroanalysis of the industry will make the estimation of the valuation inputs of a discount rate and expected growth for earnings.
This macroanalysis will make the microvaluation component easier where we use the several valuation technique we used before.<br>
slide14. Industry analysis process The specific macro-analysis topics are:
The business cycle and industry sectors.
Structural economic changes and alternative industries.
Evaluating an industry’s life cycle.
Analysis of the competitive environment in the industry.<br>
slide15. Business Cycle and Industry Sectors Economic trends can and do affect industry performance.
Economic trends can take two basic forms:
Cyclical changes: that arise from the ups and downs of the business cycle.
Structural changes: when the economy is undergoing a major change in how it functions (ex, transaction in the United States from a manufacturing to a service economy).<br>
slide16. Business Cycle and Industry Sectors Industry performance is related to the stage of the business cycle.
Real challenge is that every business cycle is different and those who look only at history miss the evolving trends that will determine future market and industry performance.<br>
slide17. Business Cycle and Industry Sectors For example:
Toward the end of a recession, the banks industry assumes that earning will rise because there will be an increase in loan demands.
One the economy begins its recovery, consumer durable firms that produce items such as (cars, computers, refrigerators), becomes attractive investments because a reviving economy will increase consumer confidence and income.
Once businesses recognize the economic recovery, they think about modernizing and renovating, thus capital goods industries such as heavy equipment manufactures become attractive.<br>
slide18. Business Cycle and Industry Sectors Cyclical industries whose sales rise and fall along with general economic activity are attractive investments during the early stages of an economic recovery because of their high degree of operating leverage.
Toward a business cycle peak, inflation increases as demand starts to outstrip supply. And basic materials like oil, metals, which transforms raw material to final products will not be affected much by the inflation and they become investors favorites.
During a recession, some industries do better than others. Such as pharmaceutical, food, beverages<br>
slide19. Business Cycle and Industry Sectors Economic variables and different industries:
Inflation
Interest rates
International economics
Consumer sentiment<br>
slide20. Inflation Industries with high operating leverage benefit because many of their costs are fixed in nominal (current dollar) terms, whereas revenues increase with inflation
Industries with high financial leverage may also gain, because their debts are repaid in cheaper dollars
Higher inflation is generally negative for stocks because it causes higher market interest rates
More uncertainty about future prices and costs
Harms firms that cannot pass through cost increases
Some industries benefit like natural resources
If production costs do not rise with inflation, output is likely to sell at higher prices<br>
slide21. Interest rate Financial institutions, like banks, are typically adversely impacted by higher rates because they find it difficult to pass on these higher rates to customers (i.e. lagged adjustment)
High interest rates clearly harm the housing and the construction industry
Benefit retirees who depend on interest income<br>
slide22. International Economies A weaker US dollar help US industries because their exports become comparatively cheaper in overseas markets
While goods of foreign competitors become more expensive in US
A stronger dollar has an opposite effect
Economic growth in world regions or specific countries benefits industries that have a large presence in those areas<br>
slide23. Consumer sentiment Consumption spending has a large impact on the economy
Optimistic consumers are willing to spend
Borrow money for expensive goods such as houses, cars, new clothes and furniture
Performance of consumer cyclical industries will be affected by changes in consumer sentiment and consumers’ willingness and ability to borrow and spend money<br>
slide24. Structural economic changes and alternative industries Demographics
Lifestyles
Technology
Politics and regulations<br>
slide25. Evaluating the Industry Life Cycle When predicting the industry sales and trends in profitability, an insightful analysis is to view the industry over time in different stages
The Five-Stage Model
Pioneering development
Rapidly accelerating industry growth
Mature industry growth
Stabilization and market maturity
Deceleration of growth and decline
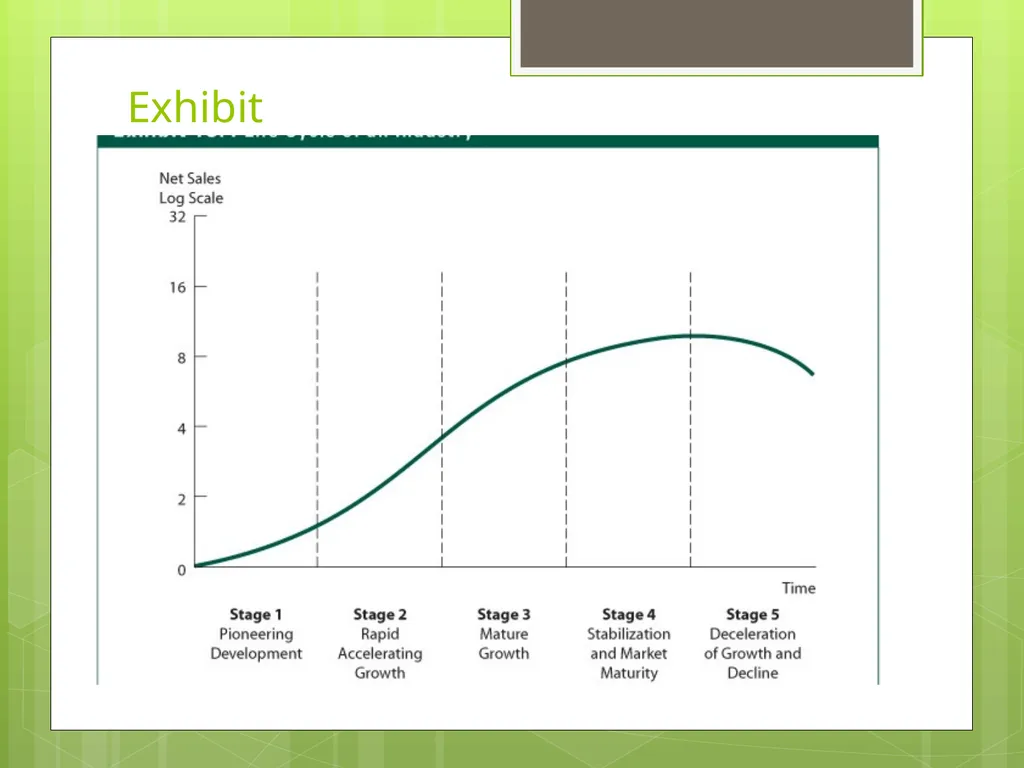
See Exhibit 13.4<br>
slide26. Exhibit<br>
slide27. Life cycle of industry and sales and profits Pioneering development:
Modest sales growth
Very small or negative profits
Market for product or service is small
Firms incur major development costs<br>
slide28. Life cycle of industry and sales and profits Rapid accelerating growth:
Market develops for the product or service
Demand become substantial
Limited number of firms face little competition
Firms can experience substantial backlogs and high profit margins
Firms build capacity
High sales growth and high profit margins<br>
slide29. Life cycle of industry and sales and profits Mature growth:
Future sales growth may be above normal but no longer accelerating
Profit margins begin to decline to normal levels<br>
slide30. Life cycle of industry and sales and profits Stabilizing and market maturity:
Longest phase
Growth rate declines to the growth rate of the aggregate economy or its industry segment
Profit growth varies by industry because the competitive structure varies by industry
By individual firms within industry because of their ability to control costs<br>
slide31. Life cycle of industry and sales and profits Deceleration of growth and decline:
Sales growth declines because of shifts in demand or growth of substitutes
Profit margins continue to be squeezed
Some firms experience low profits or even losses
Low rates of return on capital<br>
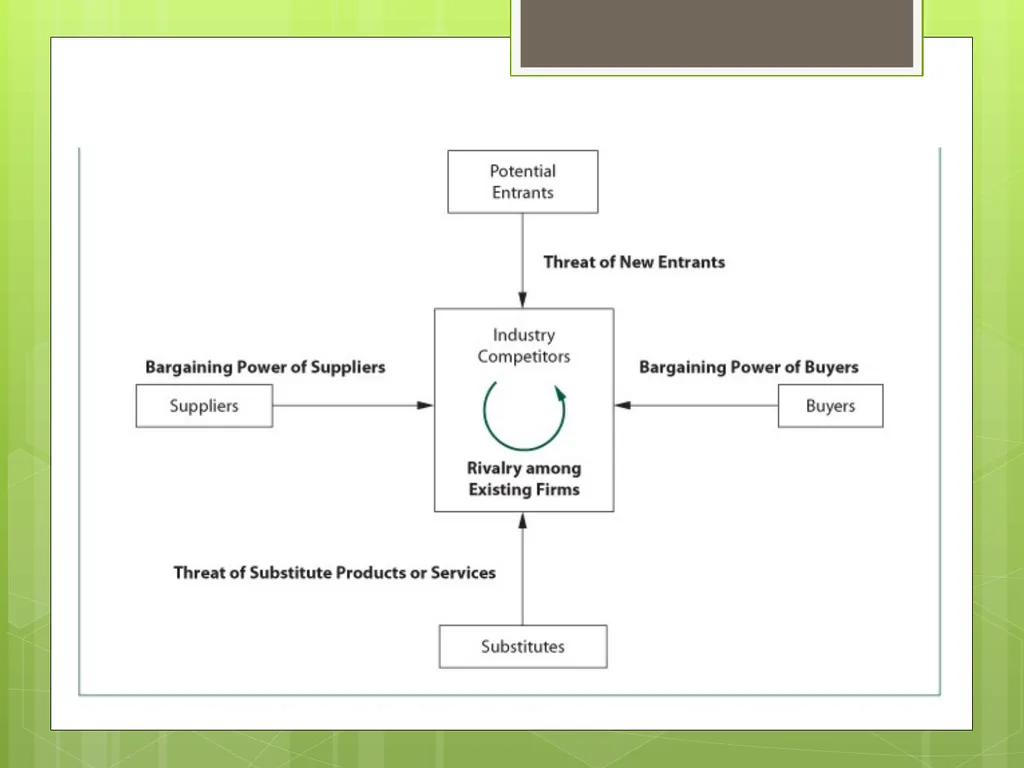
slide32. Analysis of Industry Competition Porter’s Competitive Forces (Exhibit 13.5)
Rivalry among existing competitors
More rivalry means intense competition
Threat of new entrants
Are there barriers to entry?
Threat of substitute products
Substitute products limit the profit potential of an industry
Bargaining power of buyers
Volume discounts, quality demands
Bargaining power of suppliers
Can suppliers increase prices or reduce quality?<br>
slide34. Estimating Industry Rates of Return Do we go about valuing an industry?
Present value using required rate of return for the equity in the industry
Two-step P/E ratio approach uses expected value at the end of investment horizon and compute the expected dividend return during the period
Estimating required rate of return and growth rates are the key<br>
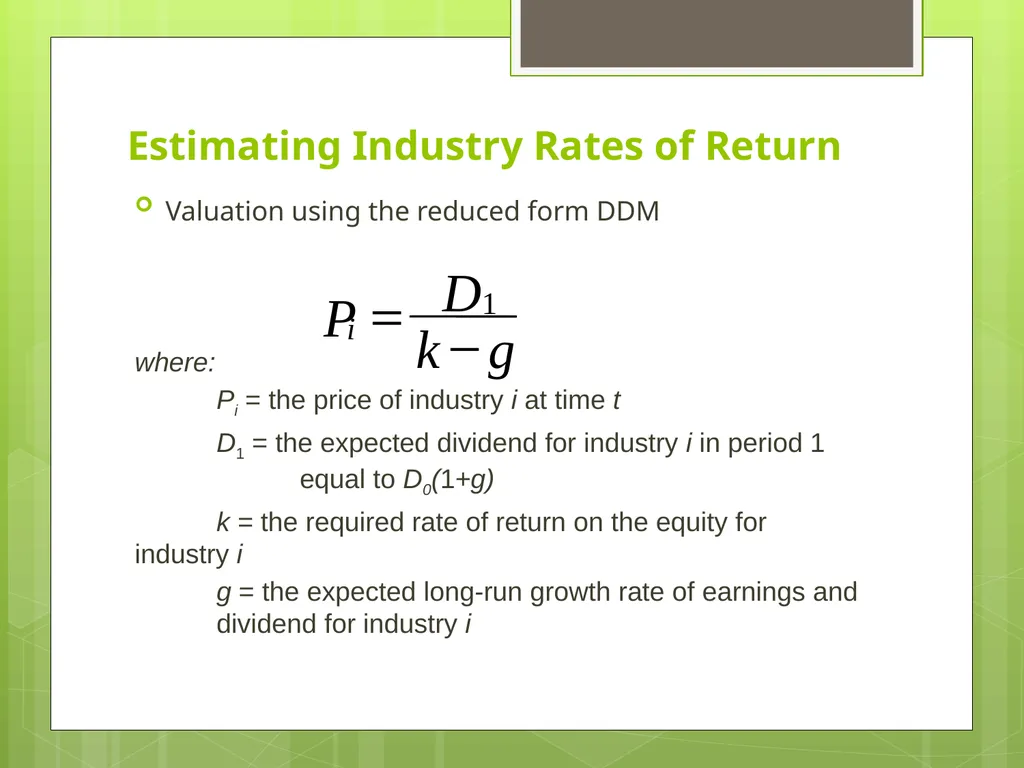
slide35. Estimating Industry Rates of Return Valuation using the reduced form DDM
where:
Pi = the price of industry i at time t
D1 = the expected dividend for industry i in period 1 equal to D0(1+g)
k = the required rate of return on the equity for industry i
g = the expected long-run growth rate of earnings and dividend for industry i<br>
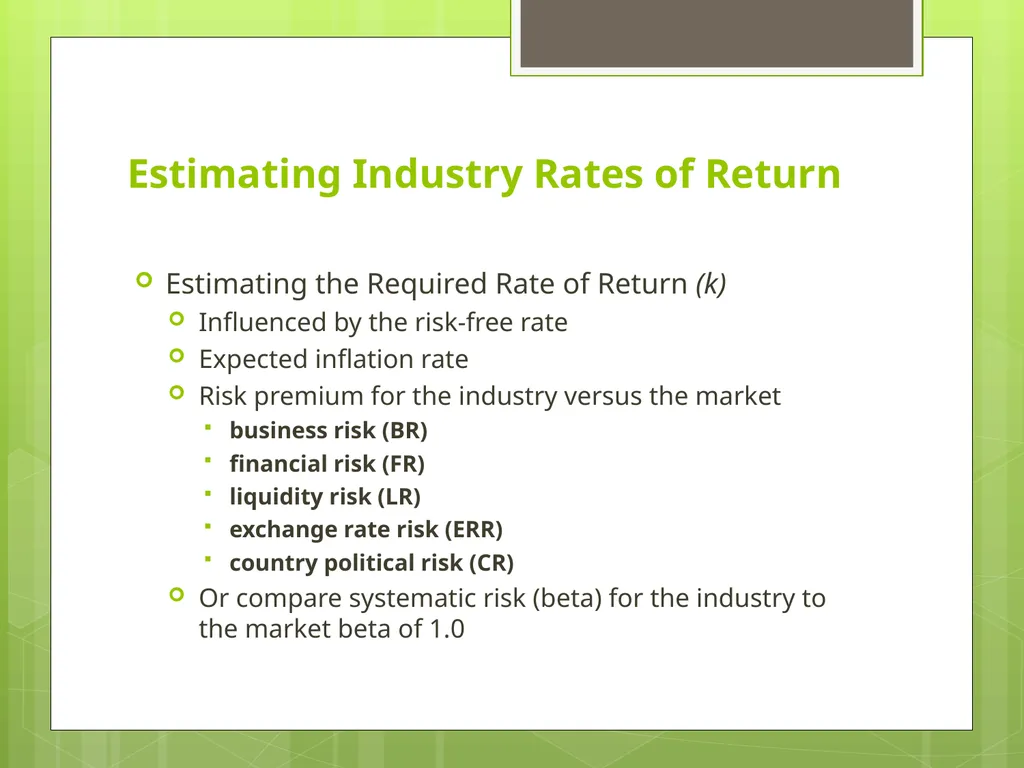
slide36. Estimating Industry Rates of Return Estimating the Required Rate of Return (k)
Influenced by the risk-free rate
Expected inflation rate
Risk premium for the industry versus the market
business risk (BR)
financial risk (FR)
liquidity risk (LR)
exchange rate risk (ERR)
country political risk (CR)
Or compare systematic risk (beta) for the industry to the market beta of 1.0<br>
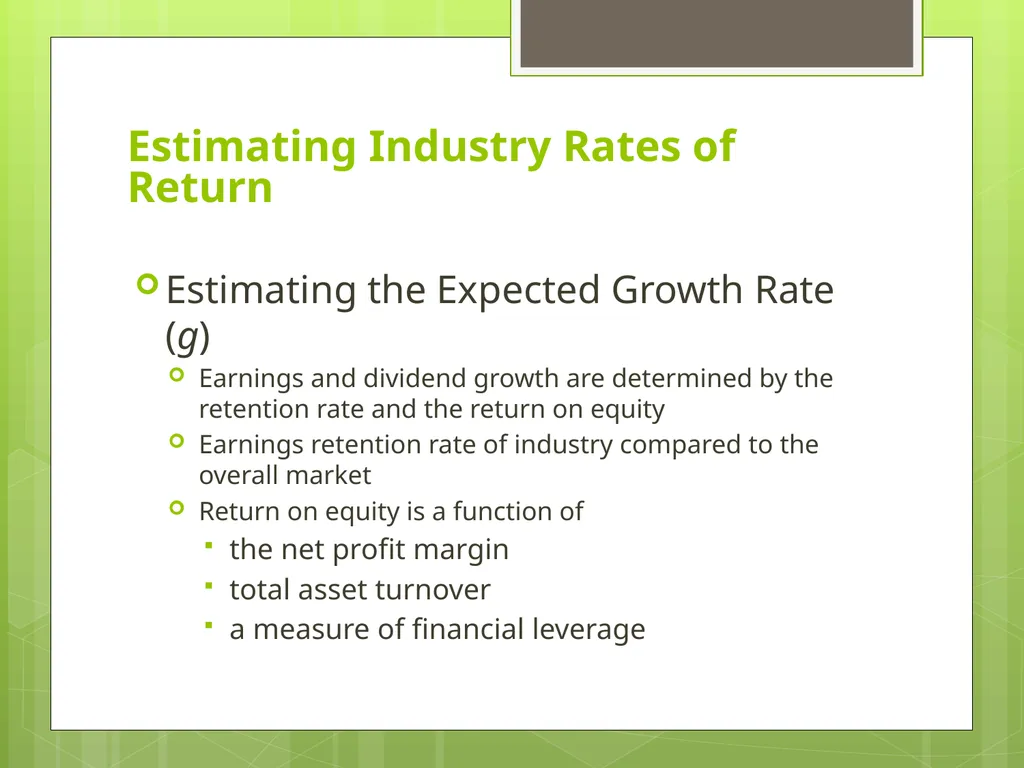
slide37. Estimating Industry Rates of Return Estimating the Expected Growth Rate (g)
Earnings and dividend growth are determined by the retention rate and the return on equity
Earnings retention rate of industry compared to the overall market
Return on equity is a function of
the net profit margin
total asset turnover
a measure of financial leverage<br>
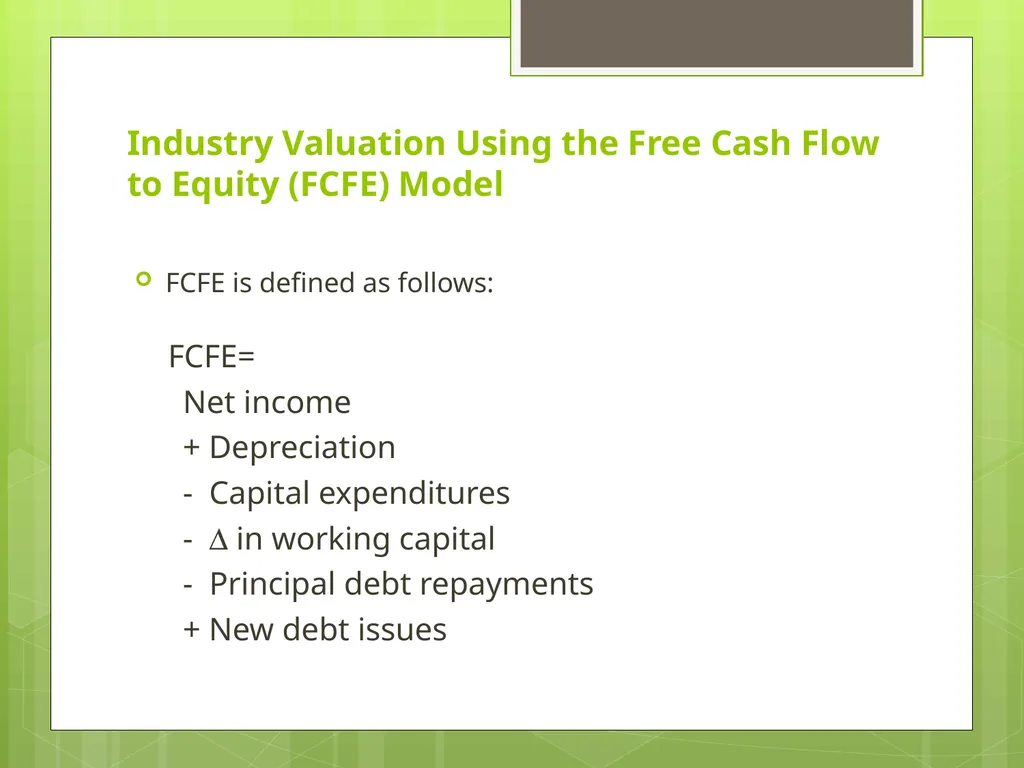
slide38. Industry Valuation Using the Free Cash Flow to Equity (FCFE) Model FCFE is defined as follows:
FCFE=
Net income
+ Depreciation
- Capital expenditures
- D in working capital
- Principal debt repayments
+ New debt issues<br>
slide39. Industry Valuation Using the Free Cash Flow to Equity (FCFE) Model The Constant Growth FCFE Model
The Two-Stage Growth FCFE Model
The two-stage model is similar to the two-stage DDM model
IN the second stage, FCFE is assumed to grow at a constant rate, normally lower than that in the first stage period<br>
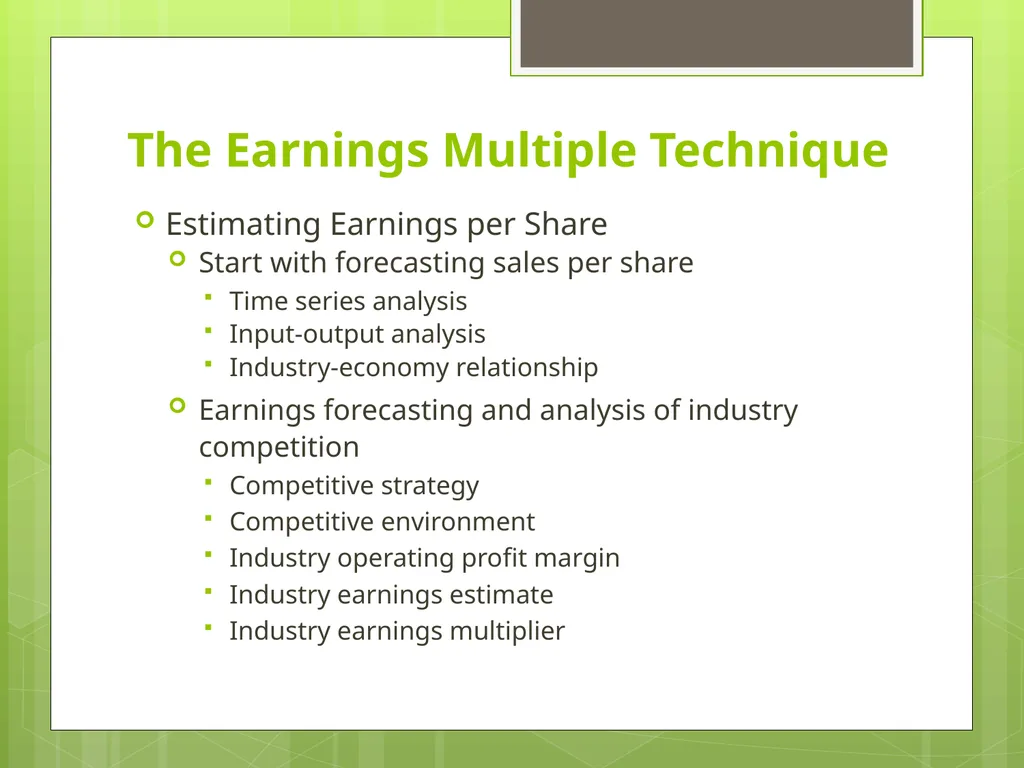
slide40. The Earnings Multiple Technique Estimating Earnings per Share
Start with forecasting sales per share
Time series analysis
Input-output analysis
Industry-economy relationship
Earnings forecasting and analysis of industry competition
Competitive strategy
Competitive environment
Industry operating profit margin
Industry earnings estimate
Industry earnings multiplier<br>
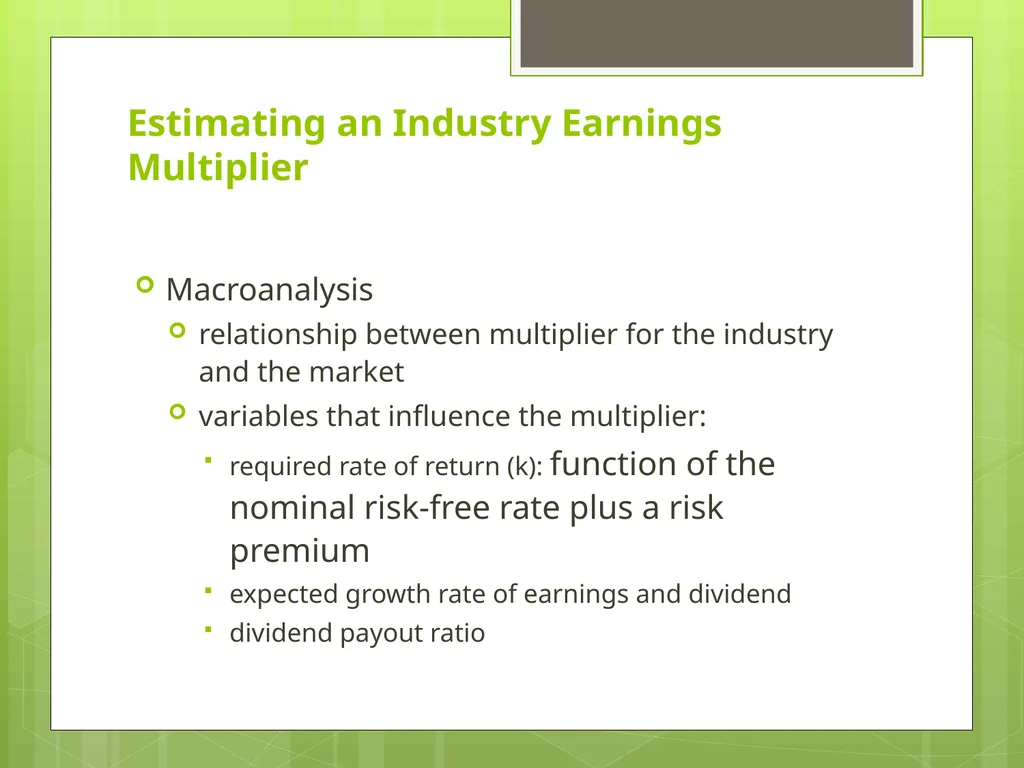
slide41. Estimating an Industry Earnings Multiplier Macroanalysis
relationship between multiplier for the industry and the market
variables that influence the multiplier:
required rate of return (k): function of the nominal risk-free rate plus a risk premium
expected growth rate of earnings and dividend
dividend payout ratio<br>
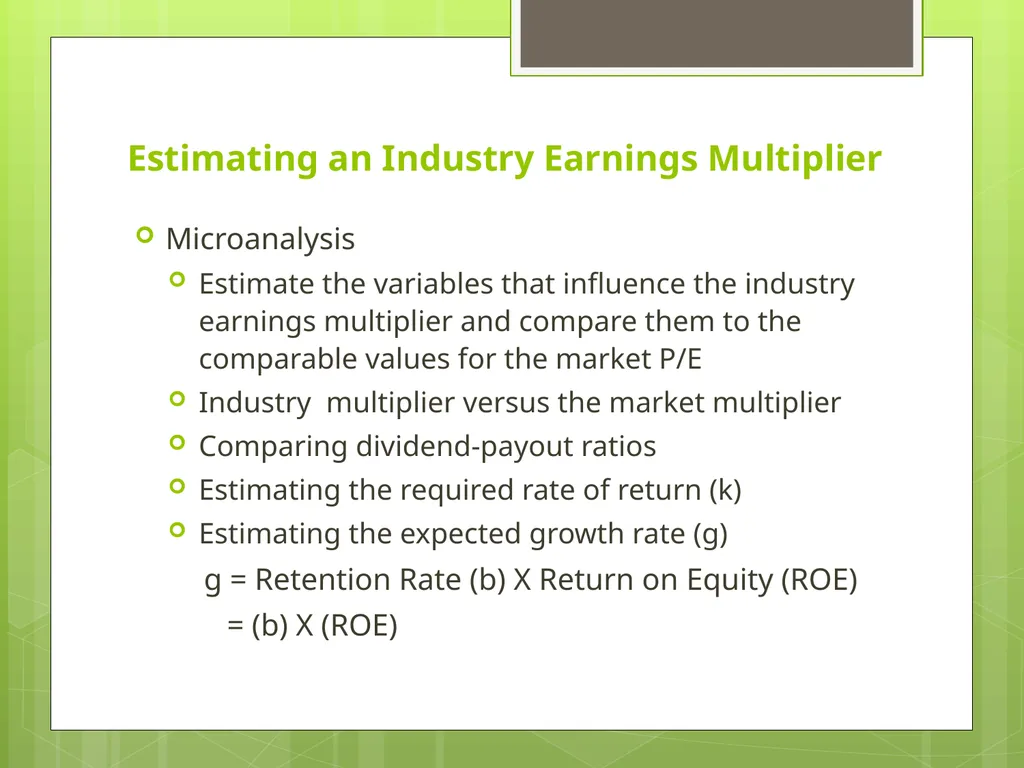
slide42. Estimating an Industry Earnings Multiplier Microanalysis
Estimate the variables that influence the industry earnings multiplier and compare them to the comparable values for the market P/E
Industry multiplier versus the market multiplier
Comparing dividend-payout ratios
Estimating the required rate of return (k)
Estimating the expected growth rate (g)
g = Retention Rate (b) X Return on Equity (ROE)
= (b) X (ROE)<br>
slide43. Other Relative Valuation Ratios Price-to-book value ratios (P/BV)
Price-to-cash flow ratios (P/CF)
Price-to-sales ratios (P/S)<br>
slide2. Why Do Industry Analysis? The Purpose:
Help find profitable investment opportunities
Part of the three-step, top-down plan for valuing individual companies and selecting stocks for a portfolio<br>
slide3. Why Do Industry Analysis? Cross-Sectional Industry Performance
To find out the rates of return among different industries, researchers compared the performance of alternative industries during a specific time period and the result showed:
Wide dispersion in rates of return in different industries
These results imply that industry analysis is important and necessary to uncover these substantial performance differences—that is, it helps identify both unprofitable and profitable opportunities<br>
slide4. Why Do Industry Analysis? Industry Performance over Time
Research shows that there is almost no association in individual industry performance year to year or over sequential rising or falling markets
This imply that:
past performance alone does not project future industry performance.
Variables that affect industry performance change over time
Each year you must estimate the current intrinsic value for each industry based on future estimates of relevant variables
Compare this to its current market price<br>
slide5. Why Do Industry Analysis? Performance of Companies within an Industry
There is wide dispersion in the performance of companies within an industry
This reinforces the need for company analysis in addition to industry analysis<br>
slide6. Implication of dispersion within industries Some observers mentioned that industry analysis is useless because all firms in an industry do not move together.
Consistent firm performance in an industry would be ideal, because you would not need to do company analysis<br>
slide7. Implication of dispersion within industries For industries that have a strong, consistent industry influence, such as oil, gold, steel, autos, company analysis is less critical than industry analysis
The fact that there is not a strong industry influence across firms in most industries means that a thorough company analysis is necessary<br>
slide8. Implication of dispersion within industries Still industry analysis is necessary because it is much easier to select a superior company from a good industry than to find a good company in a poor industry
By selecting the best stocks within a strong industry, you avoid the risk that your analysis and selection of the best company in the industry will offset by poor industry performance<br>
slide9. Summary of research on industry analysis During any time period, the returns for different industries vary within a wide range, which means that industry analysis is an important part of the investment process
The rates of return for individual industries vary over time, so we cannot simply extrapolate past industry performance into the future<br>
slide10. Summary of research on industry analysis The rates of return on firms within industries also vary, so analysis of individual companies in an industry is a necessary follow-up to industry analysis.
During any time period, different industries’ risk levels vary within wide ranges, so we must examine and estimate the risk factors for alternative industries.<br>
slide11. Industry analysis process If we want to make an analysis of the economy or the aggregate market , it is necessary to examine the macro-economy for tow reasons:
Although the security market tend to move ahead of the aggregate economy, we know that security market reflect the strength or the weaknesses of the economy.
Most of the variables that determine value for the security markets are macro variables such as interest rates.<br>
slide12. Industry analysis process Therefore, our analysis of the aggregate equity market contained two components, macro-variables and micro analysis of specific variables that affect the valuation.<br>
slide13. Industry analysis process The industry analysis process is similar to the economic analysis.
macroanalysis of the industry to determine: how this industry relates to the business cycle? and what economic variables drive the industry?.
Macroanalysis of the industry will make the estimation of the valuation inputs of a discount rate and expected growth for earnings.
This macroanalysis will make the microvaluation component easier where we use the several valuation technique we used before.<br>
slide14. Industry analysis process The specific macro-analysis topics are:
The business cycle and industry sectors.
Structural economic changes and alternative industries.
Evaluating an industry’s life cycle.
Analysis of the competitive environment in the industry.<br>
slide15. Business Cycle and Industry Sectors Economic trends can and do affect industry performance.
Economic trends can take two basic forms:
Cyclical changes: that arise from the ups and downs of the business cycle.
Structural changes: when the economy is undergoing a major change in how it functions (ex, transaction in the United States from a manufacturing to a service economy).<br>
slide16. Business Cycle and Industry Sectors Industry performance is related to the stage of the business cycle.
Real challenge is that every business cycle is different and those who look only at history miss the evolving trends that will determine future market and industry performance.<br>
slide17. Business Cycle and Industry Sectors For example:
Toward the end of a recession, the banks industry assumes that earning will rise because there will be an increase in loan demands.
One the economy begins its recovery, consumer durable firms that produce items such as (cars, computers, refrigerators), becomes attractive investments because a reviving economy will increase consumer confidence and income.
Once businesses recognize the economic recovery, they think about modernizing and renovating, thus capital goods industries such as heavy equipment manufactures become attractive.<br>
slide18. Business Cycle and Industry Sectors Cyclical industries whose sales rise and fall along with general economic activity are attractive investments during the early stages of an economic recovery because of their high degree of operating leverage.
Toward a business cycle peak, inflation increases as demand starts to outstrip supply. And basic materials like oil, metals, which transforms raw material to final products will not be affected much by the inflation and they become investors favorites.
During a recession, some industries do better than others. Such as pharmaceutical, food, beverages<br>
slide19. Business Cycle and Industry Sectors Economic variables and different industries:
Inflation
Interest rates
International economics
Consumer sentiment<br>
slide20. Inflation Industries with high operating leverage benefit because many of their costs are fixed in nominal (current dollar) terms, whereas revenues increase with inflation
Industries with high financial leverage may also gain, because their debts are repaid in cheaper dollars
Higher inflation is generally negative for stocks because it causes higher market interest rates
More uncertainty about future prices and costs
Harms firms that cannot pass through cost increases
Some industries benefit like natural resources
If production costs do not rise with inflation, output is likely to sell at higher prices<br>
slide21. Interest rate Financial institutions, like banks, are typically adversely impacted by higher rates because they find it difficult to pass on these higher rates to customers (i.e. lagged adjustment)
High interest rates clearly harm the housing and the construction industry
Benefit retirees who depend on interest income<br>
slide22. International Economies A weaker US dollar help US industries because their exports become comparatively cheaper in overseas markets
While goods of foreign competitors become more expensive in US
A stronger dollar has an opposite effect
Economic growth in world regions or specific countries benefits industries that have a large presence in those areas<br>
slide23. Consumer sentiment Consumption spending has a large impact on the economy
Optimistic consumers are willing to spend
Borrow money for expensive goods such as houses, cars, new clothes and furniture
Performance of consumer cyclical industries will be affected by changes in consumer sentiment and consumers’ willingness and ability to borrow and spend money<br>
slide24. Structural economic changes and alternative industries Demographics
Lifestyles
Technology
Politics and regulations<br>
slide25. Evaluating the Industry Life Cycle When predicting the industry sales and trends in profitability, an insightful analysis is to view the industry over time in different stages
The Five-Stage Model
Pioneering development
Rapidly accelerating industry growth
Mature industry growth
Stabilization and market maturity
Deceleration of growth and decline
See Exhibit 13.4<br>
slide26. Exhibit<br>
slide27. Life cycle of industry and sales and profits Pioneering development:
Modest sales growth
Very small or negative profits
Market for product or service is small
Firms incur major development costs<br>
slide28. Life cycle of industry and sales and profits Rapid accelerating growth:
Market develops for the product or service
Demand become substantial
Limited number of firms face little competition
Firms can experience substantial backlogs and high profit margins
Firms build capacity
High sales growth and high profit margins<br>
slide29. Life cycle of industry and sales and profits Mature growth:
Future sales growth may be above normal but no longer accelerating
Profit margins begin to decline to normal levels<br>
slide30. Life cycle of industry and sales and profits Stabilizing and market maturity:
Longest phase
Growth rate declines to the growth rate of the aggregate economy or its industry segment
Profit growth varies by industry because the competitive structure varies by industry
By individual firms within industry because of their ability to control costs<br>
slide31. Life cycle of industry and sales and profits Deceleration of growth and decline:
Sales growth declines because of shifts in demand or growth of substitutes
Profit margins continue to be squeezed
Some firms experience low profits or even losses
Low rates of return on capital<br>
slide32. Analysis of Industry Competition Porter’s Competitive Forces (Exhibit 13.5)
Rivalry among existing competitors
More rivalry means intense competition
Threat of new entrants
Are there barriers to entry?
Threat of substitute products
Substitute products limit the profit potential of an industry
Bargaining power of buyers
Volume discounts, quality demands
Bargaining power of suppliers
Can suppliers increase prices or reduce quality?<br>
slide34. Estimating Industry Rates of Return Do we go about valuing an industry?
Present value using required rate of return for the equity in the industry
Two-step P/E ratio approach uses expected value at the end of investment horizon and compute the expected dividend return during the period
Estimating required rate of return and growth rates are the key<br>
slide35. Estimating Industry Rates of Return Valuation using the reduced form DDM
where:
Pi = the price of industry i at time t
D1 = the expected dividend for industry i in period 1 equal to D0(1+g)
k = the required rate of return on the equity for industry i
g = the expected long-run growth rate of earnings and dividend for industry i<br>
slide36. Estimating Industry Rates of Return Estimating the Required Rate of Return (k)
Influenced by the risk-free rate
Expected inflation rate
Risk premium for the industry versus the market
business risk (BR)
financial risk (FR)
liquidity risk (LR)
exchange rate risk (ERR)
country political risk (CR)
Or compare systematic risk (beta) for the industry to the market beta of 1.0<br>
slide37. Estimating Industry Rates of Return Estimating the Expected Growth Rate (g)
Earnings and dividend growth are determined by the retention rate and the return on equity
Earnings retention rate of industry compared to the overall market
Return on equity is a function of
the net profit margin
total asset turnover
a measure of financial leverage<br>
slide38. Industry Valuation Using the Free Cash Flow to Equity (FCFE) Model FCFE is defined as follows:
FCFE=
Net income
+ Depreciation
- Capital expenditures
- D in working capital
- Principal debt repayments
+ New debt issues<br>
slide39. Industry Valuation Using the Free Cash Flow to Equity (FCFE) Model The Constant Growth FCFE Model
The Two-Stage Growth FCFE Model
The two-stage model is similar to the two-stage DDM model
IN the second stage, FCFE is assumed to grow at a constant rate, normally lower than that in the first stage period<br>
slide40. The Earnings Multiple Technique Estimating Earnings per Share
Start with forecasting sales per share
Time series analysis
Input-output analysis
Industry-economy relationship
Earnings forecasting and analysis of industry competition
Competitive strategy
Competitive environment
Industry operating profit margin
Industry earnings estimate
Industry earnings multiplier<br>
slide41. Estimating an Industry Earnings Multiplier Macroanalysis
relationship between multiplier for the industry and the market
variables that influence the multiplier:
required rate of return (k): function of the nominal risk-free rate plus a risk premium
expected growth rate of earnings and dividend
dividend payout ratio<br>
slide42. Estimating an Industry Earnings Multiplier Microanalysis
Estimate the variables that influence the industry earnings multiplier and compare them to the comparable values for the market P/E
Industry multiplier versus the market multiplier
Comparing dividend-payout ratios
Estimating the required rate of return (k)
Estimating the expected growth rate (g)
g = Retention Rate (b) X Return on Equity (ROE)
= (b) X (ROE)<br>
slide43. Other Relative Valuation Ratios Price-to-book value ratios (P/BV)
Price-to-cash flow ratios (P/CF)
Price-to-sales ratios (P/S)<br>