INTERIM RESULTS PRESENTATION 2012 Nicky Newton-King, CEO August 2012 H1 SYNOPSIS Difficult first half slows revenue growth Globally Enormous upheaval in financial services industry Slow economic growth in many regions worldwide Globally,
"INTERIM RESULTS PRESENTATION 2012 Nicky" is the property of its rightful owner. Permission is granted to
download and print the materials on this website for personal, non-commercial use only, and to display it
on your personal computer provided you do not modify the materials and that you retain all copyright
notices contained in the materials. By downloading content from our website, you accept the terms of this
agreement.
Presentation Transcript
01
INTERIM RESULTS PRESENTATION 2012 Nicky Newton-King, CEO August 2012<br>
02
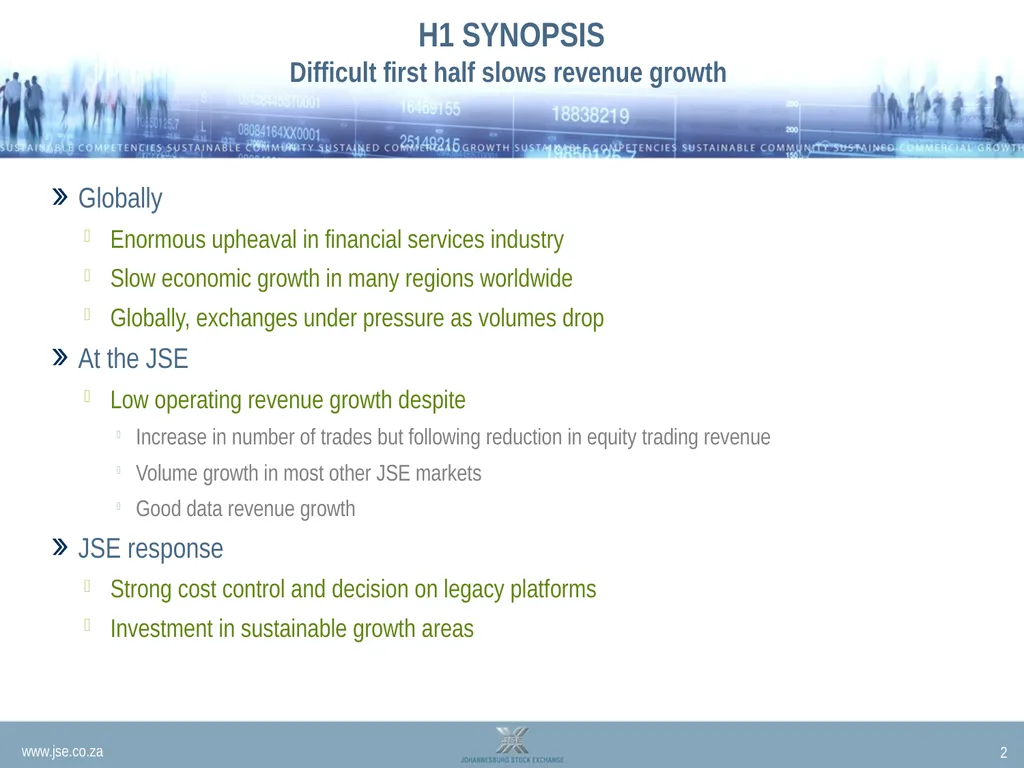
H1 SYNOPSIS Difficult first half slows revenue growth Globally
Enormous upheaval in financial services industry
Slow economic growth in many regions worldwide
Globally, exchanges under pressure as volumes drop
At the JSE
Low operating revenue growth despite
Increase in number of trades but following reduction in equity trading revenue
Volume growth in most other JSE markets
Good data revenue growth
JSE response
Strong cost control and decision on legacy platforms
Investment in sustainable growth areas 2<br>
03
TAKING THE PAIN SRP impairment knocks results Technical advice: desirable to completely rewrite 1 of 5 components of SRP
Board has accepted advice
Results in impairment to SRP of R72.6m
Impact of impairment on H1 results
Carrying value of SRP at end 2011 – R158.0m
Impairment in H1 2012 - R72.6m
Remaining aspects of SRP allocated to appropriate projects
Surveillance – R54.0m
T+3 – R22.8m
PSP II – R7.6m
Cost previously capitalised, expensed while review done – approx R23.9m (2011: R36.1m)
48 people to be rolled off
Retained portion of 2011 bonus – impact R7.3m
Forfeited completely by 2011 Execs
Forfeited in part by other JSE staff 3<br>
04
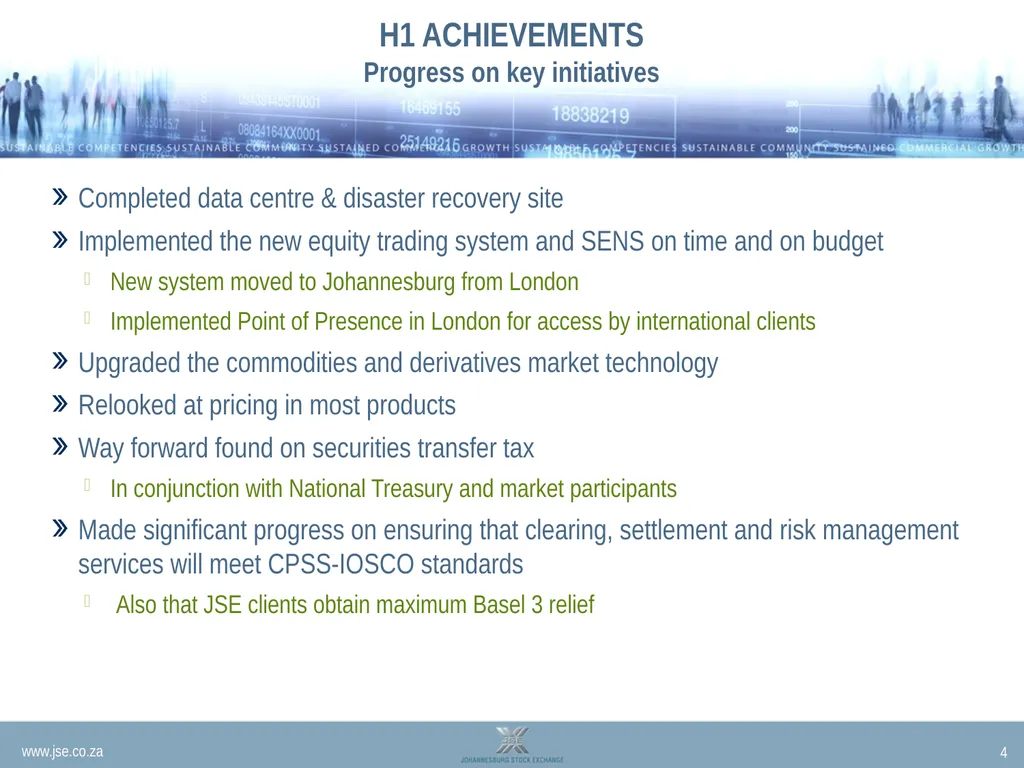
H1 ACHIEVEMENTS Progress on key initiatives Completed data centre & disaster recovery site
Implemented the new equity trading system and SENS on time and on budget
New system moved to Johannesburg from London
Implemented Point of Presence in London for access by international clients
Upgraded the commodities and derivatives market technology
Relooked at pricing in most products
Way forward found on securities transfer tax
In conjunction with National Treasury and market participants
Made significant progress on ensuring that clearing, settlement and risk management services will meet CPSS-IOSCO standards
Also that JSE clients obtain maximum Basel 3 relief 4<br>
05
OPERATIONS<br>
06
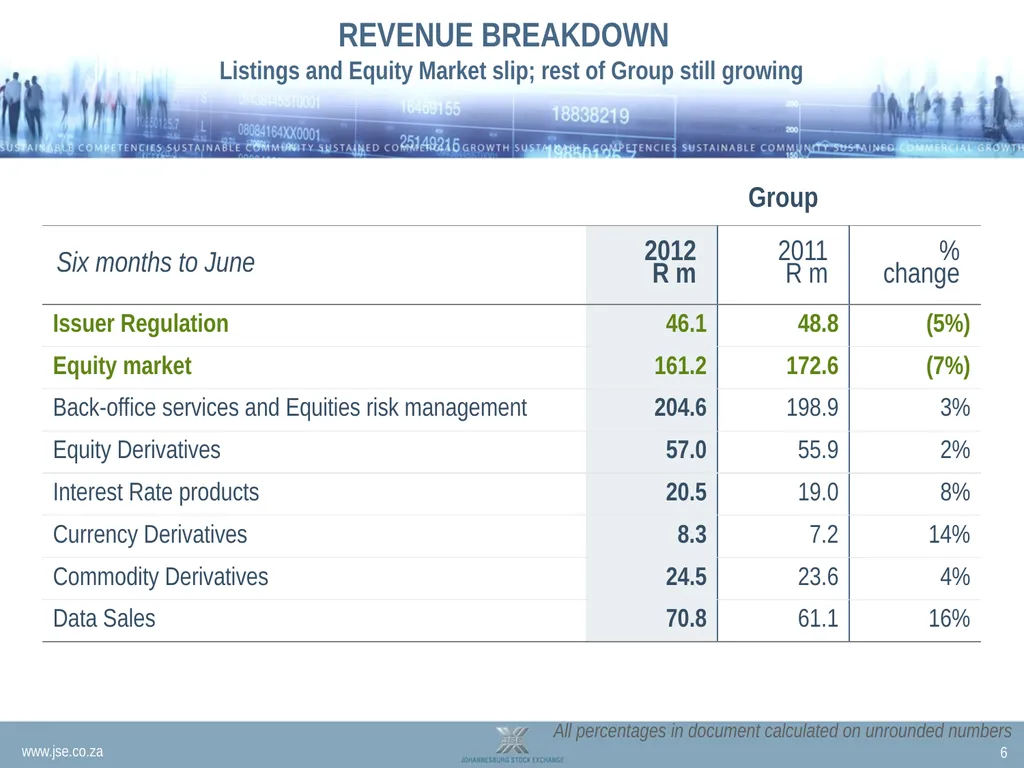
REVENUE BREAKDOWN Listings and Equity Market slip; rest of Group still growing 6 All percentages in document calculated on unrounded numbers<br>
07
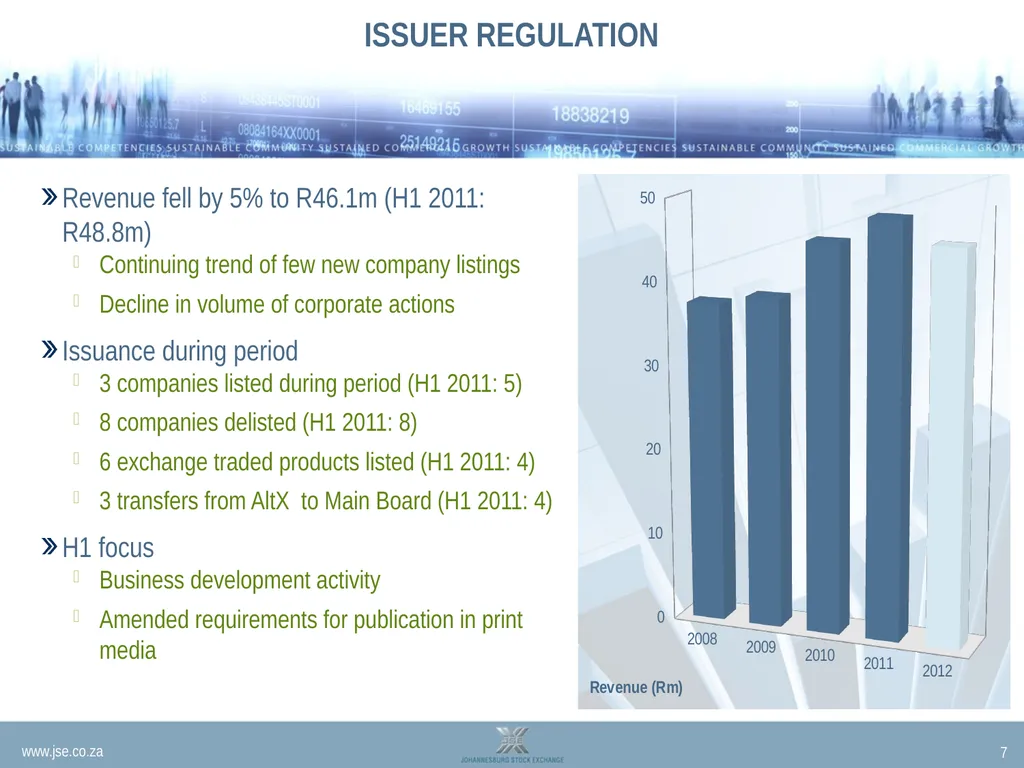
ISSUER REGULATION Revenue fell by 5% to R46.1m (H1 2011: R48.8m)
Continuing trend of few new company listings
Decline in volume of corporate actions
Issuance during period
3 companies listed during period (H1 2011: 5)
8 companies delisted (H1 2011: 8)
6 exchange traded products listed (H1 2011: 4)
3 transfers from AltX to Main Board (H1 2011: 4)
H1 focus
Business development activity
Amended requirements for publication in print media 7<br>
08
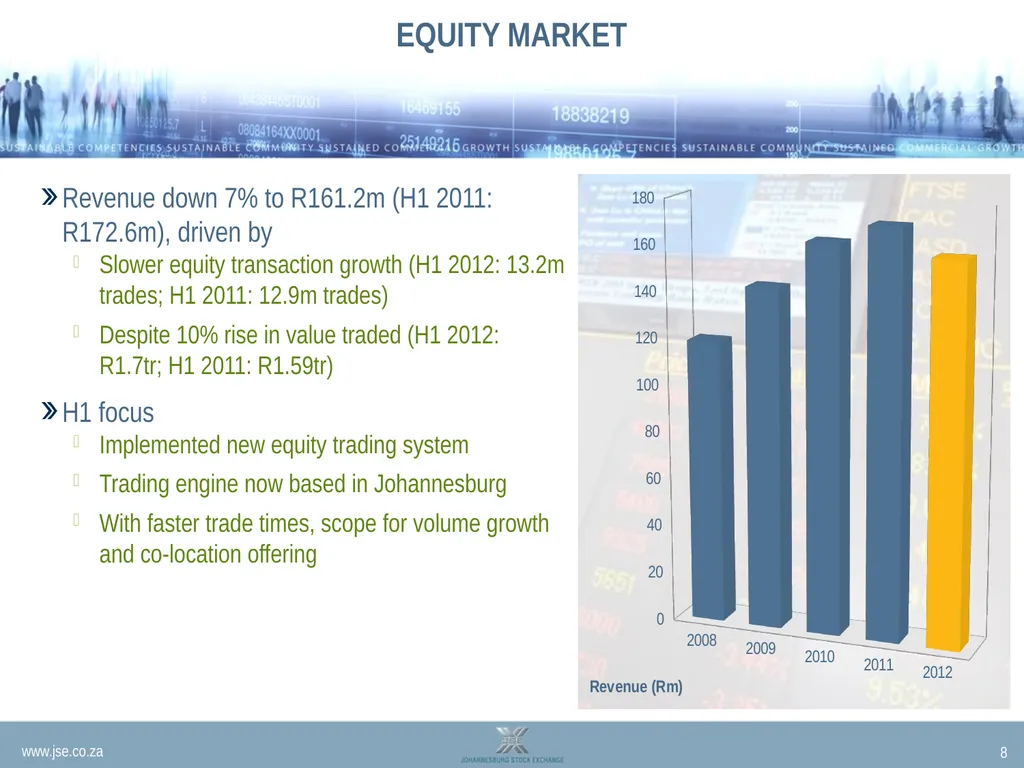
EQUITY MARKET Revenue down 7% to R161.2m (H1 2011: R172.6m), driven by
Slower equity transaction growth (H1 2012: 13.2m trades; H1 2011: 12.9m trades)
Despite 10% rise in value traded (H1 2012: R1.7tr; H1 2011: R1.59tr)
H1 focus
Implemented new equity trading system
Trading engine now based in Johannesburg
With faster trade times, scope for volume growth and co-location offering 8<br>
09
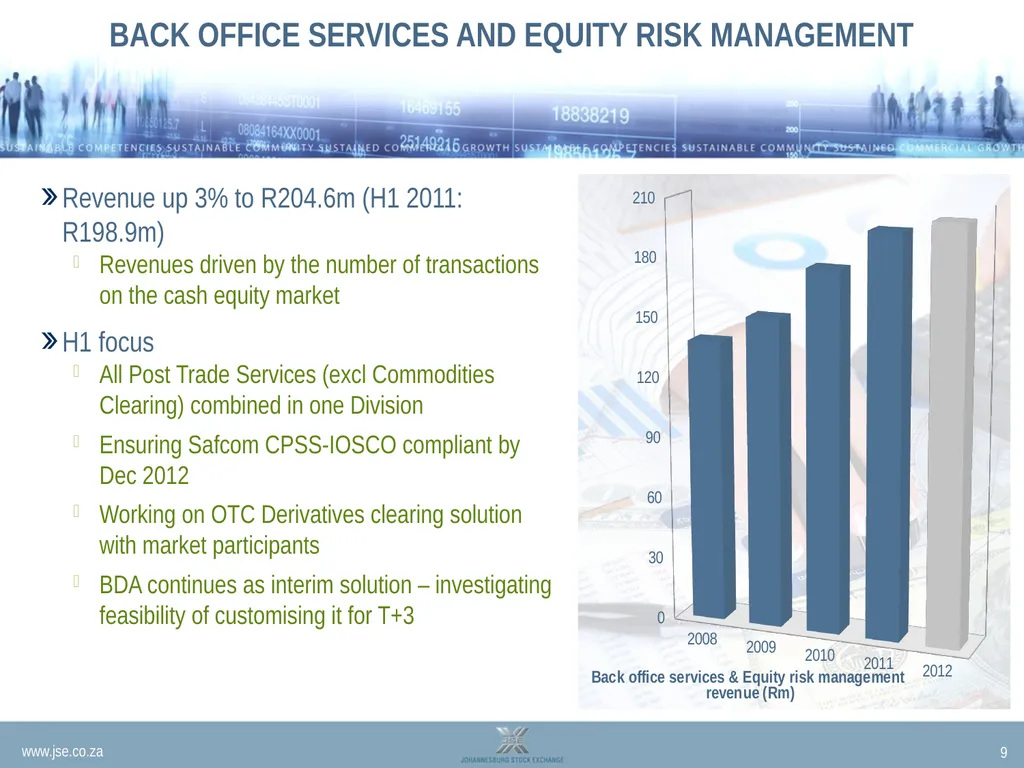
BACK OFFICE SERVICES AND EQUITY RISK MANAGEMENT Revenue up 3% to R204.6m (H1 2011: R198.9m)
Revenues driven by the number of transactions on the cash equity market
H1 focus
All Post Trade Services (excl Commodities Clearing) combined in one Division
Ensuring Safcom CPSS-IOSCO compliant by Dec 2012
Working on OTC Derivatives clearing solution with market participants
BDA continues as interim solution – investigating feasibility of customising it for T+3 9<br>
10
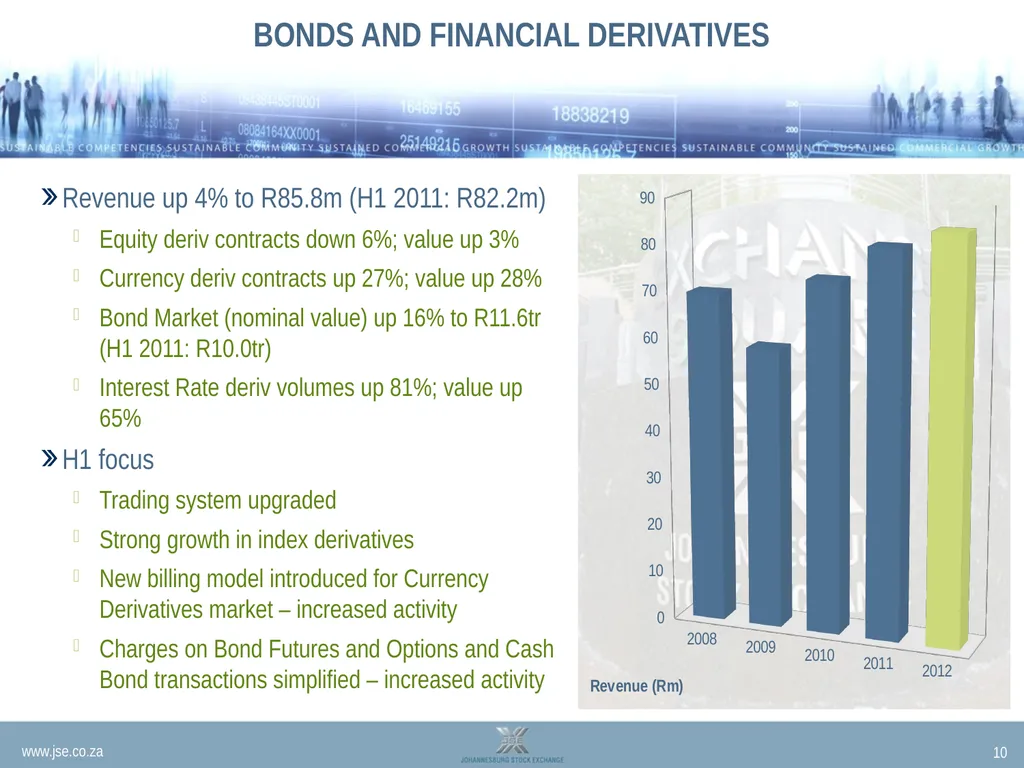
BONDS AND FINANCIAL DERIVATIVES Revenue up 4% to R85.8m (H1 2011: R82.2m)
Equity deriv contracts down 6%; value up 3%
Currency deriv contracts up 27%; value up 28%
Bond Market (nominal value) up 16% to R11.6tr (H1 2011: R10.0tr)
Interest Rate deriv volumes up 81%; value up 65%
H1 focus
Trading system upgraded
Strong growth in index derivatives
New billing model introduced for Currency Derivatives market – increased activity
Charges on Bond Futures and Options and Cash Bond transactions simplified – increased activity 10<br>
11
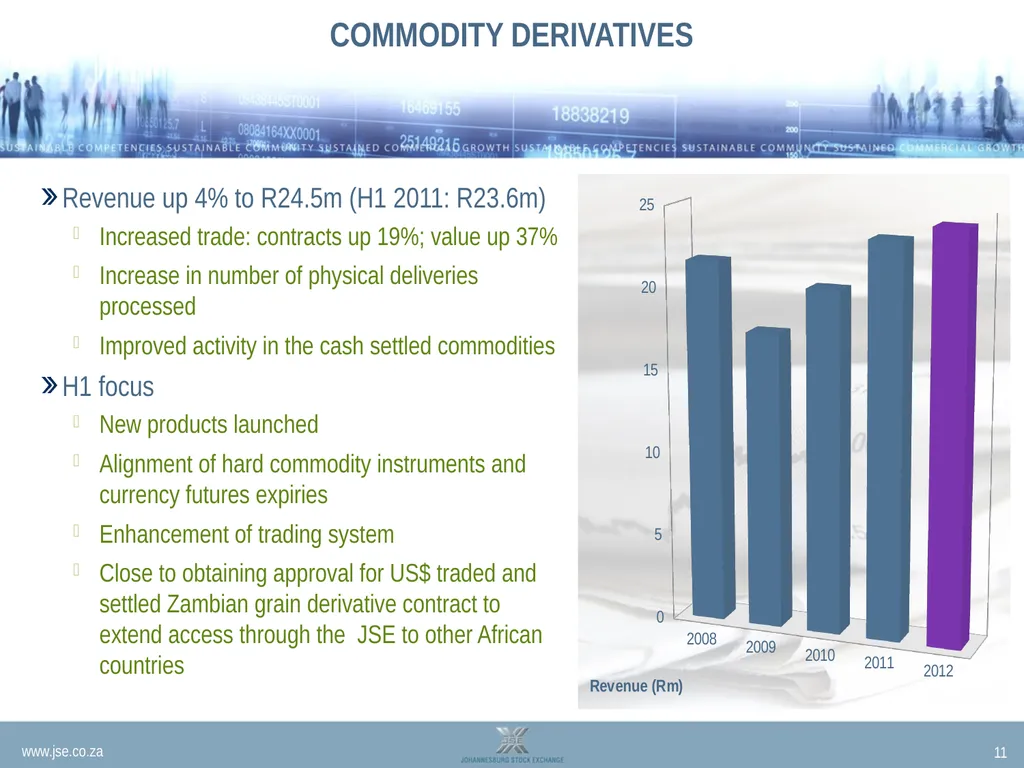
COMMODITY DERIVATIVES Revenue up 4% to R24.5m (H1 2011: R23.6m)
Increased trade: contracts up 19%; value up 37%
Increase in number of physical deliveries processed
Improved activity in the cash settled commodities
H1 focus
New products launched
Alignment of hard commodity instruments and currency futures expiries
Enhancement of trading system
Close to obtaining approval for US$ traded and settled Zambian grain derivative contract to extend access through the JSE to other African countries 11<br>
12
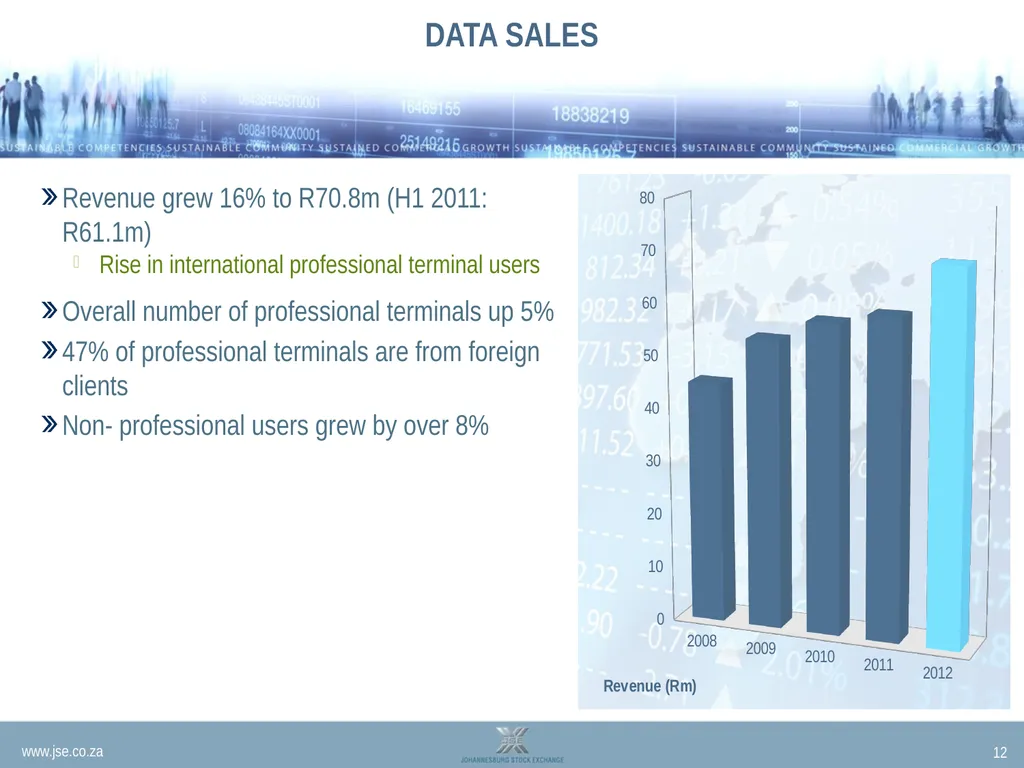
DATA SALES Revenue grew 16% to R70.8m (H1 2011: R61.1m)
Rise in international professional terminal users
Overall number of professional terminals up 5%
47% of professional terminals are from foreign clients
Non- professional users grew by over 8% 12<br>
13
FINANCIAL REVIEW<br>
14
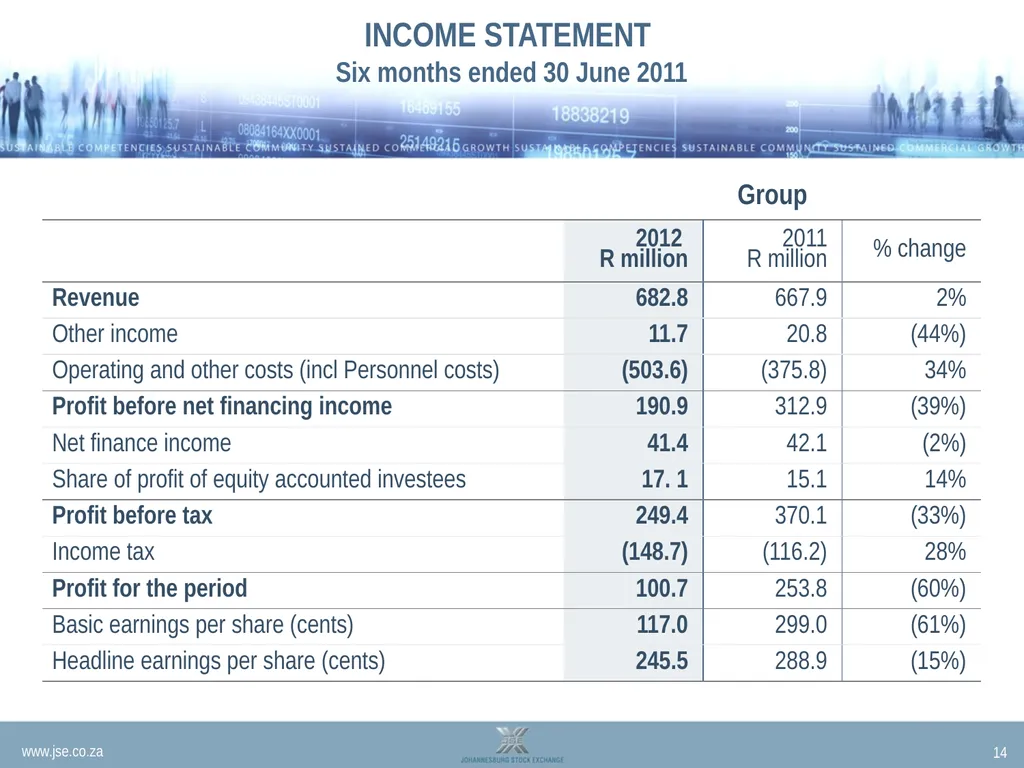
INCOME STATEMENT Six months ended 30 June 2011 14<br>
15
COSTS Impacted by SRP impairment; nonetheless costs controlled Personnel expenses up 19% to R161.1m (H1 2011: R134.9m)
Excluding SRP impact, personnel costs up 9%
Most of the 9% rise made up of salary increases and a slight rise in staff numbers
Other expenses up 42% to R342.5m (H1 2011: R240.9m)
Excluding SRP impact, other expenses up 12%
12% rise made up of increases in computer and consulting fees
Total operating costs increased by 34% primarily as a result of
Impairment
Impact of lower capitalisation charge on personnel expenses
Early retirement payments (R6.2m)
Withholding of bonus (R7.3m)
Current renewed focus on costs in tough environment includes
Rolling off of contract resources 15<br>
16
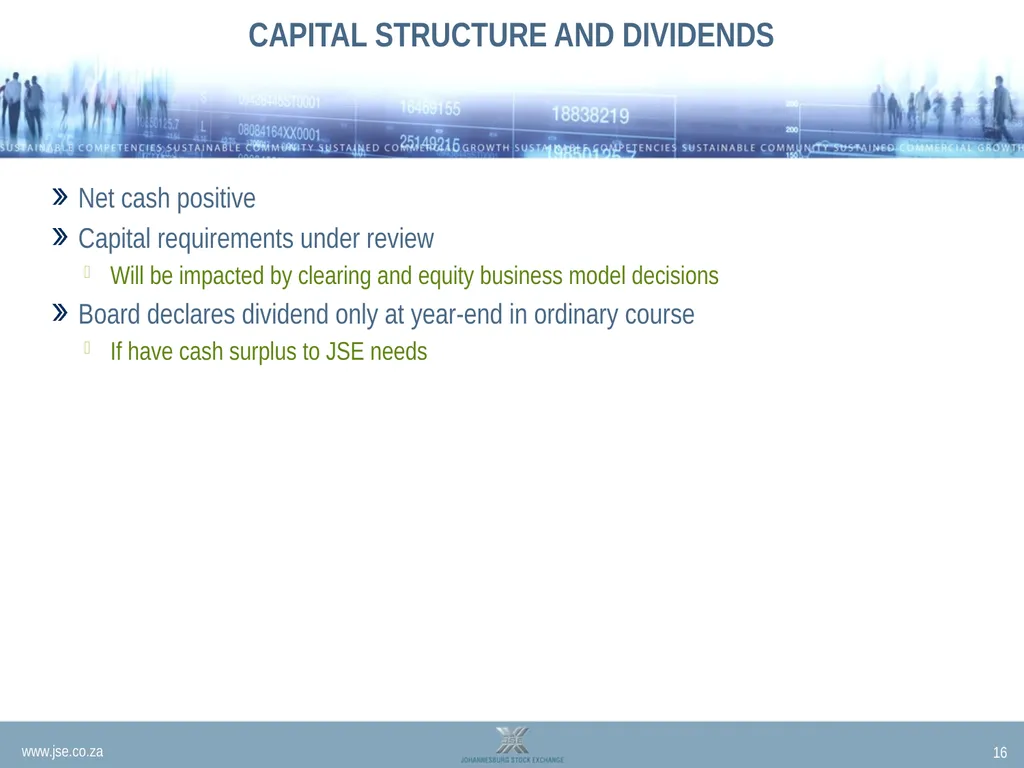
CAPITAL STRUCTURE AND DIVIDENDS Net cash positive
Capital requirements under review
Will be impacted by clearing and equity business model decisions
Board declares dividend only at year-end in ordinary course
If have cash surplus to JSE needs 16<br>
17
LOOKING AHEAD<br>
18
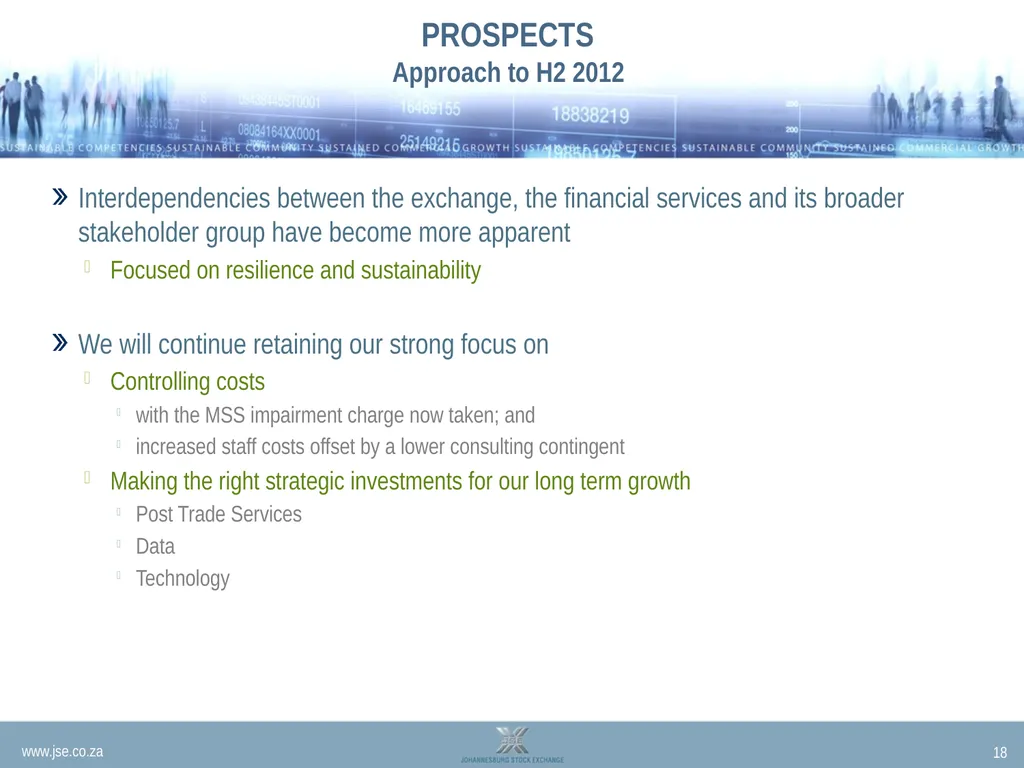
PROSPECTS Approach to H2 2012 Interdependencies between the exchange, the financial services and its broader stakeholder group have become more apparent
Focused on resilience and sustainability
We will continue retaining our strong focus on
Controlling costs
with the MSS impairment charge now taken; and
increased staff costs offset by a lower consulting contingent
Making the right strategic investments for our long term growth
Post Trade Services
Data
Technology 18<br>