
Introduction to Management Science Thirteenth






Description: Introduction to Management Science Thirteenth Edition, Global Edition Chapter 8 Project Management Copyright 2019 Pearson Education, Ltd. All Rights Reserved Learning Objectives 8.1 The Elements of Project Management 8.2 C P MP E R T 8.3
Related Topics
Download Presentation
"Introduction to Management Science Thirteenth" is the property of its rightful owner. Permission is granted to download and print the materials on this website for personal, non-commercial use only, and to display it on your personal computer provided you do not modify the materials and that you retain all copyright notices contained in the materials. By downloading content from our website, you accept the terms of this agreement.
Presentation Transcript
slide1. Introduction to Management Science Thirteenth Edition, Global Edition Chapter 8 Project Management Copyright © 2019 Pearson Education, Ltd. All Rights Reserved<br>
slide2. Learning Objectives 8.1 The Elements of Project Management
8.2 C P M/P E R T
8.3 Probabilistic Activity Times
8.4 Microsoft Project
8.5 Project Crashing and Time-Cost Trade-Off
8.6 Formulating the C P M/P E R T Network as a Linear Programming Model<br>
slide3. Overview Network representation is useful for project analysis.
Networks show how project activities are organized and are used to determine time duration of projects.
Network techniques used are:
C P M (Critical Path Method)
P E R T (Project Evaluation and Review Technique)
Developed independently during late 1950s.<br>
slide4. Learning Objective 8.1 The Elements of Project Management<br>
slide5. Elements of Project Management Management is generally perceived as concerned with planning, organizing, and control of an ongoing process or activity.
Project management is concerned with control of an important activity for a relatively short period of time after which management effort ends.
Primary elements of project management to be discussed:
Project Planning
Project Return
Project Team
Project Control<br>
slide6. Project Planning Objectives
Project scope
Contract requirements
Schedules
Resources
Personnel
Control
Risk and problem analysis<br>
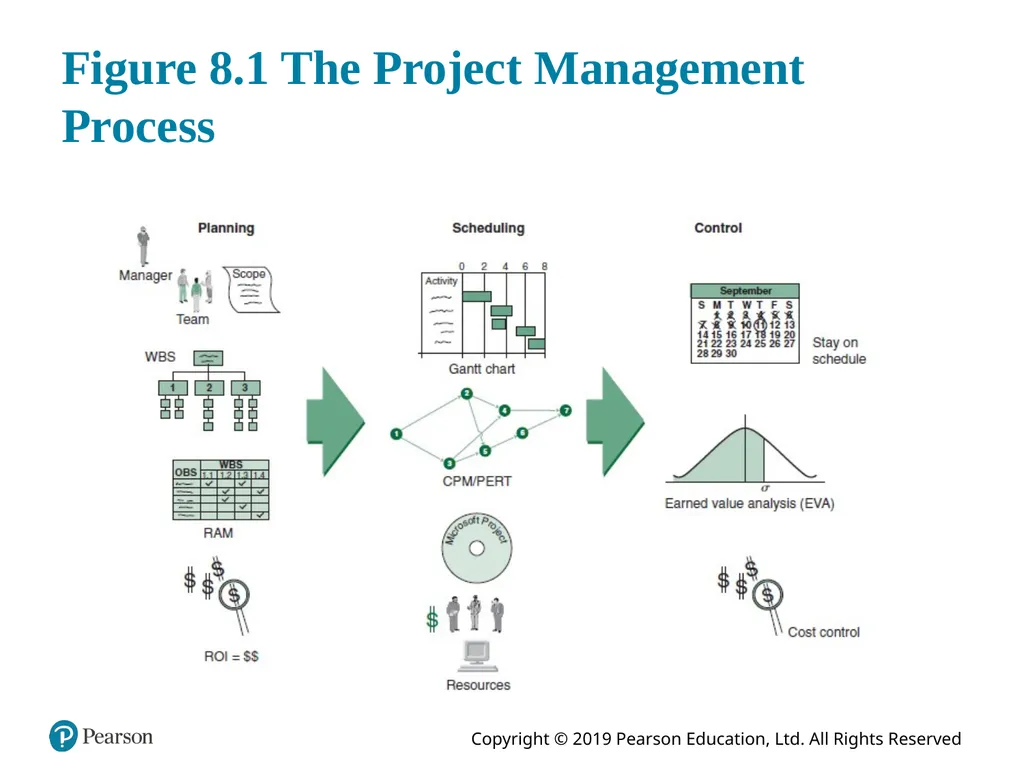
slide7. Figure 8.1 The Project Management Process<br>
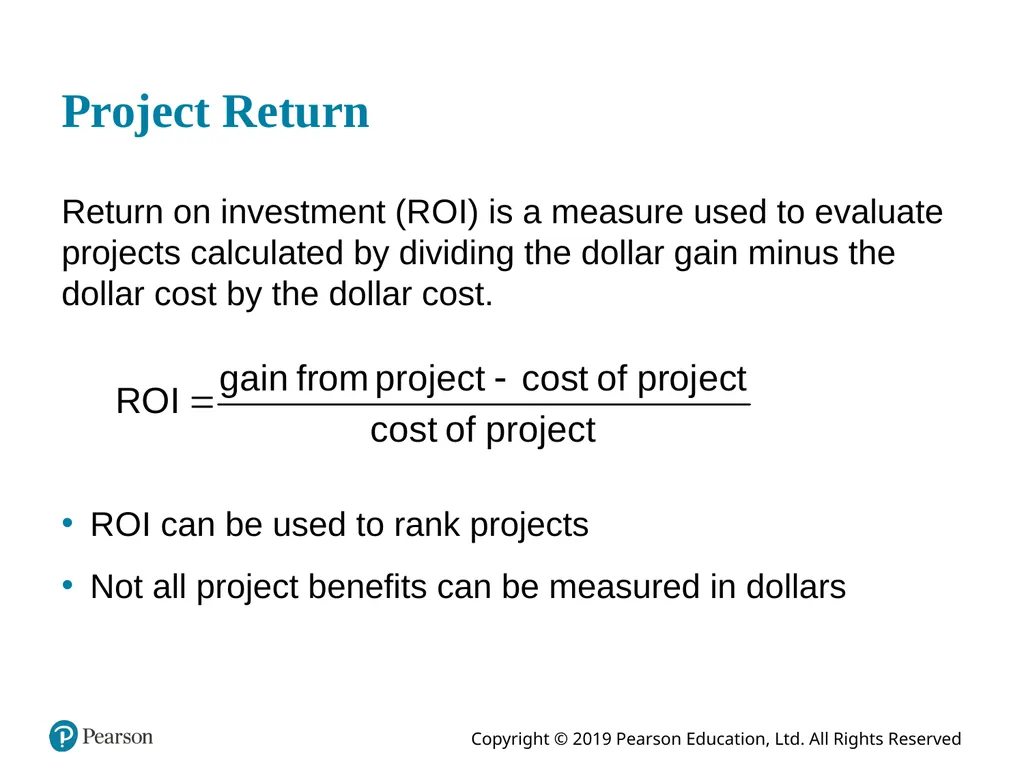
slide8. Project Return Return on investment (R O I) is a measure used to evaluate projects calculated by dividing the dollar gain minus the dollar cost by the dollar cost. R O I can be used to rank projects
Not all project benefits can be measured in dollars<br>
slide9. The Project Team Project team typically consists of a group of individuals from various areas in an organization and often includes outside consultants.
Members of engineering staff often assigned to project work.
Project team may include workers.
Most important member of project team is the project manager.
Project manager is often under great pressure because of uncertainty inherent in project activities and possibility of failure. Potential rewards, however, can be substantial.
Project manager must be able to coordinate various skills of team members into a single focused effort.<br>
slide10. Scope Statement Document providing common understanding of project.
Justification describing the factors giving rise to need for project.
Expected results and what constitutes success.
List of necessary documents and planning reports.
Statement of work (S O W) - a planning document for individuals, team members, groups, departments, subcontractors and suppliers, describing what are required for successful completion on time.<br>
slide11. Work Breakdown Structure (W B S) (1 of 2) W B S breaks down project into major components (modules).
Modules are further broken down into activities and, finally, into individual tasks.
Identifies activities, tasks, resource requirements and relationships between modules and activities.
Helps avoid duplication of effort.
Basis for project development, management , schedule, resources and modifications.<br>
slide12. Work Breakdown Structure (W B S) (2 of 2) Approaches for W B S development: Top down process
Brainstorm entire project<br>
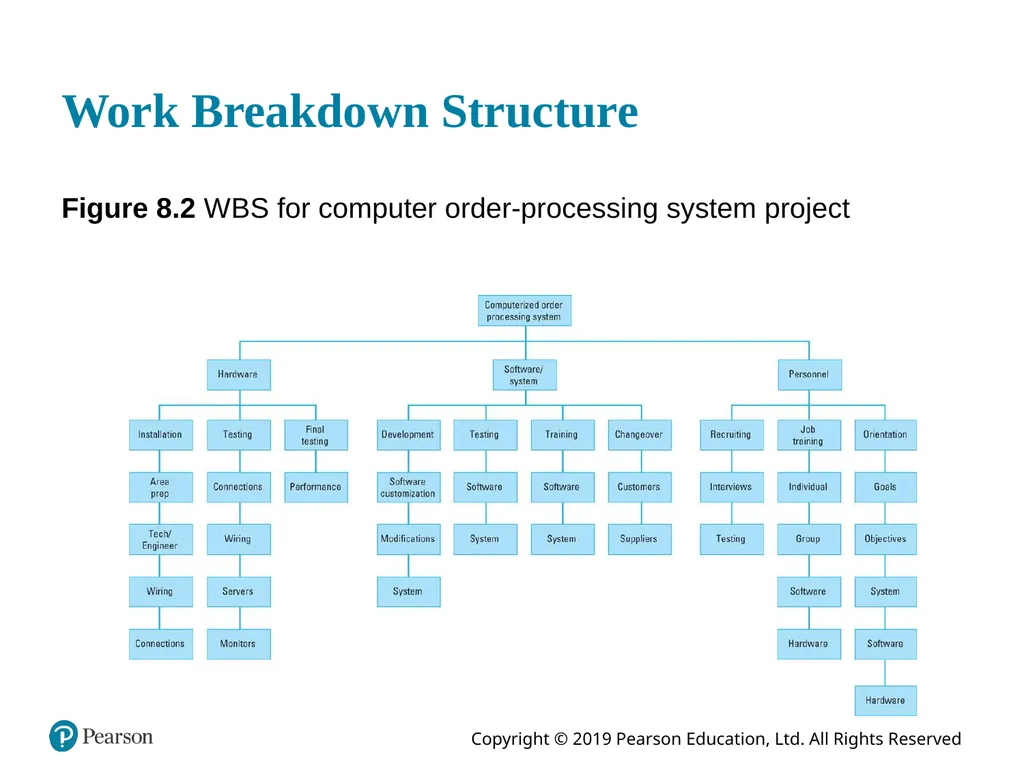
slide13. Work Breakdown Structure Figure 8.2 W B S for computer order-processing system project<br>
slide14. Responsibility Assignment Matrix R A M shows who is responsible for doing the necessary work in the project
Project manager assigns work elements to organizational units, departments, groups, individuals or subcontractors.
Uses an organizational breakdown structure (O B S).
O B S is a table or a chart showing which organizational units are responsible for work items.
O B S leads to the responsibility assignment matrix (R A M)<br>
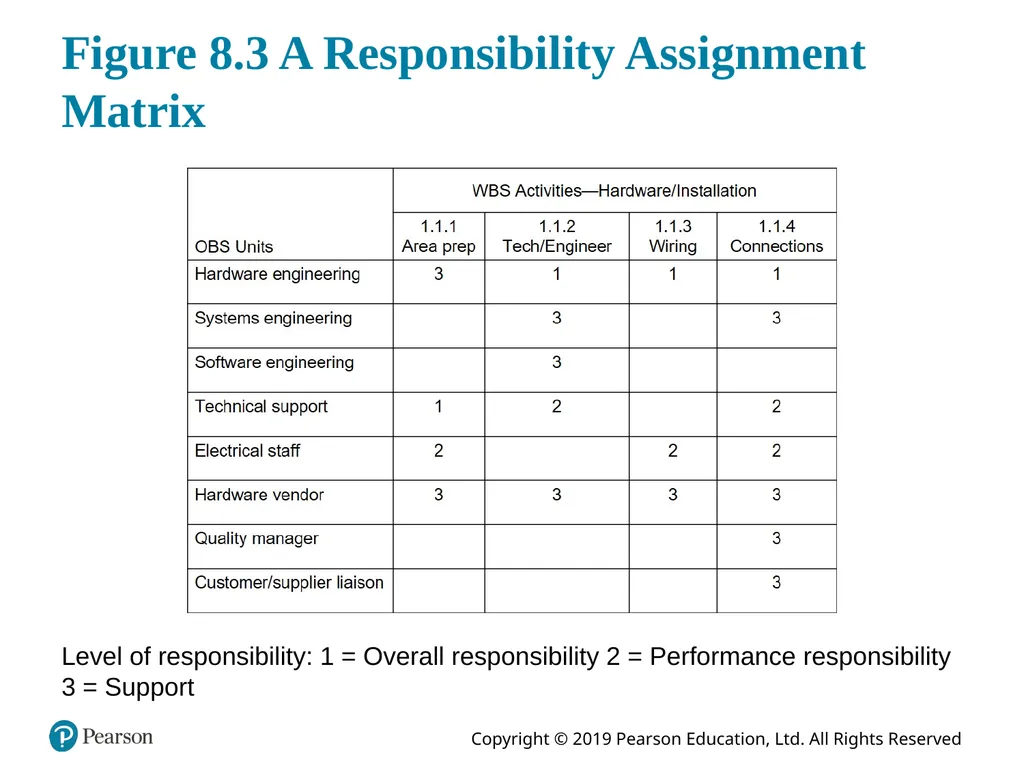
slide15. Figure 8.3 A Responsibility Assignment Matrix Level of responsibility: 1 = Overall responsibility 2 = Performance responsibility 3 = Support<br>
slide16. Project Scheduling (1 of 2) Project schedule evolves from planning documents, with focus on timely completion.
Critical element in project management – source of most conflicts and problems.
Schedule development steps: Define activities,
Sequence activities,
Estimate activity times,
Develop schedule.<br>
slide17. Project Scheduling (2 of 2) Gantt chart and C P M/P E R T techniques can be useful.
Computer software packages available, example Microsoft Project.<br>
slide18. Gantt Chart Popular, traditional technique, also known as a bar chart -developed by Henry Gantt (1914).
Direct precursor of C P M/P E R T for monitoring work progress.
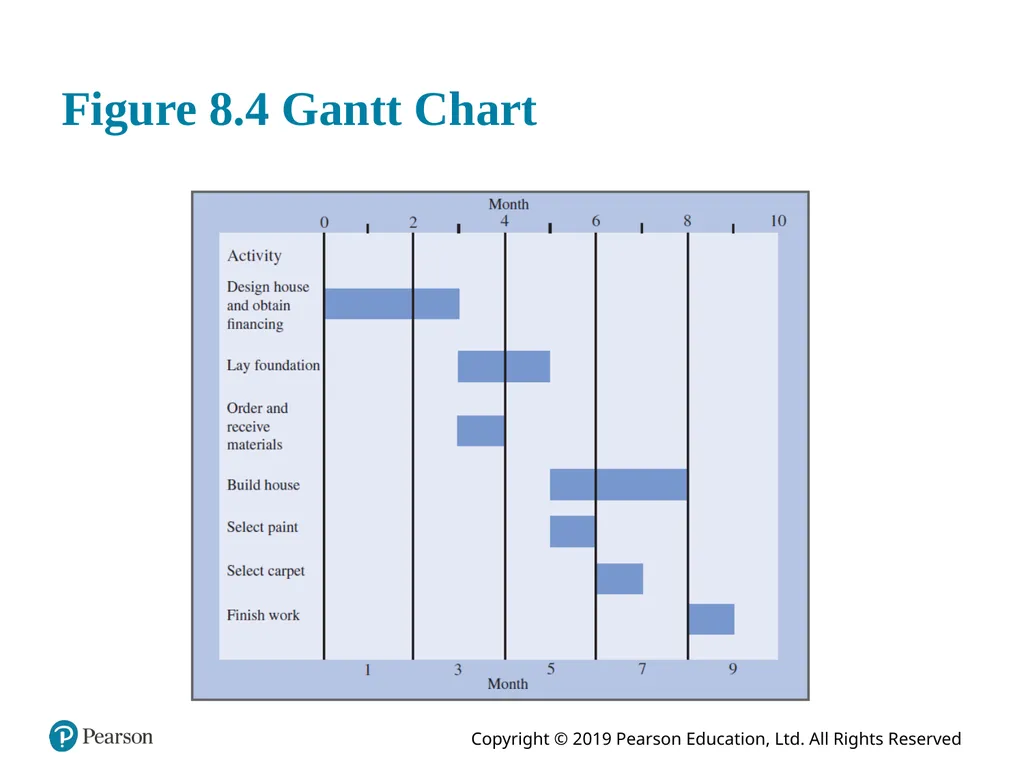
A visual display of project schedule showing activity start and finish times and where extra time is available.
Suitable for projects with few activities and precedence relationships.
Drawback: precedence relationships are not always discernible which limits chart’s use for smaller projects<br>
slide19. Figure 8.4 Gantt Chart<br>
slide20. Project Control Process of ensuring progress toward successful completion.
Monitoring project to minimize deviations from project plan and schedule.
Corrective actions necessary if deviations occur.
Key elements of project control
Time management
Cost management
Performance management
Earned value analysis (E V A)<br>
slide21. Learning Objective 8.2 C P M/P E R T<br>
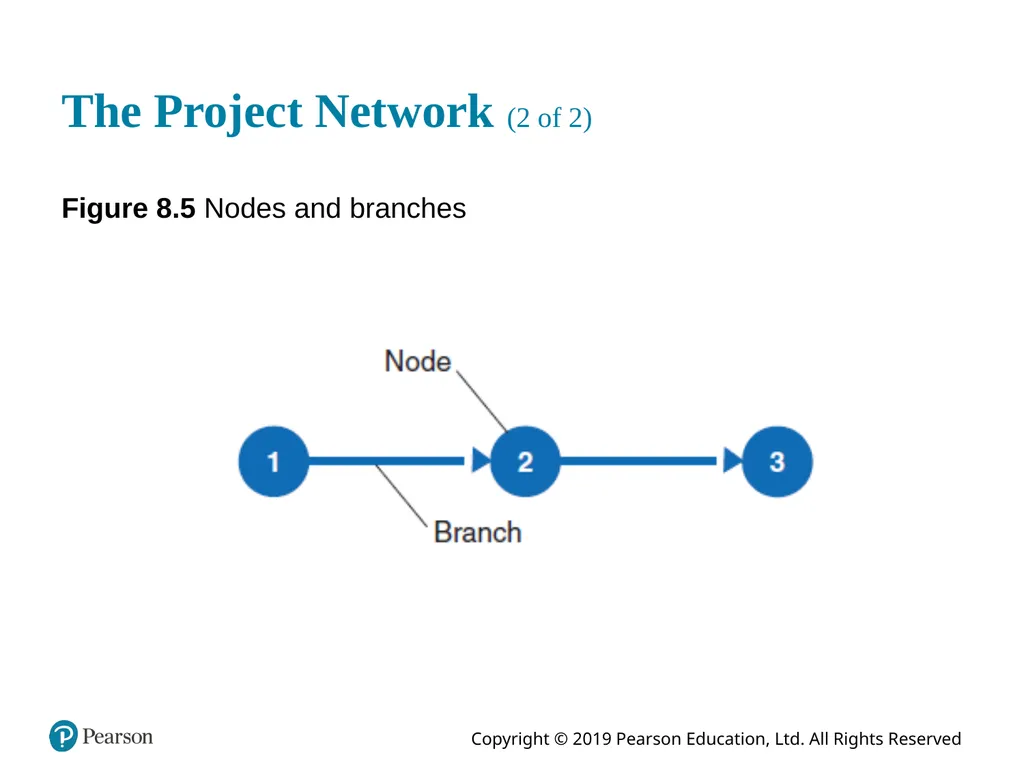
slide22. The Project Network (1 of 2) Activity-on-Arc (A O A) Network
A branch reflects an activity of a project.
A node represents the beginning and end of activities, referred to as events.
Branches in the network indicate precedence relationships.
When an activity is completed at a node, it has been realized.<br>
slide23. The Project Network (2 of 2) Figure 8.5 Nodes and branches<br>
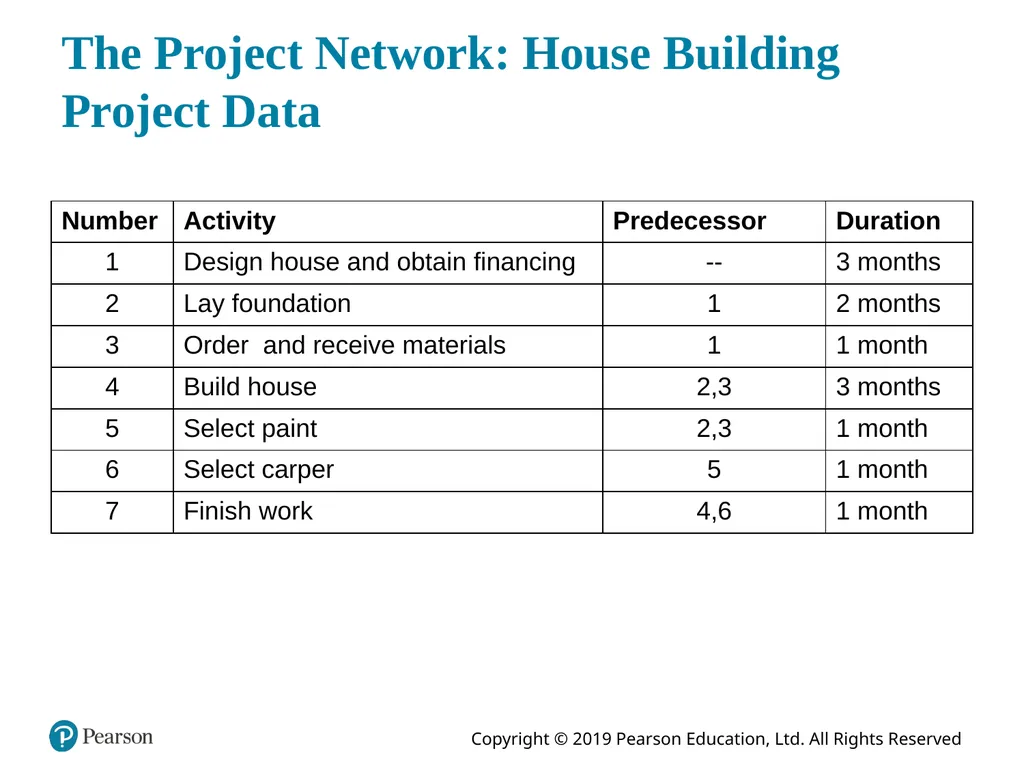
slide24. The Project Network: House Building Project Data<br>
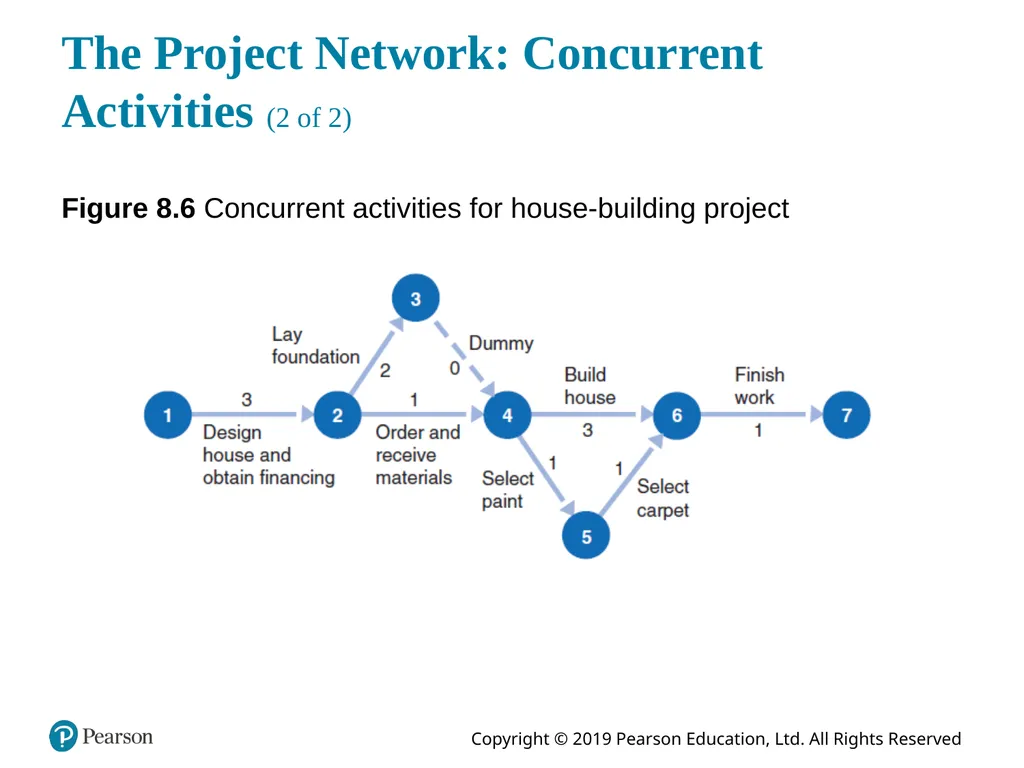
slide25. The Project Network: Concurrent Activities (1 of 2) Activities can occur at the same time (concurrently).
Network aids in planning and scheduling.
Time duration of activities shown on branches.<br>
slide26. The Project Network: Concurrent Activities (2 of 2) Figure 8.6 Concurrent activities for house-building project<br>
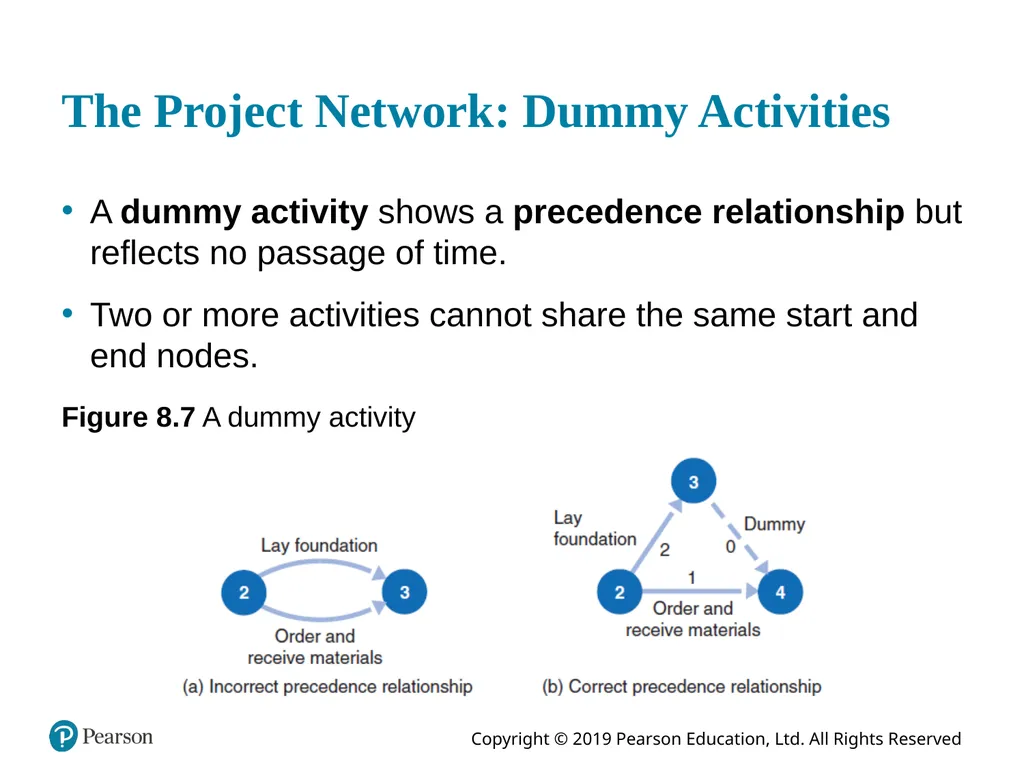
slide27. The Project Network: Dummy Activities A dummy activity shows a precedence relationship but reflects no passage of time.
Two or more activities cannot share the same start and end nodes. Figure 8.7 A dummy activity<br>
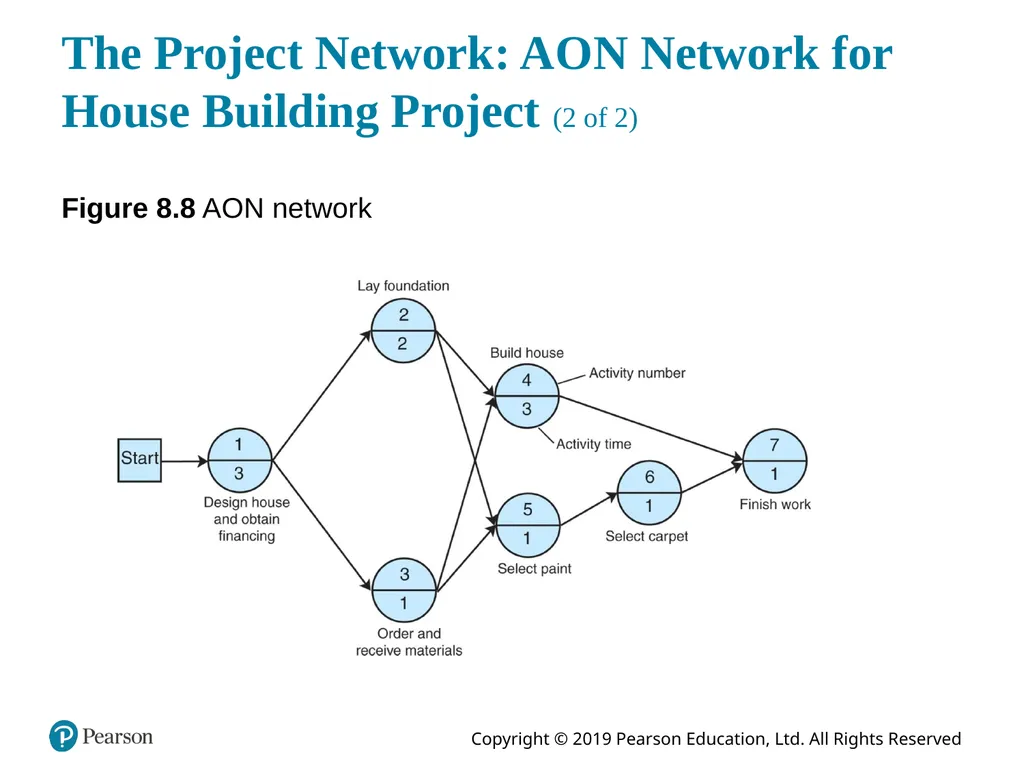
slide28. The Project Network: A O N Network for House Building Project (1 of 2) Activity-on-Node (A O N) Network
A node represents an activity, with its label and time shown on the node
The branches show the precedence relationships
Convention used in Microsoft Project software<br>
slide29. The Project Network: A O N Network for House Building Project (2 of 2) Figure 8.8 A O N network<br>
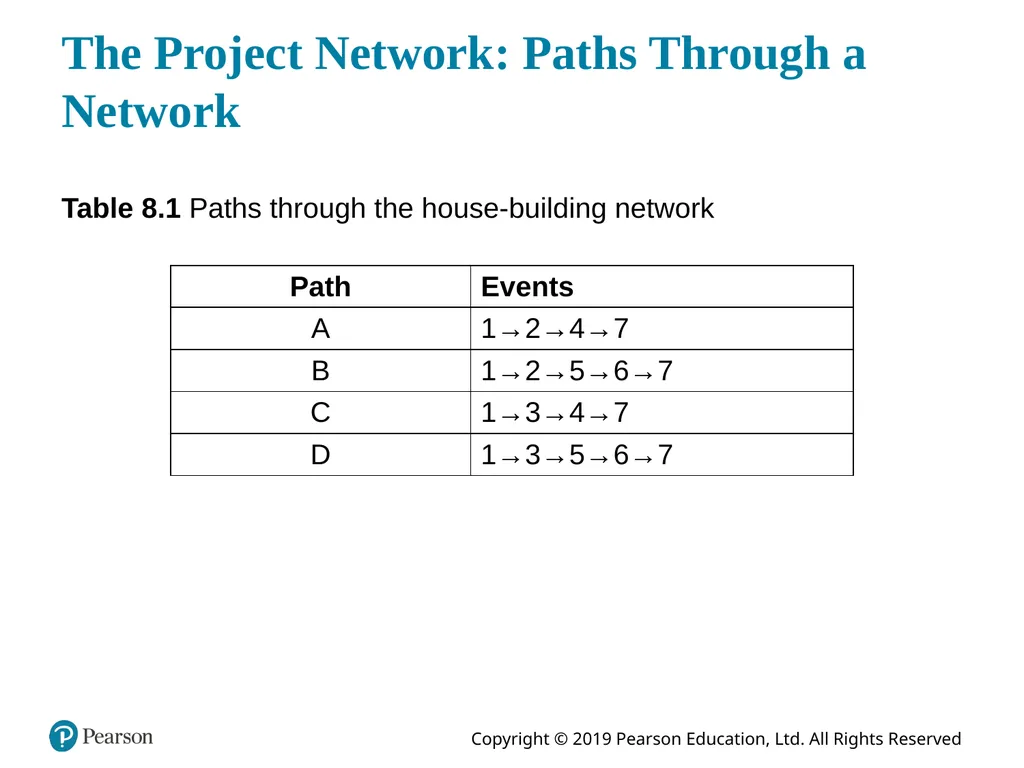
slide30. The Project Network: Paths Through a Network Table 8.1 Paths through the house-building network<br>
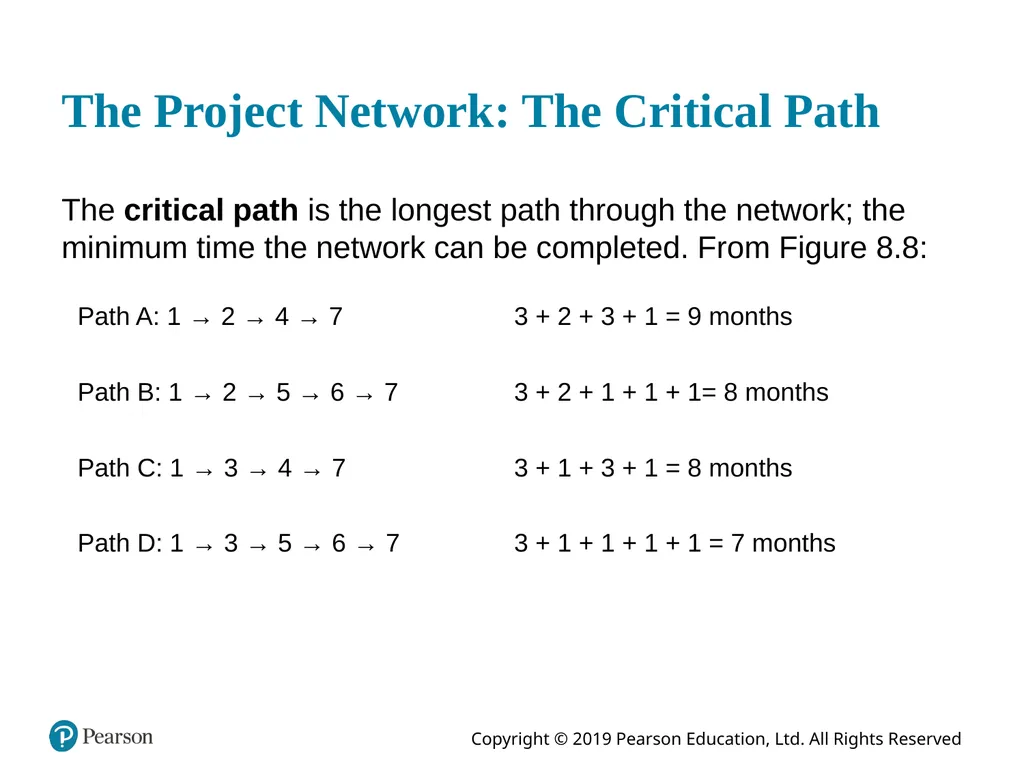
slide31. The Project Network: The Critical Path The critical path is the longest path through the network; the minimum time the network can be completed. From Figure 8.8:<br>
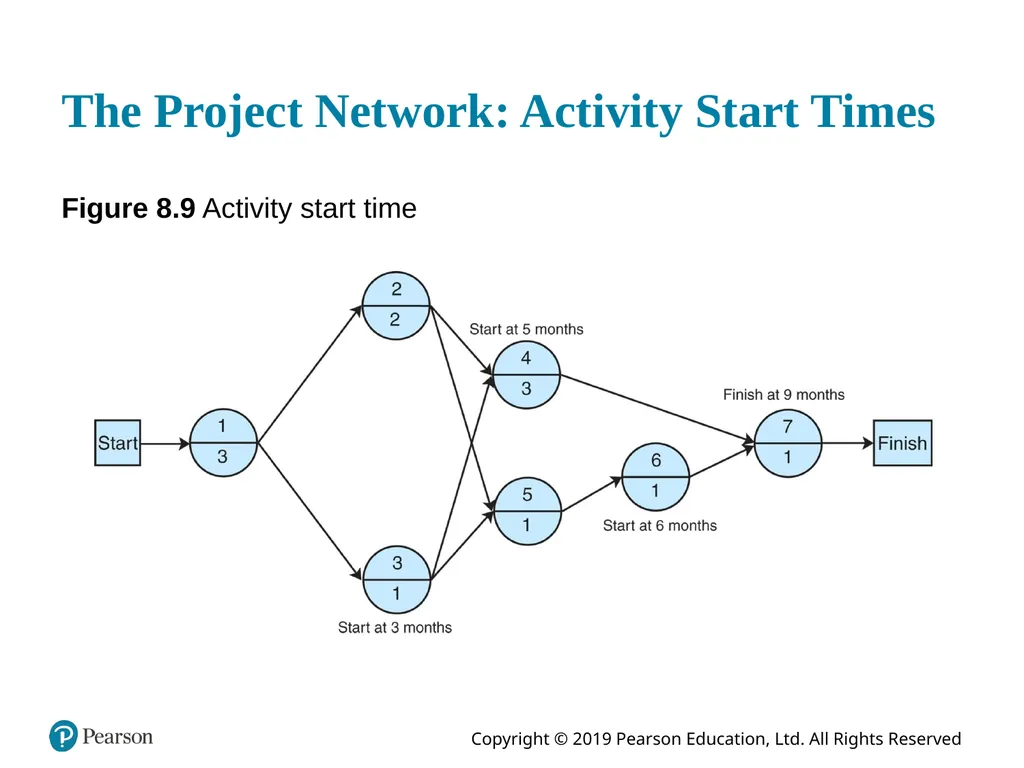
slide32. The Project Network: Activity Start Times Figure 8.9 Activity start time<br>
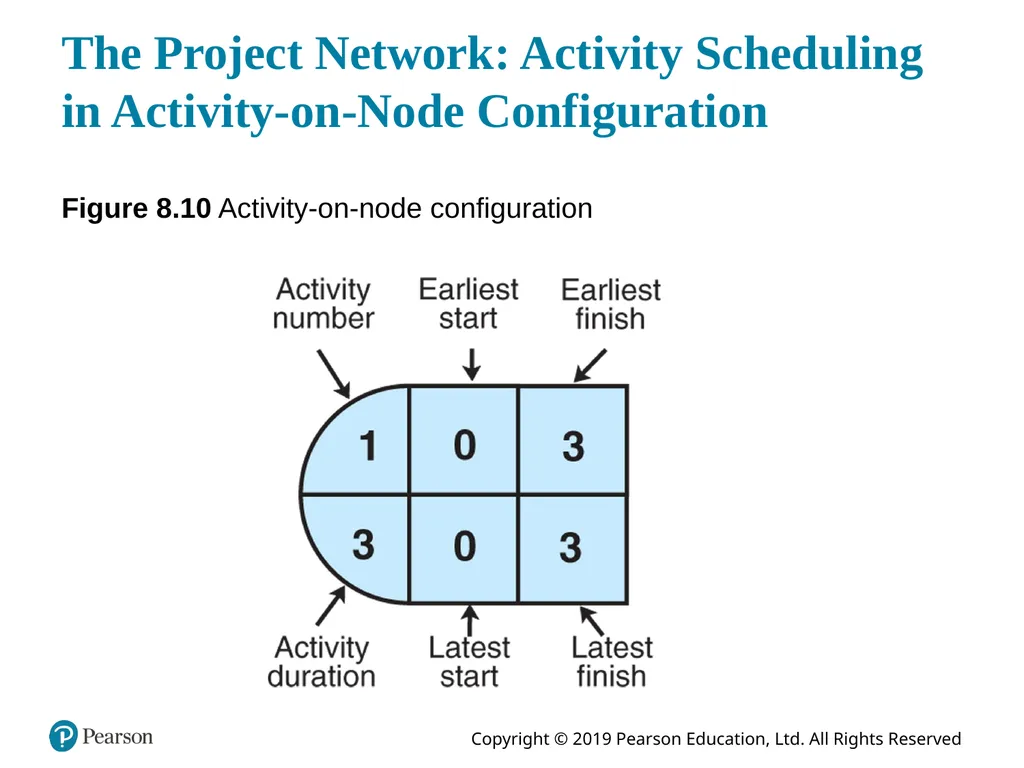
slide33. The Project Network: Activity Scheduling in Activity-on-Node Configuration Figure 8.10 Activity-on-node configuration<br>
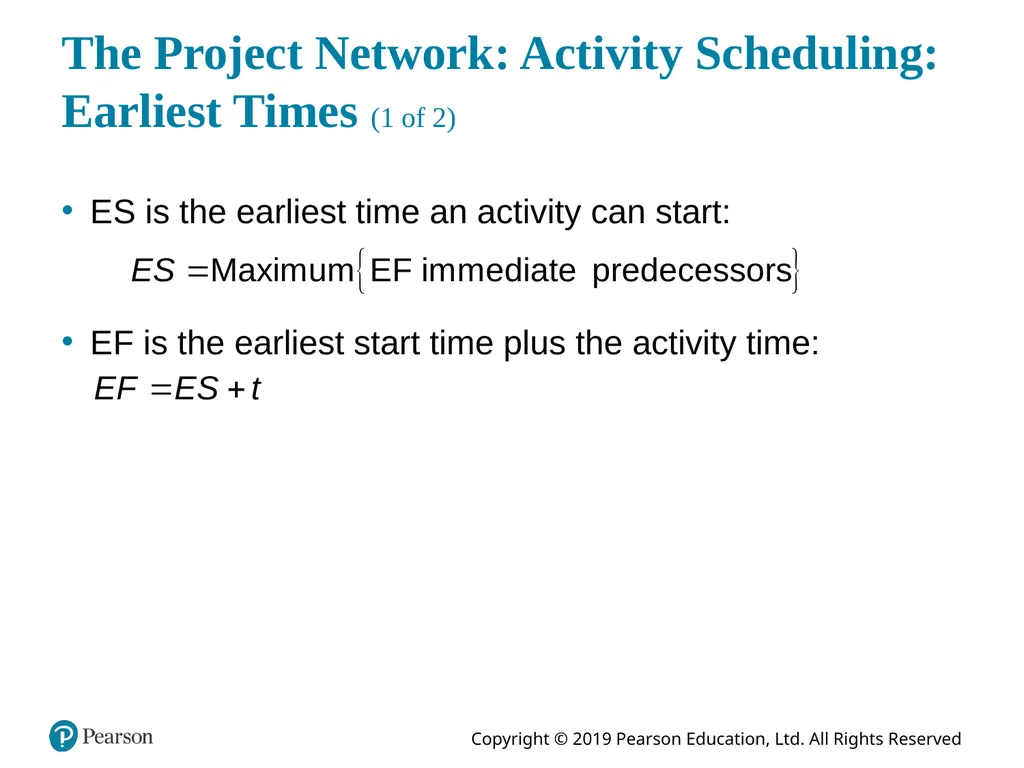
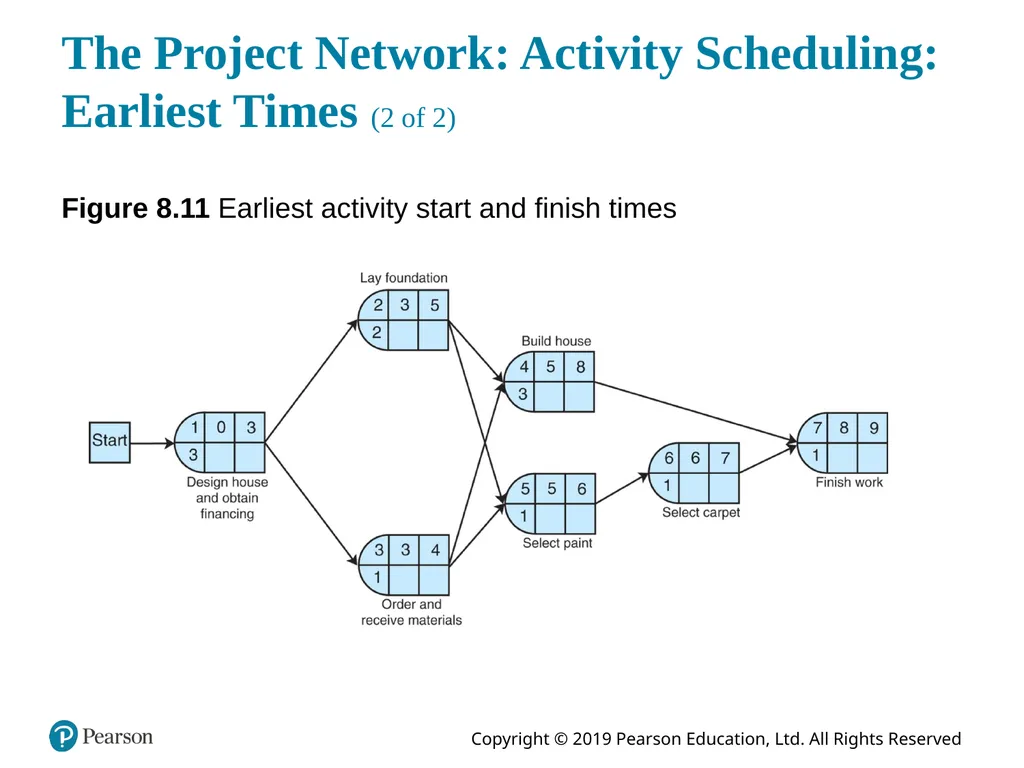
slide34. The Project Network: Activity Scheduling: Earliest Times (1 of 2) E S is the earliest time an activity can start: E F is the earliest start time plus the activity time:<br>
slide35. The Project Network: Activity Scheduling: Earliest Times (2 of 2) Figure 8.11 Earliest activity start and finish times<br>
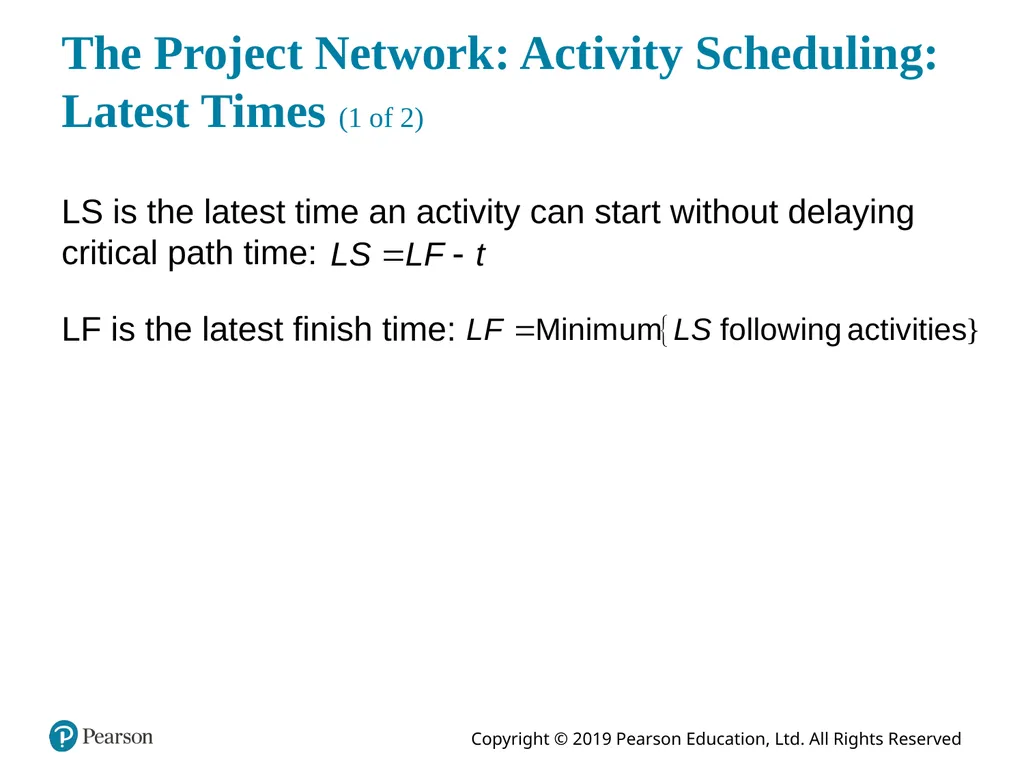
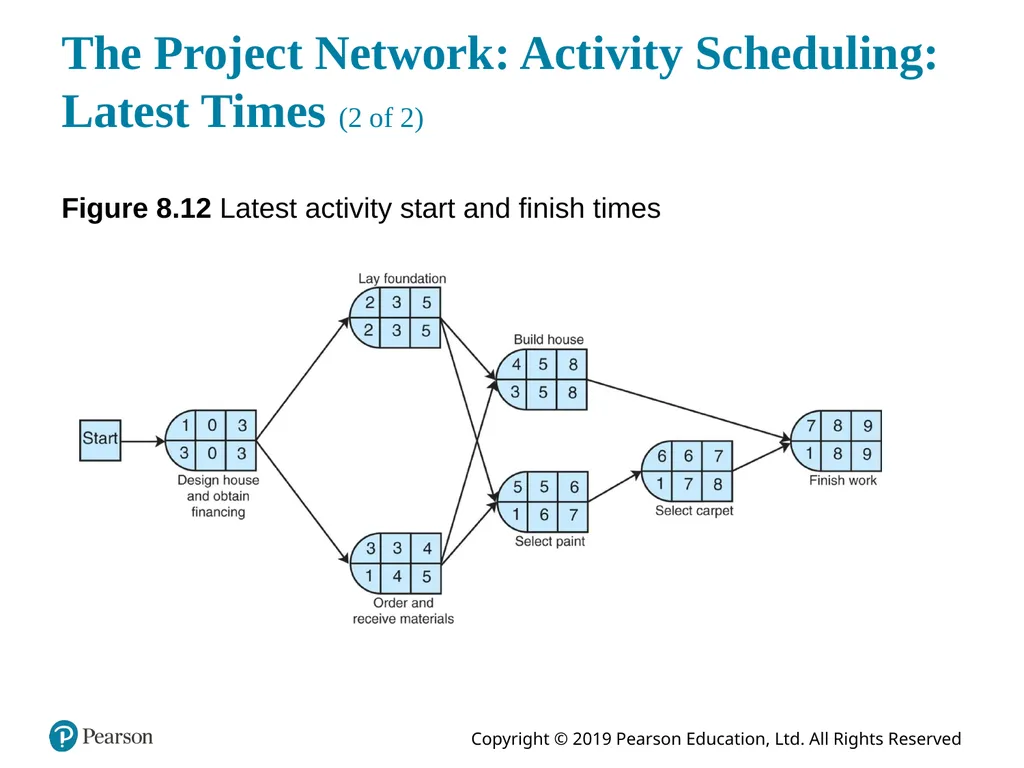
slide36. The Project Network: Activity Scheduling: Latest Times (1 of 2) L S is the latest time an activity can start without delaying critical path time: L F is the latest finish time:<br>
slide37. The Project Network: Activity Scheduling: Latest Times (2 of 2) Figure 8.12 Latest activity start and finish times<br>
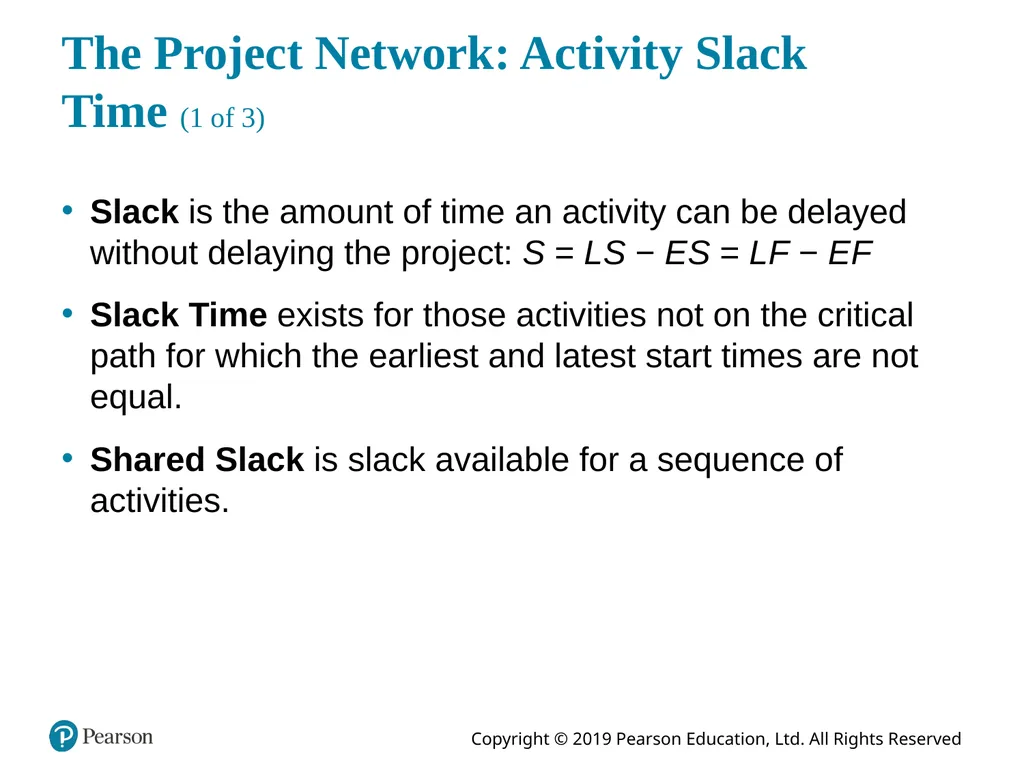
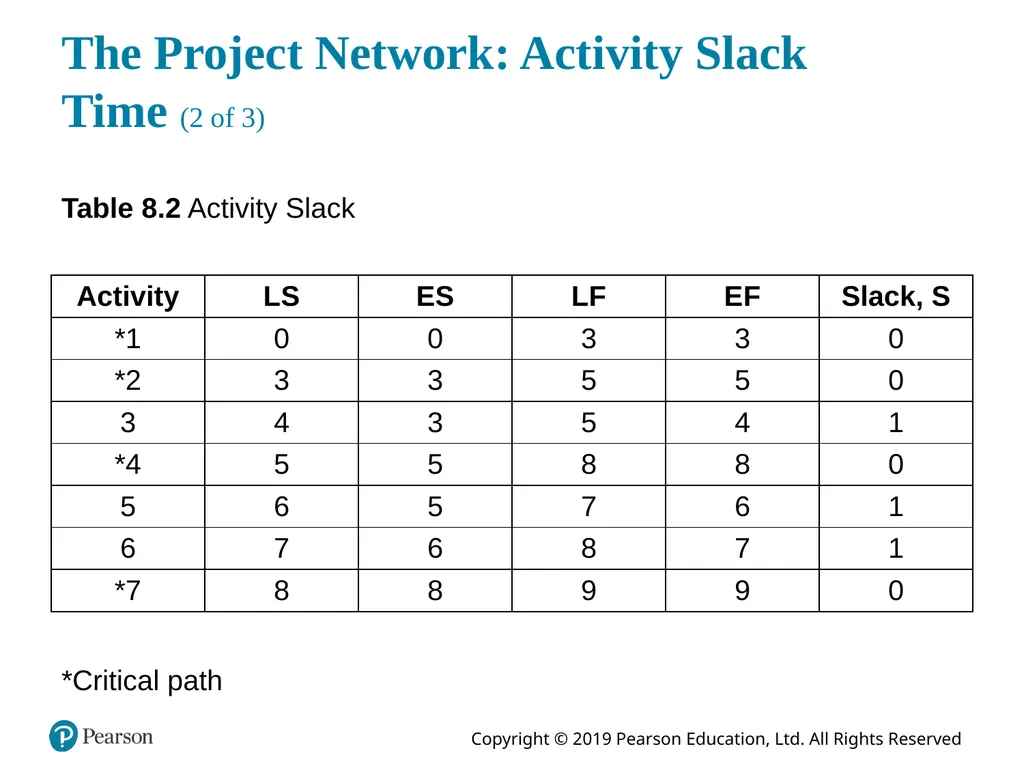
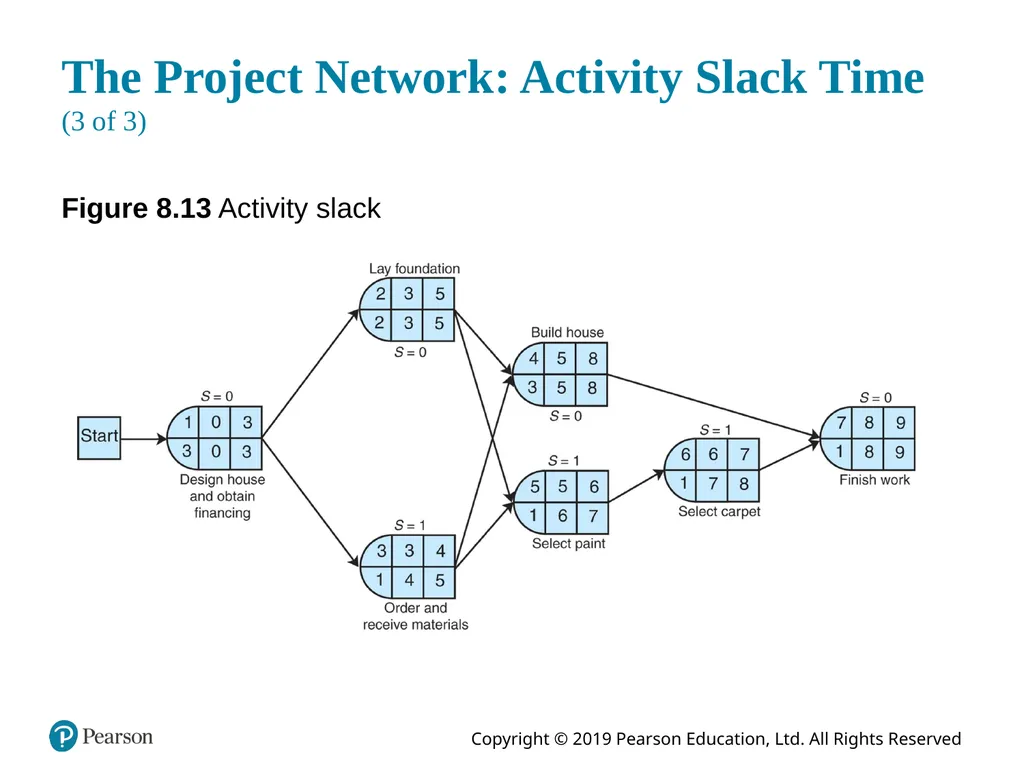
slide38. The Project Network: Activity Slack Time (1 of 3) Slack is the amount of time an activity can be delayed without delaying the project: S = L S − E S = L F − E F
Slack Time exists for those activities not on the critical path for which the earliest and latest start times are not equal.
Shared Slack is slack available for a sequence of activities.<br>
slide39. The Project Network: Activity Slack Time (2 of 3) Table 8.2 Activity Slack *Critical path<br>
slide40. The Project Network: Activity Slack Time (3 of 3) Figure 8.13 Activity slack<br>
slide41. Learning Objective 8.3 Probabilistic Activity Times<br>
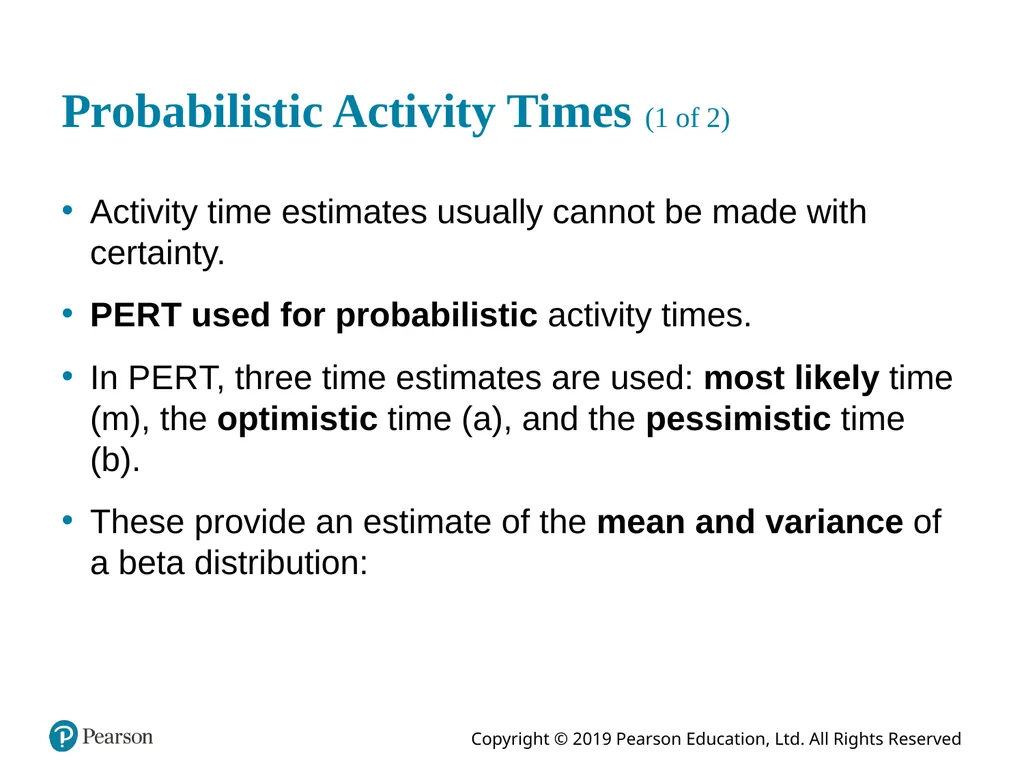
slide42. Probabilistic Activity Times (1 of 2) Activity time estimates usually cannot be made with certainty.
P E R T used for probabilistic activity times.
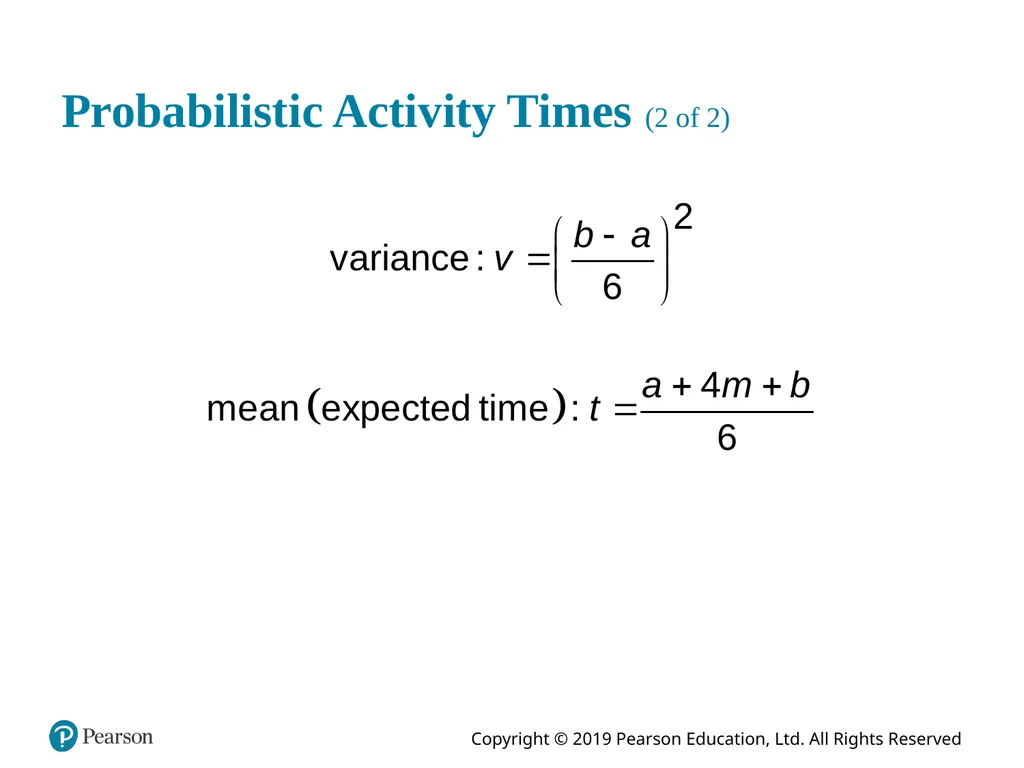
In P E R T, three time estimates are used: most likely time (m), the optimistic time (a), and the pessimistic time (b).
These provide an estimate of the mean and variance of a beta distribution:<br>
slide43. Probabilistic Activity Times (2 of 2)<br>
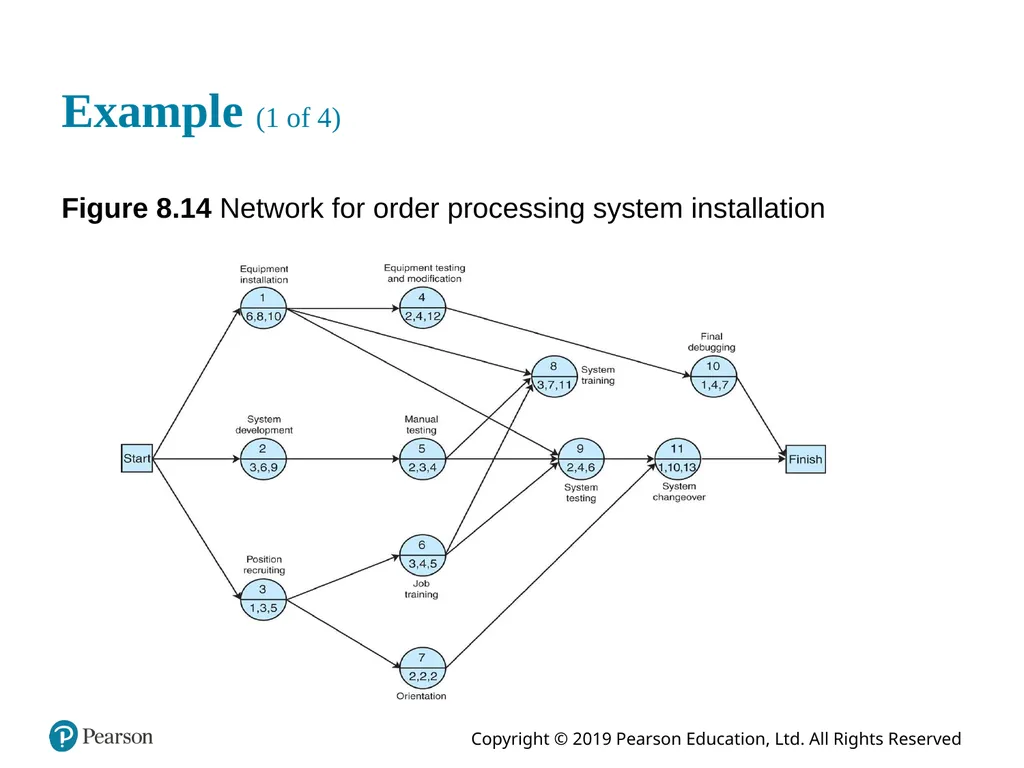
slide44. Example (1 of 4) Figure 8.14 Network for order processing system installation<br>
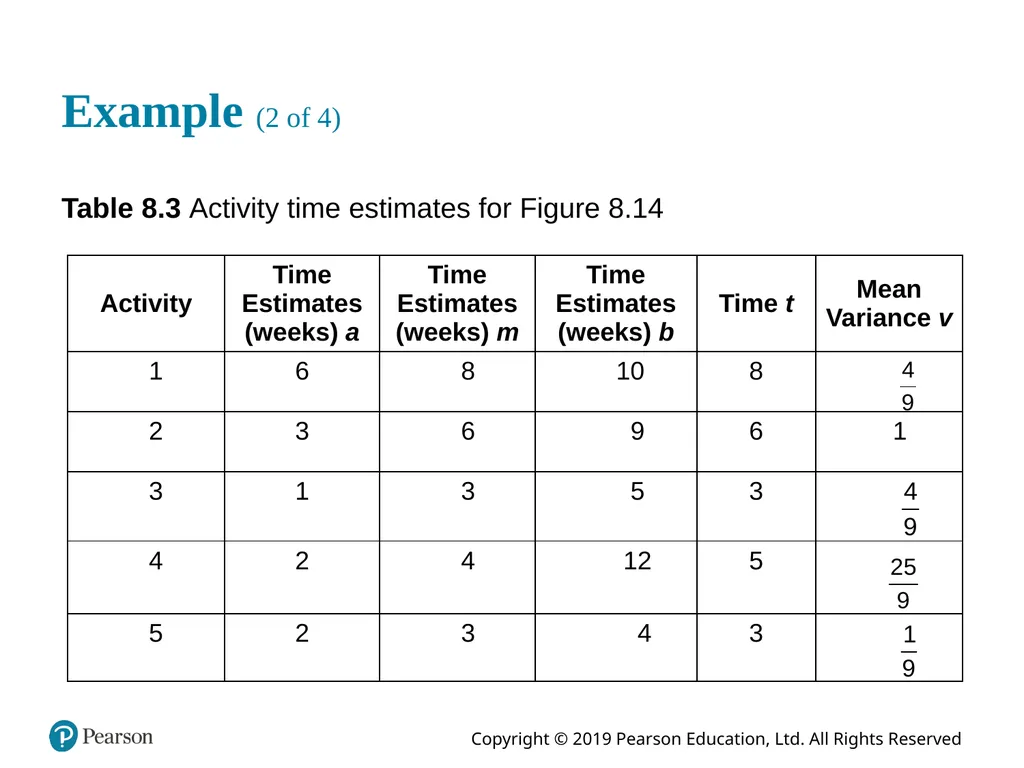
slide45. Example (2 of 4) Table 8.3 Activity time estimates for Figure 8.14<br>
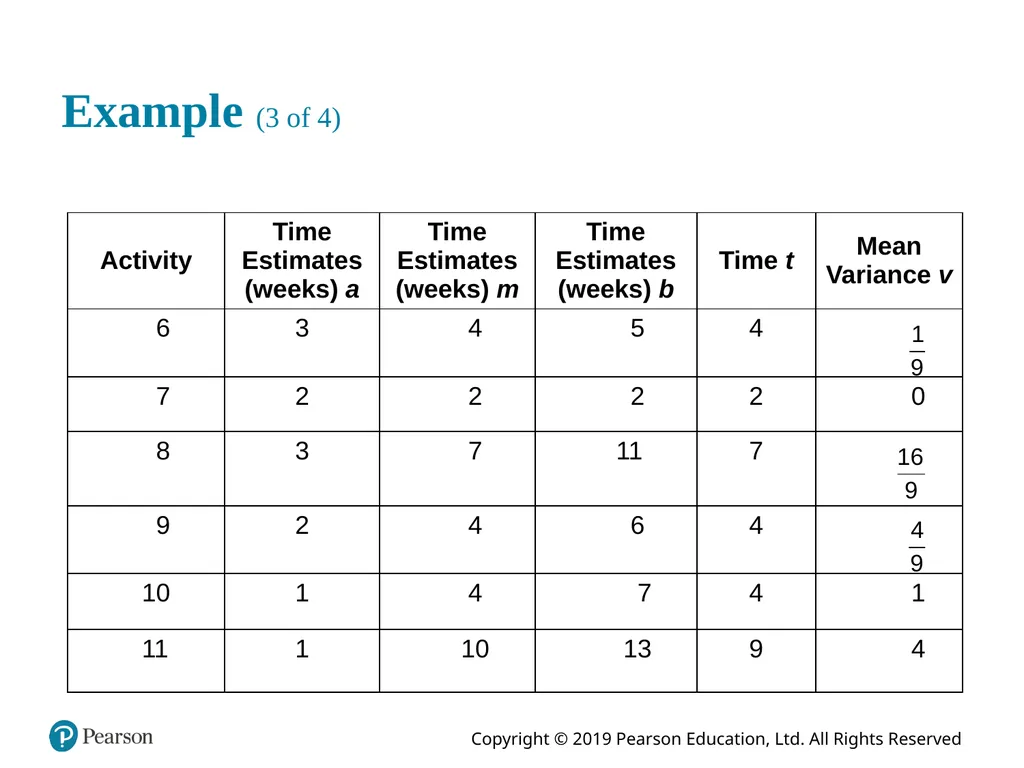
slide46. Example (3 of 4)<br>
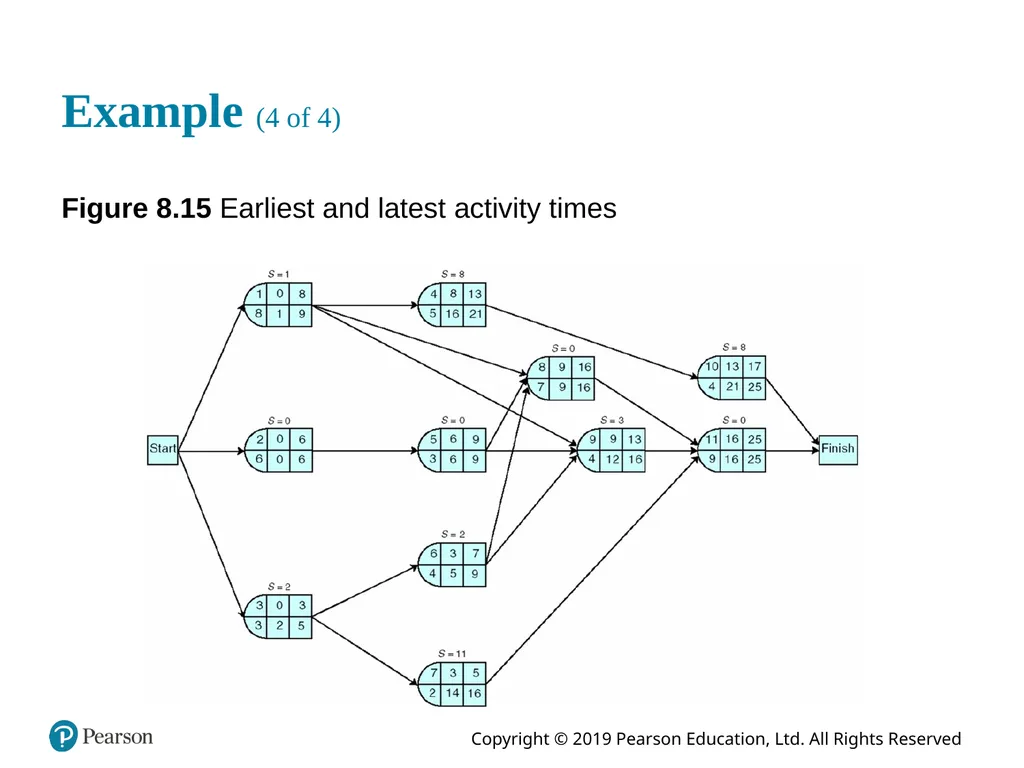
slide47. Example (4 of 4) Figure 8.15 Earliest and latest activity times<br>
slide48. Expected Project Time and Variance (1 of 2) Expected project time is the sum of the expected times of the critical path activities.
Project variance is the sum of the critical path activities’ variances
The expected project time is assumed to be normally distributed (based on central limit theorem).
In example, expected project time (tp) and variance (vp) interpreted as the mean () and variance of a normal distribution:<br>
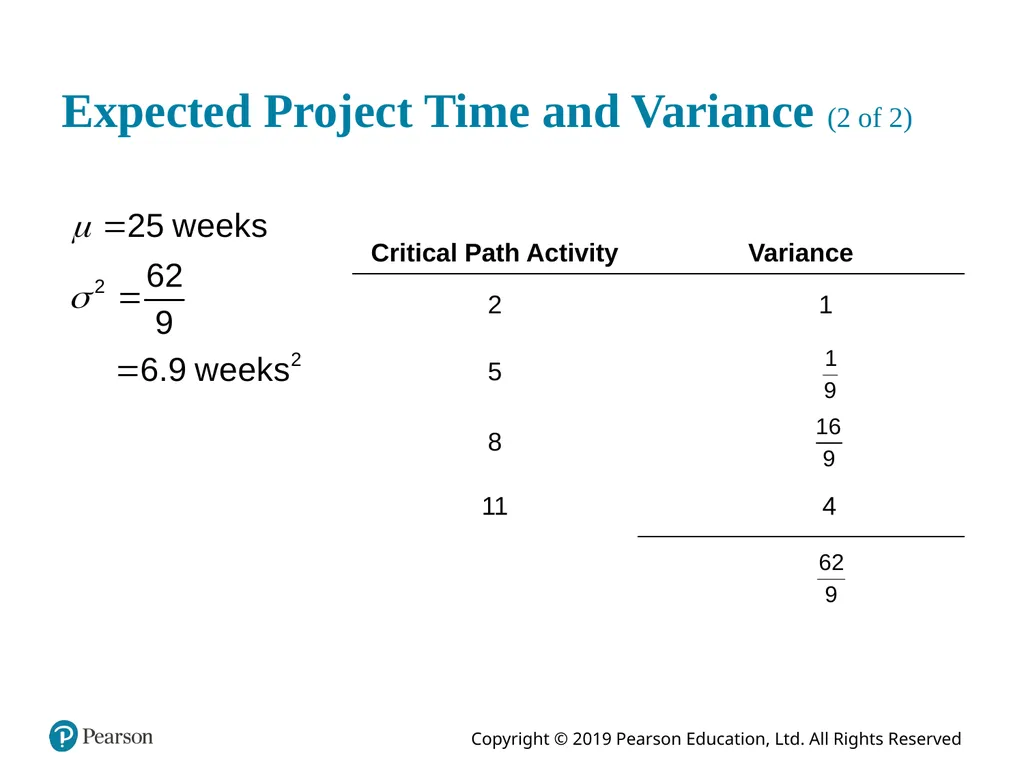
slide49. Expected Project Time and Variance (2 of 2)<br>
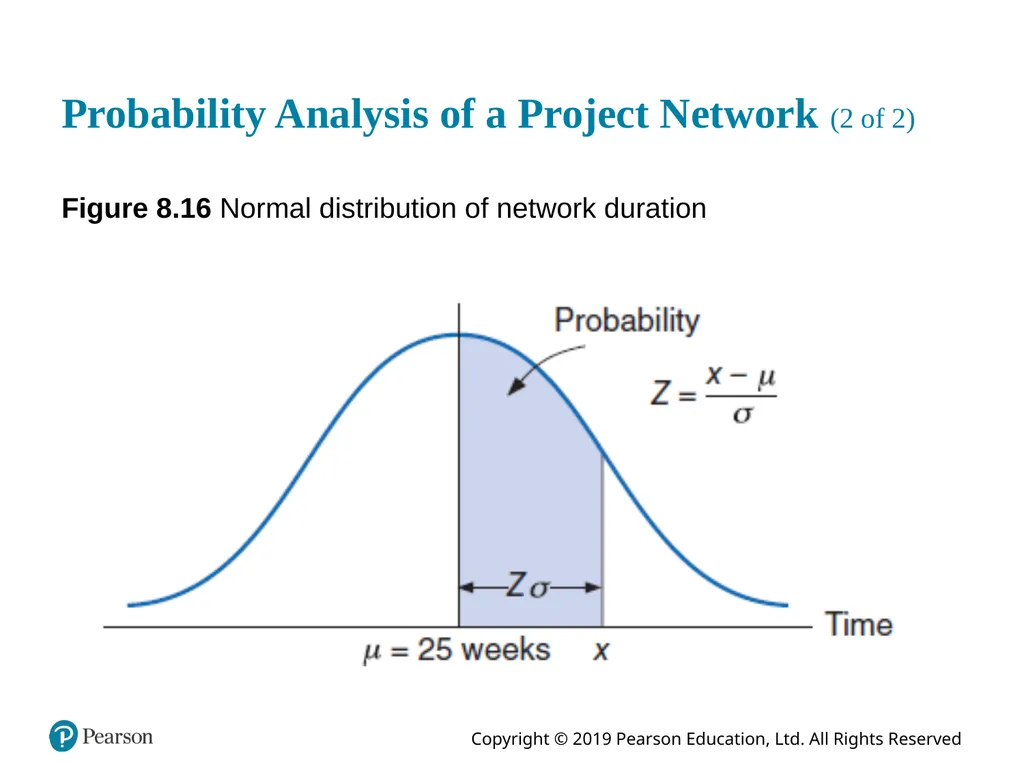
slide50. Probability Analysis of a Project Network (1 of 2) Using the normal distribution, probabilities are determined by computing the number of standard deviations (Z) a value is from the mean.
The Z value is used to find the corresponding probability in Table A.1, Appendix A.<br>
slide51. Probability Analysis of a Project Network (2 of 2) Figure 8.16 Normal distribution of network duration<br>
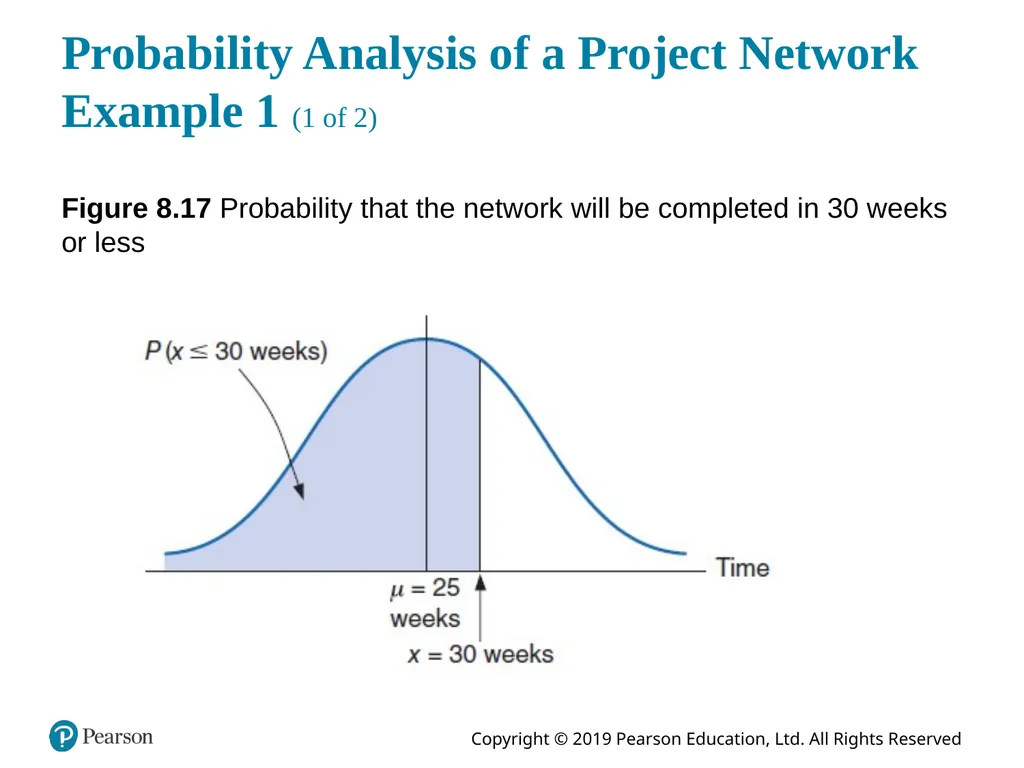
slide52. Probability Analysis of a Project Network Example 1 (1 of 2) Figure 8.17 Probability that the network will be completed in 30 weeks or less<br>
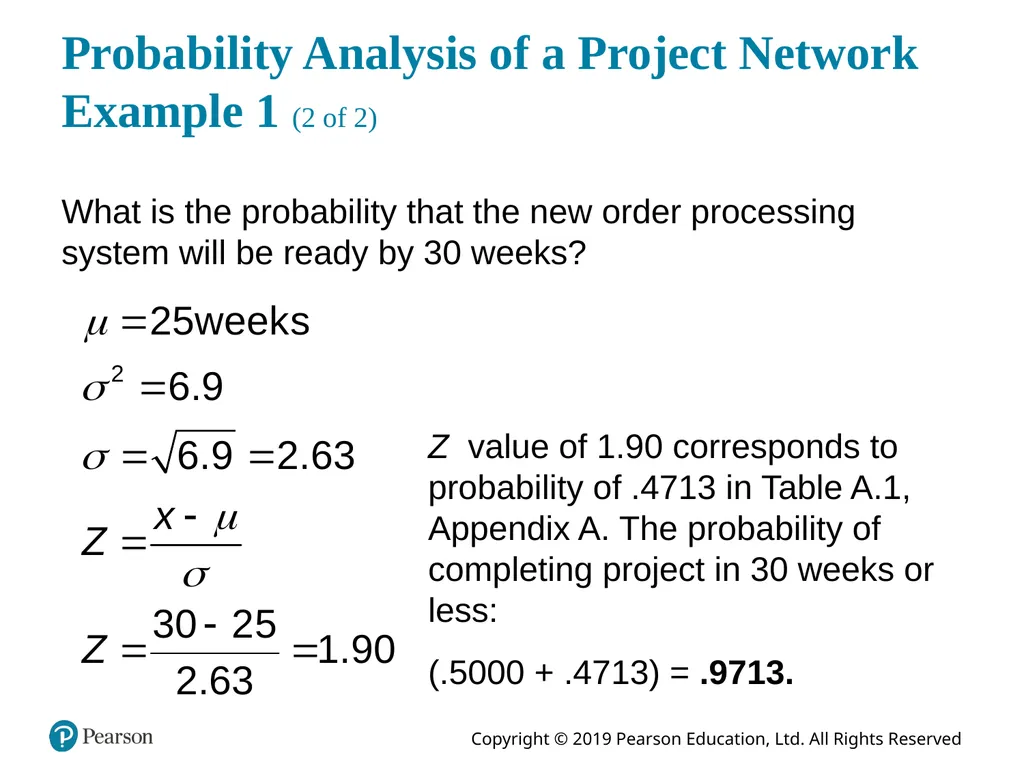
slide53. Probability Analysis of a Project Network Example 1 (2 of 2) What is the probability that the new order processing system will be ready by 30 weeks? Z value of 1.90 corresponds to probability of .4713 in Table A.1, Appendix A. The probability of completing project in 30 weeks or less:
(.5000 + .4713) = .9713.<br>
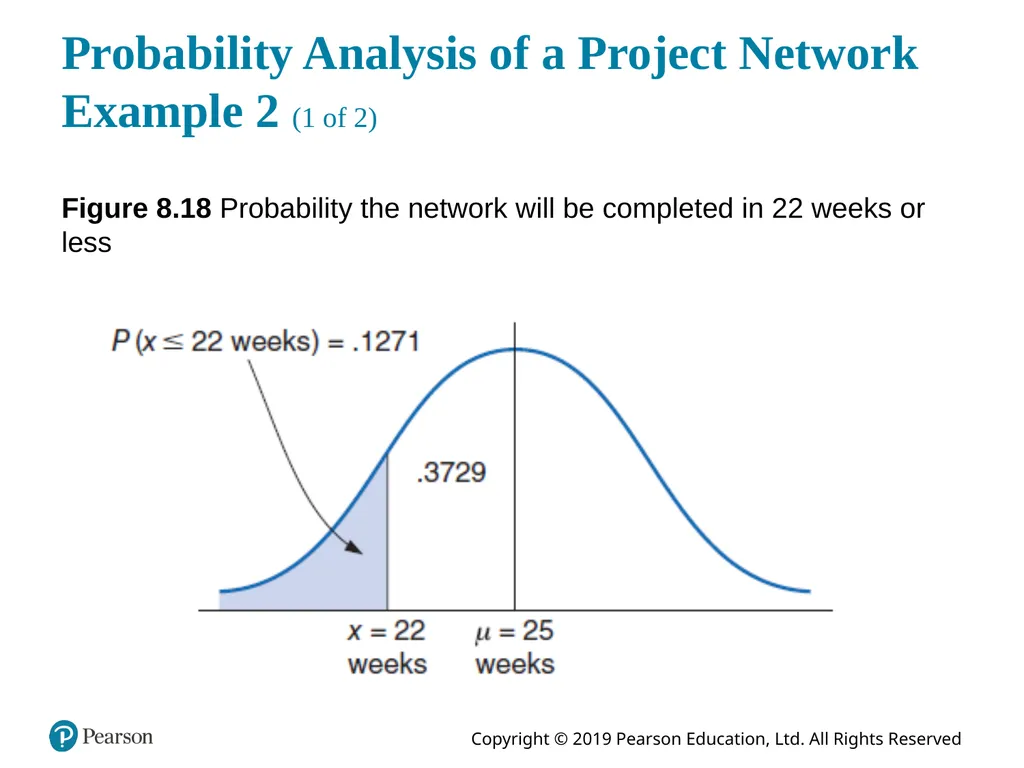
slide54. Probability Analysis of a Project Network Example 2 (1 of 2) Figure 8.18 Probability the network will be completed in 22 weeks or less<br>
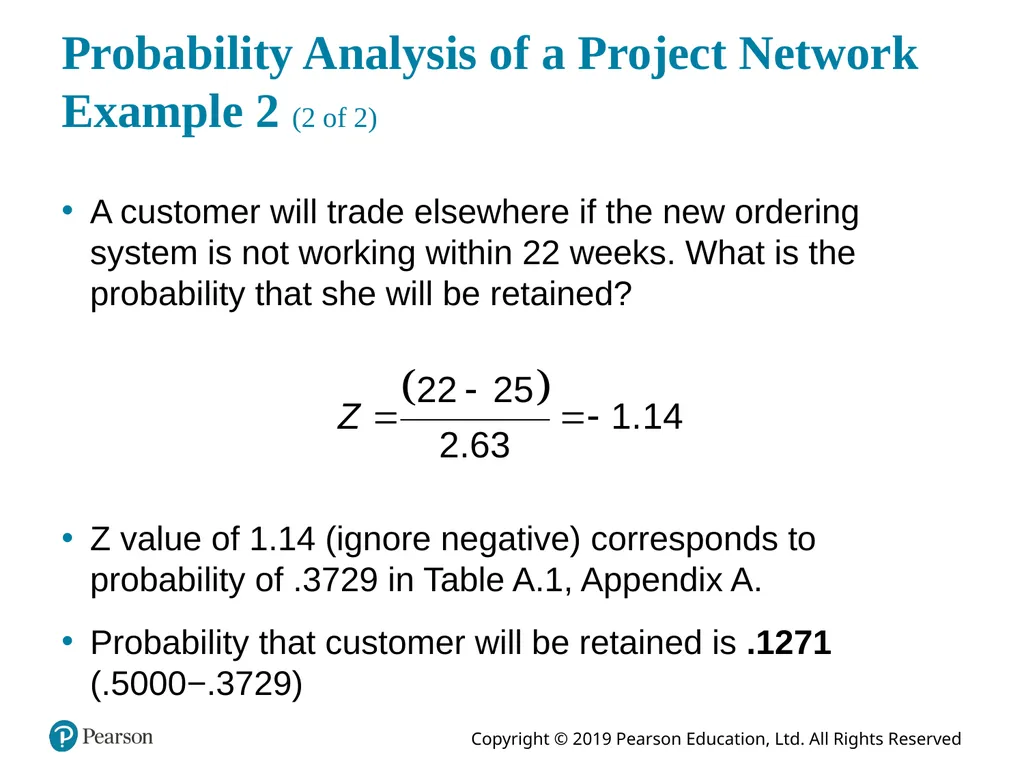
slide55. Probability Analysis of a Project Network Example 2 (2 of 2) A customer will trade elsewhere if the new ordering system is not working within 22 weeks. What is the probability that she will be retained? Z value of 1.14 (ignore negative) corresponds to probability of .3729 in Table A.1, Appendix A.
Probability that customer will be retained is .1271 (.5000−.3729)<br>
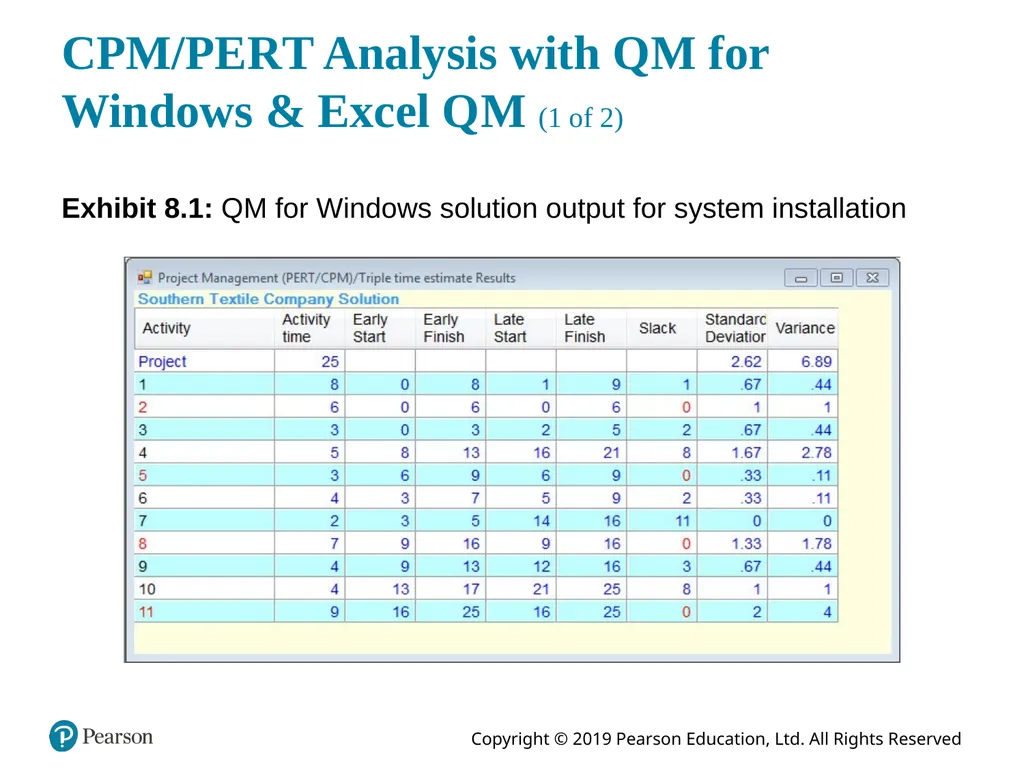
slide56. C P M/P E R T Analysis with Q M for Windows & Excel Q M (1 of 2) Exhibit 8.1: Q M for Windows solution output for system installation<br>
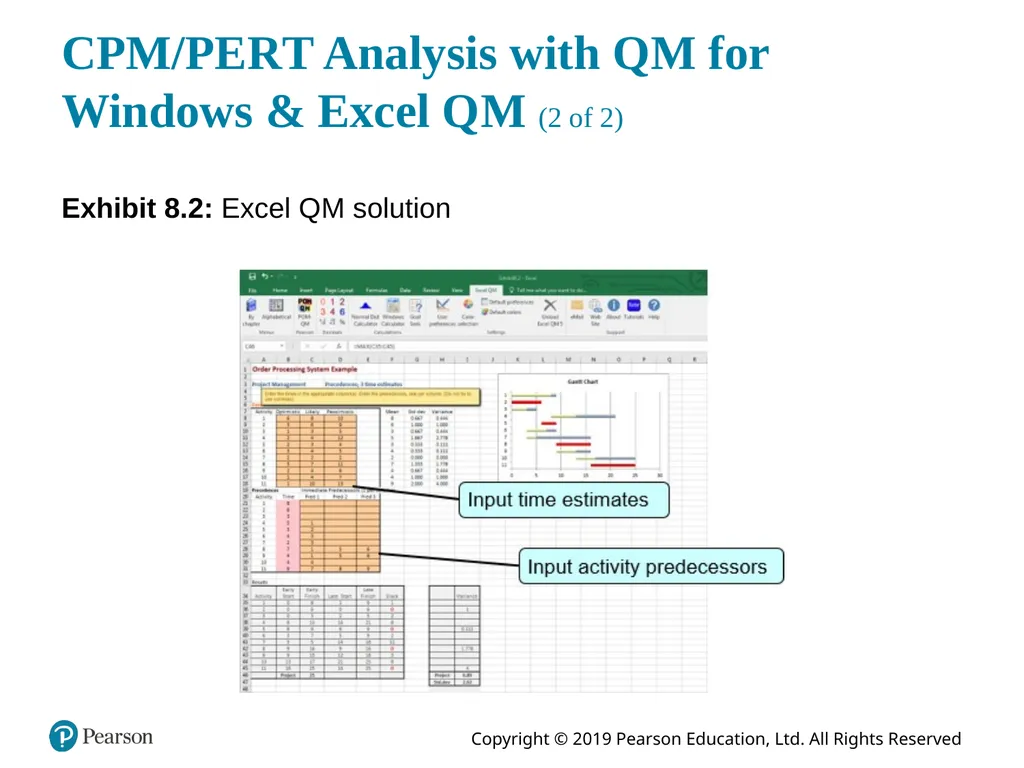
slide57. C P M/P E R T Analysis with Q M for Windows & Excel Q M (2 of 2) Exhibit 8.2: Excel Q M solution<br>
slide58. Learning Objective 8.4 Microsoft Project<br>
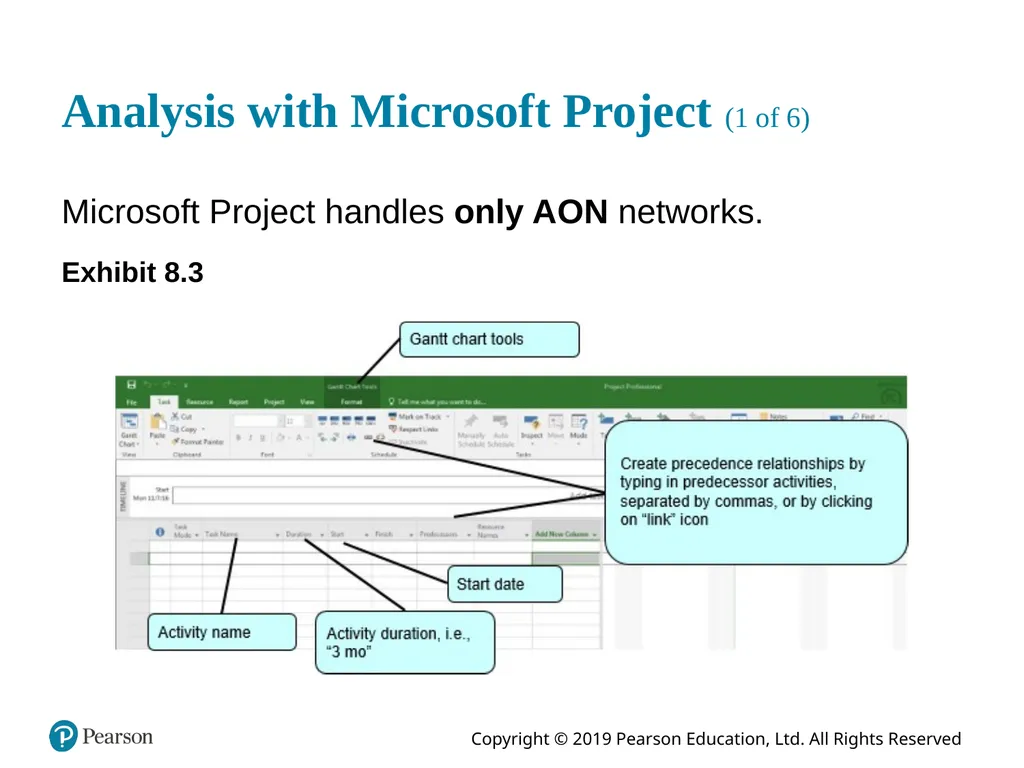
slide59. Analysis with Microsoft Project (1 of 6) Microsoft Project handles only A O N networks. Exhibit 8.3<br>
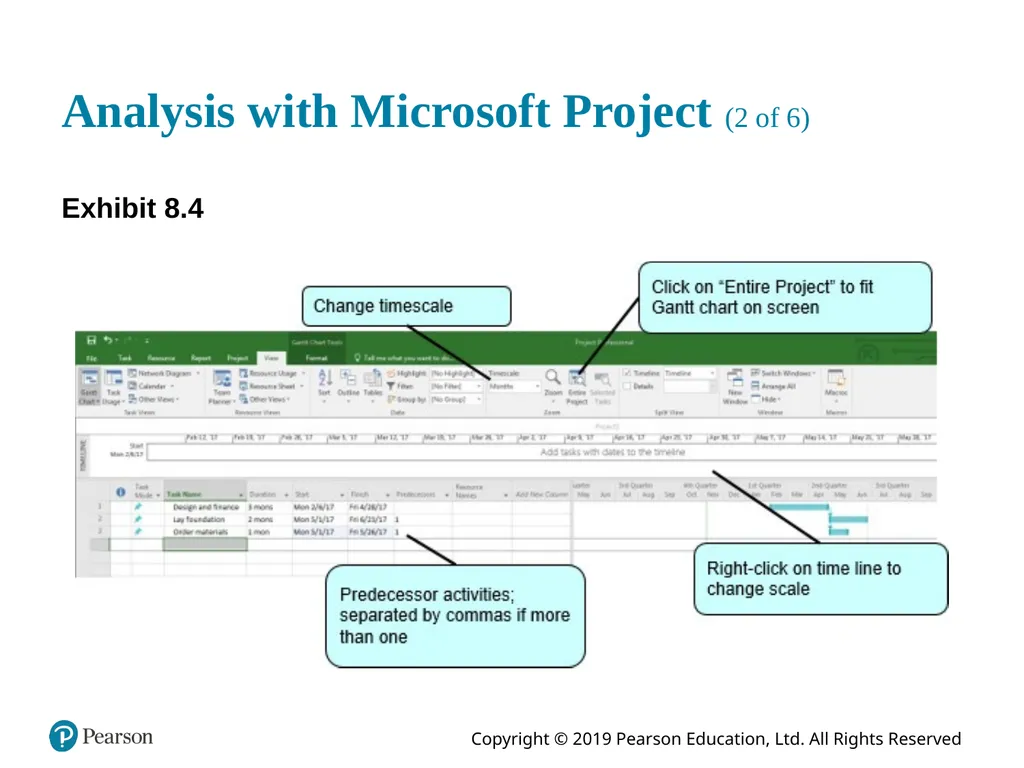
slide60. Analysis with Microsoft Project (2 of 6) Exhibit 8.4<br>
slide61. Analysis with Microsoft Project (3 of 6) Exhibit 8.5<br>
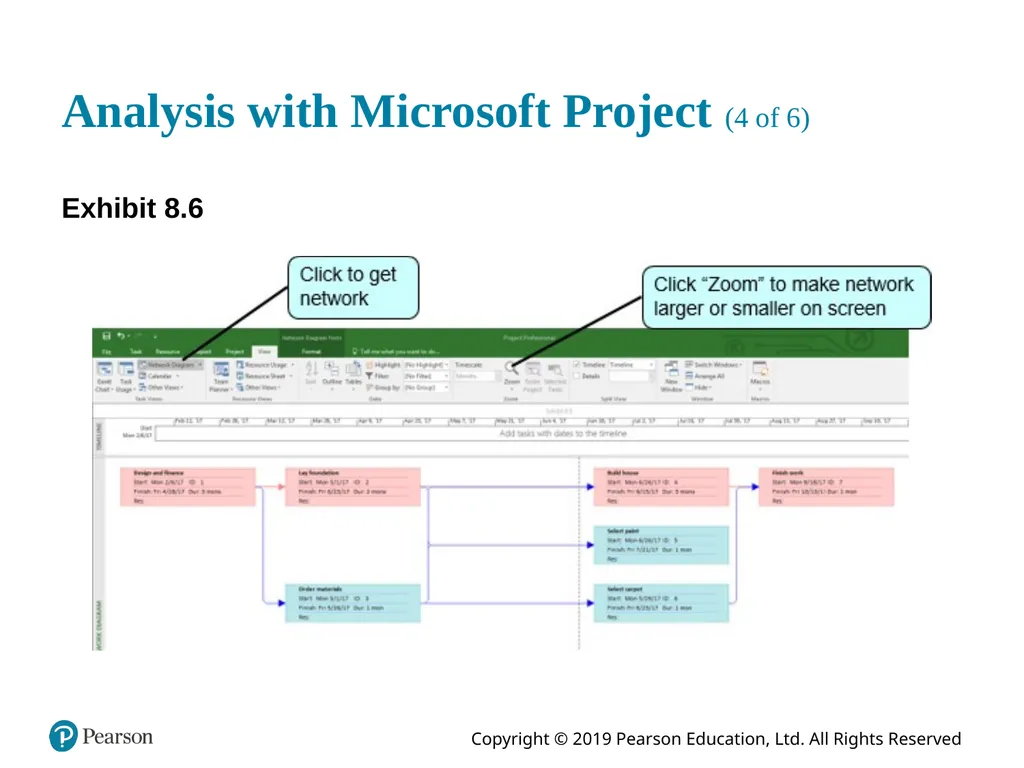
slide62. Analysis with Microsoft Project (4 of 6) Exhibit 8.6<br>
slide63. Analysis with Microsoft Project (5 of 6) Exhibit 8.7<br>
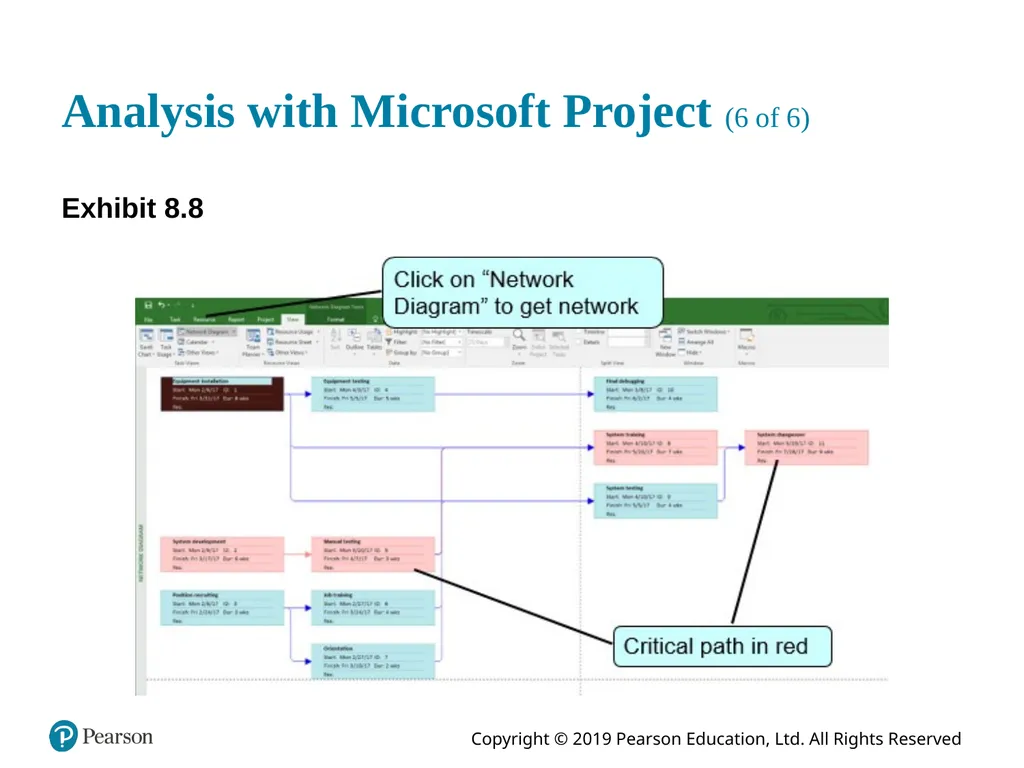
slide64. Analysis with Microsoft Project (6 of 6) Exhibit 8.8<br>
slide65. Learning Objective 8.5 Project Crashing and Time-Cost Trade-Off<br>
slide66. Project Crashing and Time-Cost Trade-Off Overview Project duration can be reduced by assigning more resources to project activities.
However, doing this increases project cost.
Decision is based on analysis of trade-off between time and cost.
Project crashing is a method for shortening project duration by reducing one or more critical activities to a time less than normal activity time.<br>
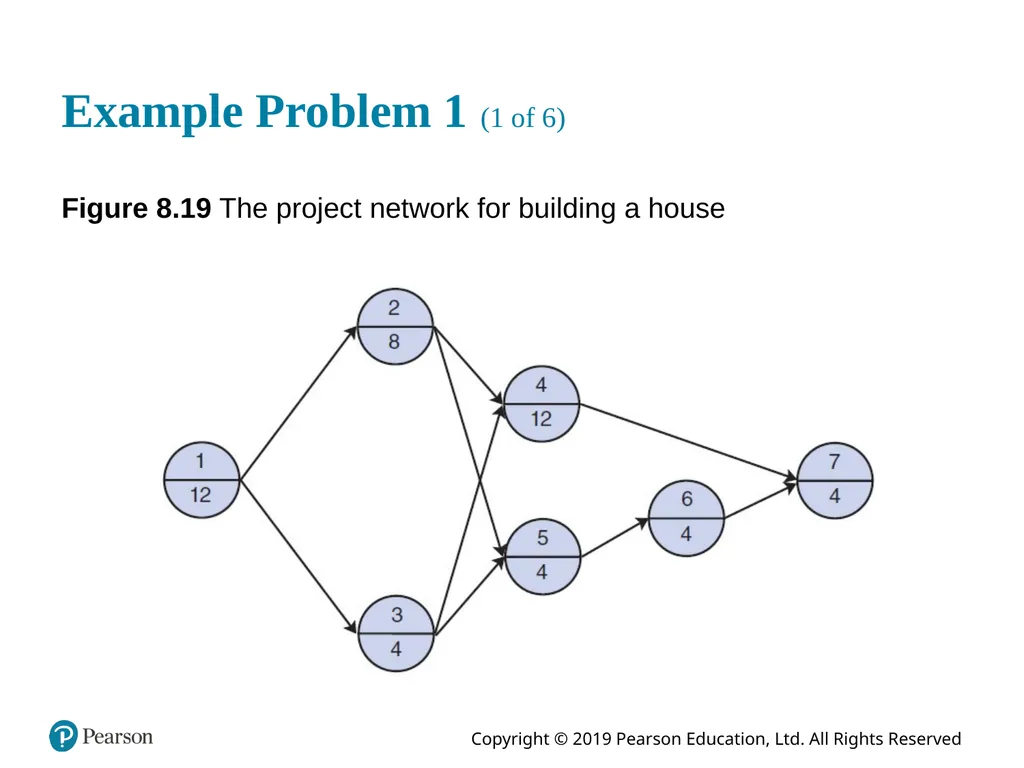
slide67. Example Problem 1 (1 of 6) Figure 8.19 The project network for building a house<br>
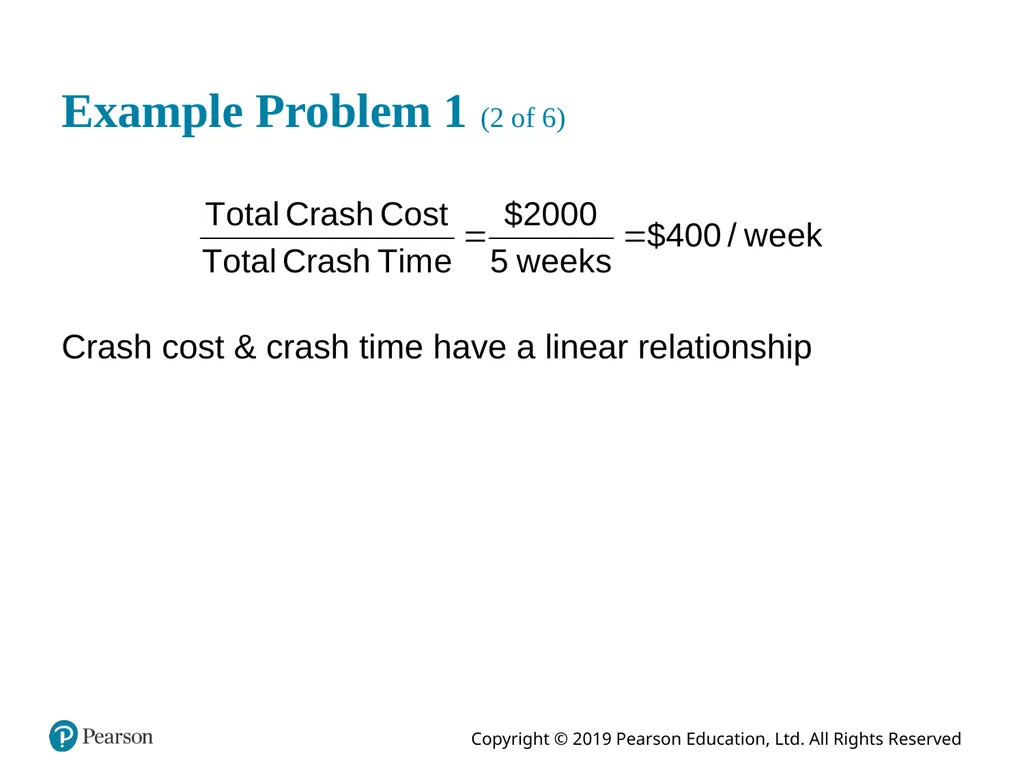
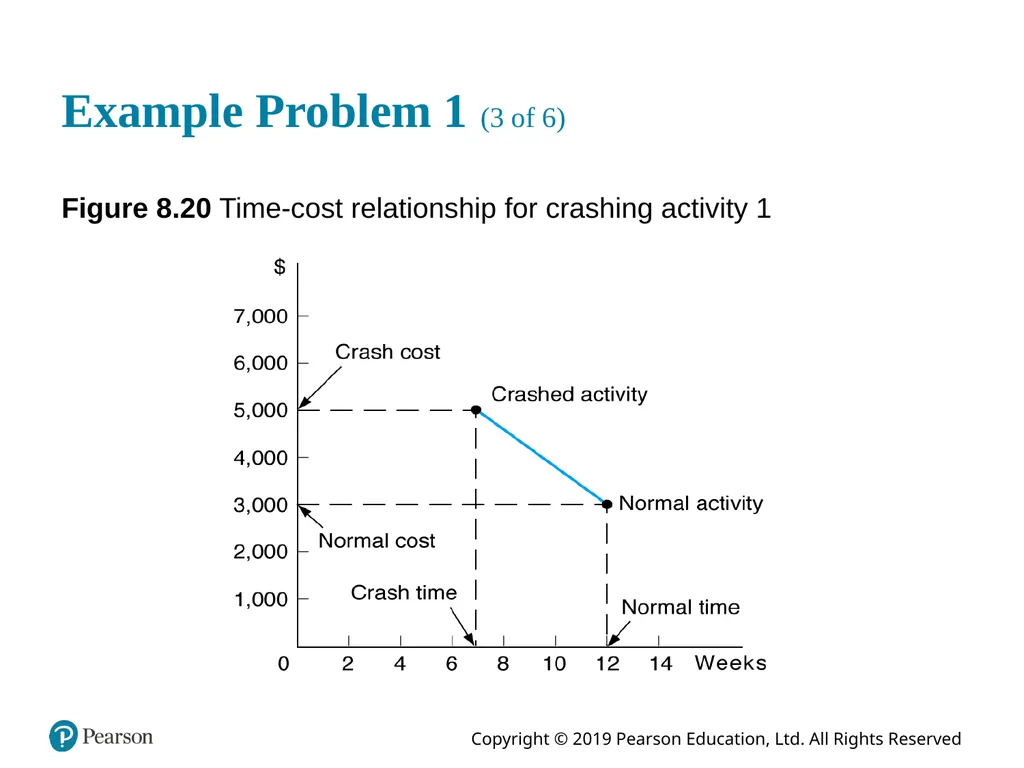
slide68. Example Problem 1 (2 of 6) Crash cost & crash time have a linear relationship<br>
slide69. Example Problem 1 (3 of 6) Figure 8.20 Time-cost relationship for crashing activity 1<br>
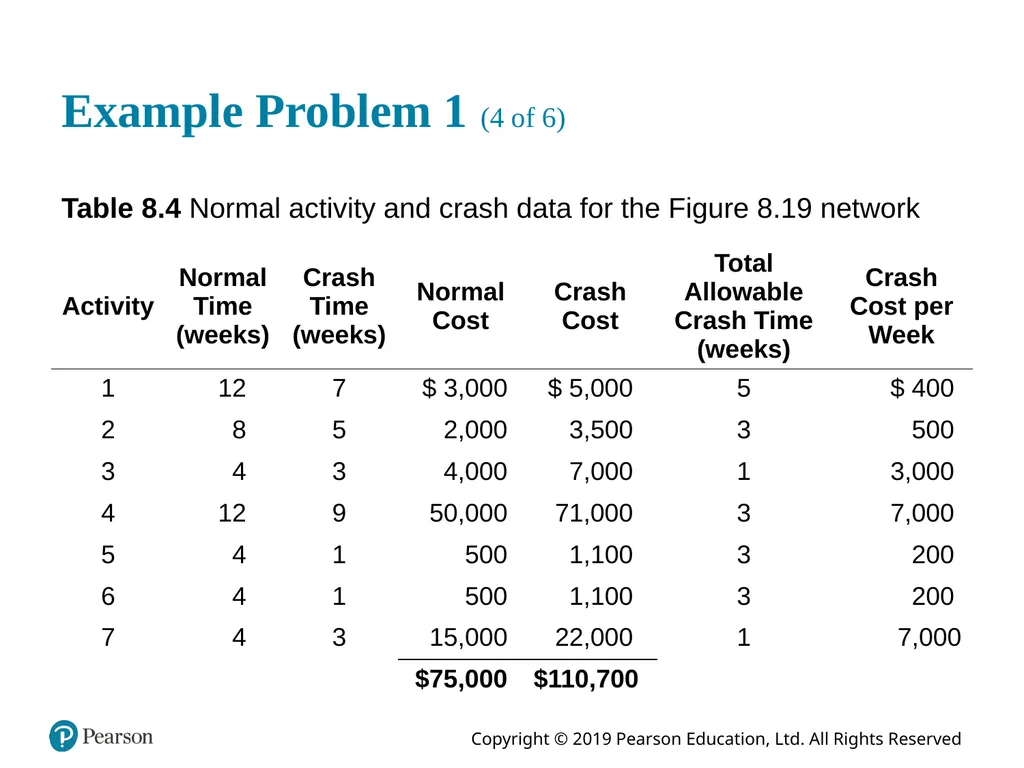
slide70. Example Problem 1 (4 of 6) Table 8.4 Normal activity and crash data for the Figure 8.19 network<br>
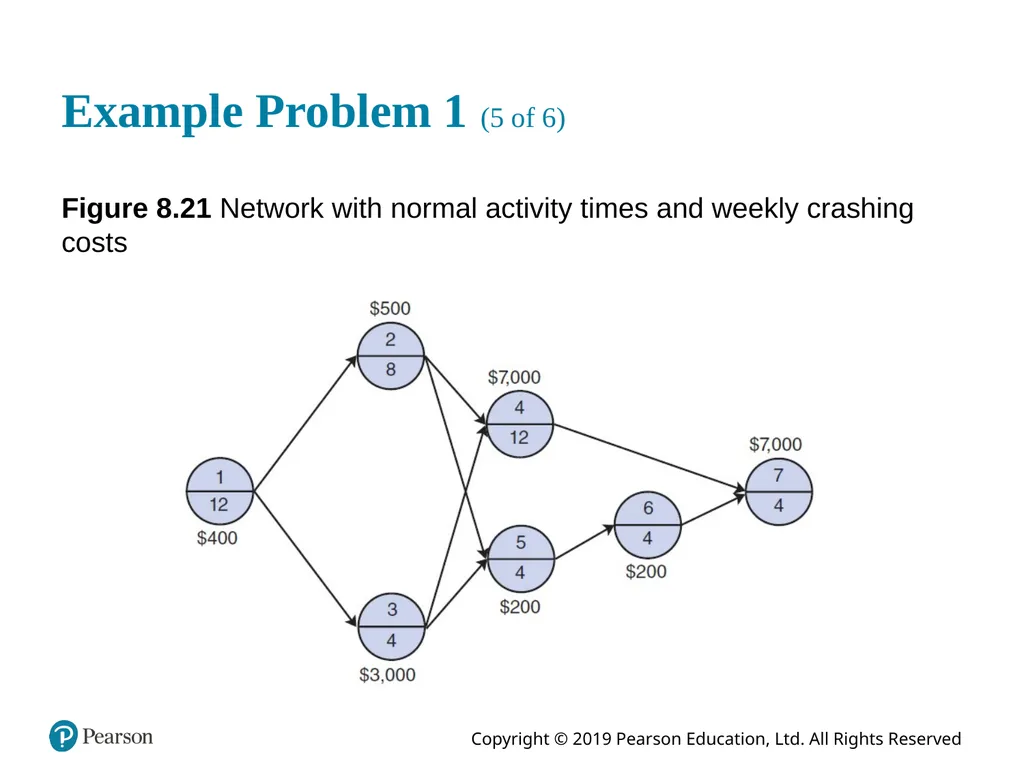
slide71. Example Problem 1 (5 of 6) Figure 8.21 Network with normal activity times and weekly crashing costs<br>
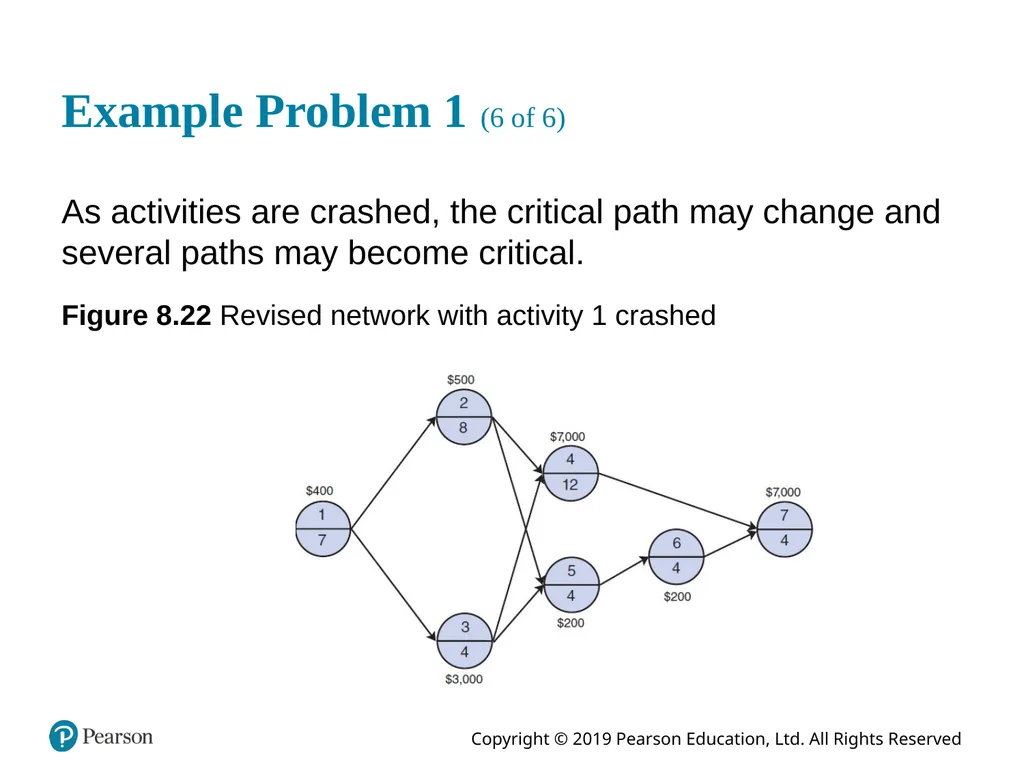
slide72. Example Problem 1 (6 of 6) As activities are crashed, the critical path may change and several paths may become critical. Figure 8.22 Revised network with activity 1 crashed<br>
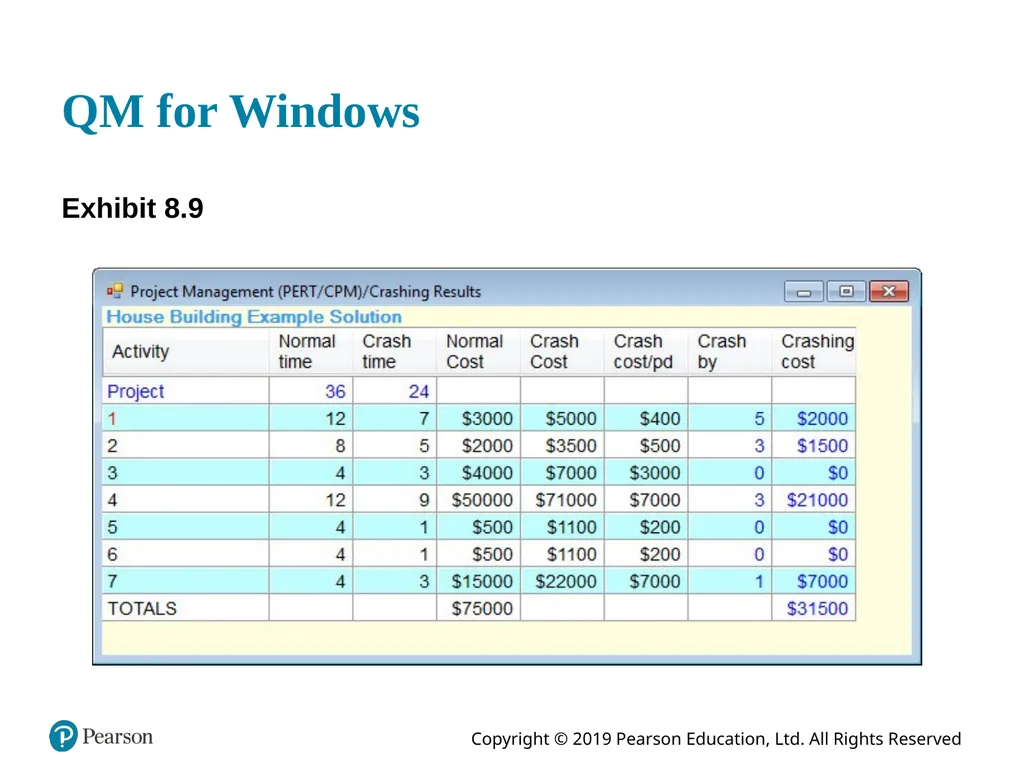
slide73. Q M for Windows Exhibit 8.9<br>
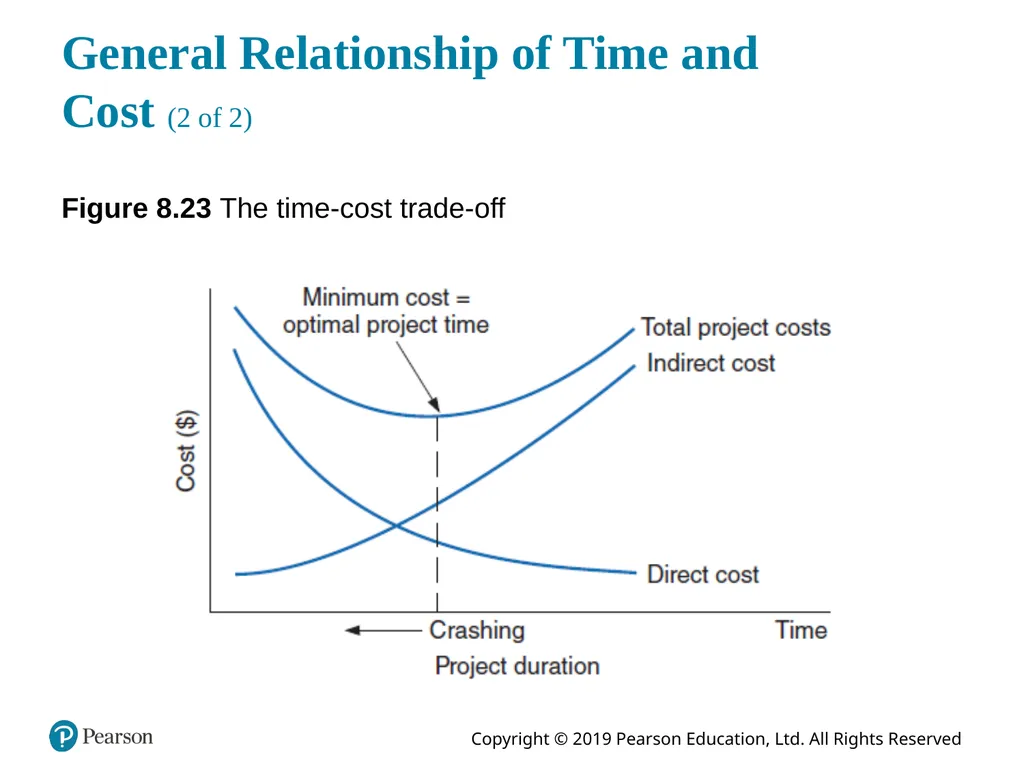
slide74. General Relationship of Time and Cost (1 of 2) Project crashing costs and indirect costs have an inverse relationship.
Crashing costs are highest when the project is shortened.
Indirect costs increase as the project duration increases.
The optimal project time is at the minimum point on the total cost curve.<br>
slide75. General Relationship of Time and Cost (2 of 2) Figure 8.23 The time-cost trade-off<br>
slide76. Learning Objective 8.6 Formulating the C P M/P E R T Network as a Linear Programming Model<br>
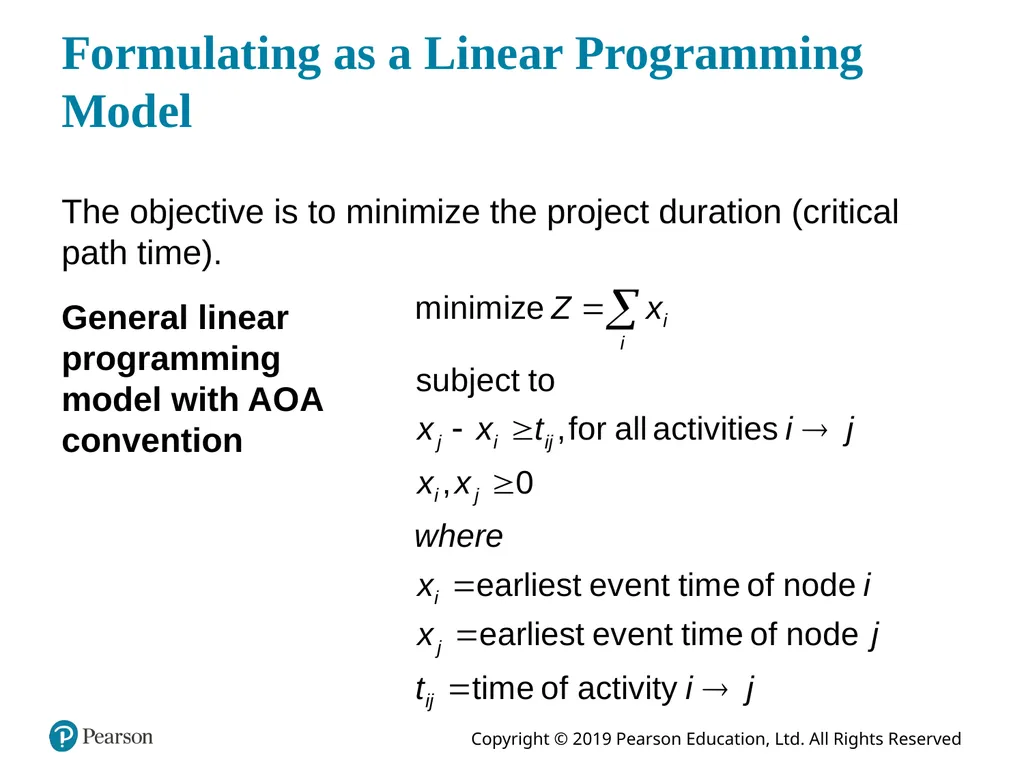
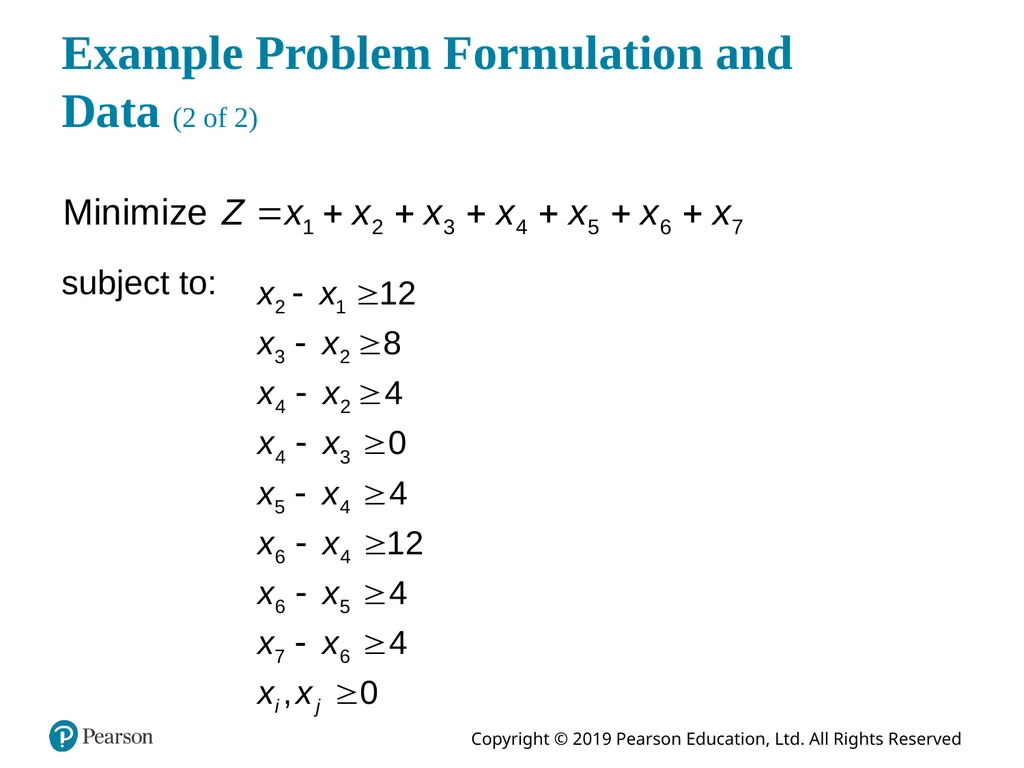
slide77. Formulating as a Linear Programming Model The objective is to minimize the project duration (critical path time). General linear programming model with A O A convention<br>
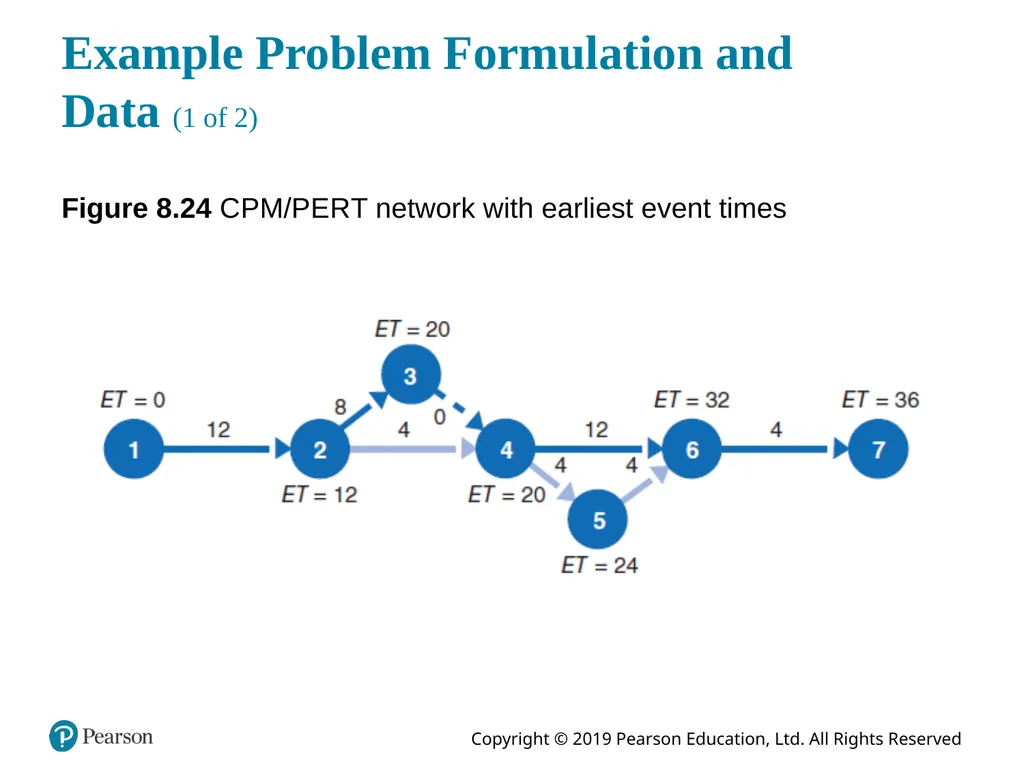
slide78. Example Problem Formulation and Data (1 of 2) Figure 8.24 C P M/P E R T network with earliest event times<br>
slide79. Example Problem Formulation and Data (2 of 2) subject to:<br>
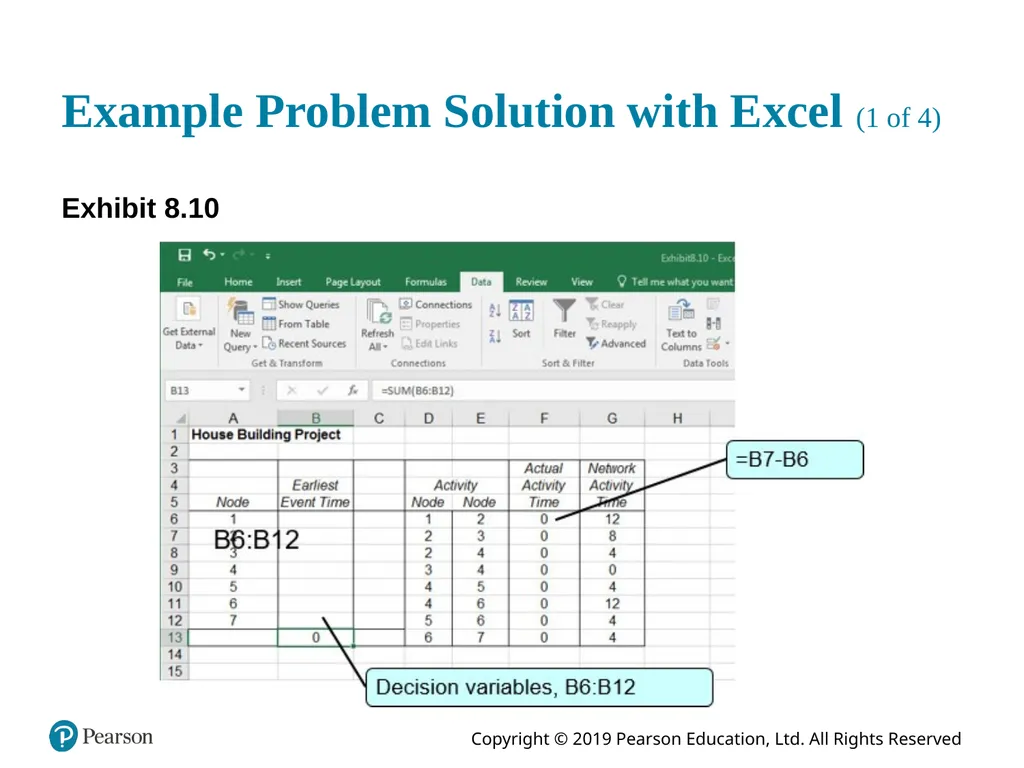
slide80. Example Problem Solution with Excel (1 of 4) Exhibit 8.10<br>
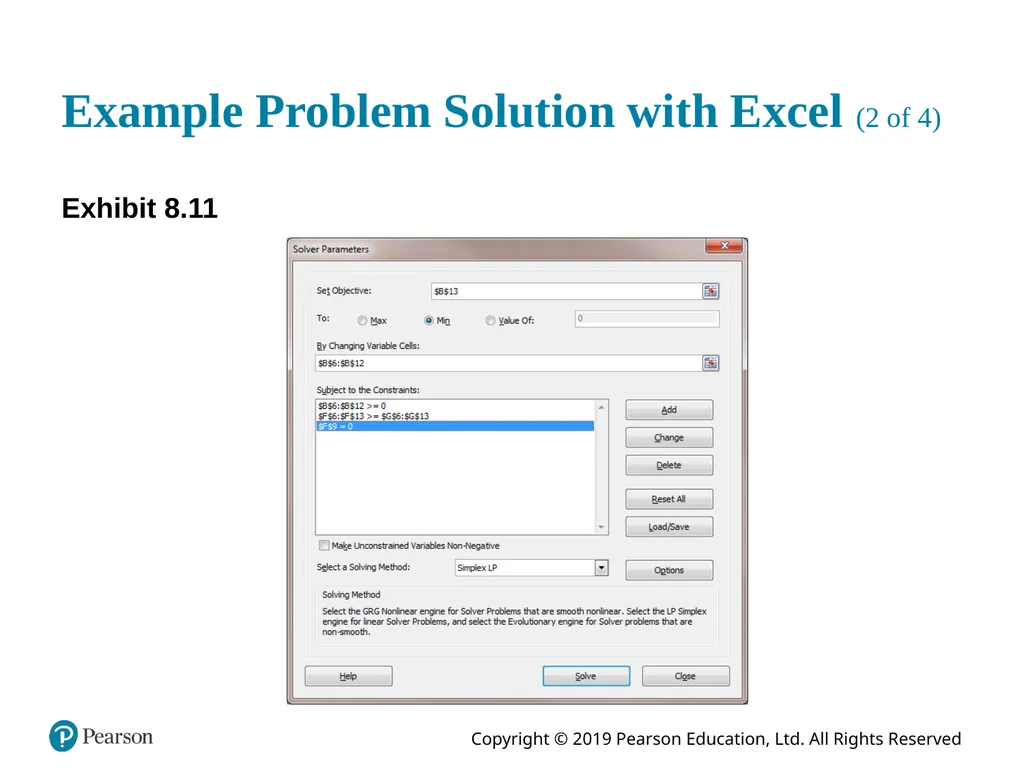
slide81. Example Problem Solution with Excel (2 of 4) Exhibit 8.11<br>
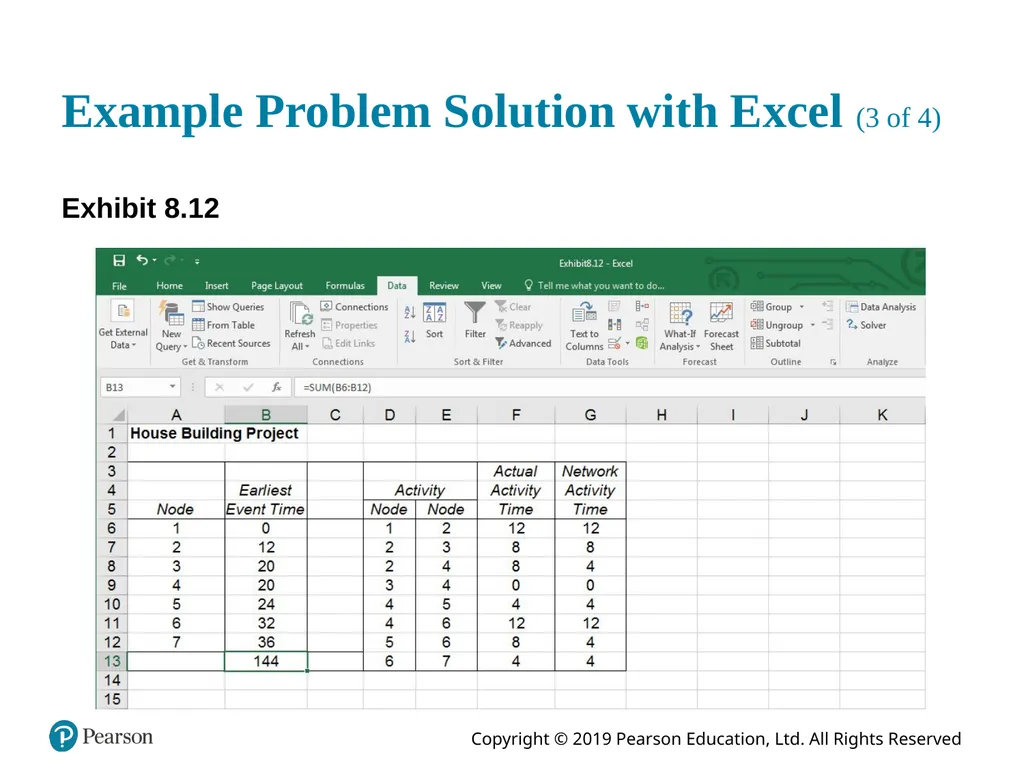
slide82. Example Problem Solution with Excel (3 of 4) Exhibit 8.12<br>
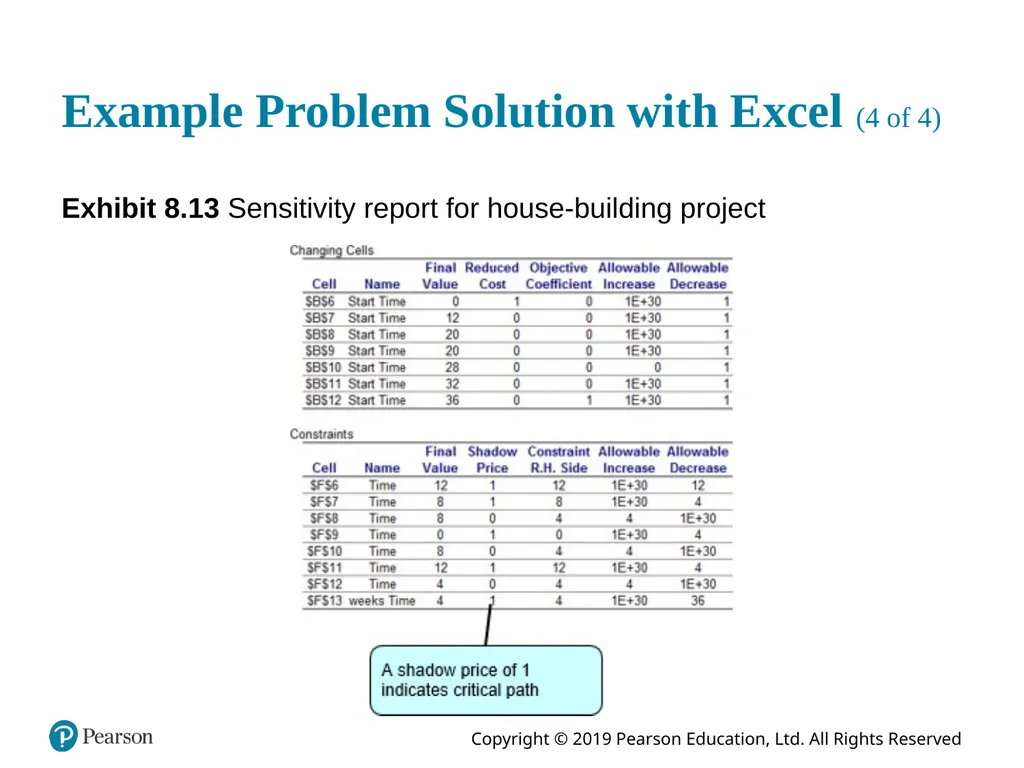
slide83. Example Problem Solution with Excel (4 of 4) Exhibit 8.13 Sensitivity report for house-building project<br>
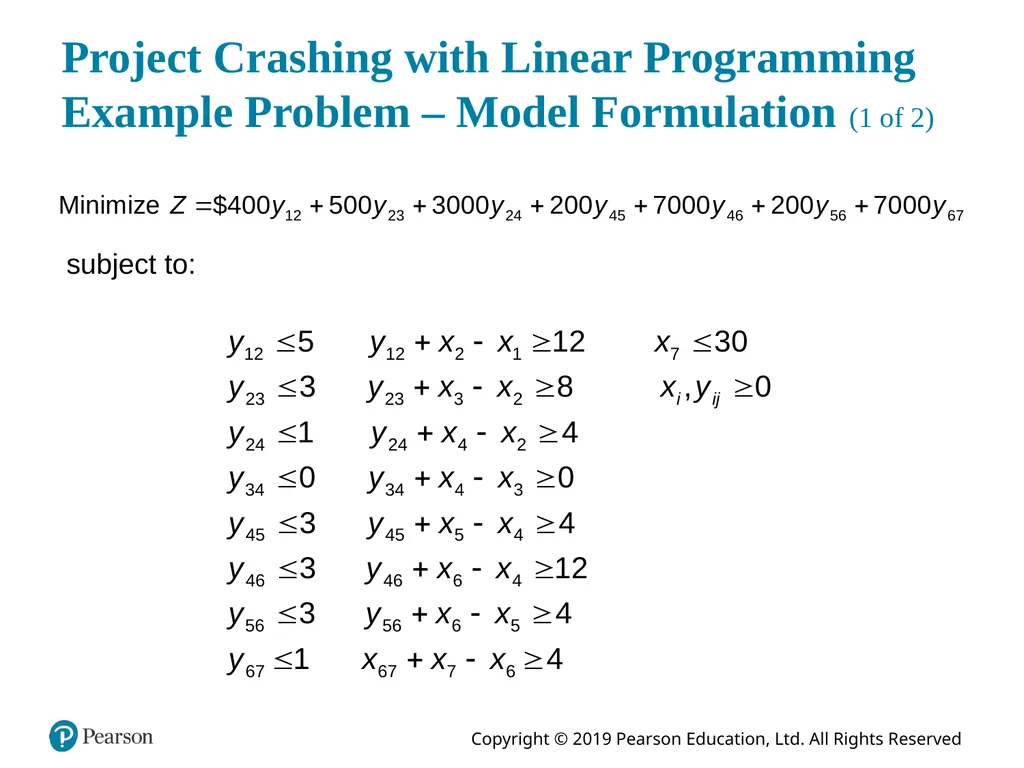
slide84. Project Crashing with Linear Programming Example Problem – Model Formulation (1 of 2) subject to:<br>
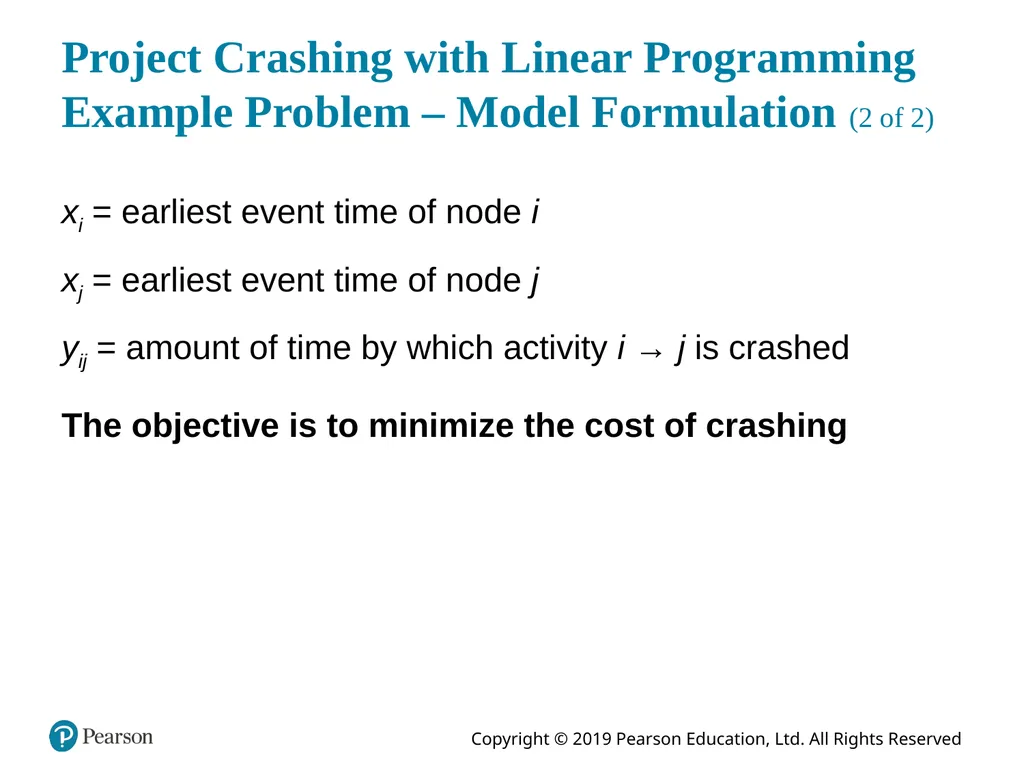
slide85. Project Crashing with Linear Programming Example Problem – Model Formulation (2 of 2) xi = earliest event time of node i
xj = earliest event time of node j
yij = amount of time by which activity i → j is crashed The objective is to minimize the cost of crashing<br>
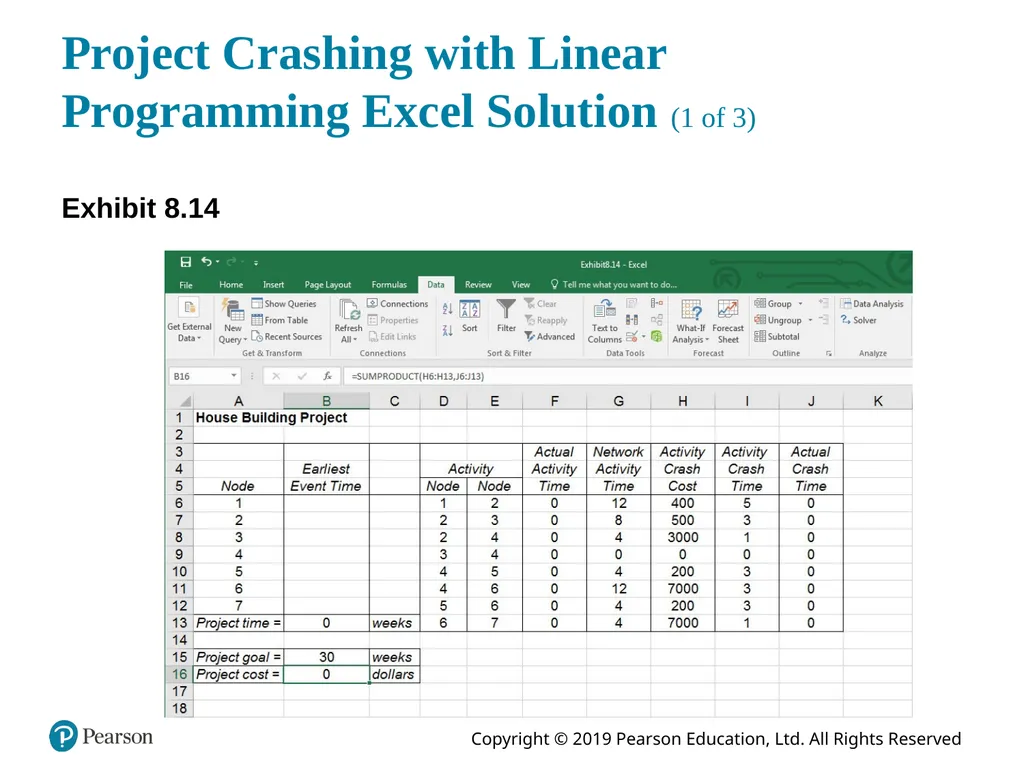
slide86. Project Crashing with Linear Programming Excel Solution (1 of 3) Exhibit 8.14<br>
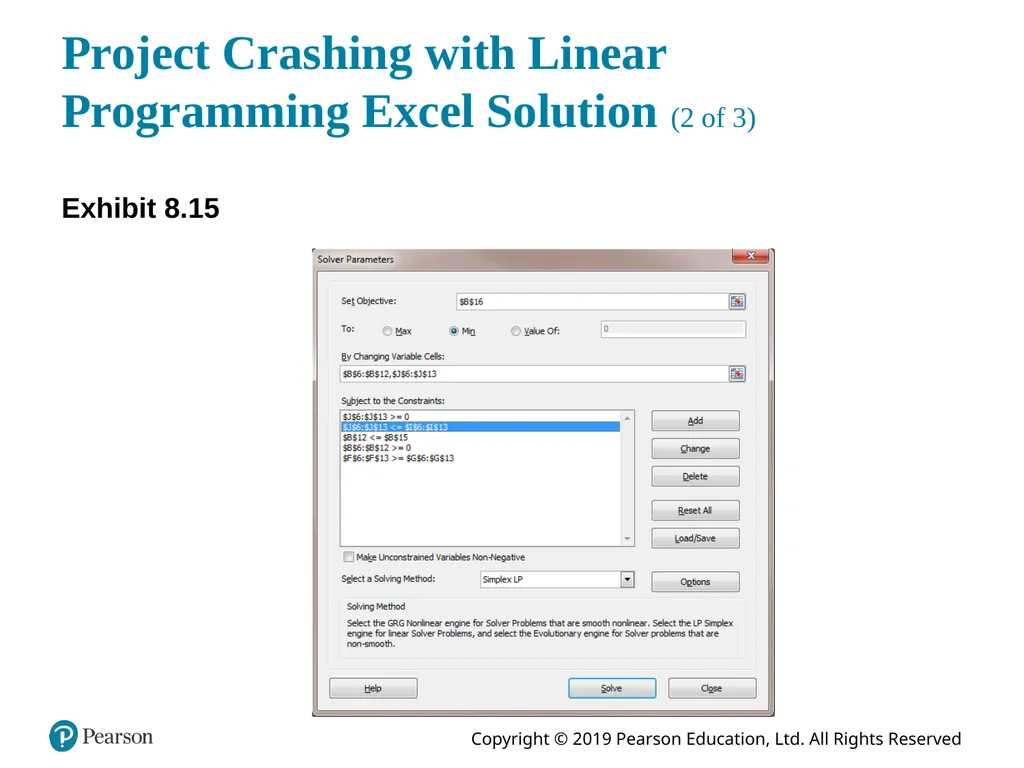
slide87. Project Crashing with Linear Programming Excel Solution (2 of 3) Exhibit 8.15<br>
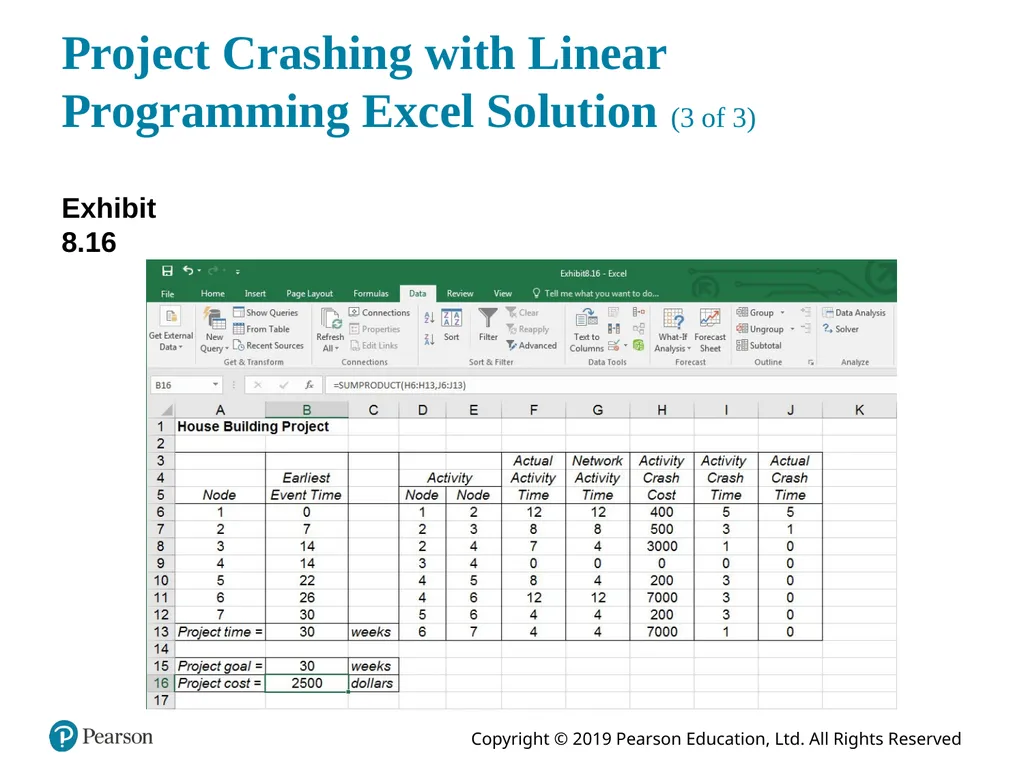
slide88. Project Crashing with Linear Programming Excel Solution (3 of 3) Exhibit 8.16<br>
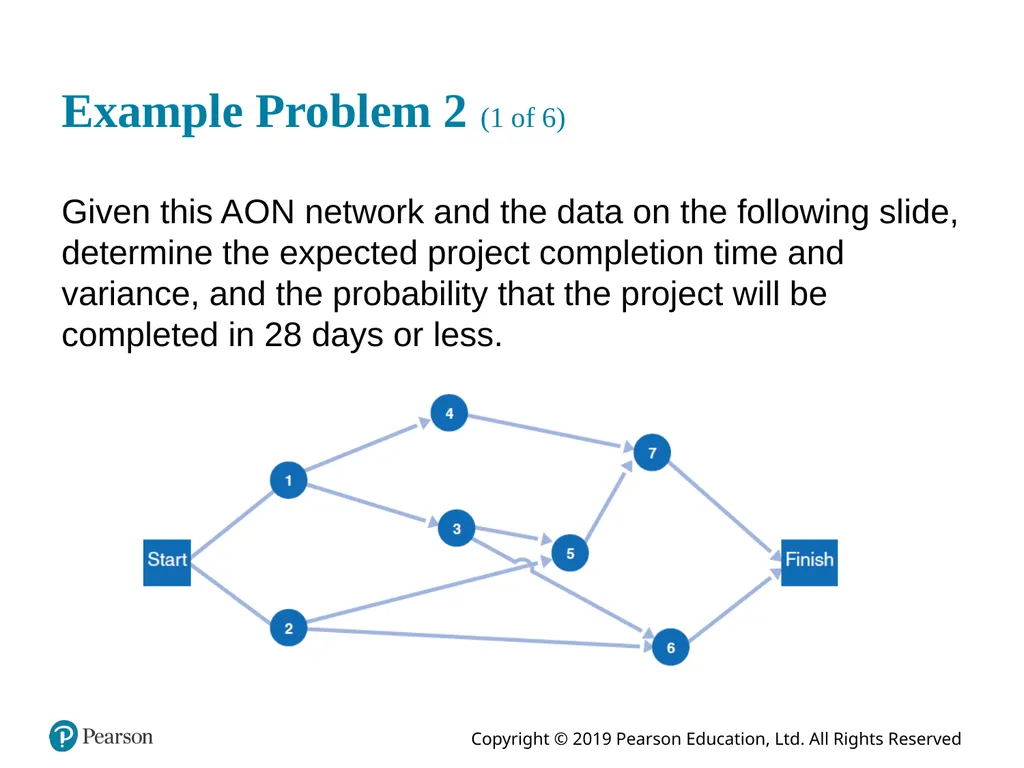
slide89. Example Problem 2 (1 of 6) Given this A O N network and the data on the following slide, determine the expected project completion time and variance, and the probability that the project will be completed in 28 days or less.<br>
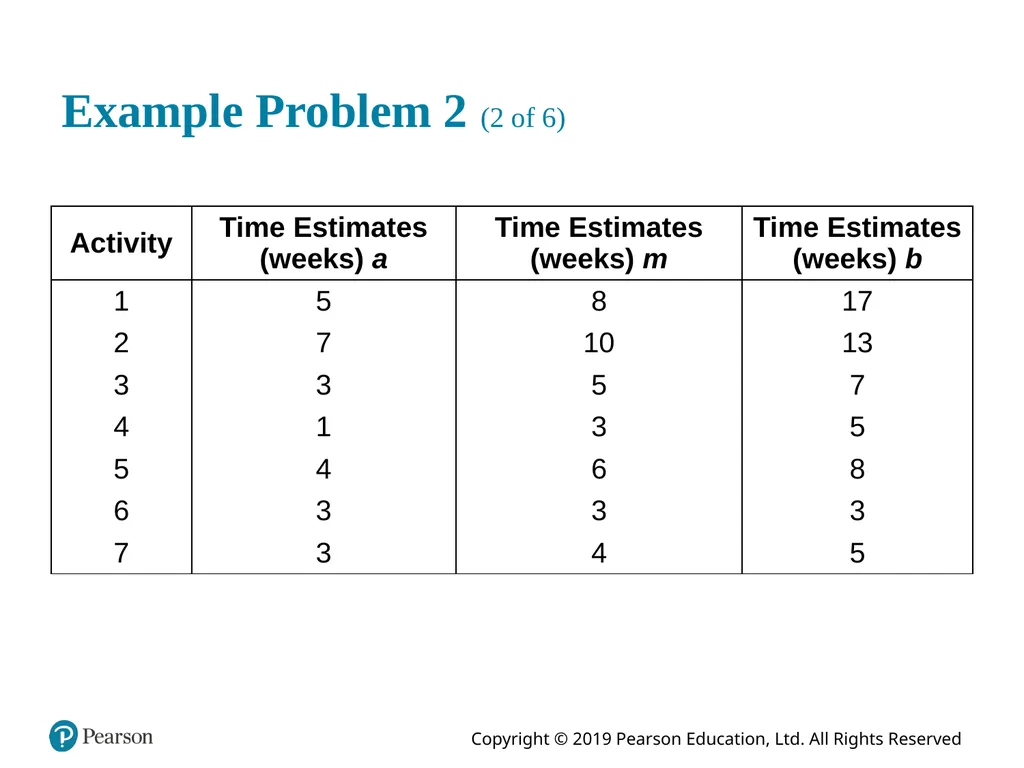
slide90. Example Problem 2 (2 of 6)<br>
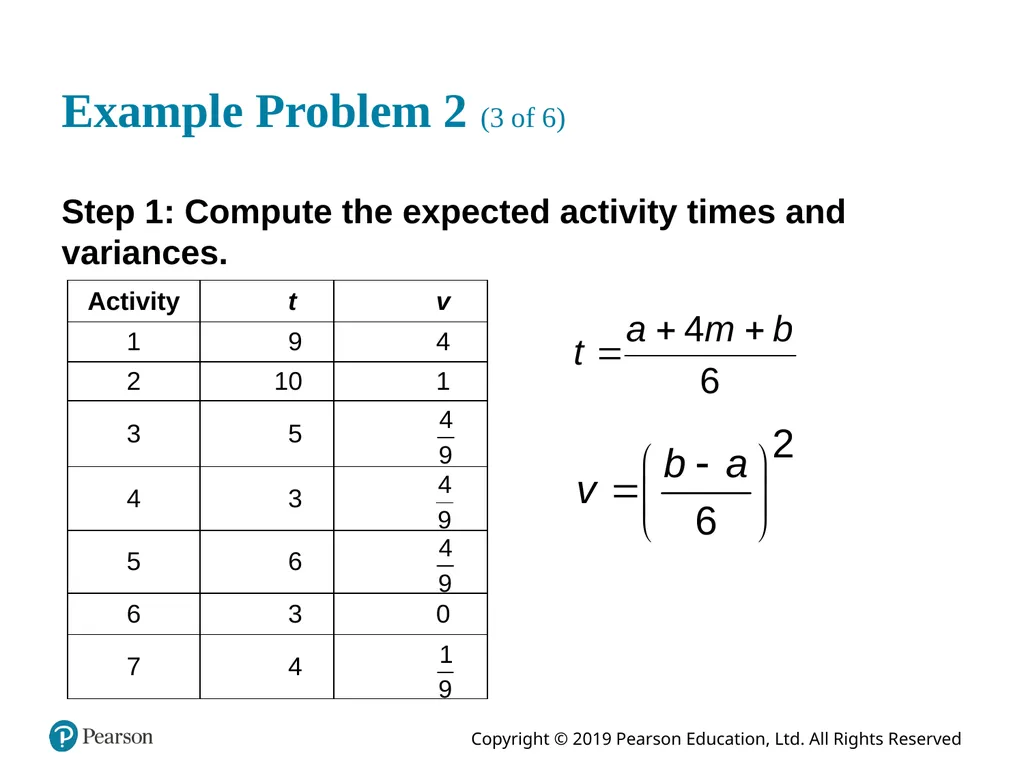
slide91. Example Problem 2 (3 of 6) Step 1: Compute the expected activity times and variances.<br>
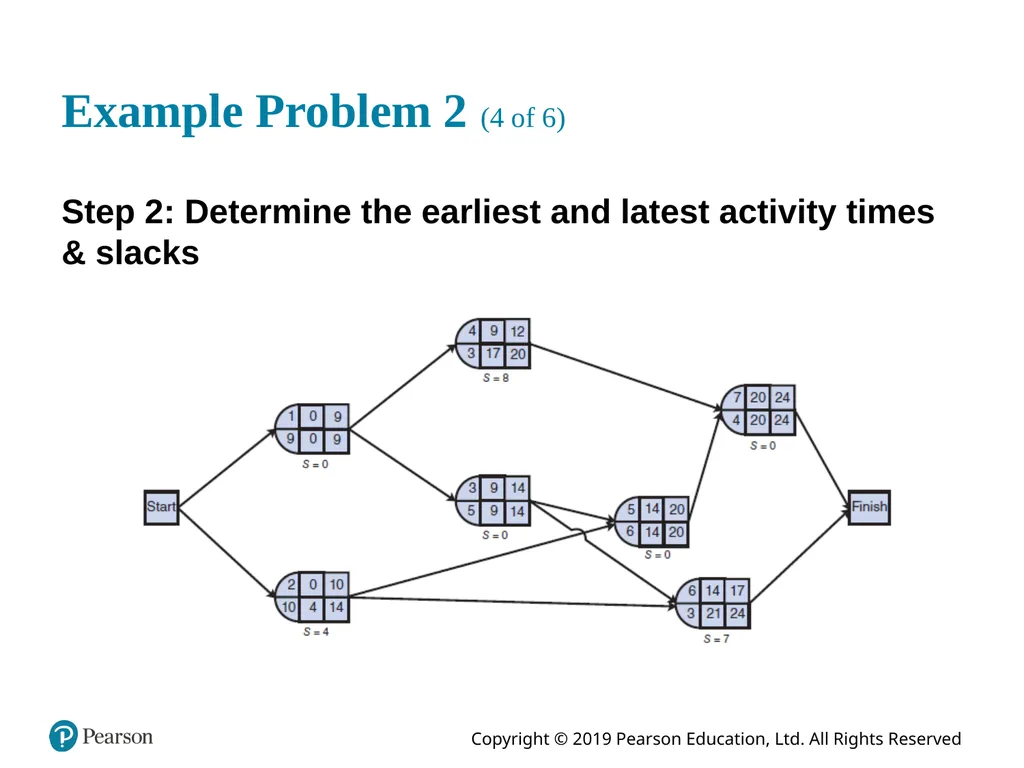
slide92. Example Problem 2 (4 of 6) Step 2: Determine the earliest and latest activity times & slacks<br>
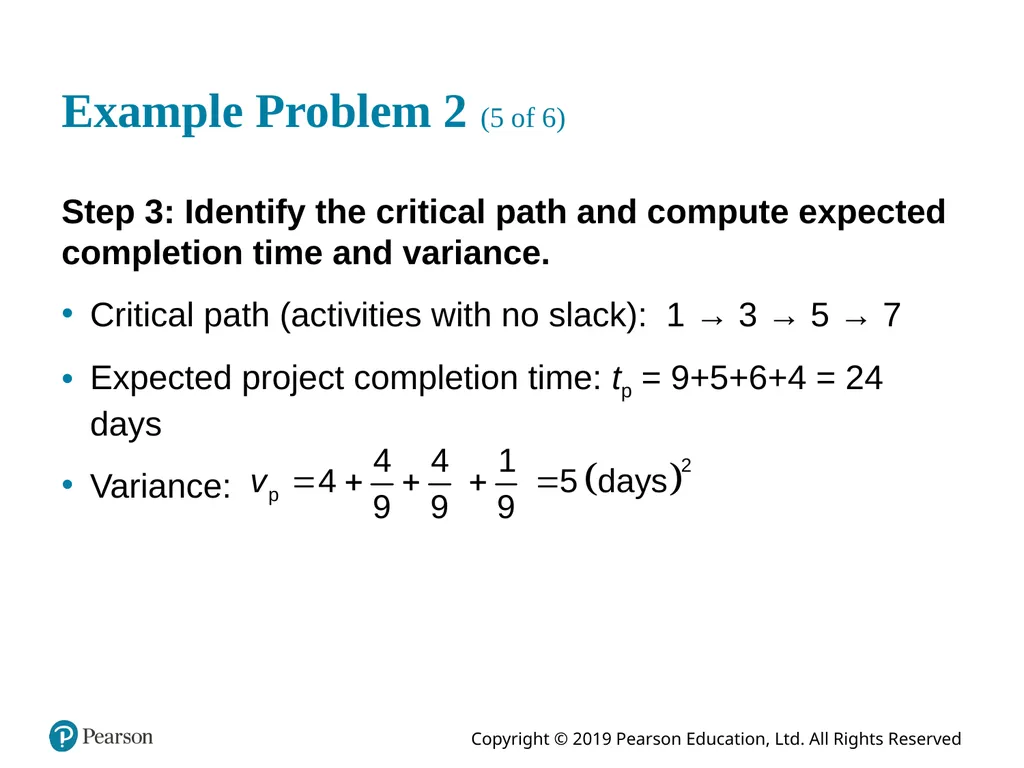
slide93. Example Problem 2 (5 of 6) Step 3: Identify the critical path and compute expected completion time and variance.
Critical path (activities with no slack): 1 → 3 → 5 → 7
Expected project completion time: tp = 9+5+6+4 = 24 days
Variance:<br>
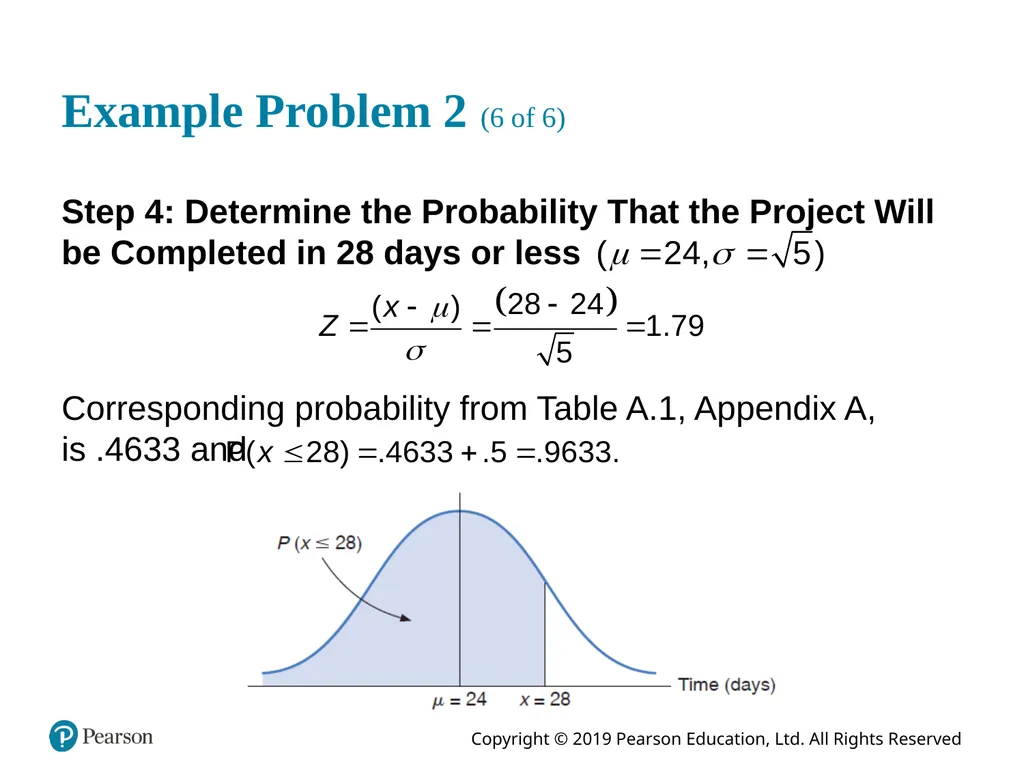
slide94. Example Problem 2 (6 of 6) Step 4: Determine the Probability That the Project Will be Completed in 28 days or less Corresponding probability from Table A.1, Appendix A, is .4633 and<br>
slide2. Learning Objectives 8.1 The Elements of Project Management
8.2 C P M/P E R T
8.3 Probabilistic Activity Times
8.4 Microsoft Project
8.5 Project Crashing and Time-Cost Trade-Off
8.6 Formulating the C P M/P E R T Network as a Linear Programming Model<br>
slide3. Overview Network representation is useful for project analysis.
Networks show how project activities are organized and are used to determine time duration of projects.
Network techniques used are:
C P M (Critical Path Method)
P E R T (Project Evaluation and Review Technique)
Developed independently during late 1950s.<br>
slide4. Learning Objective 8.1 The Elements of Project Management<br>
slide5. Elements of Project Management Management is generally perceived as concerned with planning, organizing, and control of an ongoing process or activity.
Project management is concerned with control of an important activity for a relatively short period of time after which management effort ends.
Primary elements of project management to be discussed:
Project Planning
Project Return
Project Team
Project Control<br>
slide6. Project Planning Objectives
Project scope
Contract requirements
Schedules
Resources
Personnel
Control
Risk and problem analysis<br>
slide7. Figure 8.1 The Project Management Process<br>
slide8. Project Return Return on investment (R O I) is a measure used to evaluate projects calculated by dividing the dollar gain minus the dollar cost by the dollar cost. R O I can be used to rank projects
Not all project benefits can be measured in dollars<br>
slide9. The Project Team Project team typically consists of a group of individuals from various areas in an organization and often includes outside consultants.
Members of engineering staff often assigned to project work.
Project team may include workers.
Most important member of project team is the project manager.
Project manager is often under great pressure because of uncertainty inherent in project activities and possibility of failure. Potential rewards, however, can be substantial.
Project manager must be able to coordinate various skills of team members into a single focused effort.<br>
slide10. Scope Statement Document providing common understanding of project.
Justification describing the factors giving rise to need for project.
Expected results and what constitutes success.
List of necessary documents and planning reports.
Statement of work (S O W) - a planning document for individuals, team members, groups, departments, subcontractors and suppliers, describing what are required for successful completion on time.<br>
slide11. Work Breakdown Structure (W B S) (1 of 2) W B S breaks down project into major components (modules).
Modules are further broken down into activities and, finally, into individual tasks.
Identifies activities, tasks, resource requirements and relationships between modules and activities.
Helps avoid duplication of effort.
Basis for project development, management , schedule, resources and modifications.<br>
slide12. Work Breakdown Structure (W B S) (2 of 2) Approaches for W B S development: Top down process
Brainstorm entire project<br>
slide13. Work Breakdown Structure Figure 8.2 W B S for computer order-processing system project<br>
slide14. Responsibility Assignment Matrix R A M shows who is responsible for doing the necessary work in the project
Project manager assigns work elements to organizational units, departments, groups, individuals or subcontractors.
Uses an organizational breakdown structure (O B S).
O B S is a table or a chart showing which organizational units are responsible for work items.
O B S leads to the responsibility assignment matrix (R A M)<br>
slide15. Figure 8.3 A Responsibility Assignment Matrix Level of responsibility: 1 = Overall responsibility 2 = Performance responsibility 3 = Support<br>
slide16. Project Scheduling (1 of 2) Project schedule evolves from planning documents, with focus on timely completion.
Critical element in project management – source of most conflicts and problems.
Schedule development steps: Define activities,
Sequence activities,
Estimate activity times,
Develop schedule.<br>
slide17. Project Scheduling (2 of 2) Gantt chart and C P M/P E R T techniques can be useful.
Computer software packages available, example Microsoft Project.<br>
slide18. Gantt Chart Popular, traditional technique, also known as a bar chart -developed by Henry Gantt (1914).
Direct precursor of C P M/P E R T for monitoring work progress.
A visual display of project schedule showing activity start and finish times and where extra time is available.
Suitable for projects with few activities and precedence relationships.
Drawback: precedence relationships are not always discernible which limits chart’s use for smaller projects<br>
slide19. Figure 8.4 Gantt Chart<br>
slide20. Project Control Process of ensuring progress toward successful completion.
Monitoring project to minimize deviations from project plan and schedule.
Corrective actions necessary if deviations occur.
Key elements of project control
Time management
Cost management
Performance management
Earned value analysis (E V A)<br>
slide21. Learning Objective 8.2 C P M/P E R T<br>
slide22. The Project Network (1 of 2) Activity-on-Arc (A O A) Network
A branch reflects an activity of a project.
A node represents the beginning and end of activities, referred to as events.
Branches in the network indicate precedence relationships.
When an activity is completed at a node, it has been realized.<br>
slide23. The Project Network (2 of 2) Figure 8.5 Nodes and branches<br>
slide24. The Project Network: House Building Project Data<br>
slide25. The Project Network: Concurrent Activities (1 of 2) Activities can occur at the same time (concurrently).
Network aids in planning and scheduling.
Time duration of activities shown on branches.<br>
slide26. The Project Network: Concurrent Activities (2 of 2) Figure 8.6 Concurrent activities for house-building project<br>
slide27. The Project Network: Dummy Activities A dummy activity shows a precedence relationship but reflects no passage of time.
Two or more activities cannot share the same start and end nodes. Figure 8.7 A dummy activity<br>
slide28. The Project Network: A O N Network for House Building Project (1 of 2) Activity-on-Node (A O N) Network
A node represents an activity, with its label and time shown on the node
The branches show the precedence relationships
Convention used in Microsoft Project software<br>
slide29. The Project Network: A O N Network for House Building Project (2 of 2) Figure 8.8 A O N network<br>
slide30. The Project Network: Paths Through a Network Table 8.1 Paths through the house-building network<br>
slide31. The Project Network: The Critical Path The critical path is the longest path through the network; the minimum time the network can be completed. From Figure 8.8:<br>
slide32. The Project Network: Activity Start Times Figure 8.9 Activity start time<br>
slide33. The Project Network: Activity Scheduling in Activity-on-Node Configuration Figure 8.10 Activity-on-node configuration<br>
slide34. The Project Network: Activity Scheduling: Earliest Times (1 of 2) E S is the earliest time an activity can start: E F is the earliest start time plus the activity time:<br>
slide35. The Project Network: Activity Scheduling: Earliest Times (2 of 2) Figure 8.11 Earliest activity start and finish times<br>
slide36. The Project Network: Activity Scheduling: Latest Times (1 of 2) L S is the latest time an activity can start without delaying critical path time: L F is the latest finish time:<br>
slide37. The Project Network: Activity Scheduling: Latest Times (2 of 2) Figure 8.12 Latest activity start and finish times<br>
slide38. The Project Network: Activity Slack Time (1 of 3) Slack is the amount of time an activity can be delayed without delaying the project: S = L S − E S = L F − E F
Slack Time exists for those activities not on the critical path for which the earliest and latest start times are not equal.
Shared Slack is slack available for a sequence of activities.<br>
slide39. The Project Network: Activity Slack Time (2 of 3) Table 8.2 Activity Slack *Critical path<br>
slide40. The Project Network: Activity Slack Time (3 of 3) Figure 8.13 Activity slack<br>
slide41. Learning Objective 8.3 Probabilistic Activity Times<br>
slide42. Probabilistic Activity Times (1 of 2) Activity time estimates usually cannot be made with certainty.
P E R T used for probabilistic activity times.
In P E R T, three time estimates are used: most likely time (m), the optimistic time (a), and the pessimistic time (b).
These provide an estimate of the mean and variance of a beta distribution:<br>
slide43. Probabilistic Activity Times (2 of 2)<br>
slide44. Example (1 of 4) Figure 8.14 Network for order processing system installation<br>
slide45. Example (2 of 4) Table 8.3 Activity time estimates for Figure 8.14<br>
slide46. Example (3 of 4)<br>
slide47. Example (4 of 4) Figure 8.15 Earliest and latest activity times<br>
slide48. Expected Project Time and Variance (1 of 2) Expected project time is the sum of the expected times of the critical path activities.
Project variance is the sum of the critical path activities’ variances
The expected project time is assumed to be normally distributed (based on central limit theorem).
In example, expected project time (tp) and variance (vp) interpreted as the mean () and variance of a normal distribution:<br>
slide49. Expected Project Time and Variance (2 of 2)<br>
slide50. Probability Analysis of a Project Network (1 of 2) Using the normal distribution, probabilities are determined by computing the number of standard deviations (Z) a value is from the mean.
The Z value is used to find the corresponding probability in Table A.1, Appendix A.<br>
slide51. Probability Analysis of a Project Network (2 of 2) Figure 8.16 Normal distribution of network duration<br>
slide52. Probability Analysis of a Project Network Example 1 (1 of 2) Figure 8.17 Probability that the network will be completed in 30 weeks or less<br>
slide53. Probability Analysis of a Project Network Example 1 (2 of 2) What is the probability that the new order processing system will be ready by 30 weeks? Z value of 1.90 corresponds to probability of .4713 in Table A.1, Appendix A. The probability of completing project in 30 weeks or less:
(.5000 + .4713) = .9713.<br>
slide54. Probability Analysis of a Project Network Example 2 (1 of 2) Figure 8.18 Probability the network will be completed in 22 weeks or less<br>
slide55. Probability Analysis of a Project Network Example 2 (2 of 2) A customer will trade elsewhere if the new ordering system is not working within 22 weeks. What is the probability that she will be retained? Z value of 1.14 (ignore negative) corresponds to probability of .3729 in Table A.1, Appendix A.
Probability that customer will be retained is .1271 (.5000−.3729)<br>
slide56. C P M/P E R T Analysis with Q M for Windows & Excel Q M (1 of 2) Exhibit 8.1: Q M for Windows solution output for system installation<br>
slide57. C P M/P E R T Analysis with Q M for Windows & Excel Q M (2 of 2) Exhibit 8.2: Excel Q M solution<br>
slide58. Learning Objective 8.4 Microsoft Project<br>
slide59. Analysis with Microsoft Project (1 of 6) Microsoft Project handles only A O N networks. Exhibit 8.3<br>
slide60. Analysis with Microsoft Project (2 of 6) Exhibit 8.4<br>
slide61. Analysis with Microsoft Project (3 of 6) Exhibit 8.5<br>
slide62. Analysis with Microsoft Project (4 of 6) Exhibit 8.6<br>
slide63. Analysis with Microsoft Project (5 of 6) Exhibit 8.7<br>
slide64. Analysis with Microsoft Project (6 of 6) Exhibit 8.8<br>
slide65. Learning Objective 8.5 Project Crashing and Time-Cost Trade-Off<br>
slide66. Project Crashing and Time-Cost Trade-Off Overview Project duration can be reduced by assigning more resources to project activities.
However, doing this increases project cost.
Decision is based on analysis of trade-off between time and cost.
Project crashing is a method for shortening project duration by reducing one or more critical activities to a time less than normal activity time.<br>
slide67. Example Problem 1 (1 of 6) Figure 8.19 The project network for building a house<br>
slide68. Example Problem 1 (2 of 6) Crash cost & crash time have a linear relationship<br>
slide69. Example Problem 1 (3 of 6) Figure 8.20 Time-cost relationship for crashing activity 1<br>
slide70. Example Problem 1 (4 of 6) Table 8.4 Normal activity and crash data for the Figure 8.19 network<br>
slide71. Example Problem 1 (5 of 6) Figure 8.21 Network with normal activity times and weekly crashing costs<br>
slide72. Example Problem 1 (6 of 6) As activities are crashed, the critical path may change and several paths may become critical. Figure 8.22 Revised network with activity 1 crashed<br>
slide73. Q M for Windows Exhibit 8.9<br>
slide74. General Relationship of Time and Cost (1 of 2) Project crashing costs and indirect costs have an inverse relationship.
Crashing costs are highest when the project is shortened.
Indirect costs increase as the project duration increases.
The optimal project time is at the minimum point on the total cost curve.<br>
slide75. General Relationship of Time and Cost (2 of 2) Figure 8.23 The time-cost trade-off<br>
slide76. Learning Objective 8.6 Formulating the C P M/P E R T Network as a Linear Programming Model<br>
slide77. Formulating as a Linear Programming Model The objective is to minimize the project duration (critical path time). General linear programming model with A O A convention<br>
slide78. Example Problem Formulation and Data (1 of 2) Figure 8.24 C P M/P E R T network with earliest event times<br>
slide79. Example Problem Formulation and Data (2 of 2) subject to:<br>
slide80. Example Problem Solution with Excel (1 of 4) Exhibit 8.10<br>
slide81. Example Problem Solution with Excel (2 of 4) Exhibit 8.11<br>
slide82. Example Problem Solution with Excel (3 of 4) Exhibit 8.12<br>
slide83. Example Problem Solution with Excel (4 of 4) Exhibit 8.13 Sensitivity report for house-building project<br>
slide84. Project Crashing with Linear Programming Example Problem – Model Formulation (1 of 2) subject to:<br>
slide85. Project Crashing with Linear Programming Example Problem – Model Formulation (2 of 2) xi = earliest event time of node i
xj = earliest event time of node j
yij = amount of time by which activity i → j is crashed The objective is to minimize the cost of crashing<br>
slide86. Project Crashing with Linear Programming Excel Solution (1 of 3) Exhibit 8.14<br>
slide87. Project Crashing with Linear Programming Excel Solution (2 of 3) Exhibit 8.15<br>
slide88. Project Crashing with Linear Programming Excel Solution (3 of 3) Exhibit 8.16<br>
slide89. Example Problem 2 (1 of 6) Given this A O N network and the data on the following slide, determine the expected project completion time and variance, and the probability that the project will be completed in 28 days or less.<br>
slide90. Example Problem 2 (2 of 6)<br>
slide91. Example Problem 2 (3 of 6) Step 1: Compute the expected activity times and variances.<br>
slide92. Example Problem 2 (4 of 6) Step 2: Determine the earliest and latest activity times & slacks<br>
slide93. Example Problem 2 (5 of 6) Step 3: Identify the critical path and compute expected completion time and variance.
Critical path (activities with no slack): 1 → 3 → 5 → 7
Expected project completion time: tp = 9+5+6+4 = 24 days
Variance:<br>
slide94. Example Problem 2 (6 of 6) Step 4: Determine the Probability That the Project Will be Completed in 28 days or less Corresponding probability from Table A.1, Appendix A, is .4633 and<br>