
Investment Decision Rules P.V. Viswanath For a
BR
Published · 40 slides · 0 views

1 / 1




Description
Investment Decision Rules P.V. Viswanath For a First Course in Finance 1 Learning Objectives 2 What are the characteristics of good decision criteria? What is the NPV Rule? What is the Payback Rule? How is Accounting Rate of Return used for
Related Topics
Share
Embed code
Download this presentation From Below
"Investment Decision Rules P.V. Viswanath For a" is the property of its rightful owner. Permission is granted to download and print the materials on this website for personal, non-commercial use only, and to display it on your personal computer provided you do not modify the materials and that you retain all copyright notices contained in the materials. By downloading content from our website, you accept the terms of this agreement.
Presentation Transcript
01
Investment Decision Rules P.V. Viswanath
For a First Course in Finance 1<br>
For a First Course in Finance 1<br>
02
Learning Objectives 2 What are the characteristics of good decision criteria?
What is the NPV Rule?
What is the Payback Rule?
How is Accounting Rate of Return used for project selection?
What is the IRR Rule?
How do we use the IRR in the case of Mutually exclusive projects?
How do we handle the case of multiple IRRs?
How can we use the Profitability Index in situations of capital rationing ?<br>
What is the NPV Rule?
What is the Payback Rule?
How is Accounting Rate of Return used for project selection?
What is the IRR Rule?
How do we use the IRR in the case of Mutually exclusive projects?
How do we handle the case of multiple IRRs?
How can we use the Profitability Index in situations of capital rationing ?<br>
03
P.V. Viswanath 3 Sources of Investment Ideas Three categories of projects:
New Products
Cost Reduction
Replacement of Existing assets
Sources of Project Ideas:
Existing customers
R&D Department
Competition
Employees<br>
New Products
Cost Reduction
Replacement of Existing assets
Sources of Project Ideas:
Existing customers
R&D Department
Competition
Employees<br>
04
P.V. Viswanath 4 Good Decision Criteria We need to ask ourselves the following questions when evaluating decision criteria
Does the decision rule adjust for the time value of money?
Does the decision rule adjust for risk?
Does the decision rule provide information on whether we are creating value for the firm?
We will look at these questions for each one of our decision criteria.<br>
Does the decision rule adjust for the time value of money?
Does the decision rule adjust for risk?
Does the decision rule provide information on whether we are creating value for the firm?
We will look at these questions for each one of our decision criteria.<br>
05
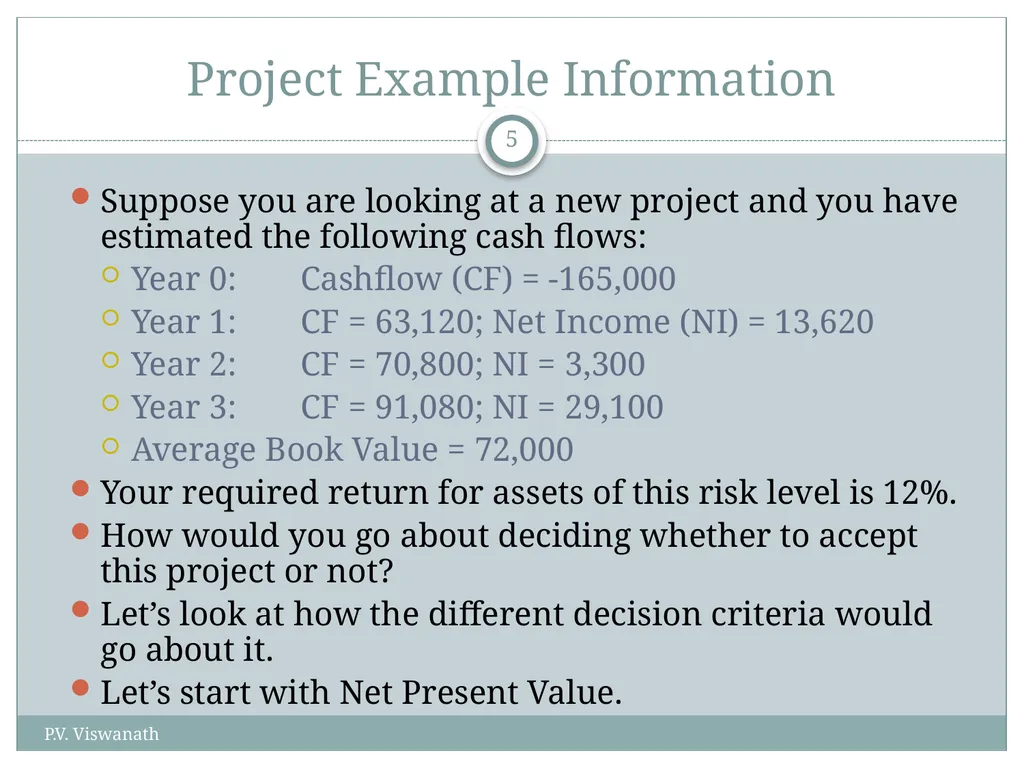
P.V. Viswanath 5 Project Example Information Suppose you are looking at a new project and you have estimated the following cash flows:
Year 0: Cashflow (CF) = -165,000
Year 1: CF = 63,120; Net Income (NI) = 13,620
Year 2: CF = 70,800; NI = 3,300
Year 3: CF = 91,080; NI = 29,100
Average Book Value = 72,000
Your required return for assets of this risk level is 12%.
How would you go about deciding whether to accept this project or not?
Let’s look at how the different decision criteria would go about it.
Let’s start with Net Present Value.<br>
Year 0: Cashflow (CF) = -165,000
Year 1: CF = 63,120; Net Income (NI) = 13,620
Year 2: CF = 70,800; NI = 3,300
Year 3: CF = 91,080; NI = 29,100
Average Book Value = 72,000
Your required return for assets of this risk level is 12%.
How would you go about deciding whether to accept this project or not?
Let’s look at how the different decision criteria would go about it.
Let’s start with Net Present Value.<br>
06
P.V. Viswanath 6 Net Present Value The NPV of a project is essentially the difference between the market value of a project and its cost
It answers the question: how much value is created from undertaking an project?
The first step is to estimate the expected future cash flows.
The second step is to estimate the required return for projects of this risk level.
The third step is to find the present value of the cash flows and subtract the initial investment.<br>
It answers the question: how much value is created from undertaking an project?
The first step is to estimate the expected future cash flows.
The second step is to estimate the required return for projects of this risk level.
The third step is to find the present value of the cash flows and subtract the initial investment.<br>
07
P.V. Viswanath 7 NPV Decision Rule If the NPV is positive, accept the project
A positive NPV means that the project is expected to add value to the firm and will therefore increase the wealth of the owners.
Since our goal is to increase owner wealth, NPV is a direct measure of how well this project will meet our goal.
One advantage of NPV is that it is an additive measure:
If there are two projects A and B, then NPV(A and B) = NPV(A) + NPV(B).<br>
A positive NPV means that the project is expected to add value to the firm and will therefore increase the wealth of the owners.
Since our goal is to increase owner wealth, NPV is a direct measure of how well this project will meet our goal.
One advantage of NPV is that it is an additive measure:
If there are two projects A and B, then NPV(A and B) = NPV(A) + NPV(B).<br>
08
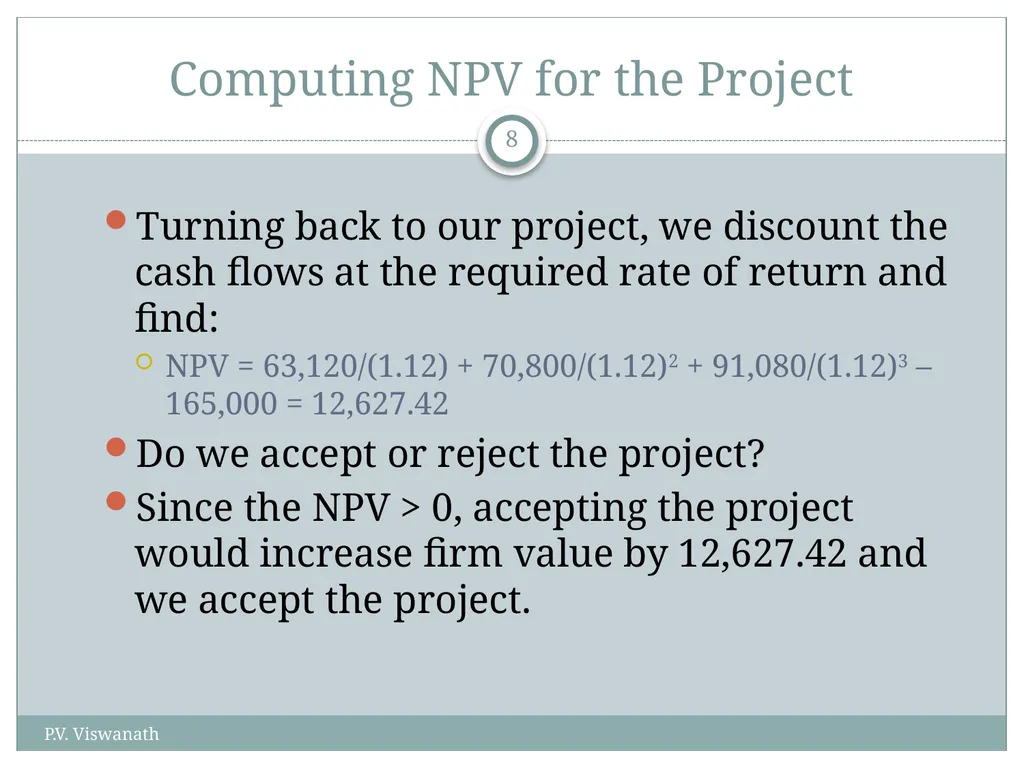
P.V. Viswanath 8 Computing NPV for the Project Turning back to our project, we discount the cash flows at the required rate of return and find:
NPV = 63,120/(1.12) + 70,800/(1.12)2 + 91,080/(1.12)3 – 165,000 = 12,627.42
Do we accept or reject the project?
Since the NPV > 0, accepting the project would increase firm value by 12,627.42 and we accept the project.<br>
NPV = 63,120/(1.12) + 70,800/(1.12)2 + 91,080/(1.12)3 – 165,000 = 12,627.42
Do we accept or reject the project?
Since the NPV > 0, accepting the project would increase firm value by 12,627.42 and we accept the project.<br>
09
P.V. Viswanath 9 Decision Criteria Test - NPV The NPV rule accounts for the time value of money.
The NPV rule accounts for the risk of the cash flows.
The NPV rule provides an indication about the increase in value.
The NPV rule satisfies all our criteria for a good decision rule.<br>
The NPV rule accounts for the risk of the cash flows.
The NPV rule provides an indication about the increase in value.
The NPV rule satisfies all our criteria for a good decision rule.<br>
10
Poll: NPV A project requires an investment of $1000 and generates $1200 in two years time.
The discount rate/cost of capital is 10% per annum.
Does the project have a positive NPV?
Yes
No P.V. Viswanath 10<br>
The discount rate/cost of capital is 10% per annum.
Does the project have a positive NPV?
Yes
No P.V. Viswanath 10<br>
11
Poll: NPV2 A project requires an investment of $1000 and has a payoff of $700 in year 1 and $400 in year 2. The cost of capital is zero. Does the project have a positive NPV?
Yes
No P.V. Viswanath 11<br>
Yes
No P.V. Viswanath 11<br>
12
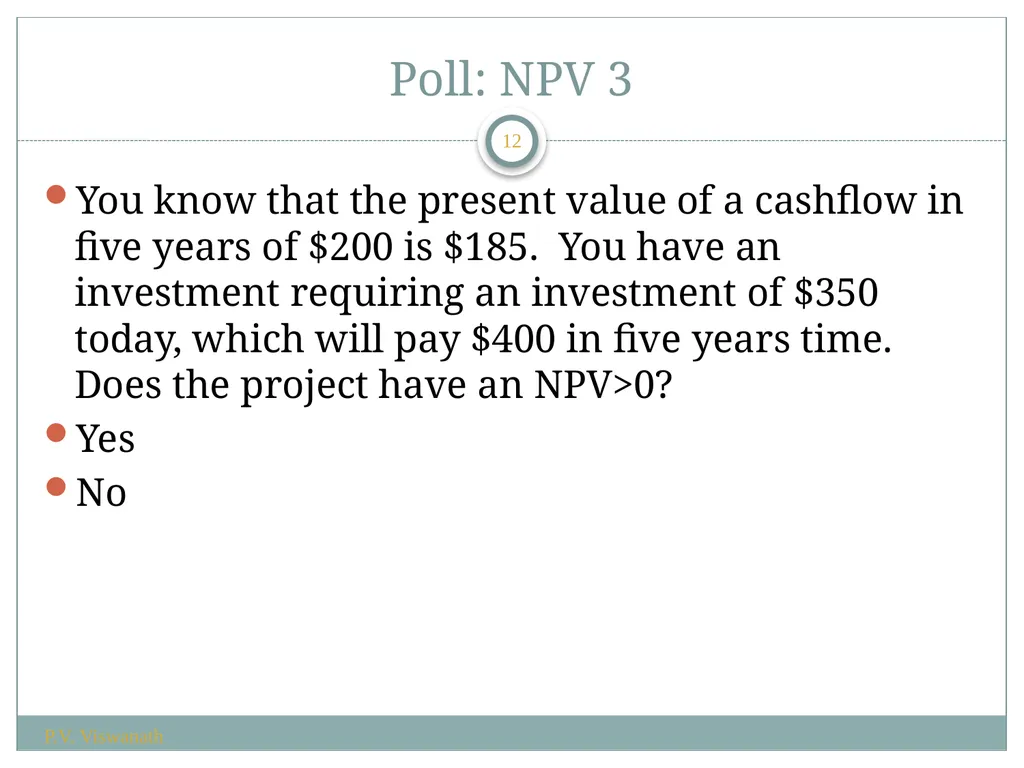
Poll: NPV 3 You know that the present value of a cashflow in five years of $200 is $185. You have an investment requiring an investment of $350 today, which will pay $400 in five years time. Does the project have an NPV>0?
Yes
No P.V. Viswanath 12<br>
Yes
No P.V. Viswanath 12<br>
13
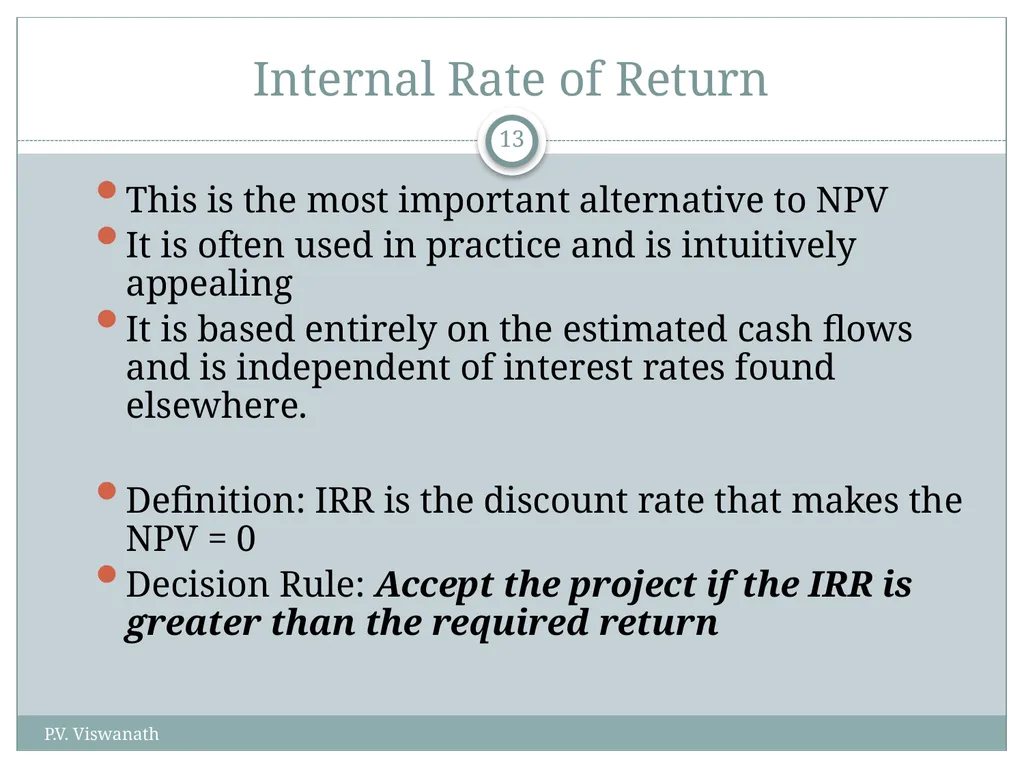
P.V. Viswanath 13 Internal Rate of Return This is the most important alternative to NPV
It is often used in practice and is intuitively appealing
It is based entirely on the estimated cash flows and is independent of interest rates found elsewhere.
Definition: IRR is the discount rate that makes the NPV = 0
Decision Rule: Accept the project if the IRR is greater than the required return<br>
It is often used in practice and is intuitively appealing
It is based entirely on the estimated cash flows and is independent of interest rates found elsewhere.
Definition: IRR is the discount rate that makes the NPV = 0
Decision Rule: Accept the project if the IRR is greater than the required return<br>
14
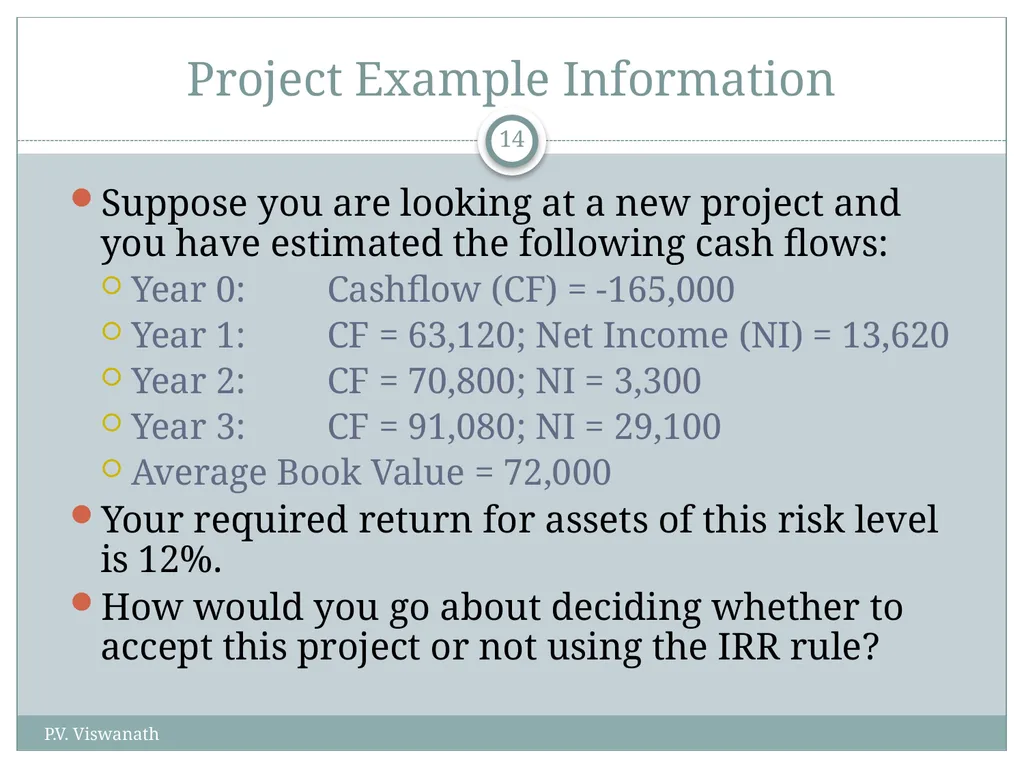
P.V. Viswanath 14 Project Example Information Suppose you are looking at a new project and you have estimated the following cash flows:
Year 0: Cashflow (CF) = -165,000
Year 1: CF = 63,120; Net Income (NI) = 13,620
Year 2: CF = 70,800; NI = 3,300
Year 3: CF = 91,080; NI = 29,100
Average Book Value = 72,000
Your required return for assets of this risk level is 12%.
How would you go about deciding whether to accept this project or not using the IRR rule?<br>
Year 0: Cashflow (CF) = -165,000
Year 1: CF = 63,120; Net Income (NI) = 13,620
Year 2: CF = 70,800; NI = 3,300
Year 3: CF = 91,080; NI = 29,100
Average Book Value = 72,000
Your required return for assets of this risk level is 12%.
How would you go about deciding whether to accept this project or not using the IRR rule?<br>
15
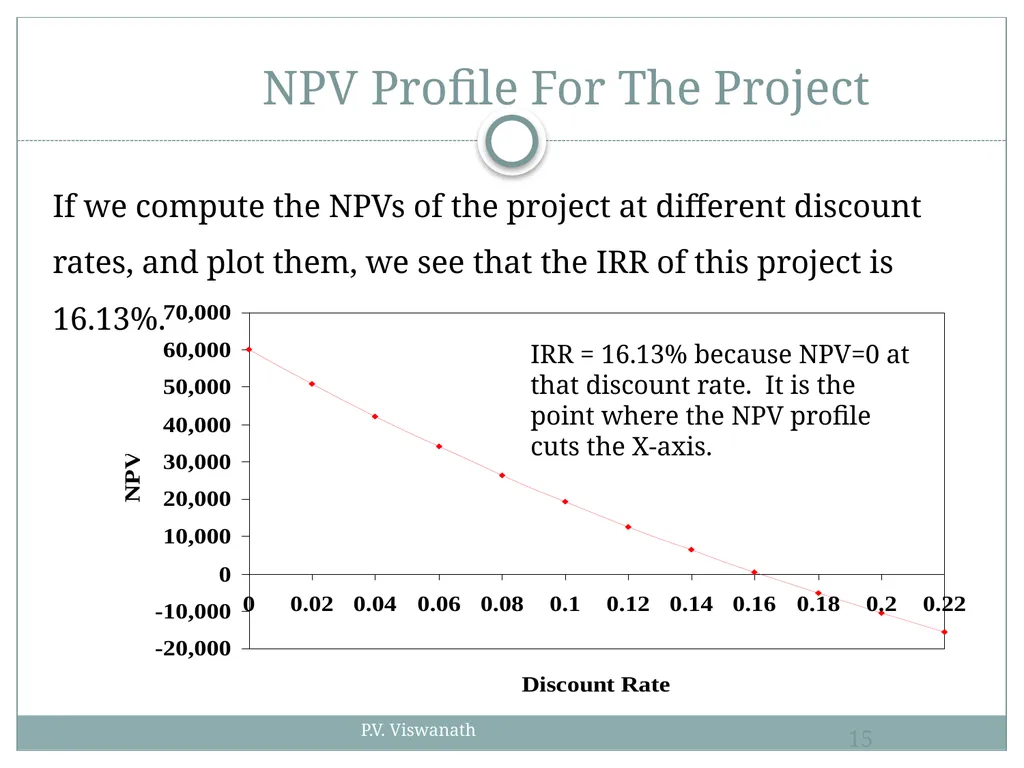
P.V. Viswanath 15 NPV Profile For The Project IRR = 16.13% because NPV=0 at that discount rate. It is the point where the NPV profile cuts the X-axis. If we compute the NPVs of the project at different discount rates, and plot them, we see that the IRR of this project is 16.13%.<br>
16
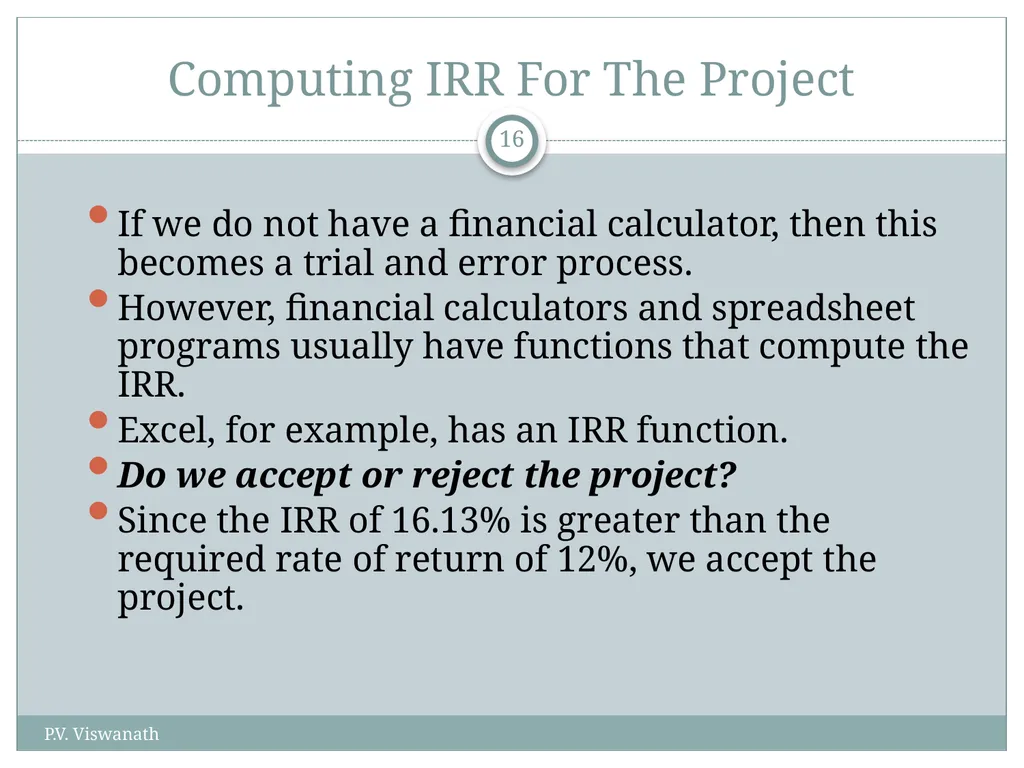
P.V. Viswanath 16 Computing IRR For The Project If we do not have a financial calculator, then this becomes a trial and error process.
However, financial calculators and spreadsheet programs usually have functions that compute the IRR.
Excel, for example, has an IRR function.
Do we accept or reject the project?
Since the IRR of 16.13% is greater than the required rate of return of 12%, we accept the project.<br>
However, financial calculators and spreadsheet programs usually have functions that compute the IRR.
Excel, for example, has an IRR function.
Do we accept or reject the project?
Since the IRR of 16.13% is greater than the required rate of return of 12%, we accept the project.<br>
17
P.V. Viswanath 17 Advantages of IRR Knowing a return is intuitively appealing.
It is a simple way to communicate the value of a project to someone who doesn’t know all the estimation details.
If the IRR is high enough, you may not need to estimate a required return, which is often a difficult task.
Can be used to gauge sensitivity of project value to errors in estimation of the discount rate.<br>
It is a simple way to communicate the value of a project to someone who doesn’t know all the estimation details.
If the IRR is high enough, you may not need to estimate a required return, which is often a difficult task.
Can be used to gauge sensitivity of project value to errors in estimation of the discount rate.<br>
18
P.V. Viswanath 18 NPV Vs. IRR NPV and IRR will generally give us the same decision
Exceptions
Non-conventional cash flows – cash flow signs change more than once
Mutually exclusive projects
What do we do if there is a conflict?
NPV directly measures the increase in value to the firm. Hence whenever there is a conflict between NPV and another decision rule, you should always use NPV.<br>
Exceptions
Non-conventional cash flows – cash flow signs change more than once
Mutually exclusive projects
What do we do if there is a conflict?
NPV directly measures the increase in value to the firm. Hence whenever there is a conflict between NPV and another decision rule, you should always use NPV.<br>
19
P.V. Viswanath 19 IRR and Nonconventional Cash Flows When the cash flows change sign more than once, there is more than one IRR
When you solve for IRR you are solving for the root of an equation and when you cross the x-axis more than once, there will be more than one return that solves the equation
If you have more than one IRR, which one do you use to make your decision?<br>
When you solve for IRR you are solving for the root of an equation and when you cross the x-axis more than once, there will be more than one return that solves the equation
If you have more than one IRR, which one do you use to make your decision?<br>
20
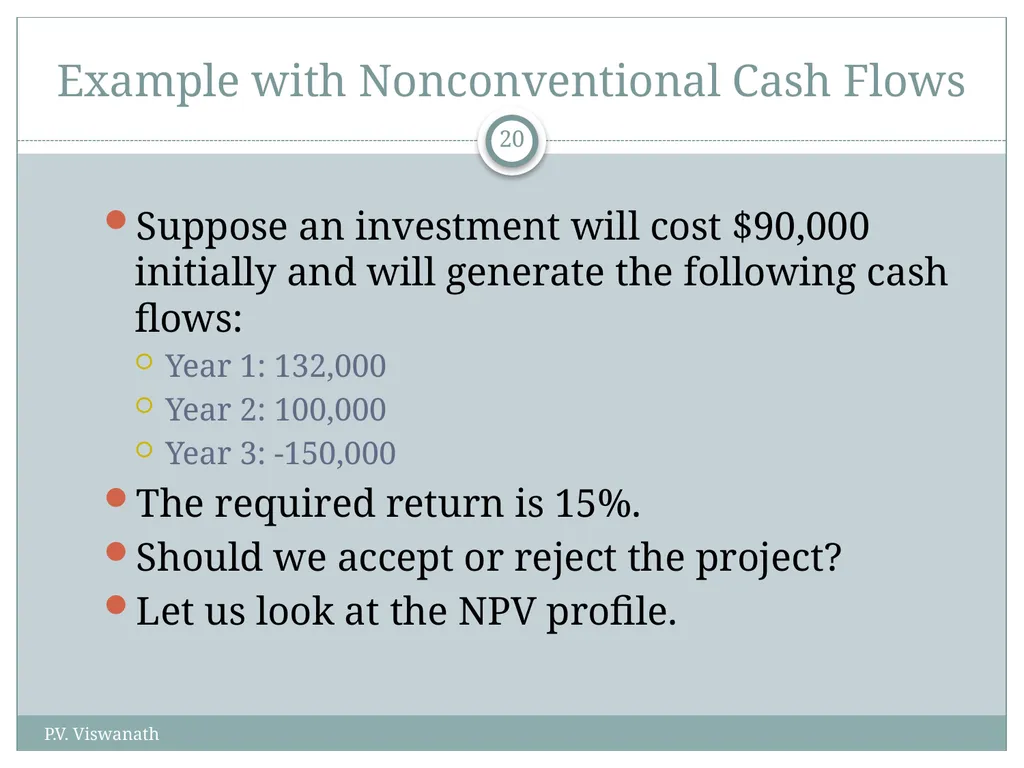
P.V. Viswanath 20 Example with Nonconventional Cash Flows Suppose an investment will cost $90,000 initially and will generate the following cash flows:
Year 1: 132,000
Year 2: 100,000
Year 3: -150,000
The required return is 15%.
Should we accept or reject the project?
Let us look at the NPV profile.<br>
Year 1: 132,000
Year 2: 100,000
Year 3: -150,000
The required return is 15%.
Should we accept or reject the project?
Let us look at the NPV profile.<br>
21
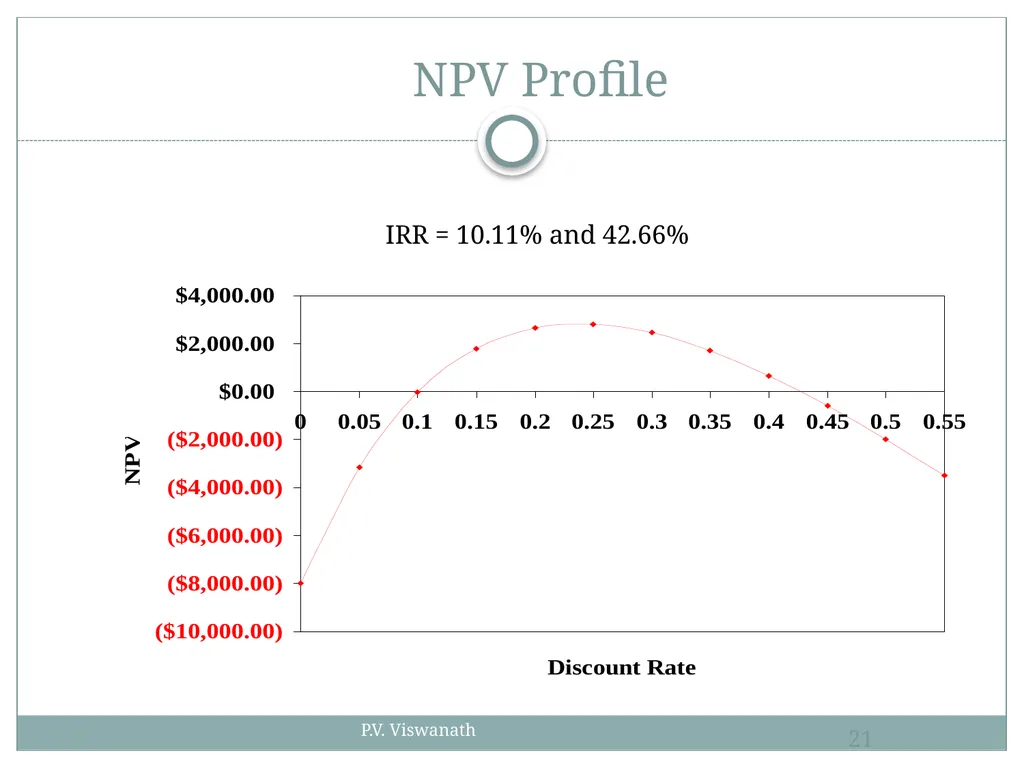
P.V. Viswanath 21 NPV Profile IRR = 10.11% and 42.66%<br>
22
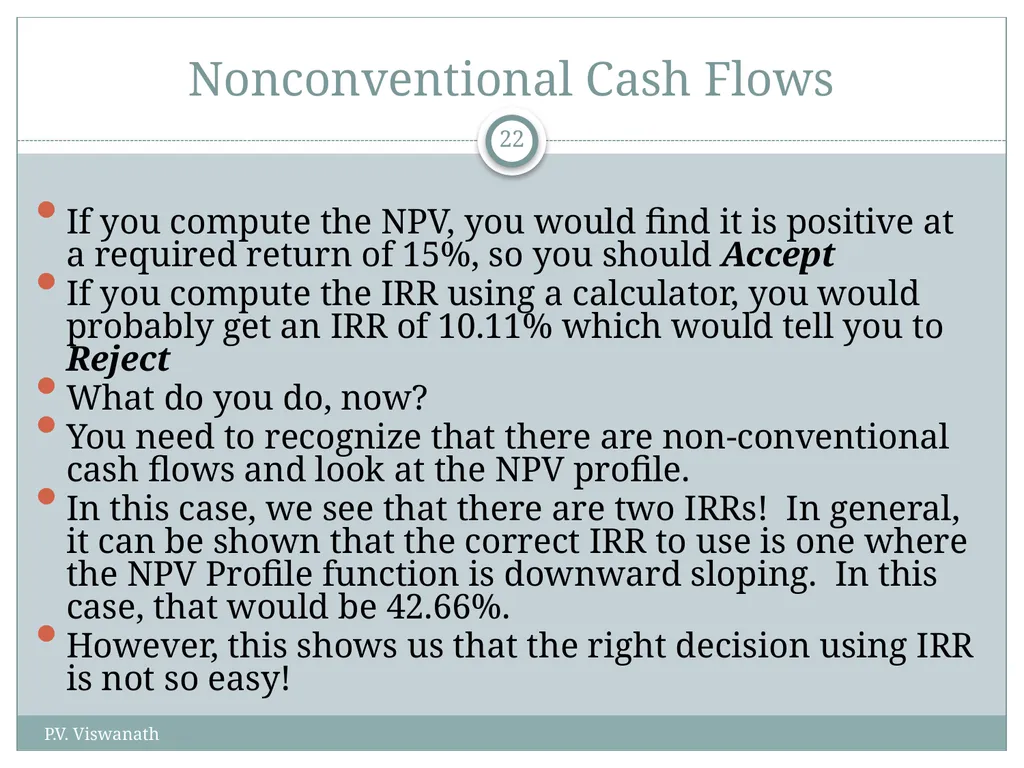
P.V. Viswanath 22 Nonconventional Cash Flows If you compute the NPV, you would find it is positive at a required return of 15%, so you should Accept
If you compute the IRR using a calculator, you would probably get an IRR of 10.11% which would tell you to Reject
What do you do, now?
You need to recognize that there are non-conventional cash flows and look at the NPV profile.
In this case, we see that there are two IRRs! In general, it can be shown that the correct IRR to use is one where the NPV Profile function is downward sloping. In this case, that would be 42.66%.
However, this shows us that the right decision using IRR is not so easy!<br>
If you compute the IRR using a calculator, you would probably get an IRR of 10.11% which would tell you to Reject
What do you do, now?
You need to recognize that there are non-conventional cash flows and look at the NPV profile.
In this case, we see that there are two IRRs! In general, it can be shown that the correct IRR to use is one where the NPV Profile function is downward sloping. In this case, that would be 42.66%.
However, this shows us that the right decision using IRR is not so easy!<br>
23
P.V. Viswanath 23 IRR and Mutually Exclusive Projects Mutually exclusive projects
If you choose one, you can’t choose the other
Example: You can choose to attend graduate school next year at either Harvard or Stanford, but not both
Intuitively you would use the following decision rules:
NPV – choose the project with the higher NPV
IRR – choose the project with the higher IRR
But look at the following project<br>
If you choose one, you can’t choose the other
Example: You can choose to attend graduate school next year at either Harvard or Stanford, but not both
Intuitively you would use the following decision rules:
NPV – choose the project with the higher NPV
IRR – choose the project with the higher IRR
But look at the following project<br>
24
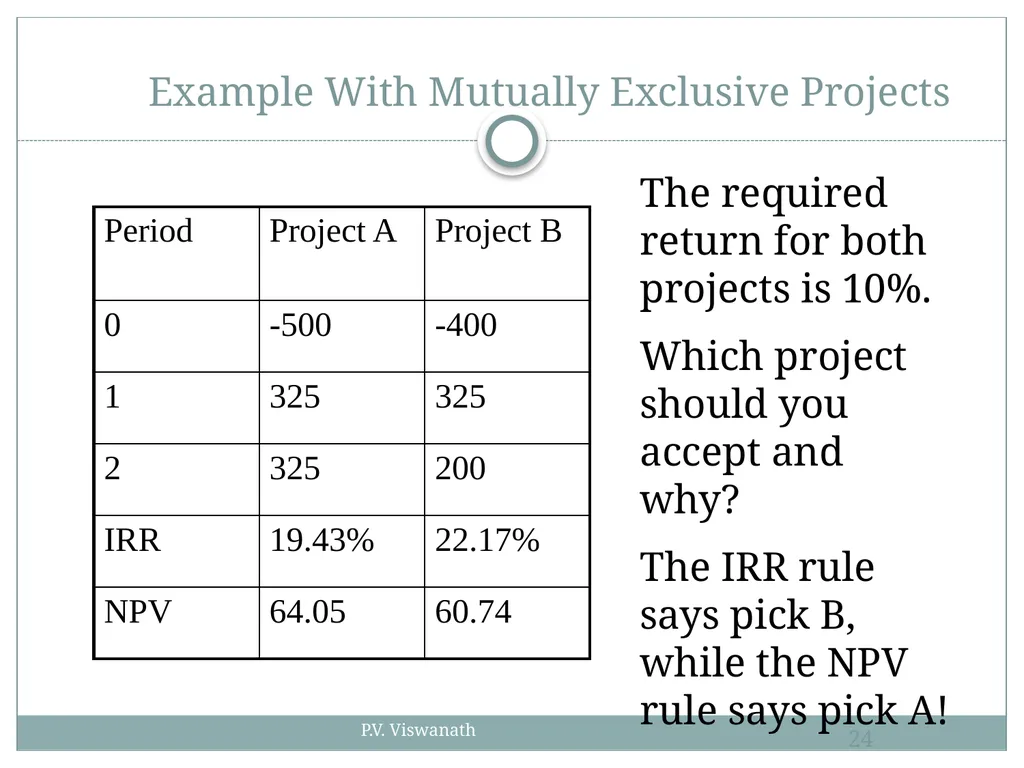
P.V. Viswanath 24 Example With Mutually Exclusive Projects The required return for both projects is 10%.
Which project should you accept and why?
The IRR rule says pick B, while the NPV rule says pick A!<br>
Which project should you accept and why?
The IRR rule says pick B, while the NPV rule says pick A!<br>
25
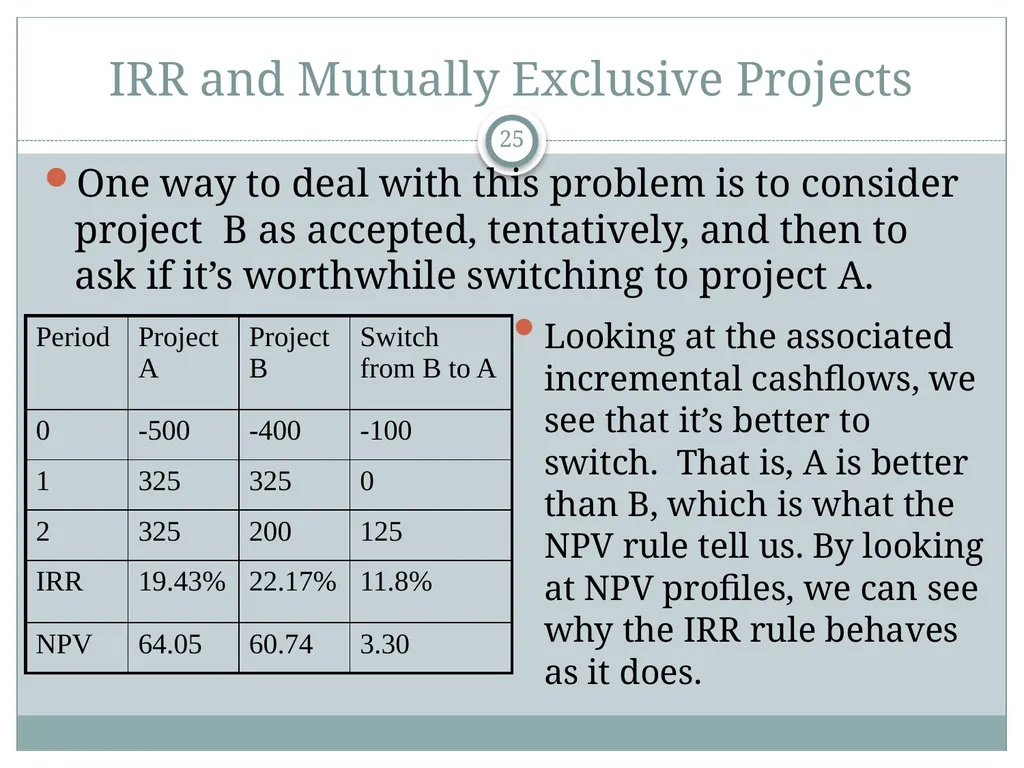
IRR and Mutually Exclusive Projects 25 One way to deal with this problem is to consider project B as accepted, tentatively, and then to ask if it’s worthwhile switching to project A. Looking at the associated incremental cashflows, we see that it’s better to switch. That is, A is better than B, which is what the NPV rule tell us. By looking at NPV profiles, we can see why the IRR rule behaves as it does.<br>
26
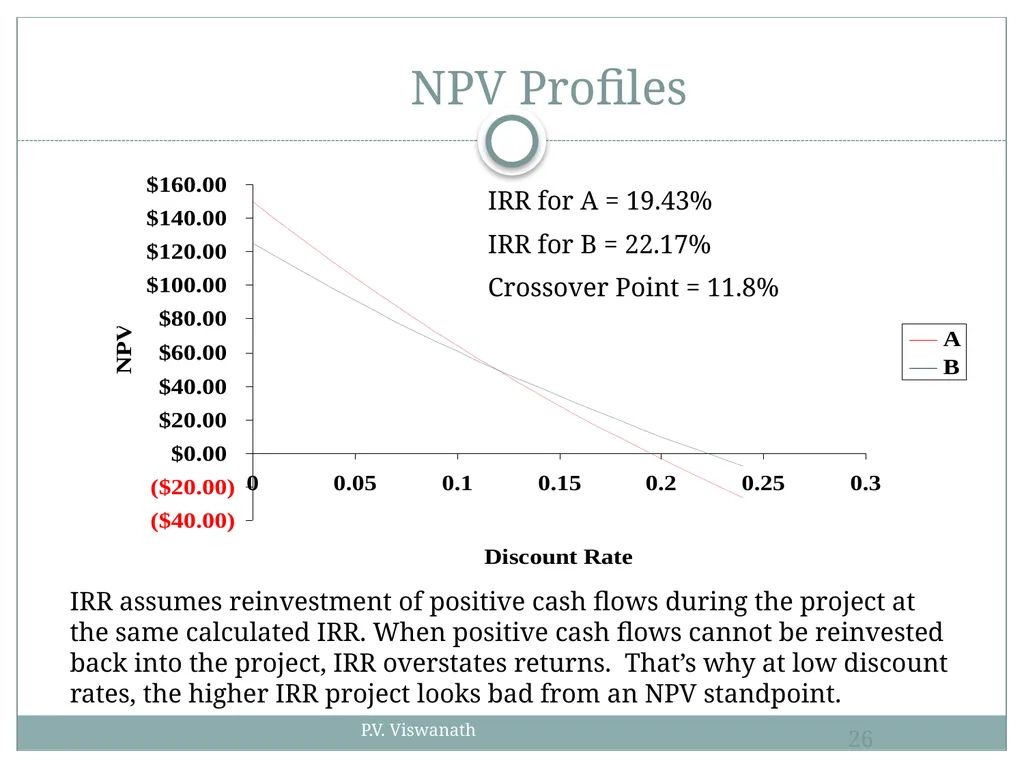
P.V. Viswanath 26 NPV Profiles IRR for A = 19.43%
IRR for B = 22.17%
Crossover Point = 11.8% IRR assumes reinvestment of positive cash flows during the project at the same calculated IRR. When positive cash flows cannot be reinvested back into the project, IRR overstates returns. That’s why at low discount rates, the higher IRR project looks bad from an NPV standpoint.<br>
IRR for B = 22.17%
Crossover Point = 11.8% IRR assumes reinvestment of positive cash flows during the project at the same calculated IRR. When positive cash flows cannot be reinvested back into the project, IRR overstates returns. That’s why at low discount rates, the higher IRR project looks bad from an NPV standpoint.<br>
27
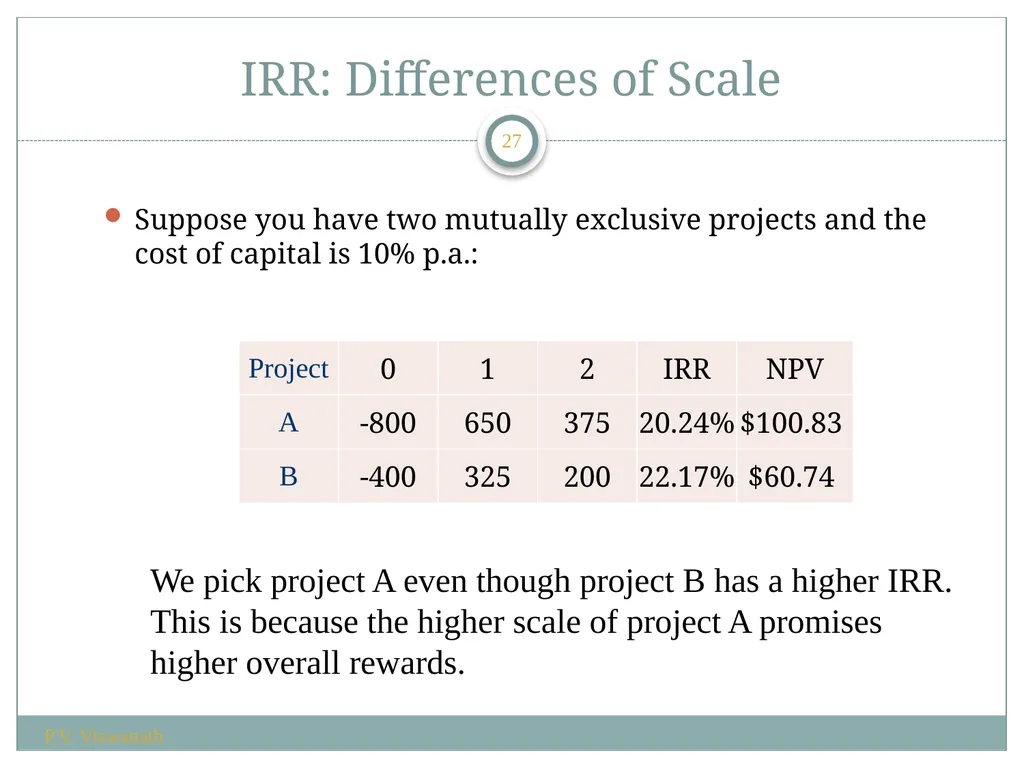
IRR: Differences of Scale Suppose you have two mutually exclusive projects and the cost of capital is 10% p.a.: P.V. Viswanath 27 We pick project A even though project B has a higher IRR.
This is because the higher scale of project A promises higher overall rewards.<br>
This is because the higher scale of project A promises higher overall rewards.<br>
28
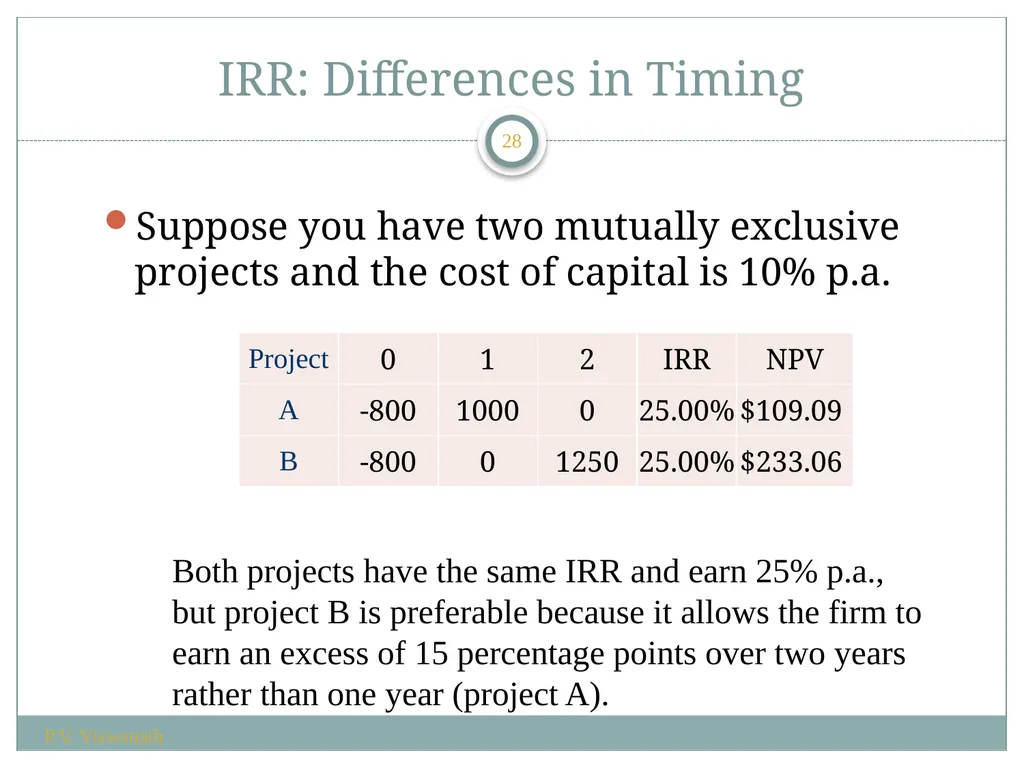
IRR: Differences in Timing Suppose you have two mutually exclusive projects and the cost of capital is 10% p.a. P.V. Viswanath 28 Both projects have the same IRR and earn 25% p.a., but project B is preferable because it allows the firm to earn an excess of 15 percentage points over two years rather than one year (project A).<br>
29
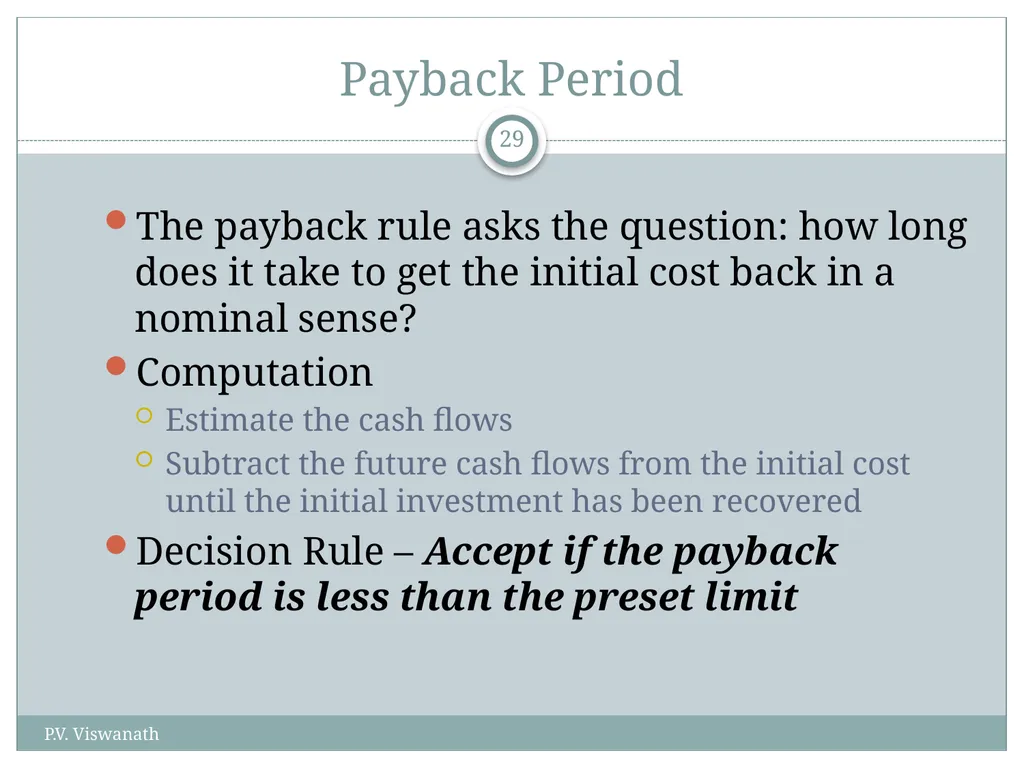
P.V. Viswanath 29 Payback Period The payback rule asks the question: how long does it take to get the initial cost back in a nominal sense?
Computation
Estimate the cash flows
Subtract the future cash flows from the initial cost until the initial investment has been recovered
Decision Rule – Accept if the payback period is less than the preset limit<br>
Computation
Estimate the cash flows
Subtract the future cash flows from the initial cost until the initial investment has been recovered
Decision Rule – Accept if the payback period is less than the preset limit<br>
30
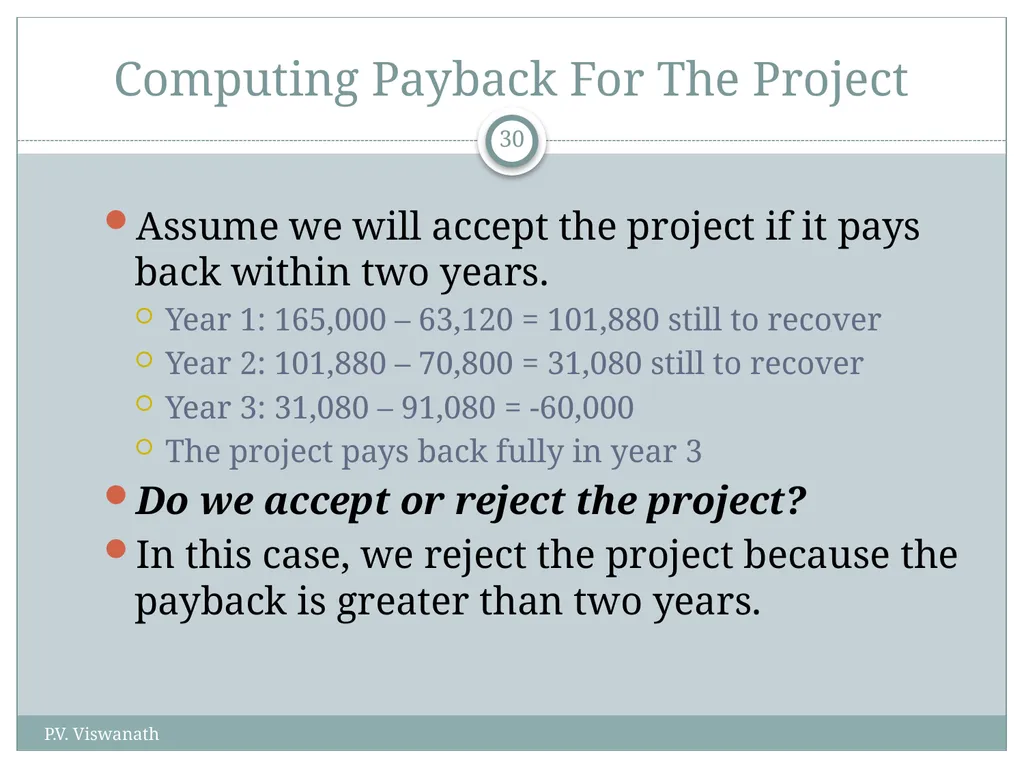
P.V. Viswanath 30 Computing Payback For The Project Assume we will accept the project if it pays back within two years.
Year 1: 165,000 – 63,120 = 101,880 still to recover
Year 2: 101,880 – 70,800 = 31,080 still to recover
Year 3: 31,080 – 91,080 = -60,000
The project pays back fully in year 3
Do we accept or reject the project?
In this case, we reject the project because the payback is greater than two years.<br>
Year 1: 165,000 – 63,120 = 101,880 still to recover
Year 2: 101,880 – 70,800 = 31,080 still to recover
Year 3: 31,080 – 91,080 = -60,000
The project pays back fully in year 3
Do we accept or reject the project?
In this case, we reject the project because the payback is greater than two years.<br>
31
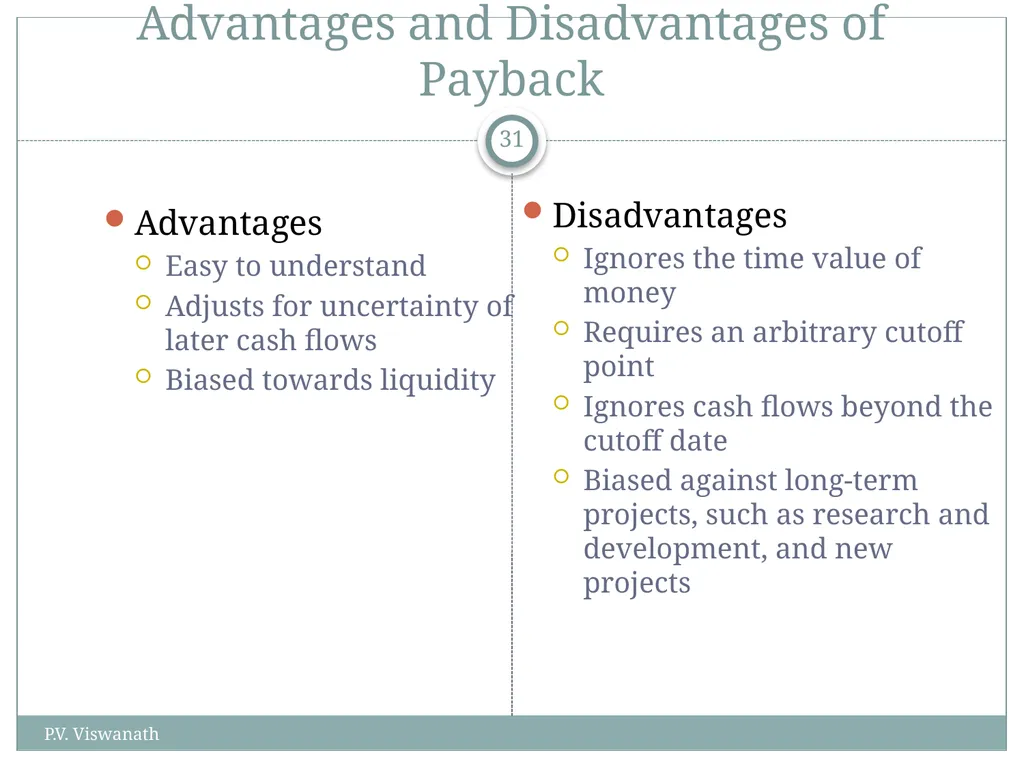
P.V. Viswanath 31 Advantages and Disadvantages of Payback Advantages
Easy to understand
Adjusts for uncertainty of later cash flows
Biased towards liquidity Disadvantages
Ignores the time value of money
Requires an arbitrary cutoff point
Ignores cash flows beyond the cutoff date
Biased against long-term projects, such as research and development, and new projects<br>
Easy to understand
Adjusts for uncertainty of later cash flows
Biased towards liquidity Disadvantages
Ignores the time value of money
Requires an arbitrary cutoff point
Ignores cash flows beyond the cutoff date
Biased against long-term projects, such as research and development, and new projects<br>
32
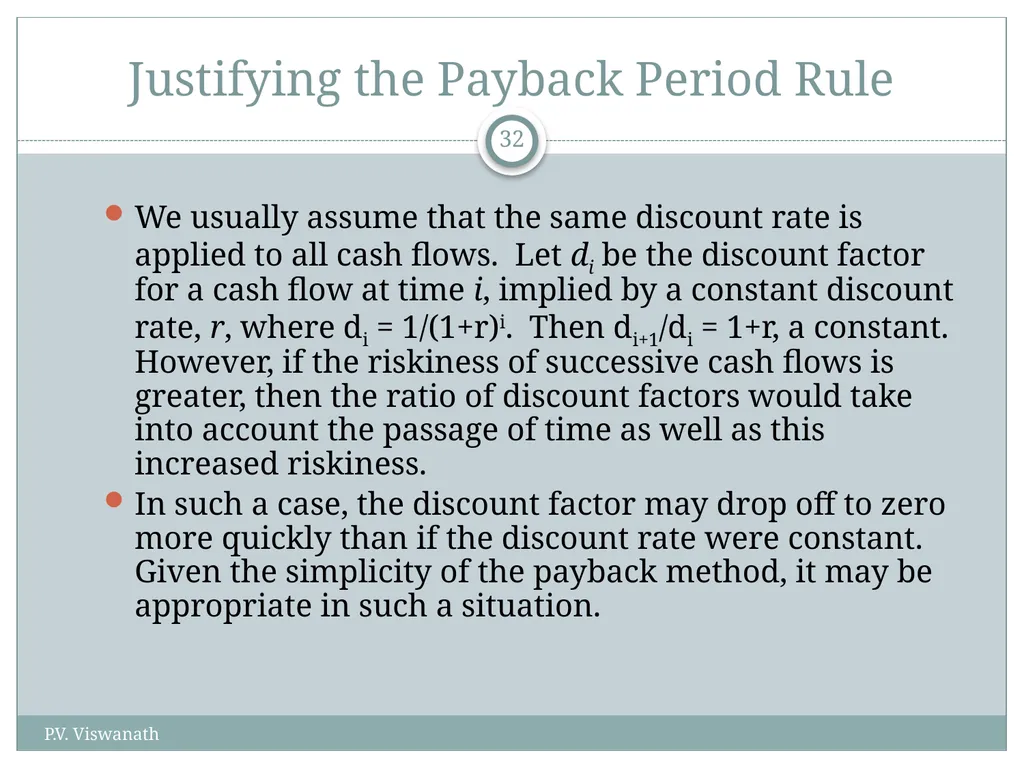
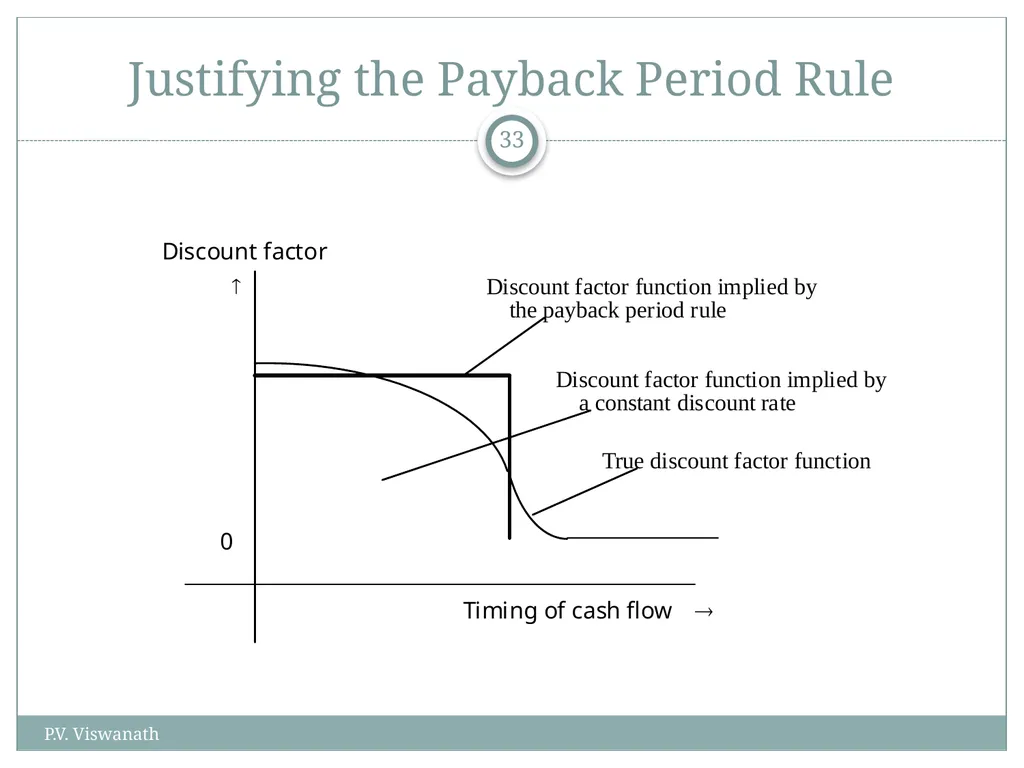
P.V. Viswanath 32 Justifying the Payback Period Rule We usually assume that the same discount rate is applied to all cash flows. Let di be the discount factor for a cash flow at time i, implied by a constant discount rate, r, where di = 1/(1+r)i. Then di+1/di = 1+r, a constant. However, if the riskiness of successive cash flows is greater, then the ratio of discount factors would take into account the passage of time as well as this increased riskiness.
In such a case, the discount factor may drop off to zero more quickly than if the discount rate were constant. Given the simplicity of the payback method, it may be appropriate in such a situation.<br>
In such a case, the discount factor may drop off to zero more quickly than if the discount rate were constant. Given the simplicity of the payback method, it may be appropriate in such a situation.<br>
33
P.V. Viswanath 33 Justifying the Payback Period Rule<br>
34
P.V. Viswanath 34 Average Accounting Return There are many different definitions for average accounting return (AAR).
The one we use is:
Average net income / average book value
Note that the average book value depends on how the asset is depreciated.
Need to have a target cutoff rate
Decision Rule: Accept the project if the AAR is greater than a preset rate.<br>
The one we use is:
Average net income / average book value
Note that the average book value depends on how the asset is depreciated.
Need to have a target cutoff rate
Decision Rule: Accept the project if the AAR is greater than a preset rate.<br>
35
P.V. Viswanath 35 Computing AAR For The Project Assume we require an average accounting return of 25%.
Average Net Income:
(13,620 + 3,300 + 29,100) / 3 = 15,340
AAR = 15,340 / 72,000 = .213 = 21.3%
Do we accept or reject the project?
In this case, we reject the project because its AAR is less than the cutoff of 25%.<br>
Average Net Income:
(13,620 + 3,300 + 29,100) / 3 = 15,340
AAR = 15,340 / 72,000 = .213 = 21.3%
Do we accept or reject the project?
In this case, we reject the project because its AAR is less than the cutoff of 25%.<br>
36
P.V. Viswanath 36 Advantages and Disadvantages of AAR Advantages
Easy to calculate
Needed information will usually be available Disadvantages
Not a true rate of return; time value of money is ignored
Uses an arbitrary benchmark cutoff rate
Based on accounting net income and book values, not cash flows and market values<br>
Easy to calculate
Needed information will usually be available Disadvantages
Not a true rate of return; time value of money is ignored
Uses an arbitrary benchmark cutoff rate
Based on accounting net income and book values, not cash flows and market values<br>
37
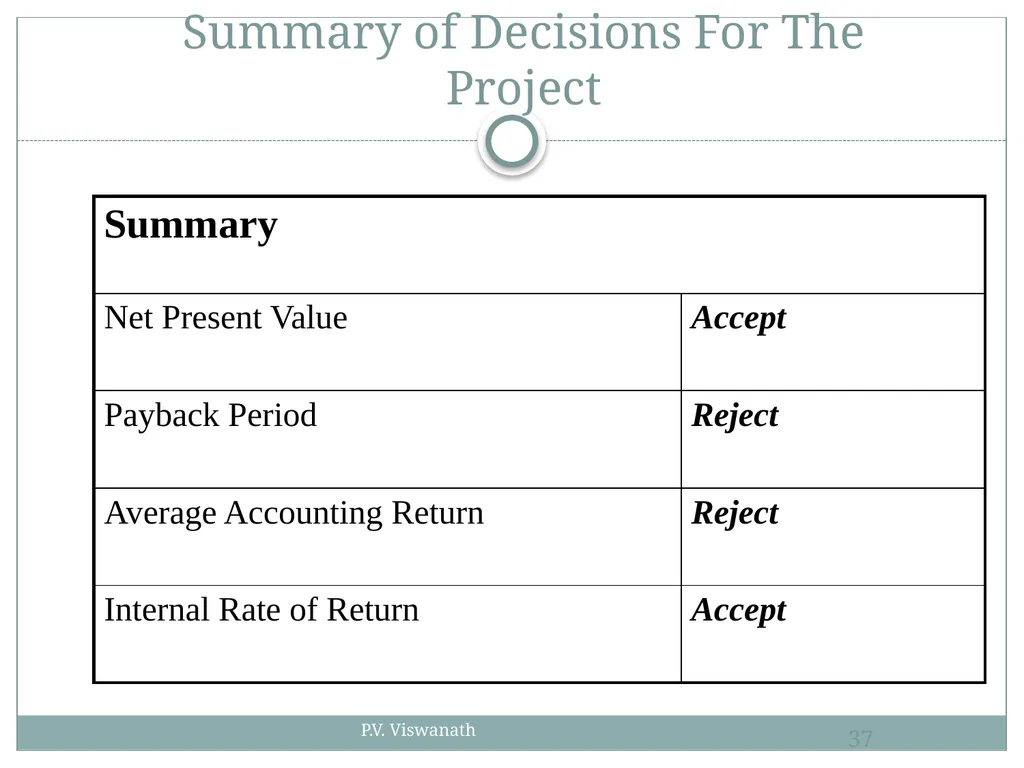
P.V. Viswanath 37 Summary of Decisions For The Project<br>
38
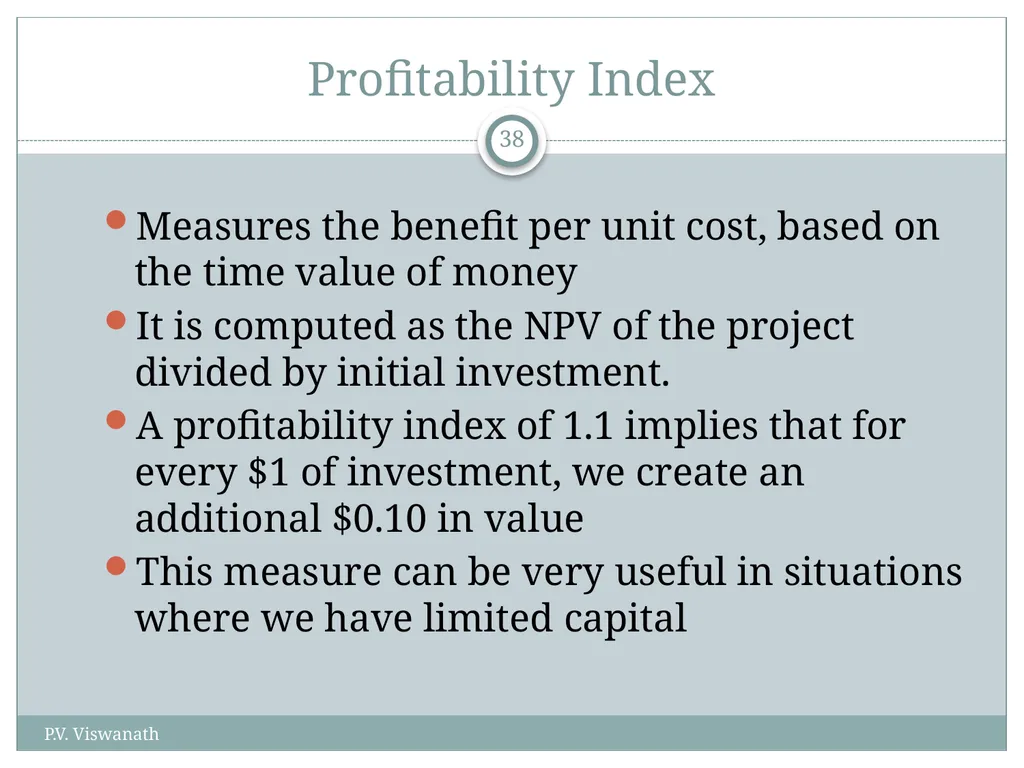
P.V. Viswanath 38 Profitability Index Measures the benefit per unit cost, based on the time value of money
It is computed as the NPV of the project divided by initial investment.
A profitability index of 1.1 implies that for every $1 of investment, we create an additional $0.10 in value
This measure can be very useful in situations where we have limited capital<br>
It is computed as the NPV of the project divided by initial investment.
A profitability index of 1.1 implies that for every $1 of investment, we create an additional $0.10 in value
This measure can be very useful in situations where we have limited capital<br>
39
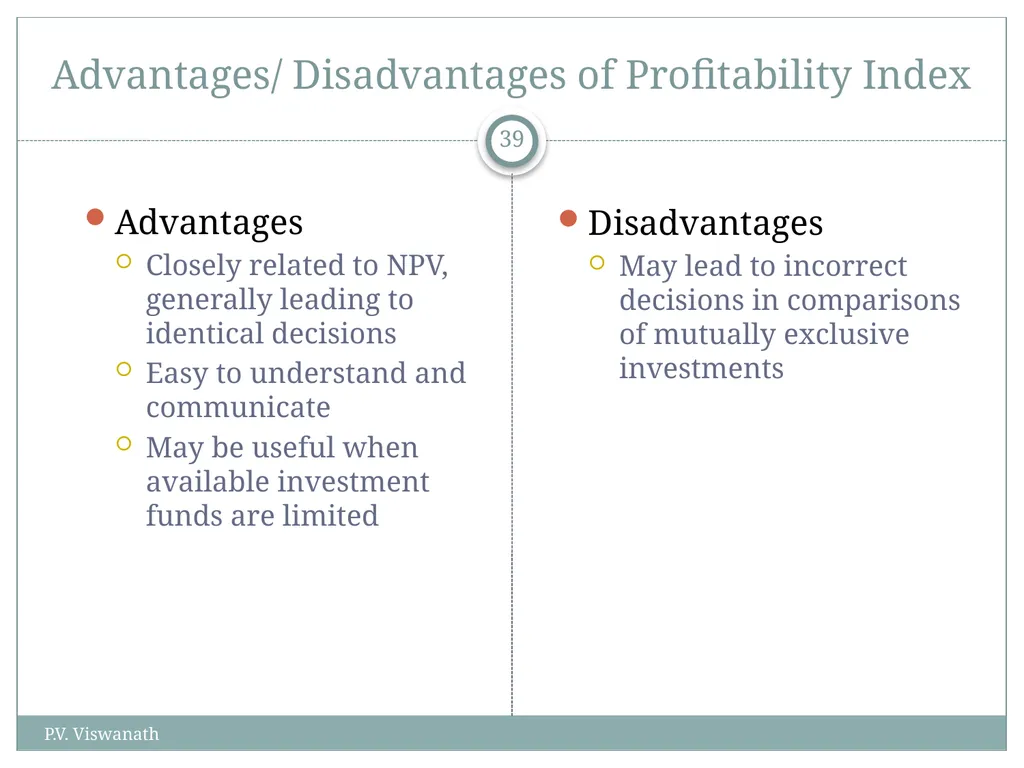
P.V. Viswanath 39 Advantages/ Disadvantages of Profitability Index Advantages
Closely related to NPV, generally leading to identical decisions
Easy to understand and communicate
May be useful when available investment funds are limited Disadvantages
May lead to incorrect decisions in comparisons of mutually exclusive investments<br>
Closely related to NPV, generally leading to identical decisions
Easy to understand and communicate
May be useful when available investment funds are limited Disadvantages
May lead to incorrect decisions in comparisons of mutually exclusive investments<br>
40
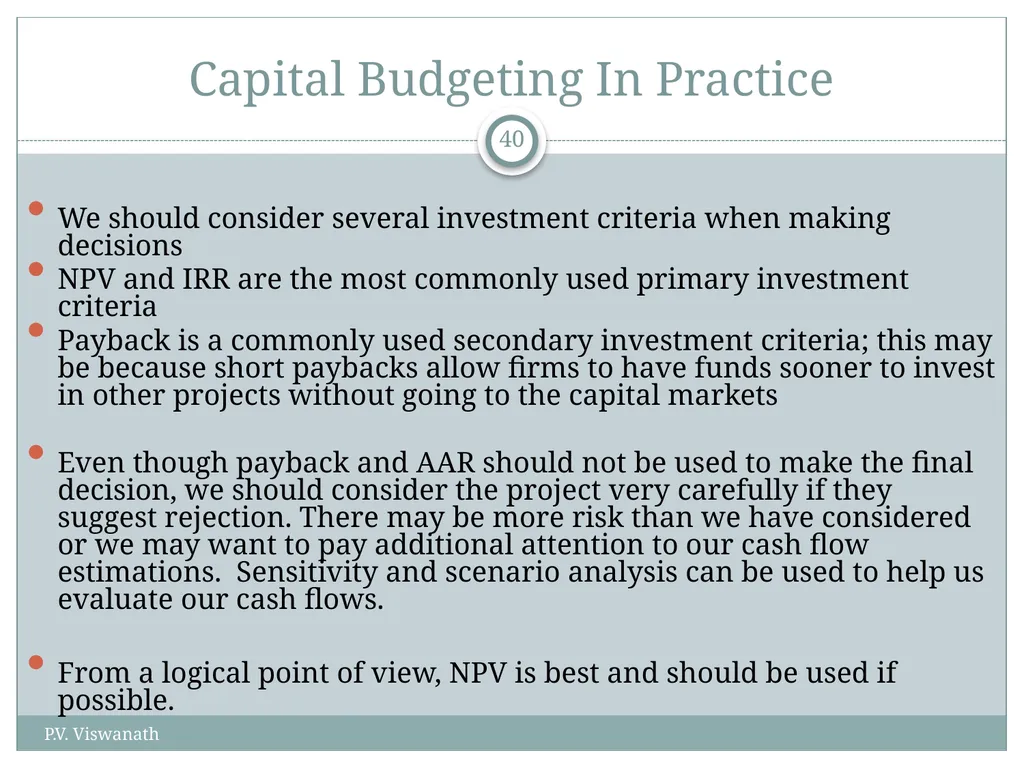
P.V. Viswanath 40 Capital Budgeting In Practice We should consider several investment criteria when making decisions
NPV and IRR are the most commonly used primary investment criteria
Payback is a commonly used secondary investment criteria; this may be because short paybacks allow firms to have funds sooner to invest in other projects without going to the capital markets
Even though payback and AAR should not be used to make the final decision, we should consider the project very carefully if they suggest rejection. There may be more risk than we have considered or we may want to pay additional attention to our cash flow estimations. Sensitivity and scenario analysis can be used to help us evaluate our cash flows.
From a logical point of view, NPV is best and should be used if possible.<br>
NPV and IRR are the most commonly used primary investment criteria
Payback is a commonly used secondary investment criteria; this may be because short paybacks allow firms to have funds sooner to invest in other projects without going to the capital markets
Even though payback and AAR should not be used to make the final decision, we should consider the project very carefully if they suggest rejection. There may be more risk than we have considered or we may want to pay additional attention to our cash flow estimations. Sensitivity and scenario analysis can be used to help us evaluate our cash flows.
From a logical point of view, NPV is best and should be used if possible.<br>