Jar Testing – Simple and Effective 10/19/22 By Guy
Description: Jar Testing Simple and Effective 101922 By Guy Schott, P.E. CA State Water Resources Control Board Division of Drinking Water Jar Testing Simple and Effective Jar Testing Application Lab EquipmentMaterials Analysis (Filterability,
Related Topics
Download Presentation
"Jar Testing – Simple and Effective 10/19/22 By Guy" is the property of its rightful owner. Permission is granted to download and print the materials on this website for personal, non-commercial use only, and to display it on your personal computer provided you do not modify the materials and that you retain all copyright notices contained in the materials. By downloading content from our website, you accept the terms of this agreement.
Presentation Transcript
slide1. Jar Testing – Simple and Effective
10/19/22
By Guy Schott, P.E.
CA State Water Resources Control Board
Division of Drinking Water Jar Testing – Simple and Effective<br>
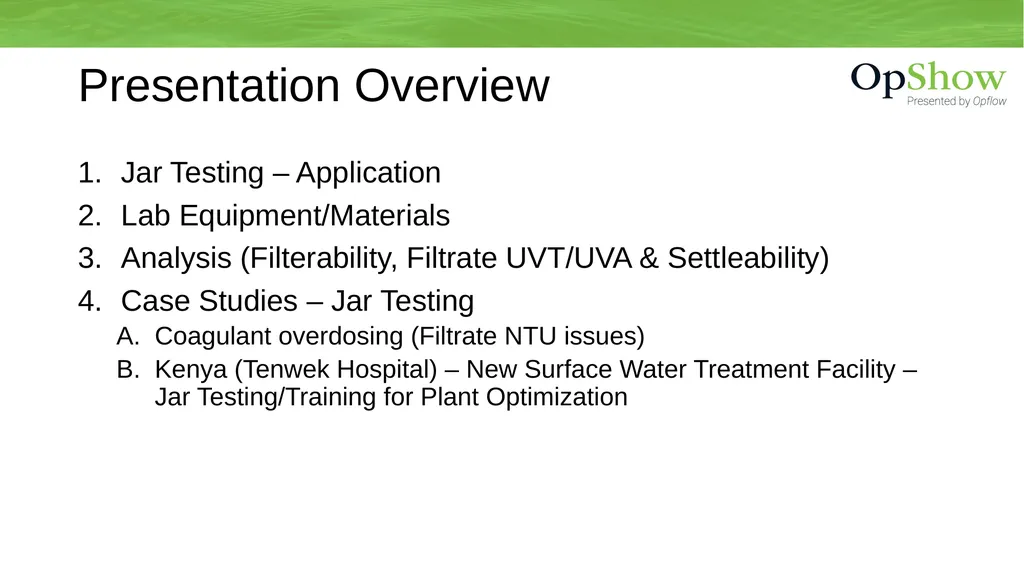
slide2. Jar Testing – Application
Lab Equipment/Materials
Analysis (Filterability, Filtrate UVT/UVA & Settleability)
Case Studies – Jar Testing
Coagulant overdosing (Filtrate NTU issues)
Kenya (Tenwek Hospital) – New Surface Water Treatment Facility – Jar Testing/Training for Plant Optimization Presentation Overview<br>
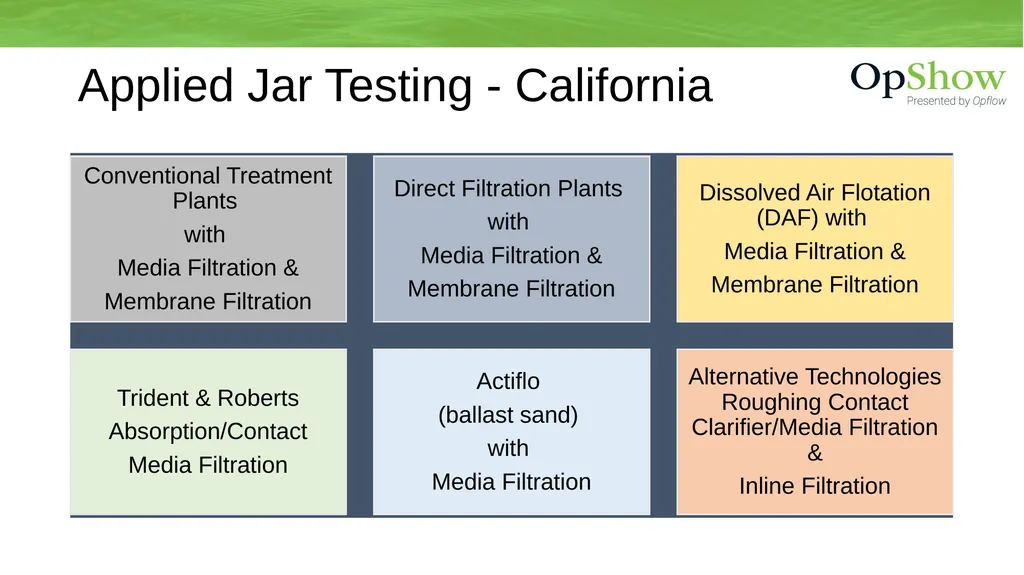
slide3. Applied Jar Testing - California<br>
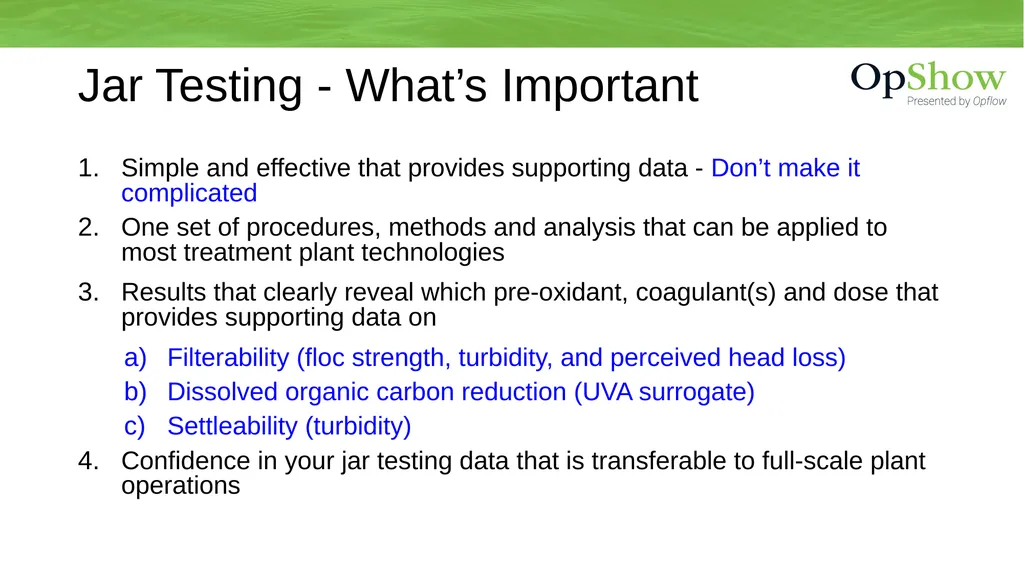
slide4. Simple and effective that provides supporting data - Don’t make it complicated
One set of procedures, methods and analysis that can be applied to most treatment plant technologies
Results that clearly reveal which pre-oxidant, coagulant(s) and dose that provides supporting data on
Filterability (floc strength, turbidity, and perceived head loss)
Dissolved organic carbon reduction (UVA surrogate)
Settleability (turbidity)
Confidence in your jar testing data that is transferable to full-scale plant operations Jar Testing - What’s Important<br>
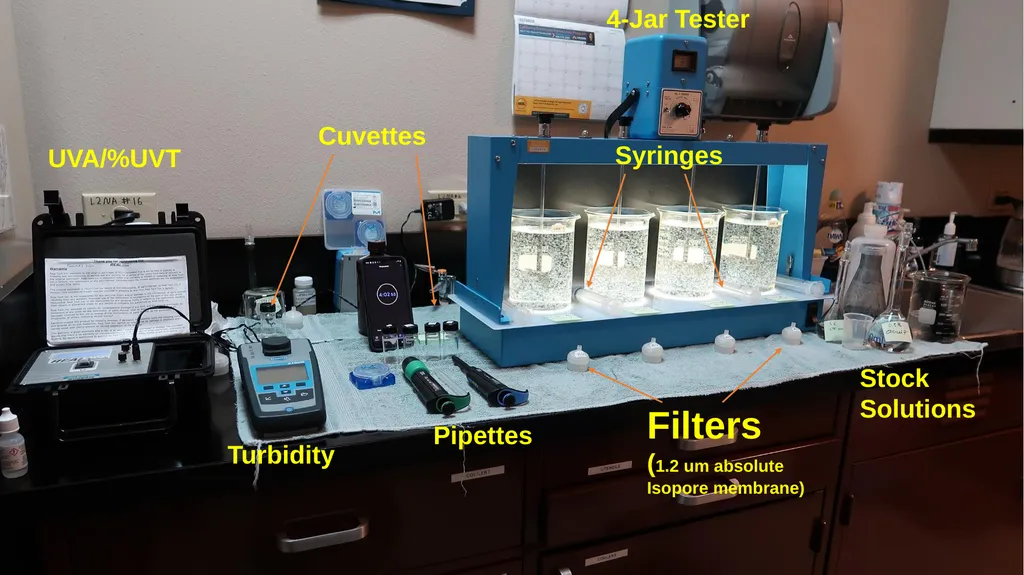
slide5. Lab UVA/%UVT Turbidity Cuvettes Stock
Solutions Pipettes Filters
(1.2 um absolute
Isopore membrane) Syringes 4-Jar Tester<br>
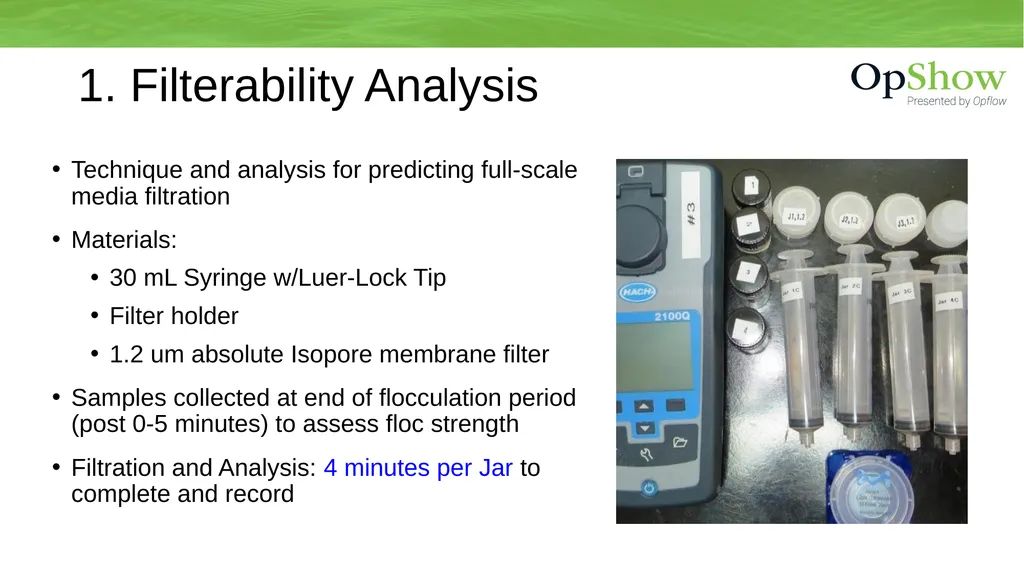
slide6. 1. Filterability Analysis Technique and analysis for predicting full-scale media filtration
Materials:
30 mL Syringe w/Luer-Lock Tip
Filter holder
1.2 um absolute Isopore membrane filter
Samples collected at end of flocculation period (post 0-5 minutes) to assess floc strength
Filtration and Analysis: 4 minutes per Jar to complete and record<br>
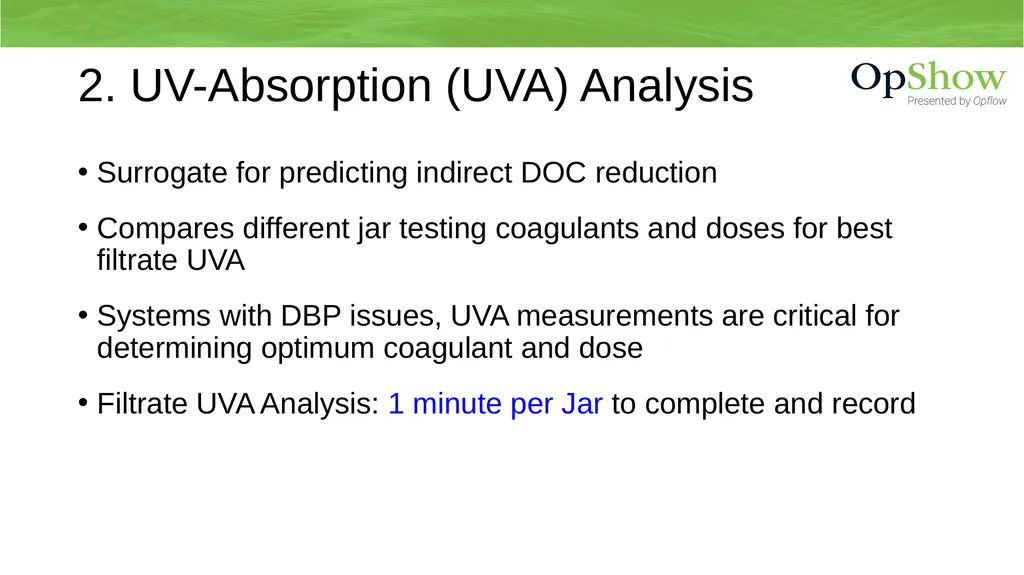
slide7. Surrogate for predicting indirect DOC reduction
Compares different jar testing coagulants and doses for best filtrate UVA
Systems with DBP issues, UVA measurements are critical for determining optimum coagulant and dose
Filtrate UVA Analysis: 1 minute per Jar to complete and record 2. UV-Absorption (UVA) Analysis<br>
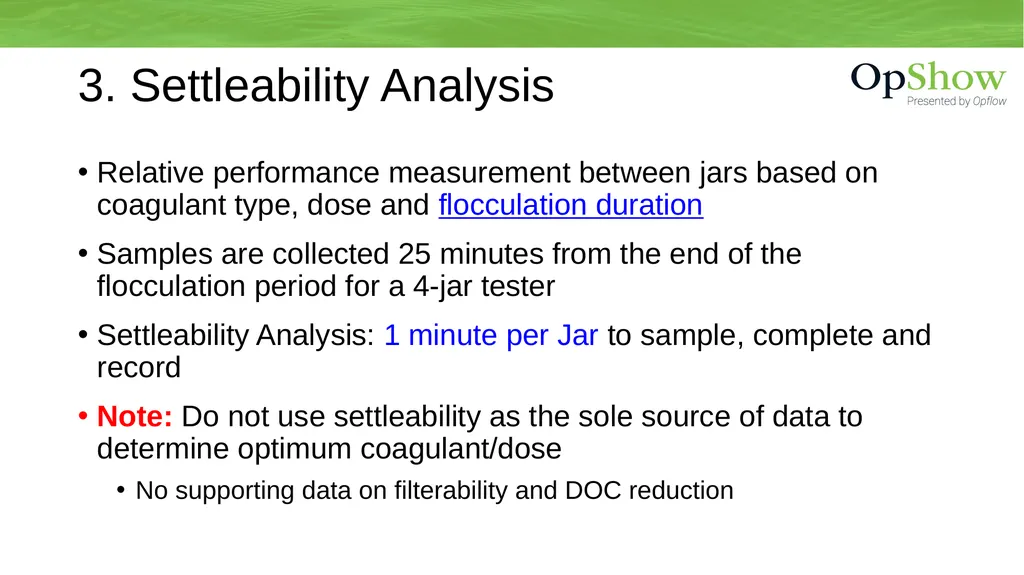
slide8. Relative performance measurement between jars based on coagulant type, dose and flocculation duration
Samples are collected 25 minutes from the end of the flocculation period for a 4-jar tester
Settleability Analysis: 1 minute per Jar to sample, complete and record
Note: Do not use settleability as the sole source of data to determine optimum coagulant/dose
No supporting data on filterability and DOC reduction 3. Settleability Analysis<br>
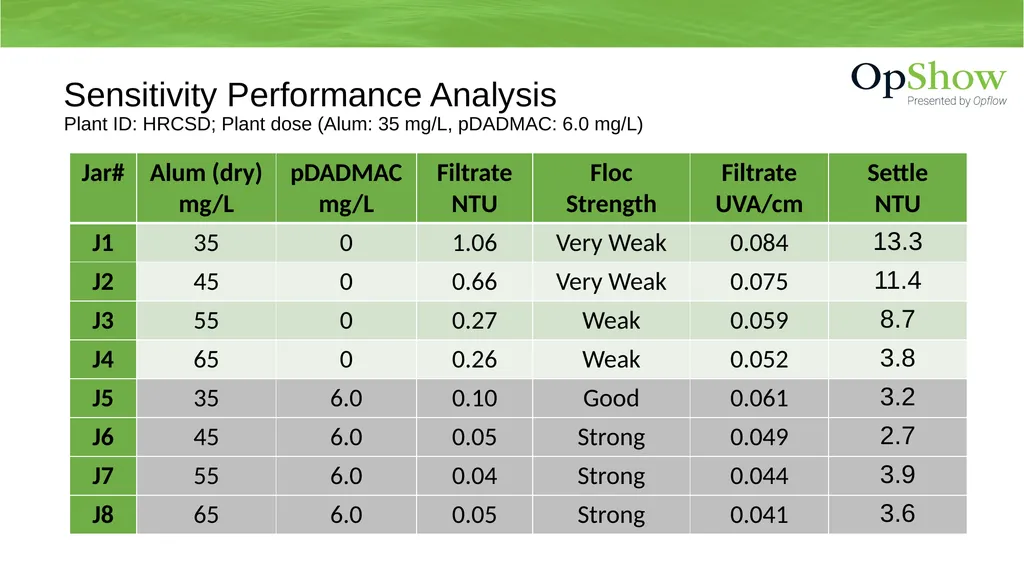
slide9. Sensitivity Performance AnalysisPlant ID: HRCSD; Plant dose (Alum: 35 mg/L, pDADMAC: 6.0 mg/L)<br>
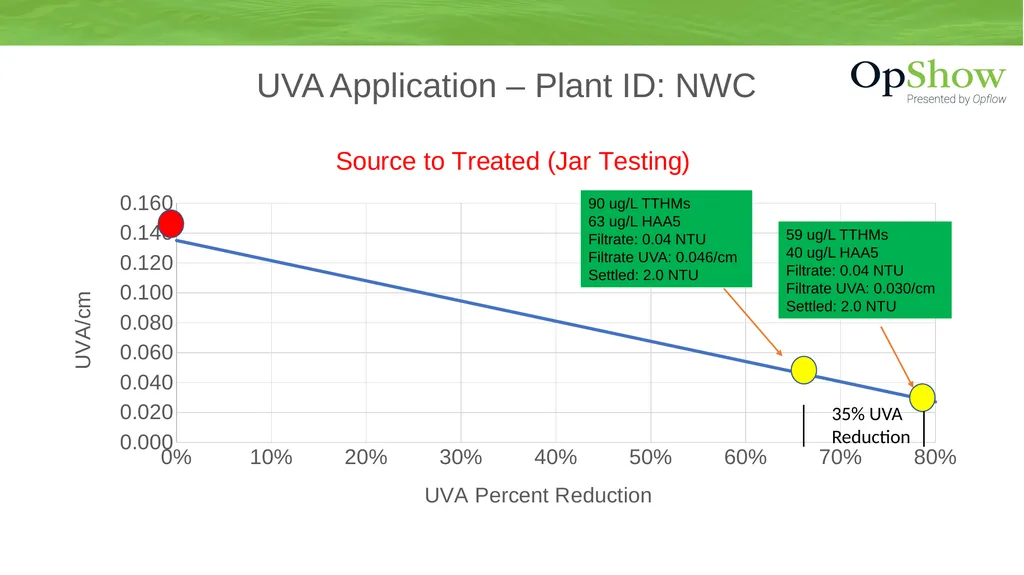
slide10. UVA Application – Plant ID: NWC 90 ug/L TTHMs
63 ug/L HAA5
Filtrate: 0.04 NTU
Filtrate UVA: 0.046/cm
Settled: 2.0 NTU 59 ug/L TTHMs
40 ug/L HAA5
Filtrate: 0.04 NTU
Filtrate UVA: 0.030/cm
Settled: 2.0 NTU 35% UVA
Reduction<br>
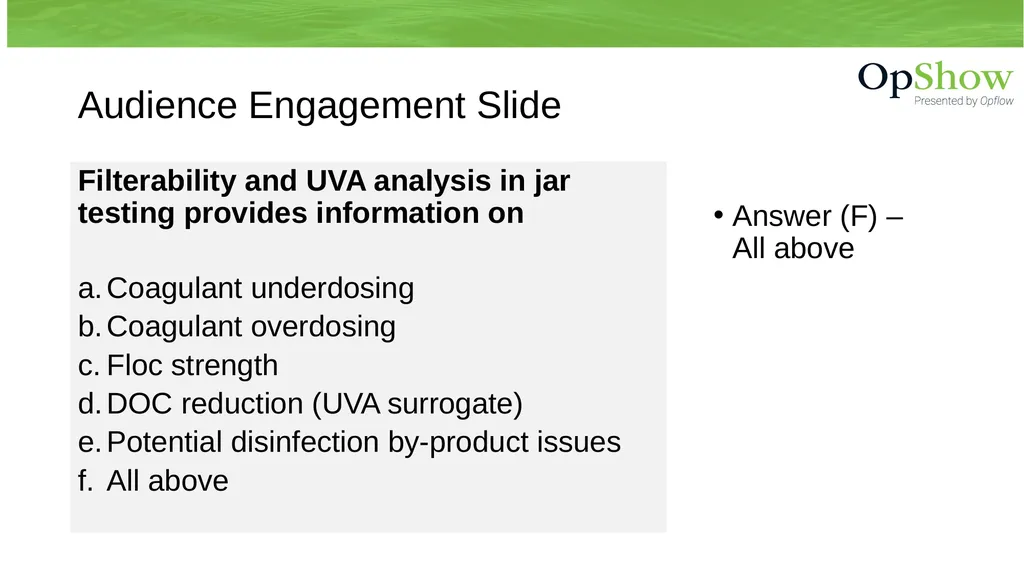
slide11. Audience Engagement Slide Filterability and UVA analysis in jar testing provides information on
Coagulant underdosing
Coagulant overdosing
Floc strength
DOC reduction (UVA surrogate)
Potential disinfection by-product issues
All above Answer (F) – All above<br>
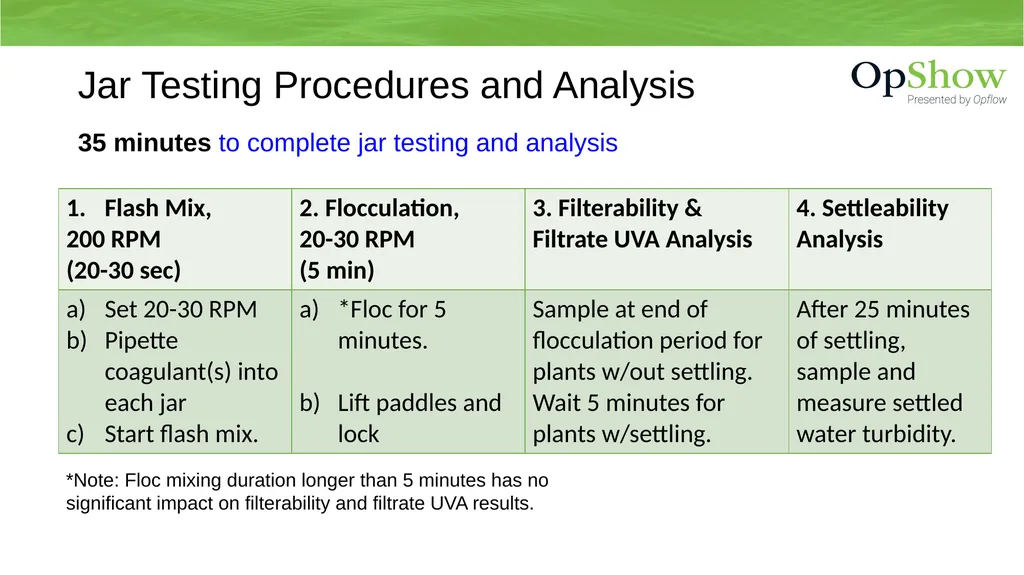
slide12. Jar Testing Procedures and Analysis 35 minutes to complete jar testing and analysis *Note: Floc mixing duration longer than 5 minutes has no significant impact on filterability and filtrate UVA results.<br>
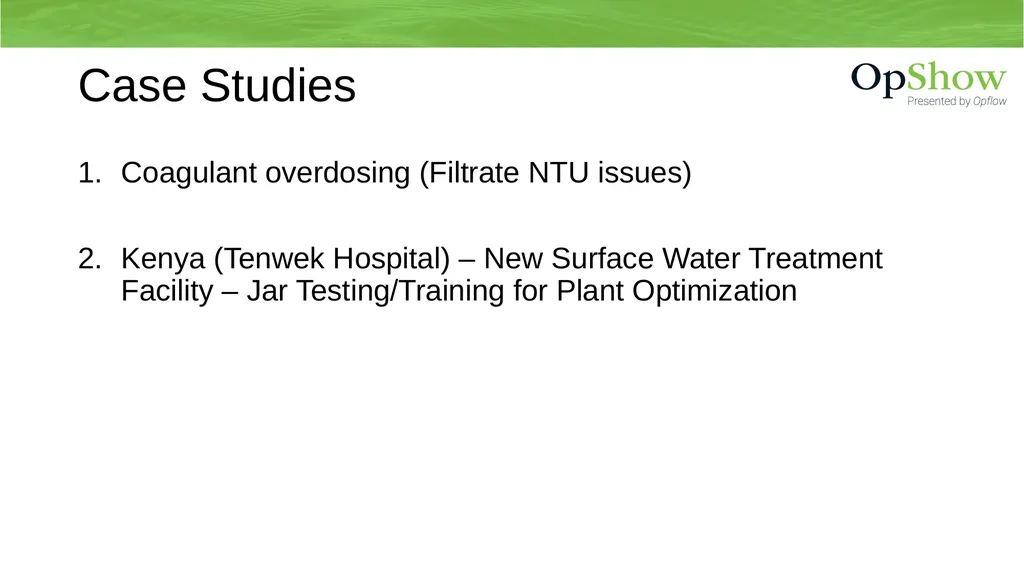
slide13. Coagulant overdosing (Filtrate NTU issues)
Kenya (Tenwek Hospital) – New Surface Water Treatment Facility – Jar Testing/Training for Plant Optimization Case Studies<br>
slide14. 50% of plant off-line for filter media change out
Source turbidity: 126 NTU, storm event
Operator doubles coagulant dose from 55 mg/L to: 110 mg/L
Plant settled water turbidity > 11 NTU
Plant filtrate turbidity: 0.20 - 0.26 NTU
Filter backwashing once per hour
Operator overwhelmed/not enough sleep Case 1: Filterability AnalysisCoagulant Overdosing – Storm Event<br>
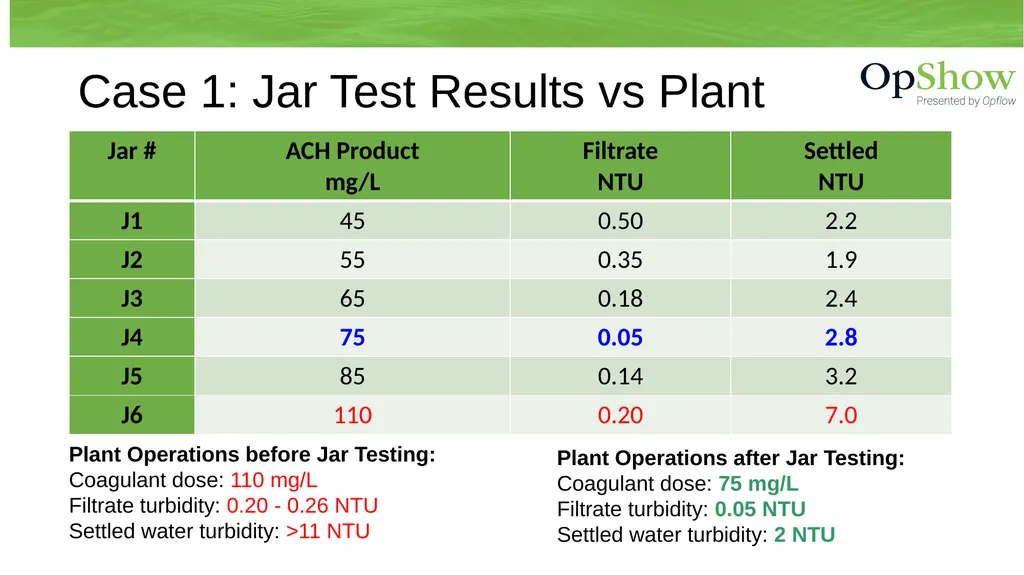
slide15. Case 1: Jar Test Results vs Plant Plant Operations before Jar Testing:
Coagulant dose: 110 mg/L
Filtrate turbidity: 0.20 - 0.26 NTU
Settled water turbidity: >11 NTU Plant Operations after Jar Testing:
Coagulant dose: 75 mg/L
Filtrate turbidity: 0.05 NTU
Settled water turbidity: 2 NTU<br>
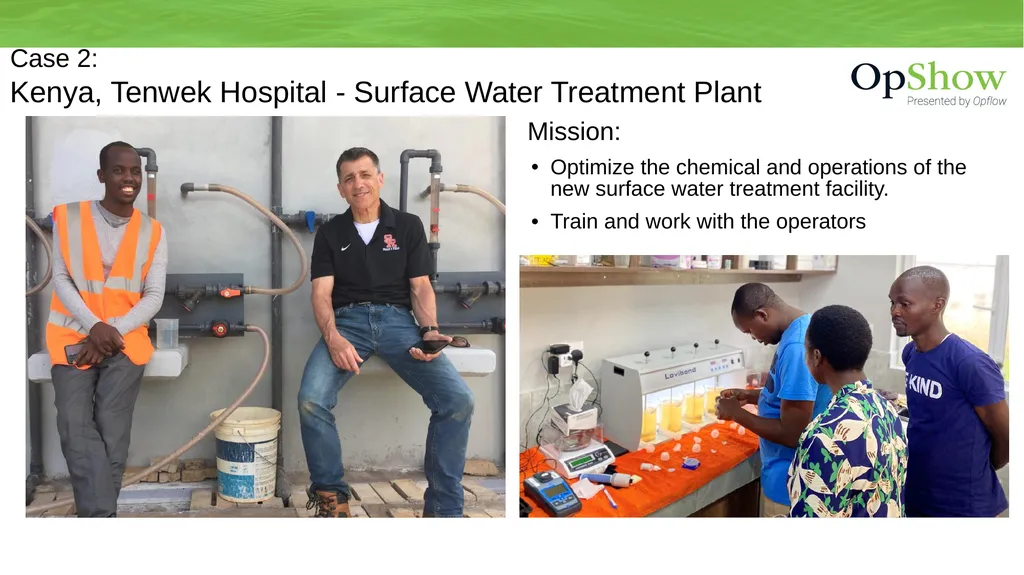
slide16. Kenya, Tenwek Hospital - Surface Water Treatment Plant Mission:
Optimize the chemical and operations of the new surface water treatment facility.
Train and work with the operators Case 2:<br>
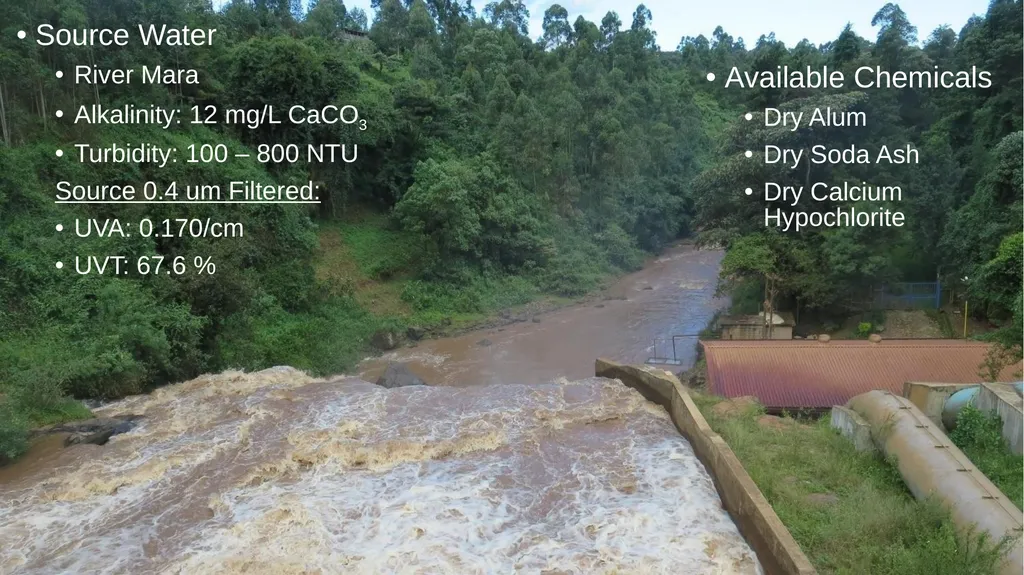
slide17. Source Water
River Mara
Alkalinity: 12 mg/L CaCO3
Turbidity: 100 – 800 NTU
Source 0.4 um Filtered:
UVA: 0.170/cm
UVT: 67.6 % Available Chemicals
Dry Alum
Dry Soda Ash
Dry Calcium Hypochlorite River Mara<br>
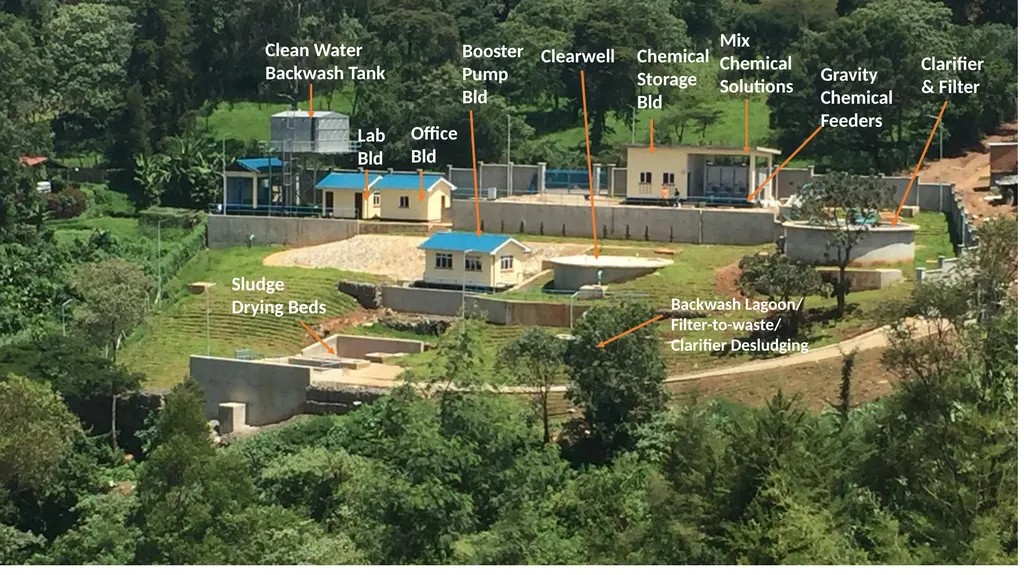
slide18. Sludge
Drying Beds Clean Water
Backwash Tank Lab
Bld Office
Bld Chemical
Storage
Bld Mix
Chemical
Solutions Gravity
Chemical
Feeders Clarifier
& Filter Clearwell Booster
Pump
Bld Backwash Lagoon/
Filter-to-waste/
Clarifier Desludging Treatment Plan<br>
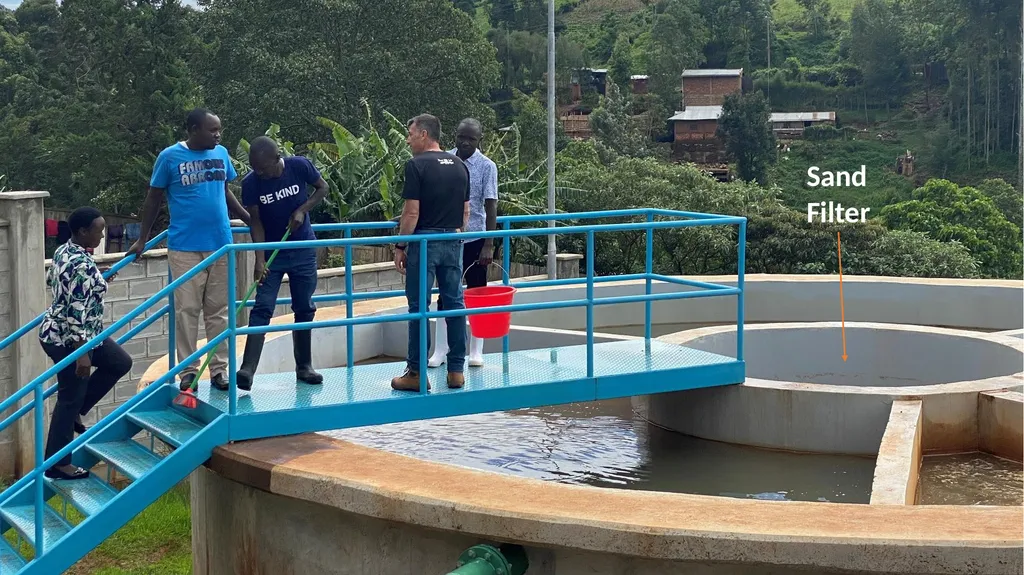
slide19. Sand
Filter Clarifier/Filter<br>
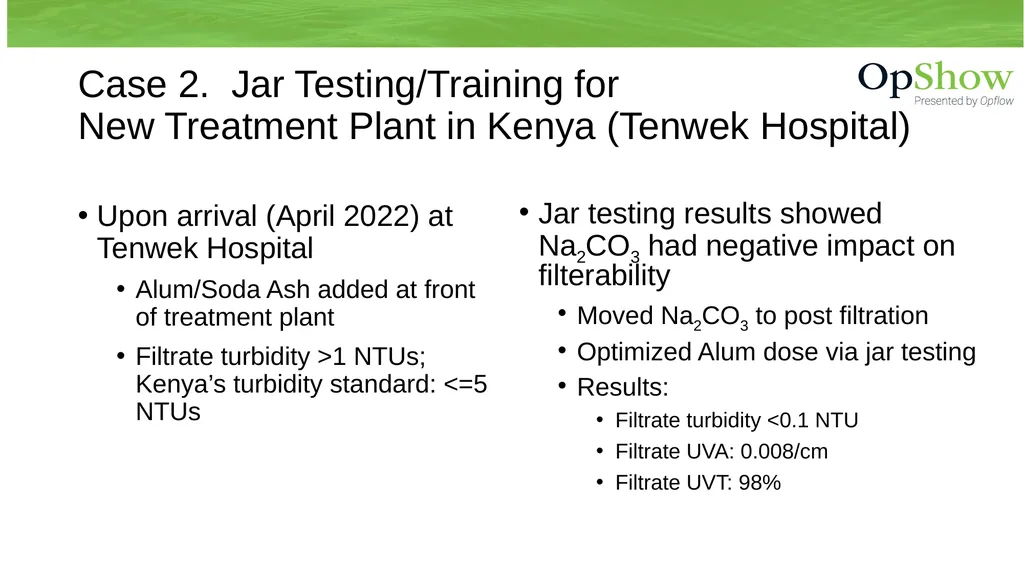
slide20. Case 2. Jar Testing/Training for New Treatment Plant in Kenya (Tenwek Hospital) Upon arrival (April 2022) at Tenwek Hospital
Alum/Soda Ash added at front of treatment plant
Filtrate turbidity >1 NTUs; Kenya’s turbidity standard: <=5 NTUs Jar testing results showed Na2CO3 had negative impact on filterability
Moved Na2CO3 to post filtration
Optimized Alum dose via jar testing
Results:
Filtrate turbidity <0.1 NTU
Filtrate UVA: 0.008/cm
Filtrate UVT: 98%<br>
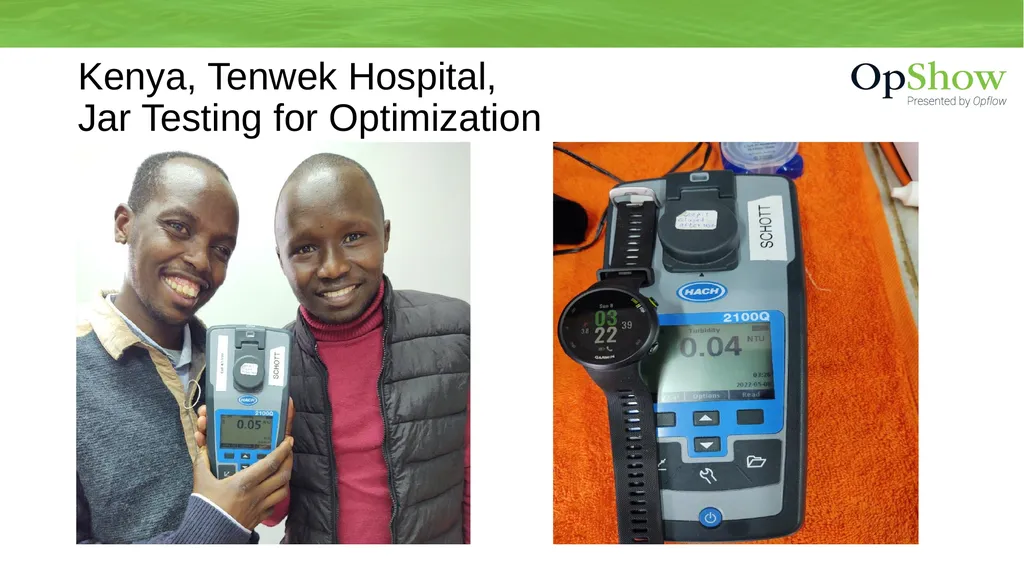
slide21. Kenya, Tenwek Hospital, Jar Testing for Optimization<br>
slide22. Thank you for attending!Contact and Links Guy Schott, P.E.
State Water Resources Control Board
Division of Drinking Water, Santa Rosa, CA
Go to Jar Test Results/Procedures for tools to download
www.waterboards.ca.gov/drinking_water/programs/districts/mendocino_district.html
Jar Testing Done Right video training https://youtu.be/aGByyxhelkI
Email: Guy Schott - Guy.Schott@waterboards.ca.gov<br>

10/19/22
By Guy Schott, P.E.
CA State Water Resources Control Board
Division of Drinking Water Jar Testing – Simple and Effective<br>
slide2. Jar Testing – Application
Lab Equipment/Materials
Analysis (Filterability, Filtrate UVT/UVA & Settleability)
Case Studies – Jar Testing
Coagulant overdosing (Filtrate NTU issues)
Kenya (Tenwek Hospital) – New Surface Water Treatment Facility – Jar Testing/Training for Plant Optimization Presentation Overview<br>
slide3. Applied Jar Testing - California<br>
slide4. Simple and effective that provides supporting data - Don’t make it complicated
One set of procedures, methods and analysis that can be applied to most treatment plant technologies
Results that clearly reveal which pre-oxidant, coagulant(s) and dose that provides supporting data on
Filterability (floc strength, turbidity, and perceived head loss)
Dissolved organic carbon reduction (UVA surrogate)
Settleability (turbidity)
Confidence in your jar testing data that is transferable to full-scale plant operations Jar Testing - What’s Important<br>
slide5. Lab UVA/%UVT Turbidity Cuvettes Stock
Solutions Pipettes Filters
(1.2 um absolute
Isopore membrane) Syringes 4-Jar Tester<br>
slide6. 1. Filterability Analysis Technique and analysis for predicting full-scale media filtration
Materials:
30 mL Syringe w/Luer-Lock Tip
Filter holder
1.2 um absolute Isopore membrane filter
Samples collected at end of flocculation period (post 0-5 minutes) to assess floc strength
Filtration and Analysis: 4 minutes per Jar to complete and record<br>
slide7. Surrogate for predicting indirect DOC reduction
Compares different jar testing coagulants and doses for best filtrate UVA
Systems with DBP issues, UVA measurements are critical for determining optimum coagulant and dose
Filtrate UVA Analysis: 1 minute per Jar to complete and record 2. UV-Absorption (UVA) Analysis<br>
slide8. Relative performance measurement between jars based on coagulant type, dose and flocculation duration
Samples are collected 25 minutes from the end of the flocculation period for a 4-jar tester
Settleability Analysis: 1 minute per Jar to sample, complete and record
Note: Do not use settleability as the sole source of data to determine optimum coagulant/dose
No supporting data on filterability and DOC reduction 3. Settleability Analysis<br>
slide9. Sensitivity Performance AnalysisPlant ID: HRCSD; Plant dose (Alum: 35 mg/L, pDADMAC: 6.0 mg/L)<br>
slide10. UVA Application – Plant ID: NWC 90 ug/L TTHMs
63 ug/L HAA5
Filtrate: 0.04 NTU
Filtrate UVA: 0.046/cm
Settled: 2.0 NTU 59 ug/L TTHMs
40 ug/L HAA5
Filtrate: 0.04 NTU
Filtrate UVA: 0.030/cm
Settled: 2.0 NTU 35% UVA
Reduction<br>
slide11. Audience Engagement Slide Filterability and UVA analysis in jar testing provides information on
Coagulant underdosing
Coagulant overdosing
Floc strength
DOC reduction (UVA surrogate)
Potential disinfection by-product issues
All above Answer (F) – All above<br>
slide12. Jar Testing Procedures and Analysis 35 minutes to complete jar testing and analysis *Note: Floc mixing duration longer than 5 minutes has no significant impact on filterability and filtrate UVA results.<br>
slide13. Coagulant overdosing (Filtrate NTU issues)
Kenya (Tenwek Hospital) – New Surface Water Treatment Facility – Jar Testing/Training for Plant Optimization Case Studies<br>
slide14. 50% of plant off-line for filter media change out
Source turbidity: 126 NTU, storm event
Operator doubles coagulant dose from 55 mg/L to: 110 mg/L
Plant settled water turbidity > 11 NTU
Plant filtrate turbidity: 0.20 - 0.26 NTU
Filter backwashing once per hour
Operator overwhelmed/not enough sleep Case 1: Filterability AnalysisCoagulant Overdosing – Storm Event<br>
slide15. Case 1: Jar Test Results vs Plant Plant Operations before Jar Testing:
Coagulant dose: 110 mg/L
Filtrate turbidity: 0.20 - 0.26 NTU
Settled water turbidity: >11 NTU Plant Operations after Jar Testing:
Coagulant dose: 75 mg/L
Filtrate turbidity: 0.05 NTU
Settled water turbidity: 2 NTU<br>
slide16. Kenya, Tenwek Hospital - Surface Water Treatment Plant Mission:
Optimize the chemical and operations of the new surface water treatment facility.
Train and work with the operators Case 2:<br>
slide17. Source Water
River Mara
Alkalinity: 12 mg/L CaCO3
Turbidity: 100 – 800 NTU
Source 0.4 um Filtered:
UVA: 0.170/cm
UVT: 67.6 % Available Chemicals
Dry Alum
Dry Soda Ash
Dry Calcium Hypochlorite River Mara<br>
slide18. Sludge
Drying Beds Clean Water
Backwash Tank Lab
Bld Office
Bld Chemical
Storage
Bld Mix
Chemical
Solutions Gravity
Chemical
Feeders Clarifier
& Filter Clearwell Booster
Pump
Bld Backwash Lagoon/
Filter-to-waste/
Clarifier Desludging Treatment Plan<br>
slide19. Sand
Filter Clarifier/Filter<br>
slide20. Case 2. Jar Testing/Training for New Treatment Plant in Kenya (Tenwek Hospital) Upon arrival (April 2022) at Tenwek Hospital
Alum/Soda Ash added at front of treatment plant
Filtrate turbidity >1 NTUs; Kenya’s turbidity standard: <=5 NTUs Jar testing results showed Na2CO3 had negative impact on filterability
Moved Na2CO3 to post filtration
Optimized Alum dose via jar testing
Results:
Filtrate turbidity <0.1 NTU
Filtrate UVA: 0.008/cm
Filtrate UVT: 98%<br>
slide21. Kenya, Tenwek Hospital, Jar Testing for Optimization<br>
slide22. Thank you for attending!Contact and Links Guy Schott, P.E.
State Water Resources Control Board
Division of Drinking Water, Santa Rosa, CA
Go to Jar Test Results/Procedures for tools to download
www.waterboards.ca.gov/drinking_water/programs/districts/mendocino_district.html
Jar Testing Done Right video training https://youtu.be/aGByyxhelkI
Email: Guy Schott - Guy.Schott@waterboards.ca.gov<br>