
Key Economic Indicators How economies are

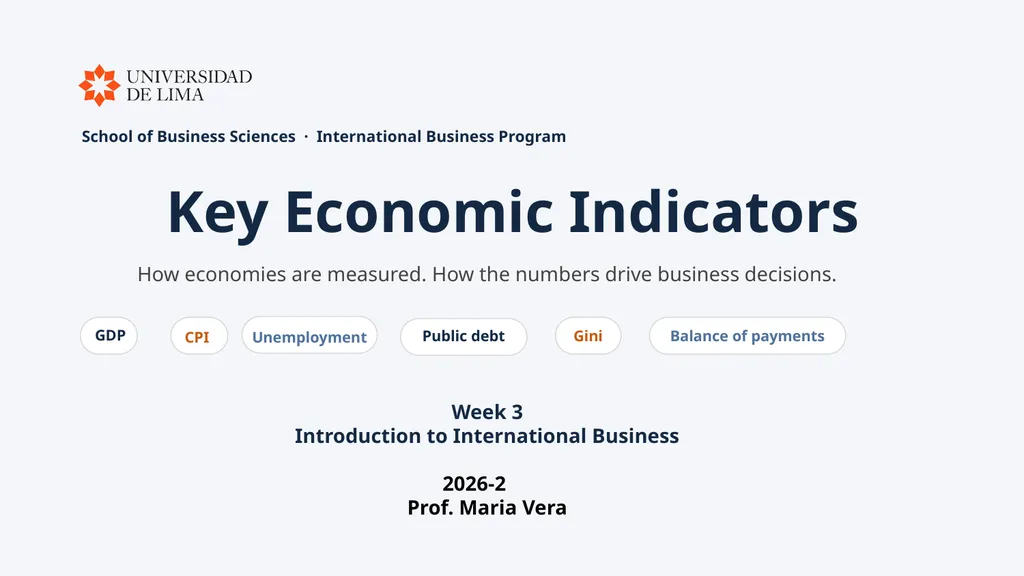



Description: Key Economic Indicators How economies are measured. How the numbers drive business decisions. GDP CPI Unemployment Public debt Gini Balance of payments Week 3 Introduction to International Business 2026-2 Prof. Maria Vera School of Business
Related Topics
Download Presentation
"Key Economic Indicators How economies are" is the property of its rightful owner. Permission is granted to download and print the materials on this website for personal, non-commercial use only, and to display it on your personal computer provided you do not modify the materials and that you retain all copyright notices contained in the materials. By downloading content from our website, you accept the terms of this agreement.
Presentation Transcript
slide1. Key Economic Indicators How economies are measured. How the numbers drive business decisions. GDP CPI Unemployment Public debt Gini Balance of payments Week 3
Introduction to International Business
2026-2
Prof. Maria Vera School of Business Sciences · International Business Program<br>
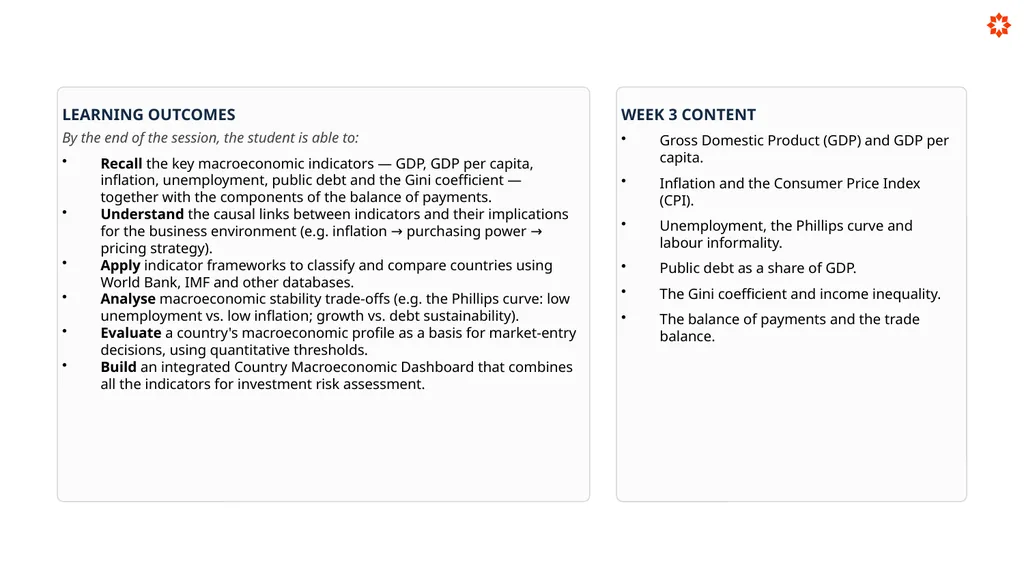
slide2. LEARNING OUTCOMES
By the end of the session, the student is able to:
Recall the key macroeconomic indicators — GDP, GDP per capita, inflation, unemployment, public debt and the Gini coefficient — together with the components of the balance of payments.
Understand the causal links between indicators and their implications for the business environment (e.g. inflation → purchasing power → pricing strategy).
Apply indicator frameworks to classify and compare countries using World Bank, IMF and other databases.
Analyse macroeconomic stability trade-offs (e.g. the Phillips curve: low unemployment vs. low inflation; growth vs. debt sustainability).
Evaluate a country's macroeconomic profile as a basis for market-entry decisions, using quantitative thresholds.
Build an integrated Country Macroeconomic Dashboard that combines all the indicators for investment risk assessment. WEEK 3 CONTENT
Gross Domestic Product (GDP) and GDP per capita.
Inflation and the Consumer Price Index (CPI).
Unemployment, the Phillips curve and labour informality.
Public debt as a share of GDP.
The Gini coefficient and income inequality.
The balance of payments and the trade balance.<br>
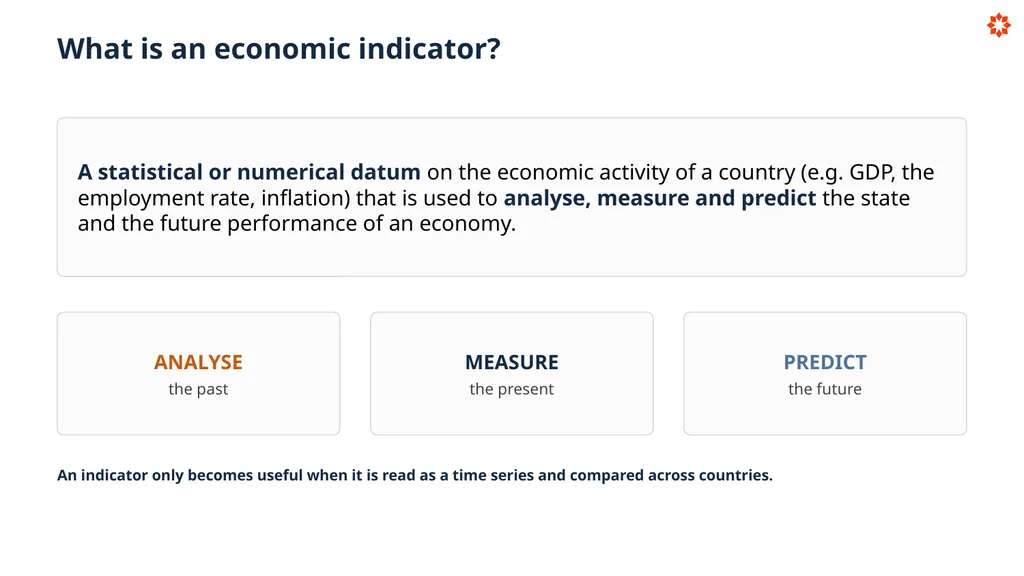
slide3. What is an economic indicator? A statistical or numerical datum on the economic activity of a country (e.g. GDP, the employment rate, inflation) that is used to analyse, measure and predict the state and the future performance of an economy. ANALYSE
the past MEASURE
the present PREDICT
the future An indicator only becomes useful when it is read as a time series and compared across countries.<br>
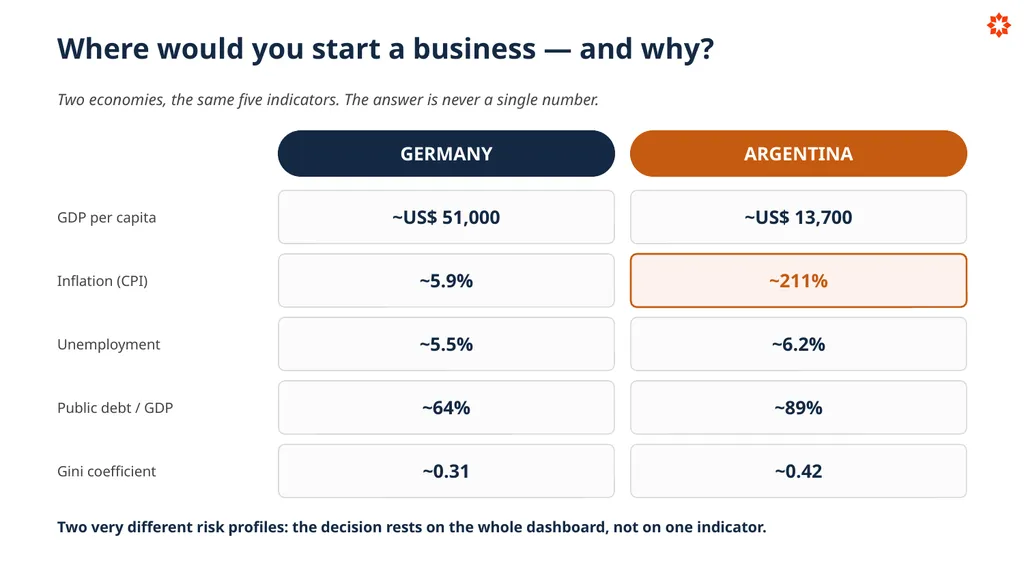
slide4. Where would you start a business — and why? Two economies, the same five indicators. The answer is never a single number. GERMANY ARGENTINA GDP per capita ~US$ 51,000 ~US$ 13,700 Inflation (CPI) ~5.9% ~211% Unemployment ~5.5% ~6.2% Public debt / GDP ~64% ~89% Gini coefficient ~0.31 ~0.42 Two very different risk profiles: the decision rests on the whole dashboard, not on one indicator.<br>
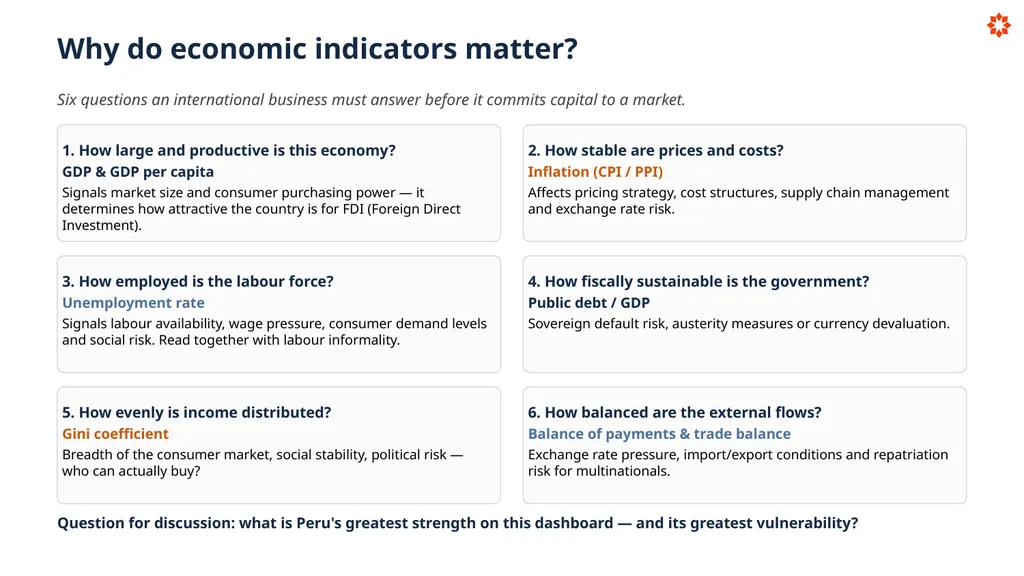
slide5. Why do economic indicators matter? Six questions an international business must answer before it commits capital to a market. 1. How large and productive is this economy?
GDP & GDP per capita
Signals market size and consumer purchasing power — it determines how attractive the country is for FDI (Foreign Direct Investment). 2. How stable are prices and costs?
Inflation (CPI / PPI)
Affects pricing strategy, cost structures, supply chain management and exchange rate risk. 3. How employed is the labour force?
Unemployment rate
Signals labour availability, wage pressure, consumer demand levels and social risk. Read together with labour informality. 4. How fiscally sustainable is the government?
Public debt / GDP
Sovereign default risk, austerity measures or currency devaluation. 5. How evenly is income distributed?
Gini coefficient
Breadth of the consumer market, social stability, political risk — who can actually buy? 6. How balanced are the external flows?
Balance of payments & trade balance
Exchange rate pressure, import/export conditions and repatriation risk for multinationals. Question for discussion: what is Peru's greatest strength on this dashboard — and its greatest vulnerability?<br>
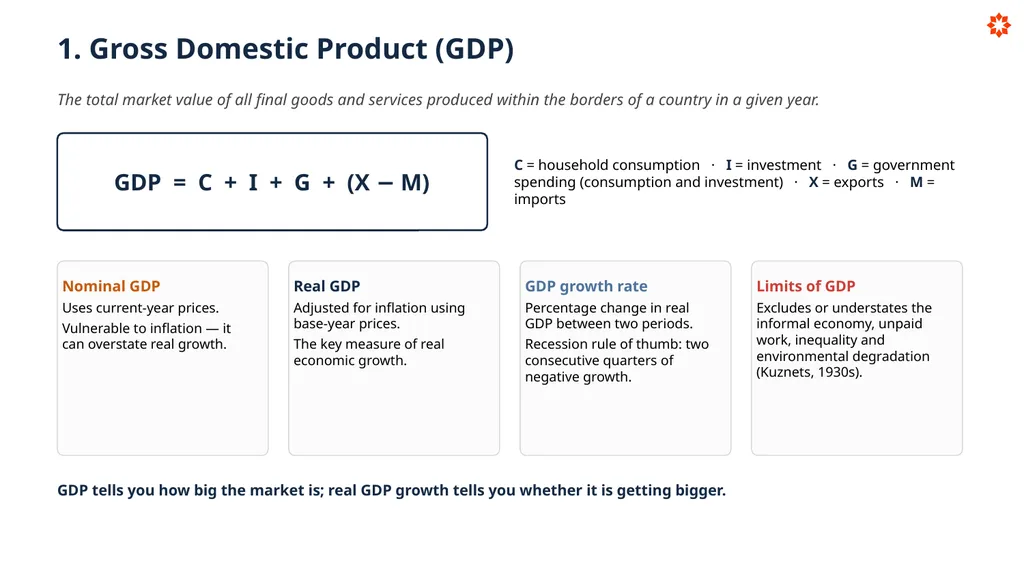
slide6. 1. Gross Domestic Product (GDP) The total market value of all final goods and services produced within the borders of a country in a given year. GDP = C + I + G + (X − M) C = household consumption · I = investment · G = government spending (consumption and investment) · X = exports · M = imports Nominal GDP
Uses current-year prices.
Vulnerable to inflation — it can overstate real growth. Real GDP
Adjusted for inflation using base-year prices.
The key measure of real economic growth. GDP growth rate
Percentage change in real GDP between two periods.
Recession rule of thumb: two consecutive quarters of negative growth. Limits of GDP
Excludes or understates the informal economy, unpaid work, inequality and environmental degradation (Kuznets, 1930s). GDP tells you how big the market is; real GDP growth tells you whether it is getting bigger.<br>
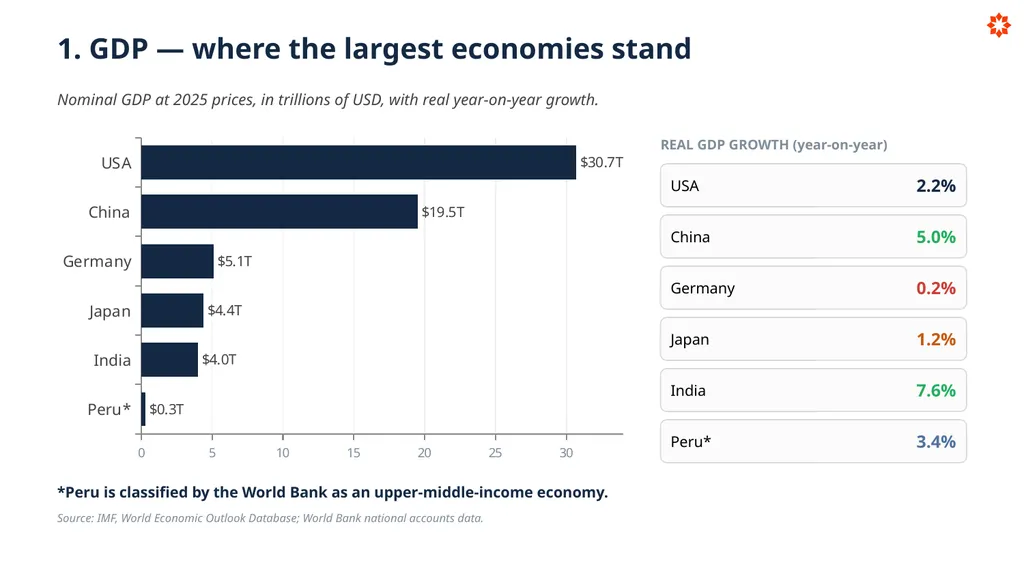
slide7. 1. GDP — where the largest economies stand Nominal GDP at 2025 prices, in trillions of USD, with real year-on-year growth. REAL GDP GROWTH (year-on-year) USA 2.2% China 5.0% Germany 0.2% Japan 1.2% India 7.6% Peru* 3.4% *Peru is classified by the World Bank as an upper-middle-income economy. Source: IMF, World Economic Outlook Database; World Bank national accounts data.<br>
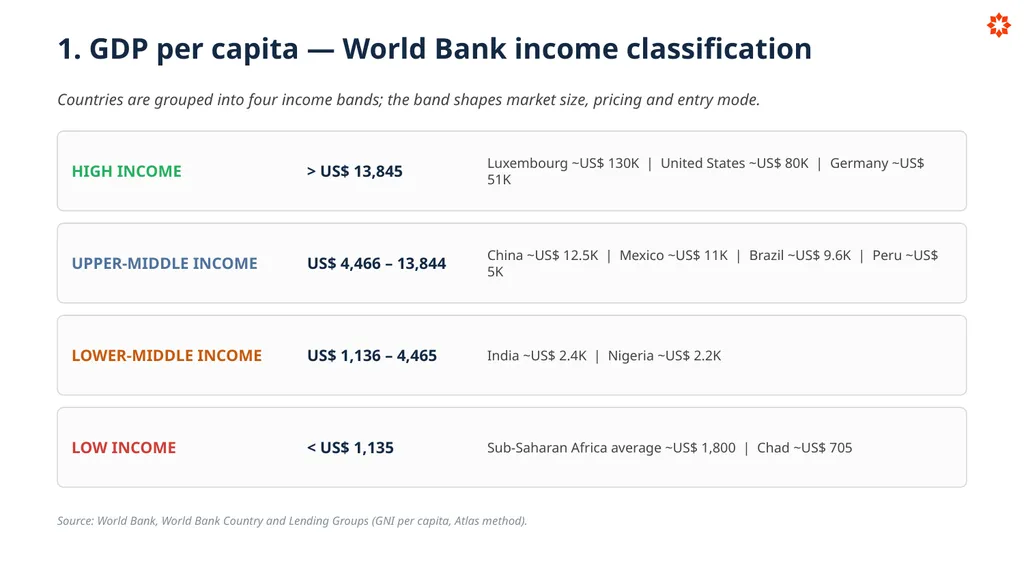
slide8. 1. GDP per capita — World Bank income classification Countries are grouped into four income bands; the band shapes market size, pricing and entry mode. HIGH INCOME > US$ 13,845 Luxembourg ~US$ 130K | United States ~US$ 80K | Germany ~US$ 51K UPPER-MIDDLE INCOME US$ 4,466 – 13,844 China ~US$ 12.5K | Mexico ~US$ 11K | Brazil ~US$ 9.6K | Peru ~US$ 5K LOWER-MIDDLE INCOME US$ 1,136 – 4,465 India ~US$ 2.4K | Nigeria ~US$ 2.2K LOW INCOME < US$ 1,135 Sub-Saharan Africa average ~US$ 1,800 | Chad ~US$ 705 Source: World Bank, World Bank Country and Lending Groups (GNI per capita, Atlas method).<br>
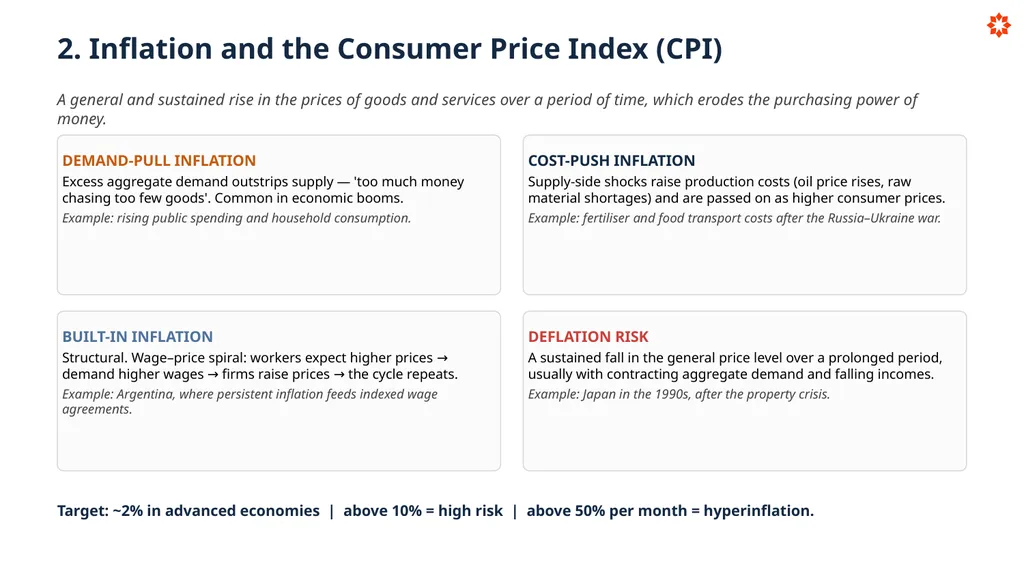
slide9. 2. Inflation and the Consumer Price Index (CPI) A general and sustained rise in the prices of goods and services over a period of time, which erodes the purchasing power of money. DEMAND-PULL INFLATION
Excess aggregate demand outstrips supply — 'too much money chasing too few goods'. Common in economic booms.
Example: rising public spending and household consumption. COST-PUSH INFLATION
Supply-side shocks raise production costs (oil price rises, raw material shortages) and are passed on as higher consumer prices.
Example: fertiliser and food transport costs after the Russia–Ukraine war. BUILT-IN INFLATION
Structural. Wage–price spiral: workers expect higher prices → demand higher wages → firms raise prices → the cycle repeats.
Example: Argentina, where persistent inflation feeds indexed wage agreements. DEFLATION RISK
A sustained fall in the general price level over a prolonged period, usually with contracting aggregate demand and falling incomes.
Example: Japan in the 1990s, after the property crisis. Target: ~2% in advanced economies | above 10% = high risk | above 50% per month = hyperinflation.<br>
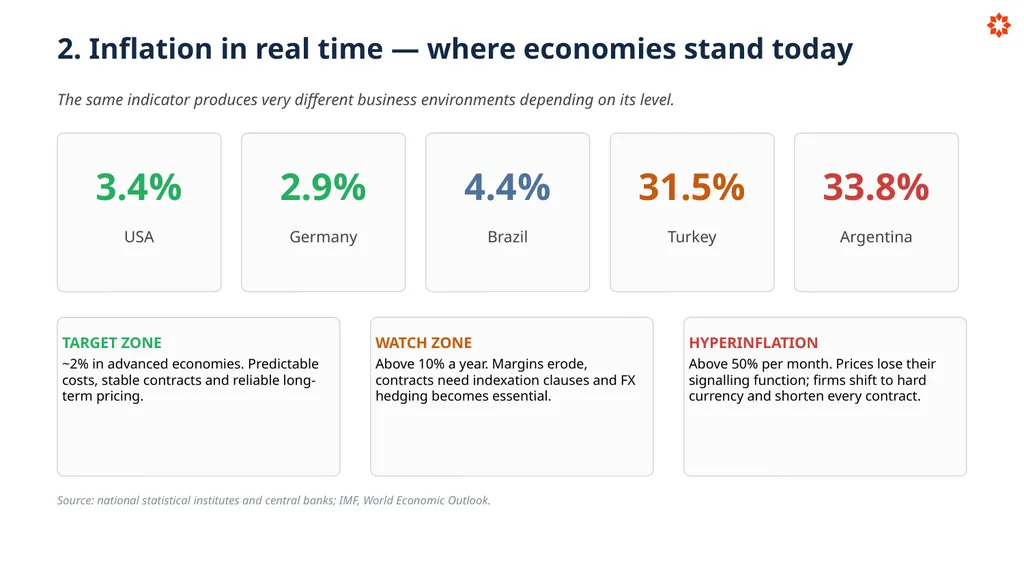
slide10. 2. Inflation in real time — where economies stand today The same indicator produces very different business environments depending on its level. 3.4% USA 2.9% Germany 4.4% Brazil 31.5% Turkey 33.8% Argentina TARGET ZONE
~2% in advanced economies. Predictable costs, stable contracts and reliable long-term pricing. WATCH ZONE
Above 10% a year. Margins erode, contracts need indexation clauses and FX hedging becomes essential. HYPERINFLATION
Above 50% per month. Prices lose their signalling function; firms shift to hard currency and shorten every contract. Source: national statistical institutes and central banks; IMF, World Economic Outlook.<br>
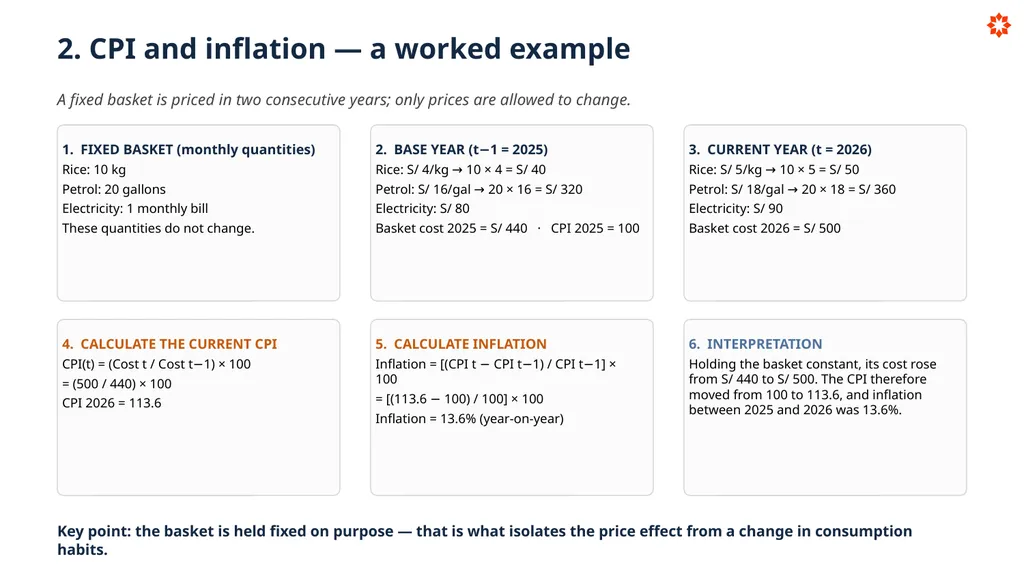
slide11. 2. CPI and inflation — a worked example A fixed basket is priced in two consecutive years; only prices are allowed to change. 1. FIXED BASKET (monthly quantities)
Rice: 10 kg
Petrol: 20 gallons
Electricity: 1 monthly bill
These quantities do not change. 2. BASE YEAR (t−1 = 2025)
Rice: S/ 4/kg → 10 × 4 = S/ 40
Petrol: S/ 16/gal → 20 × 16 = S/ 320
Electricity: S/ 80
Basket cost 2025 = S/ 440 · CPI 2025 = 100 3. CURRENT YEAR (t = 2026)
Rice: S/ 5/kg → 10 × 5 = S/ 50
Petrol: S/ 18/gal → 20 × 18 = S/ 360
Electricity: S/ 90
Basket cost 2026 = S/ 500 4. CALCULATE THE CURRENT CPI
CPI(t) = (Cost t / Cost t−1) × 100
= (500 / 440) × 100
CPI 2026 = 113.6 5. CALCULATE INFLATION
Inflation = [(CPI t − CPI t−1) / CPI t−1] × 100
= [(113.6 − 100) / 100] × 100
Inflation = 13.6% (year-on-year) 6. INTERPRETATION
Holding the basket constant, its cost rose from S/ 440 to S/ 500. The CPI therefore moved from 100 to 113.6, and inflation between 2025 and 2026 was 13.6%. Key point: the basket is held fixed on purpose — that is what isolates the price effect from a change in consumption habits.<br>
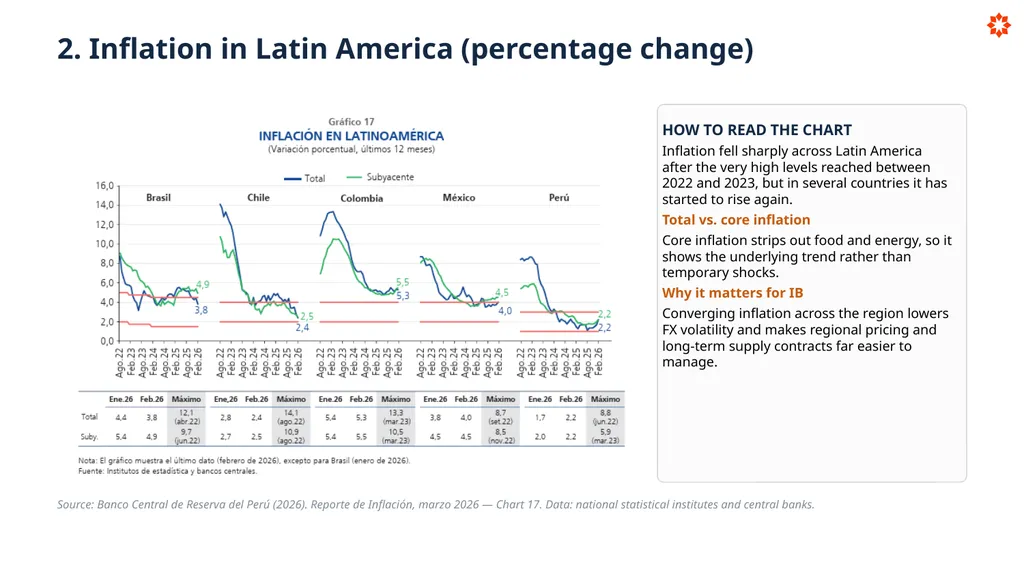
slide12. 2. Inflation in Latin America (percentage change) HOW TO READ THE CHART
Inflation fell sharply across Latin America after the very high levels reached between 2022 and 2023, but in several countries it has started to rise again.
Total vs. core inflation
Core inflation strips out food and energy, so it shows the underlying trend rather than temporary shocks.
Why it matters for IB
Converging inflation across the region lowers FX volatility and makes regional pricing and long-term supply contracts far easier to manage. Source: Banco Central de Reserva del Perú (2026). Reporte de Inflación, marzo 2026 — Chart 17. Data: national statistical institutes and central banks.<br>
slide13. 3. Unemployment — how it is measured Unemployment rate = (Unemployed ÷ Labour force) × 100 LABOUR FORCE
Employed people plus the unemployed who are actively looking for work. People who are not looking are excluded from the denominator. GENERAL BENCHMARKS
Full employment: 3–5%. High structural risk: above 10%. The benchmark must always be read against the country's own history. THE INFORMALITY CAVEAT
In economies with high informality, a low unemployment rate does not necessarily mean adequate or good-quality employment. Read the two indicators together. A country can report 4% unemployment and still offer a shallow formal consumer market, because half of its workers are informal, uninsured and outside the credit system.<br>
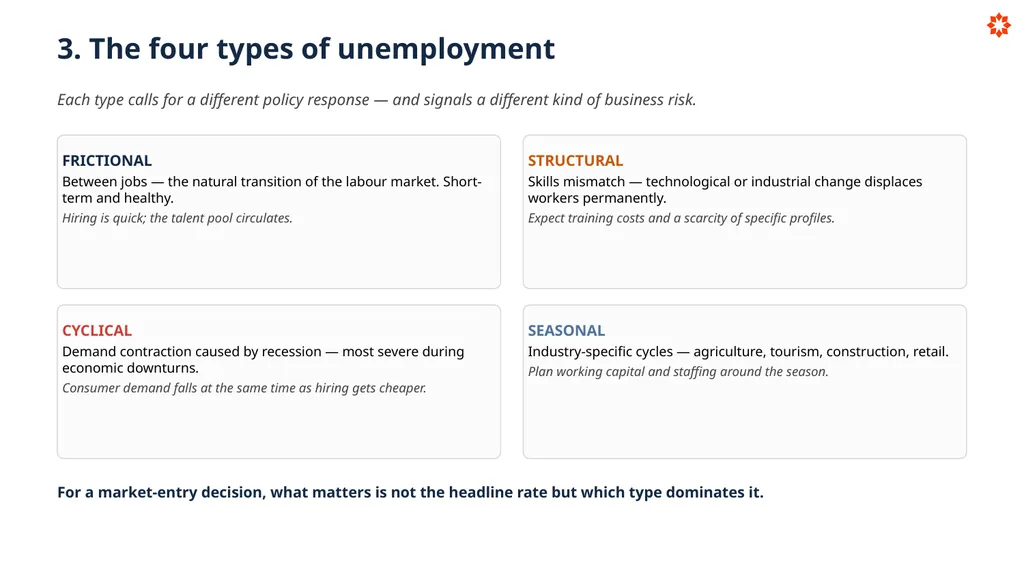
slide14. 3. The four types of unemployment Each type calls for a different policy response — and signals a different kind of business risk. FRICTIONAL
Between jobs — the natural transition of the labour market. Short-term and healthy.
Hiring is quick; the talent pool circulates. STRUCTURAL
Skills mismatch — technological or industrial change displaces workers permanently.
Expect training costs and a scarcity of specific profiles. CYCLICAL
Demand contraction caused by recession — most severe during economic downturns.
Consumer demand falls at the same time as hiring gets cheaper. SEASONAL
Industry-specific cycles — agriculture, tourism, construction, retail.
Plan working capital and staffing around the season. For a market-entry decision, what matters is not the headline rate but which type dominates it.<br>
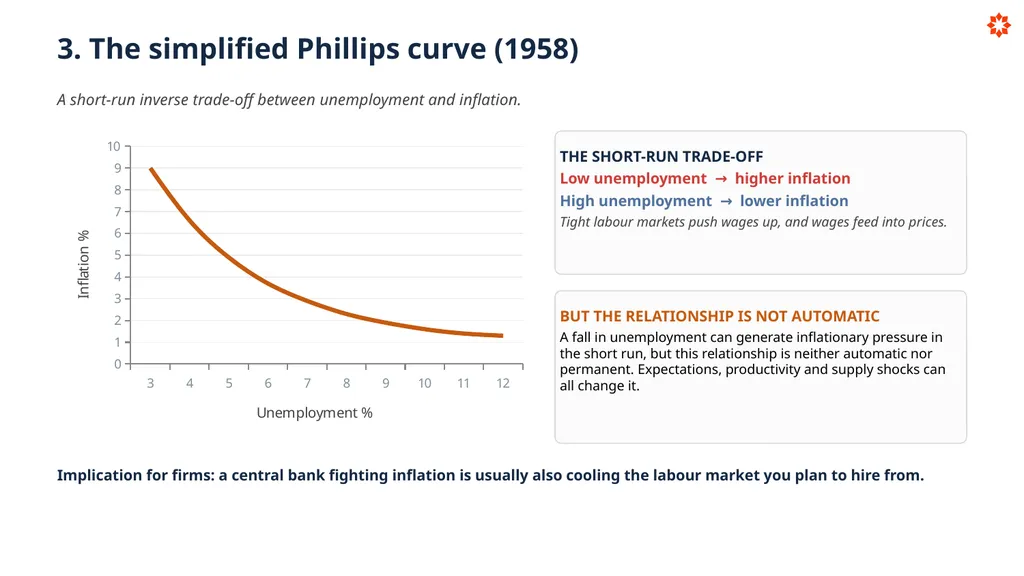
slide15. 3. The simplified Phillips curve (1958) A short-run inverse trade-off between unemployment and inflation. THE SHORT-RUN TRADE-OFF
Low unemployment → higher inflation
High unemployment → lower inflation
Tight labour markets push wages up, and wages feed into prices. BUT THE RELATIONSHIP IS NOT AUTOMATIC
A fall in unemployment can generate inflationary pressure in the short run, but this relationship is neither automatic nor permanent. Expectations, productivity and supply shocks can all change it. Implication for firms: a central bank fighting inflation is usually also cooling the labour market you plan to hire from.<br>
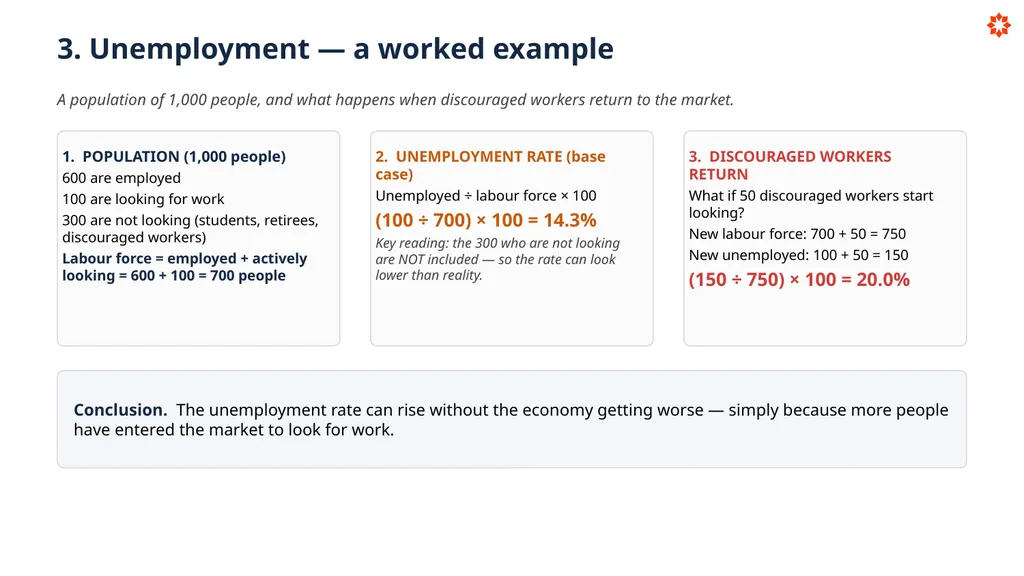
slide16. 3. Unemployment — a worked example A population of 1,000 people, and what happens when discouraged workers return to the market. 1. POPULATION (1,000 people)
600 are employed
100 are looking for work
300 are not looking (students, retirees, discouraged workers)
Labour force = employed + actively looking = 600 + 100 = 700 people 2. UNEMPLOYMENT RATE (base case)
Unemployed ÷ labour force × 100
(100 ÷ 700) × 100 = 14.3%
Key reading: the 300 who are not looking are NOT included — so the rate can look lower than reality. 3. DISCOURAGED WORKERS RETURN
What if 50 discouraged workers start looking?
New labour force: 700 + 50 = 750
New unemployed: 100 + 50 = 150
(150 ÷ 750) × 100 = 20.0% Conclusion. The unemployment rate can rise without the economy getting worse — simply because more people have entered the market to look for work.<br>
slide17. 3. Unemployment in Latin America 1. Labour supply
Colombia (10.0%) and Chile (8.1%) offer more available labour and less wage pressure — a cost advantage. 2. Demand
High unemployment means lower consumption. Colombia is weaker than Mexico (3.8%) and Ecuador (4.0%). 3. Risk
Above 8–10% unemployment, political pressure and regulatory change become a warning sign for long-horizon investment. 4. Economic cycle
The IMF projects stability — no regional recession in sight, so the environment is reasonable for investing. 5. Informality vs. unemployment
Mexico and Bolivia show low unemployment but high informality — employment is not necessarily solid. 6. Entry decision
High unemployment attracts manufacturing and BPO; low unemployment with high informality calls for a productivity and turnover analysis. Source: Statista, based on IMF, World Economic Outlook 2025. *April 2025 projections; national unemployment definitions may vary.<br>
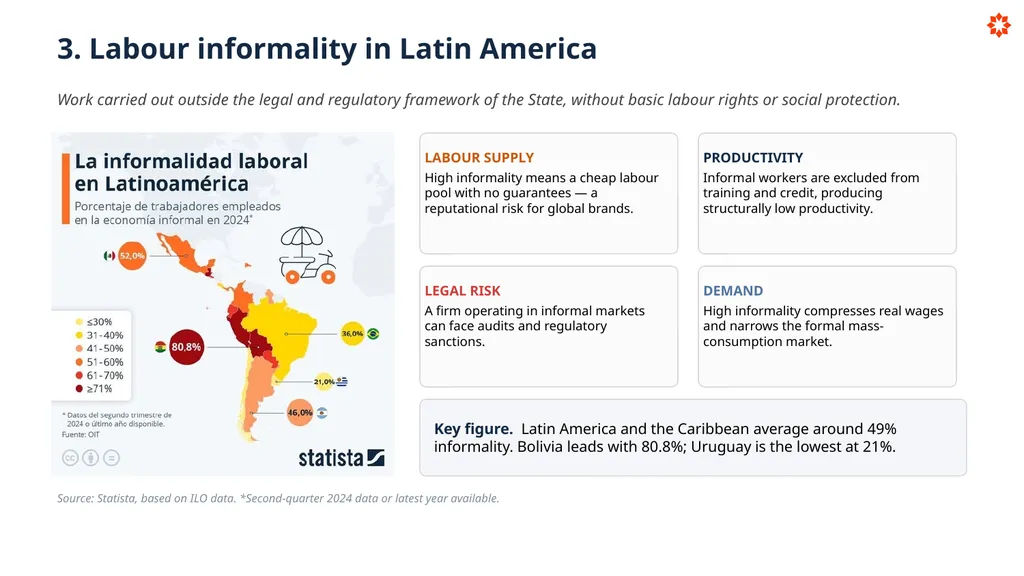
slide18. 3. Labour informality in Latin America Work carried out outside the legal and regulatory framework of the State, without basic labour rights or social protection. LABOUR SUPPLY
High informality means a cheap labour pool with no guarantees — a reputational risk for global brands. PRODUCTIVITY
Informal workers are excluded from training and credit, producing structurally low productivity. LEGAL RISK
A firm operating in informal markets can face audits and regulatory sanctions. DEMAND
High informality compresses real wages and narrows the formal mass-consumption market. Key figure. Latin America and the Caribbean average around 49% informality. Bolivia leads with 80.8%; Uruguay is the lowest at 21%. Source: Statista, based on ILO data. *Second-quarter 2024 data or latest year available.<br>
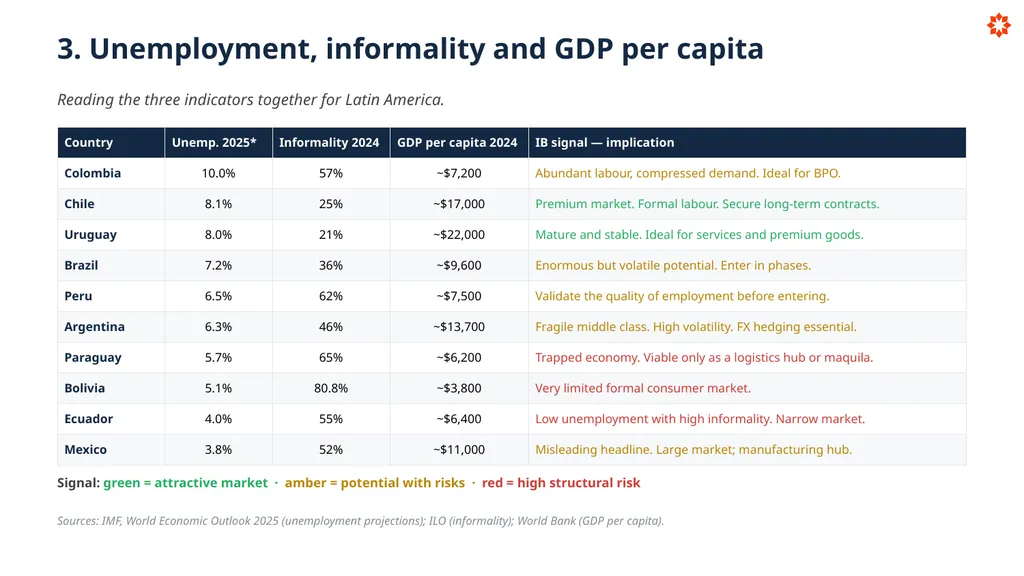
slide19. 3. Unemployment, informality and GDP per capita Reading the three indicators together for Latin America. Signal: green = attractive market · amber = potential with risks · red = high structural risk Sources: IMF, World Economic Outlook 2025 (unemployment projections); ILO (informality); World Bank (GDP per capita).<br>
slide20. 4. Public debt as a share of GDP Total government debt as a percentage of GDP — it measures fiscal sustainability and capacity to pay. MANAGEABLE
< 60%
Room for fiscal stimulus. Low default risk. CAUTION
60 – 90%
IMF monitoring zone. Growth effects begin to emerge. HIGH CONCERN
> 90%
IMF 'danger' zone. Crowding-out risk. Austerity likely. CRITICAL
> 130%
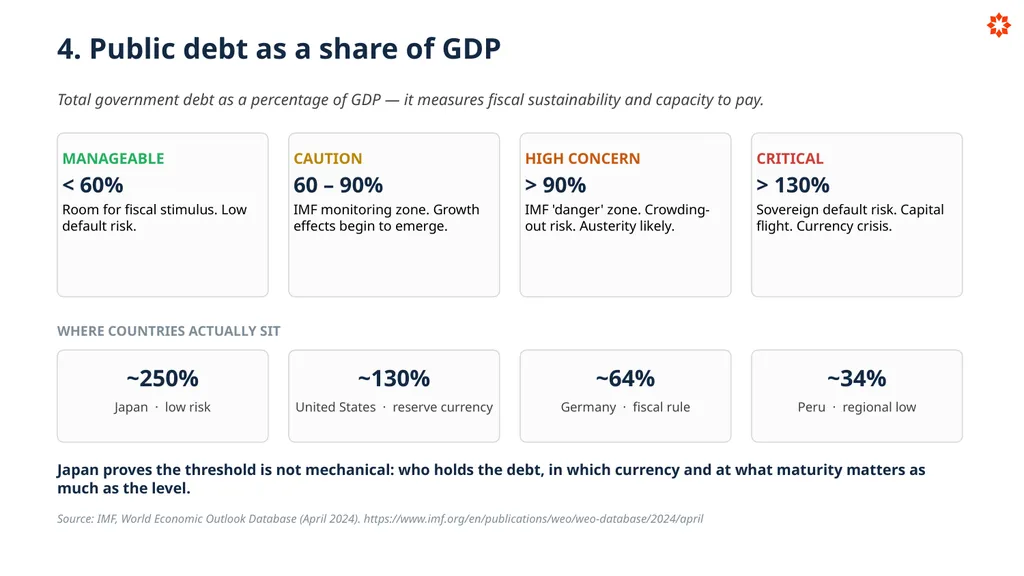
Sovereign default risk. Capital flight. Currency crisis. WHERE COUNTRIES ACTUALLY SIT ~250% Japan · low risk ~130% United States · reserve currency ~64% Germany · fiscal rule ~34% Peru · regional low Japan proves the threshold is not mechanical: who holds the debt, in which currency and at what maturity matters as much as the level. Source: IMF, World Economic Outlook Database (April 2024). https://www.imf.org/en/publications/weo/weo-database/2024/april<br>
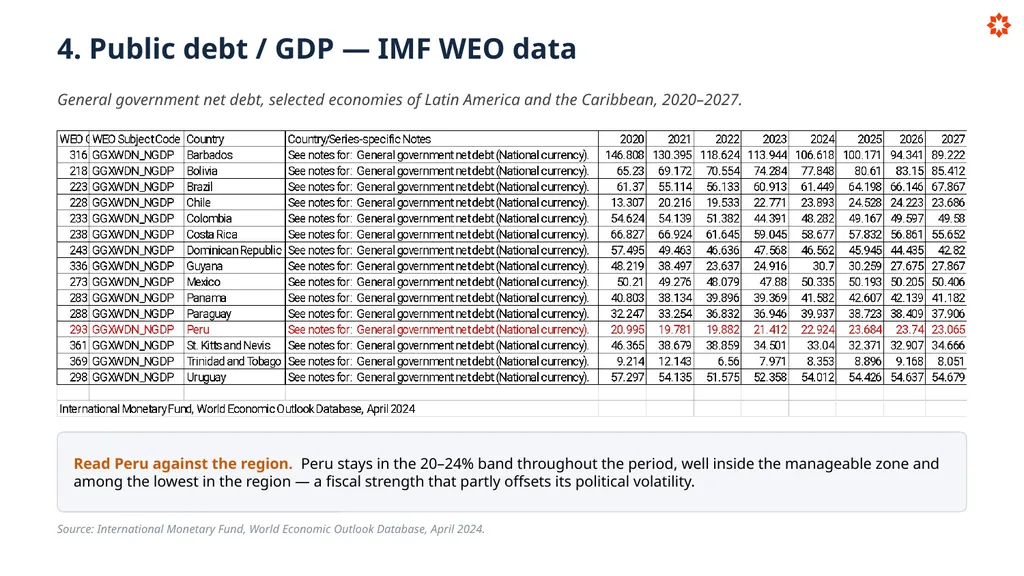
slide21. 4. Public debt / GDP — IMF WEO data General government net debt, selected economies of Latin America and the Caribbean, 2020–2027. Read Peru against the region. Peru stays in the 20–24% band throughout the period, well inside the manageable zone and among the lowest in the region — a fiscal strength that partly offsets its political volatility. Source: International Monetary Fund, World Economic Outlook Database, April 2024.<br>
slide22. 5. The Gini coefficient — income inequality It measures how unequally income is distributed within a country. THE SCALE
0 = everyone earns exactly the same (perfect equality)
1 = a single person holds all the income (maximum inequality)
In practice no country sits at 0 or 1 — the real range runs from about 0.25 (Nordic countries) to about 0.63 (South Africa). WHY IT MATTERS FOR IB
It defines the breadth of the consumer market: who can actually afford your product.
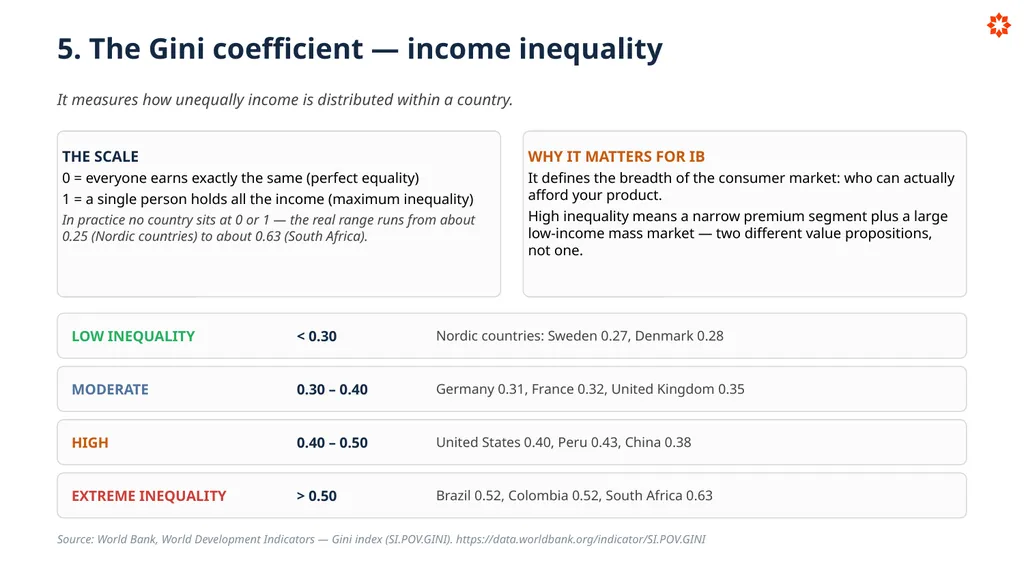
High inequality means a narrow premium segment plus a large low-income mass market — two different value propositions, not one. LOW INEQUALITY < 0.30 Nordic countries: Sweden 0.27, Denmark 0.28 MODERATE 0.30 – 0.40 Germany 0.31, France 0.32, United Kingdom 0.35 HIGH 0.40 – 0.50 United States 0.40, Peru 0.43, China 0.38 EXTREME INEQUALITY > 0.50 Brazil 0.52, Colombia 0.52, South Africa 0.63 Source: World Bank, World Development Indicators — Gini index (SI.POV.GINI). https://data.worldbank.org/indicator/SI.POV.GINI<br>
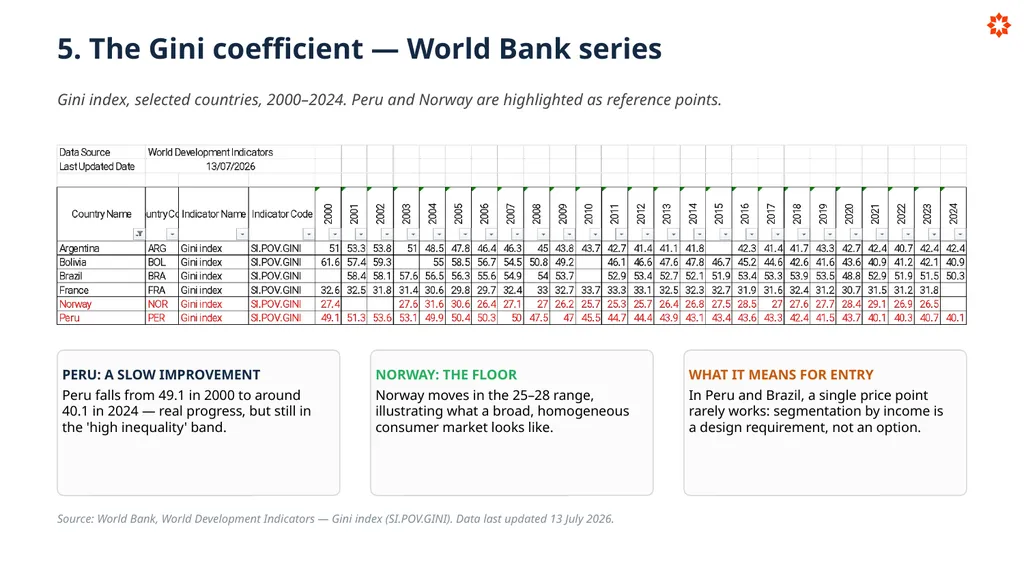
slide23. 5. The Gini coefficient — World Bank series Gini index, selected countries, 2000–2024. Peru and Norway are highlighted as reference points. PERU: A SLOW IMPROVEMENT
Peru falls from 49.1 in 2000 to around 40.1 in 2024 — real progress, but still in the 'high inequality' band. NORWAY: THE FLOOR
Norway moves in the 25–28 range, illustrating what a broad, homogeneous consumer market looks like. WHAT IT MEANS FOR ENTRY
In Peru and Brazil, a single price point rarely works: segmentation by income is a design requirement, not an option. Source: World Bank, World Development Indicators — Gini index (SI.POV.GINI). Data last updated 13 July 2026.<br>
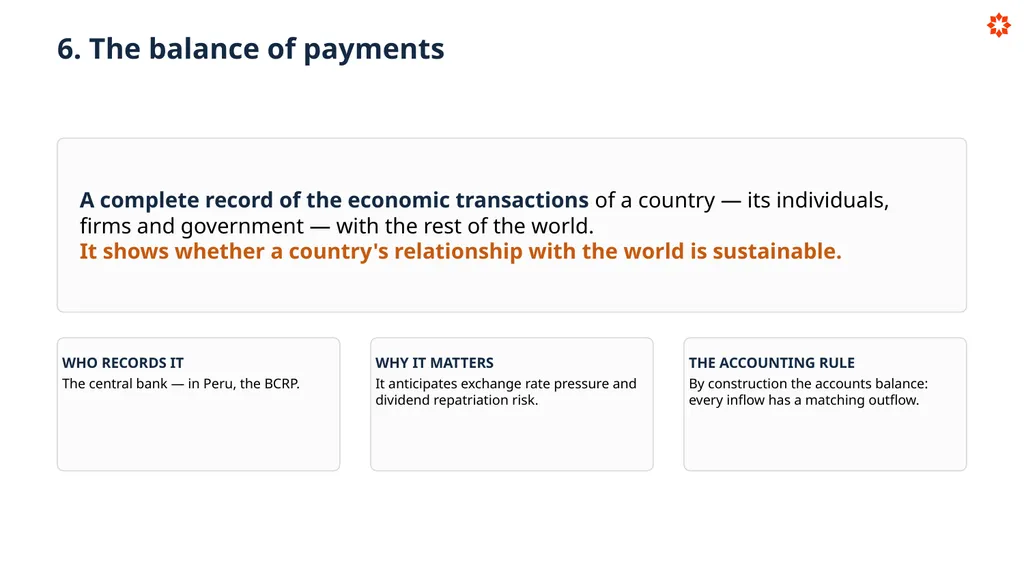
slide24. 6. The balance of payments A complete record of the economic transactions of a country — its individuals, firms and government — with the rest of the world.
It shows whether a country's relationship with the world is sustainable. WHO RECORDS IT
The central bank — in Peru, the BCRP. WHY IT MATTERS
It anticipates exchange rate pressure and dividend repatriation risk. THE ACCOUNTING RULE
By construction the accounts balance: every inflow has a matching outflow.<br>
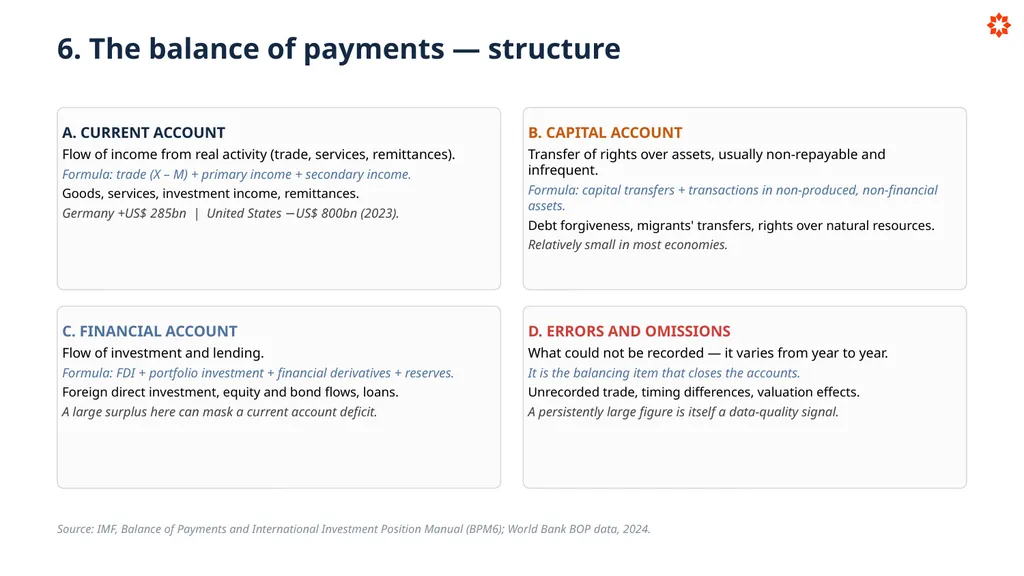
slide25. 6. The balance of payments — structure A. CURRENT ACCOUNT
Flow of income from real activity (trade, services, remittances).
Formula: trade (X – M) + primary income + secondary income.
Goods, services, investment income, remittances.
Germany +US$ 285bn | United States −US$ 800bn (2023). B. CAPITAL ACCOUNT
Transfer of rights over assets, usually non-repayable and infrequent.
Formula: capital transfers + transactions in non-produced, non-financial assets.
Debt forgiveness, migrants' transfers, rights over natural resources.
Relatively small in most economies. C. FINANCIAL ACCOUNT
Flow of investment and lending.
Formula: FDI + portfolio investment + financial derivatives + reserves.
Foreign direct investment, equity and bond flows, loans.
A large surplus here can mask a current account deficit. D. ERRORS AND OMISSIONS
What could not be recorded — it varies from year to year.
It is the balancing item that closes the accounts.
Unrecorded trade, timing differences, valuation effects.
A persistently large figure is itself a data-quality signal. Source: IMF, Balance of Payments and International Investment Position Manual (BPM6); World Bank BOP data, 2024.<br>
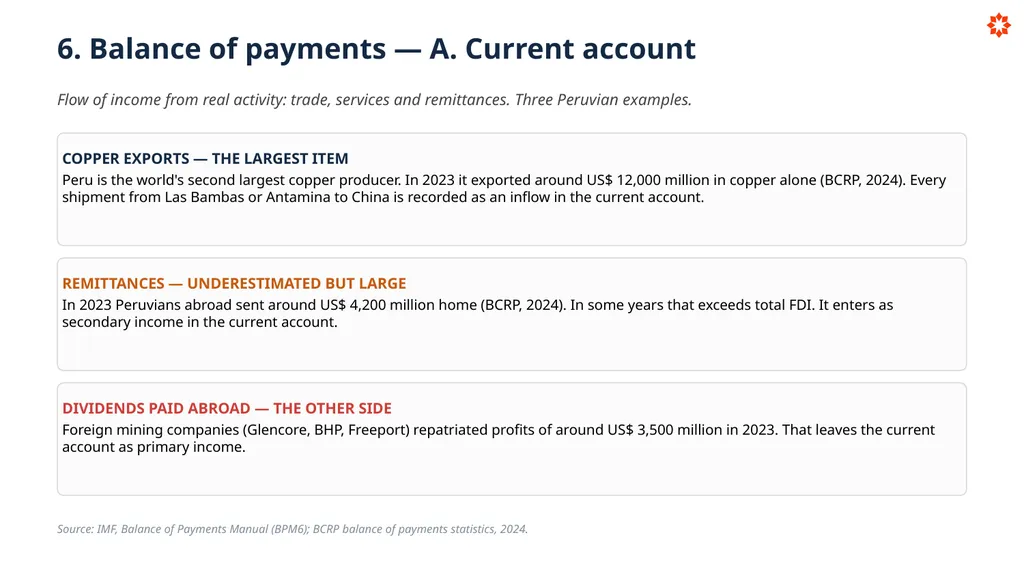
slide26. 6. Balance of payments — A. Current account Flow of income from real activity: trade, services and remittances. Three Peruvian examples. COPPER EXPORTS — THE LARGEST ITEM
Peru is the world's second largest copper producer. In 2023 it exported around US$ 12,000 million in copper alone (BCRP, 2024). Every shipment from Las Bambas or Antamina to China is recorded as an inflow in the current account. REMITTANCES — UNDERESTIMATED BUT LARGE
In 2023 Peruvians abroad sent around US$ 4,200 million home (BCRP, 2024). In some years that exceeds total FDI. It enters as secondary income in the current account. DIVIDENDS PAID ABROAD — THE OTHER SIDE
Foreign mining companies (Glencore, BHP, Freeport) repatriated profits of around US$ 3,500 million in 2023. That leaves the current account as primary income. Source: IMF, Balance of Payments Manual (BPM6); BCRP balance of payments statistics, 2024.<br>
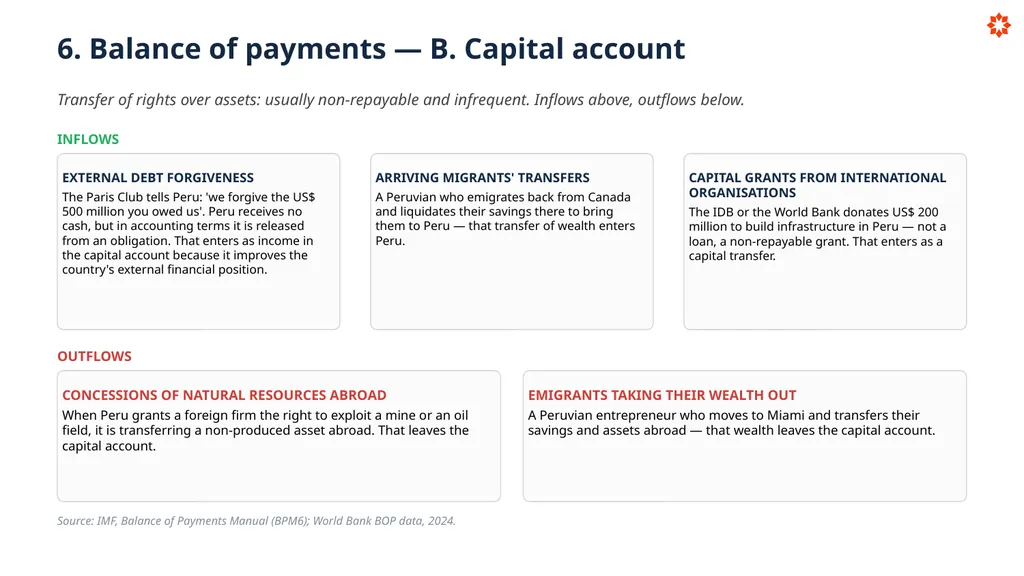
slide27. 6. Balance of payments — B. Capital account Transfer of rights over assets: usually non-repayable and infrequent. Inflows above, outflows below. INFLOWS EXTERNAL DEBT FORGIVENESS
The Paris Club tells Peru: 'we forgive the US$ 500 million you owed us'. Peru receives no cash, but in accounting terms it is released from an obligation. That enters as income in the capital account because it improves the country's external financial position. ARRIVING MIGRANTS' TRANSFERS
A Peruvian who emigrates back from Canada and liquidates their savings there to bring them to Peru — that transfer of wealth enters Peru. CAPITAL GRANTS FROM INTERNATIONAL ORGANISATIONS
The IDB or the World Bank donates US$ 200 million to build infrastructure in Peru — not a loan, a non-repayable grant. That enters as a capital transfer. OUTFLOWS CONCESSIONS OF NATURAL RESOURCES ABROAD
When Peru grants a foreign firm the right to exploit a mine or an oil field, it is transferring a non-produced asset abroad. That leaves the capital account. EMIGRANTS TAKING THEIR WEALTH OUT
A Peruvian entrepreneur who moves to Miami and transfers their savings and assets abroad — that wealth leaves the capital account. Source: IMF, Balance of Payments Manual (BPM6); World Bank BOP data, 2024.<br>
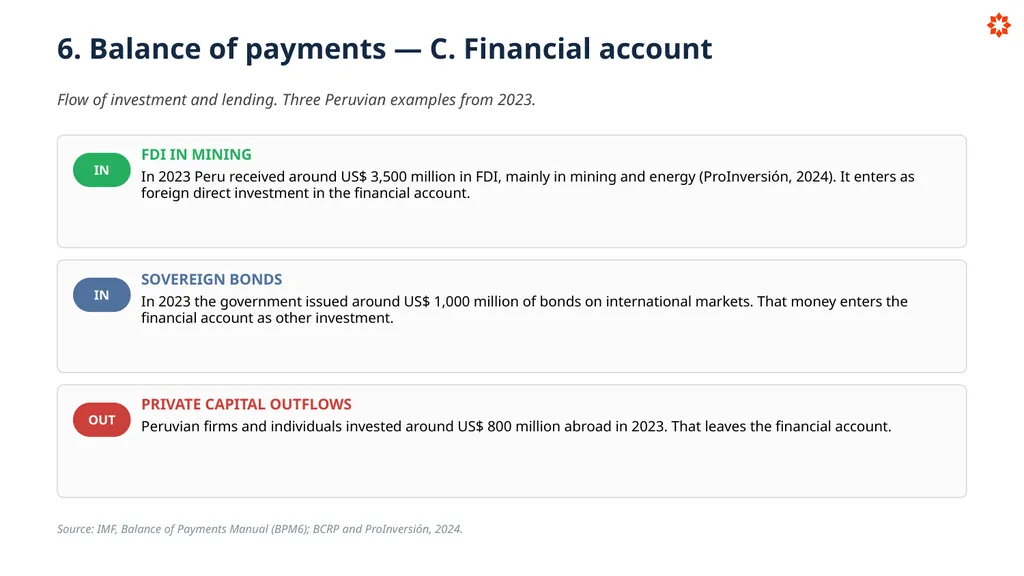
slide28. 6. Balance of payments — C. Financial account Flow of investment and lending. Three Peruvian examples from 2023. IN FDI IN MINING
In 2023 Peru received around US$ 3,500 million in FDI, mainly in mining and energy (ProInversión, 2024). It enters as foreign direct investment in the financial account. IN SOVEREIGN BONDS
In 2023 the government issued around US$ 1,000 million of bonds on international markets. That money enters the financial account as other investment. OUT PRIVATE CAPITAL OUTFLOWS
Peruvian firms and individuals invested around US$ 800 million abroad in 2023. That leaves the financial account. Source: IMF, Balance of Payments Manual (BPM6); BCRP and ProInversión, 2024.<br>
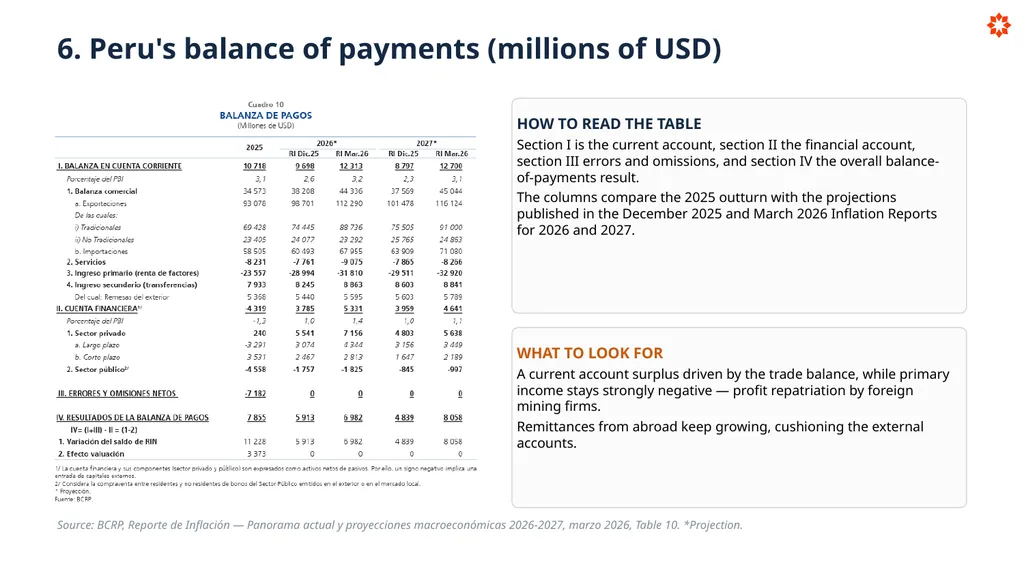
slide29. 6. Peru's balance of payments (millions of USD) HOW TO READ THE TABLE
Section I is the current account, section II the financial account, section III errors and omissions, and section IV the overall balance-of-payments result.
The columns compare the 2025 outturn with the projections published in the December 2025 and March 2026 Inflation Reports for 2026 and 2027. WHAT TO LOOK FOR
A current account surplus driven by the trade balance, while primary income stays strongly negative — profit repatriation by foreign mining firms.
Remittances from abroad keep growing, cushioning the external accounts. Source: BCRP, Reporte de Inflación — Panorama actual y proyecciones macroeconómicas 2026-2027, marzo 2026, Table 10. *Projection.<br>
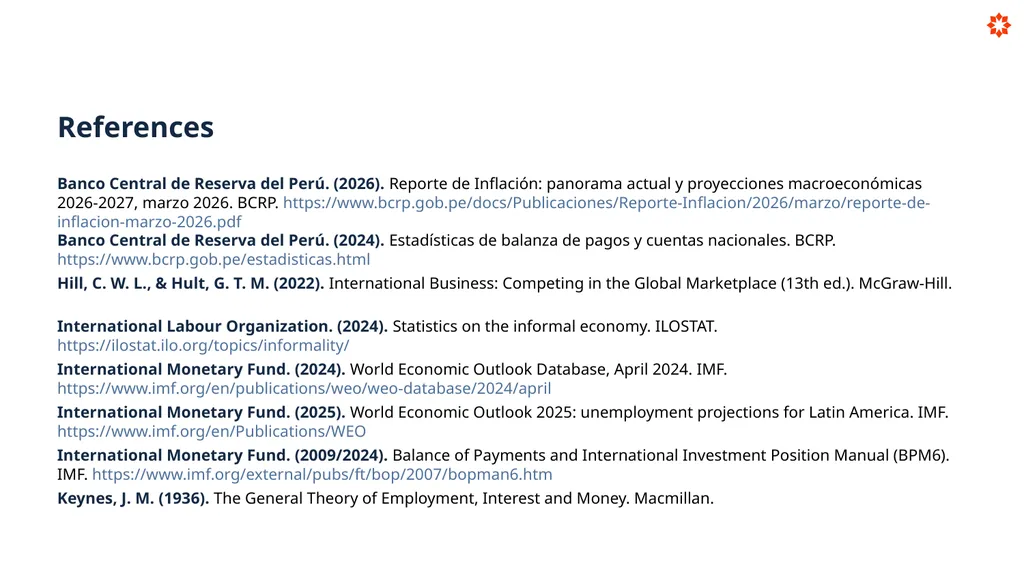
slide30. References Banco Central de Reserva del Perú. (2026). Reporte de Inflación: panorama actual y proyecciones macroeconómicas 2026-2027, marzo 2026. BCRP. https://www.bcrp.gob.pe/docs/Publicaciones/Reporte-Inflacion/2026/marzo/reporte-de-inflacion-marzo-2026.pdf Banco Central de Reserva del Perú. (2024). Estadísticas de balanza de pagos y cuentas nacionales. BCRP. https://www.bcrp.gob.pe/estadisticas.html Hill, C. W. L., & Hult, G. T. M. (2022). International Business: Competing in the Global Marketplace (13th ed.). McGraw-Hill. International Labour Organization. (2024). Statistics on the informal economy. ILOSTAT. https://ilostat.ilo.org/topics/informality/ International Monetary Fund. (2024). World Economic Outlook Database, April 2024. IMF. https://www.imf.org/en/publications/weo/weo-database/2024/april International Monetary Fund. (2025). World Economic Outlook 2025: unemployment projections for Latin America. IMF. https://www.imf.org/en/Publications/WEO International Monetary Fund. (2009/2024). Balance of Payments and International Investment Position Manual (BPM6). IMF. https://www.imf.org/external/pubs/ft/bop/2007/bopman6.htm Keynes, J. M. (1936). The General Theory of Employment, Interest and Money. Macmillan.<br>
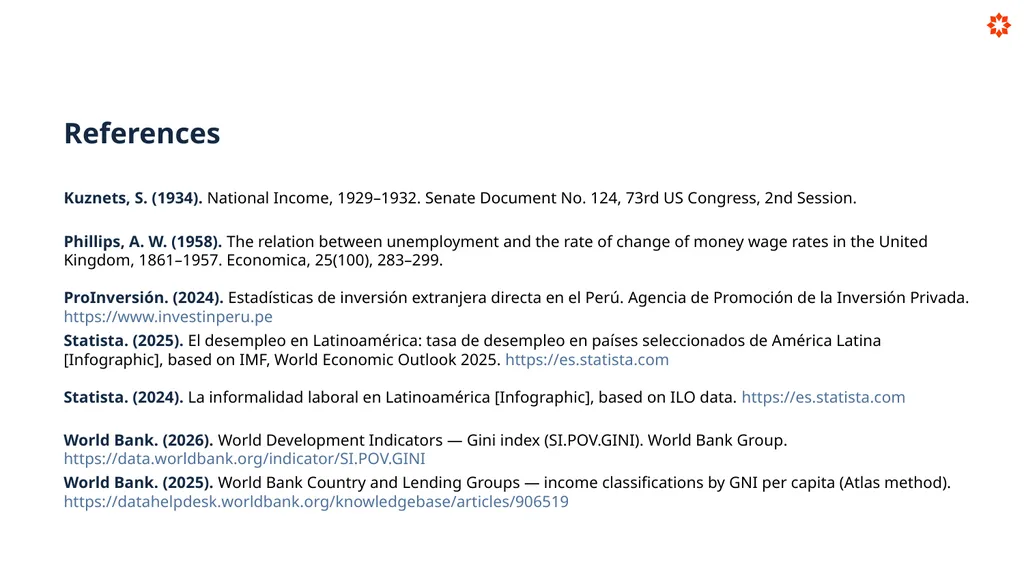
slide31. References Kuznets, S. (1934). National Income, 1929–1932. Senate Document No. 124, 73rd US Congress, 2nd Session. Phillips, A. W. (1958). The relation between unemployment and the rate of change of money wage rates in the United Kingdom, 1861–1957. Economica, 25(100), 283–299. ProInversión. (2024). Estadísticas de inversión extranjera directa en el Perú. Agencia de Promoción de la Inversión Privada. https://www.investinperu.pe Statista. (2025). El desempleo en Latinoamérica: tasa de desempleo en países seleccionados de América Latina [Infographic], based on IMF, World Economic Outlook 2025. https://es.statista.com Statista. (2024). La informalidad laboral en Latinoamérica [Infographic], based on ILO data. https://es.statista.com World Bank. (2026). World Development Indicators — Gini index (SI.POV.GINI). World Bank Group. https://data.worldbank.org/indicator/SI.POV.GINI World Bank. (2025). World Bank Country and Lending Groups — income classifications by GNI per capita (Atlas method). https://datahelpdesk.worldbank.org/knowledgebase/articles/906519<br>
slide32. Thank you!<br>
Introduction to International Business
2026-2
Prof. Maria Vera School of Business Sciences · International Business Program<br>
slide2. LEARNING OUTCOMES
By the end of the session, the student is able to:
Recall the key macroeconomic indicators — GDP, GDP per capita, inflation, unemployment, public debt and the Gini coefficient — together with the components of the balance of payments.
Understand the causal links between indicators and their implications for the business environment (e.g. inflation → purchasing power → pricing strategy).
Apply indicator frameworks to classify and compare countries using World Bank, IMF and other databases.
Analyse macroeconomic stability trade-offs (e.g. the Phillips curve: low unemployment vs. low inflation; growth vs. debt sustainability).
Evaluate a country's macroeconomic profile as a basis for market-entry decisions, using quantitative thresholds.
Build an integrated Country Macroeconomic Dashboard that combines all the indicators for investment risk assessment. WEEK 3 CONTENT
Gross Domestic Product (GDP) and GDP per capita.
Inflation and the Consumer Price Index (CPI).
Unemployment, the Phillips curve and labour informality.
Public debt as a share of GDP.
The Gini coefficient and income inequality.
The balance of payments and the trade balance.<br>
slide3. What is an economic indicator? A statistical or numerical datum on the economic activity of a country (e.g. GDP, the employment rate, inflation) that is used to analyse, measure and predict the state and the future performance of an economy. ANALYSE
the past MEASURE
the present PREDICT
the future An indicator only becomes useful when it is read as a time series and compared across countries.<br>
slide4. Where would you start a business — and why? Two economies, the same five indicators. The answer is never a single number. GERMANY ARGENTINA GDP per capita ~US$ 51,000 ~US$ 13,700 Inflation (CPI) ~5.9% ~211% Unemployment ~5.5% ~6.2% Public debt / GDP ~64% ~89% Gini coefficient ~0.31 ~0.42 Two very different risk profiles: the decision rests on the whole dashboard, not on one indicator.<br>
slide5. Why do economic indicators matter? Six questions an international business must answer before it commits capital to a market. 1. How large and productive is this economy?
GDP & GDP per capita
Signals market size and consumer purchasing power — it determines how attractive the country is for FDI (Foreign Direct Investment). 2. How stable are prices and costs?
Inflation (CPI / PPI)
Affects pricing strategy, cost structures, supply chain management and exchange rate risk. 3. How employed is the labour force?
Unemployment rate
Signals labour availability, wage pressure, consumer demand levels and social risk. Read together with labour informality. 4. How fiscally sustainable is the government?
Public debt / GDP
Sovereign default risk, austerity measures or currency devaluation. 5. How evenly is income distributed?
Gini coefficient
Breadth of the consumer market, social stability, political risk — who can actually buy? 6. How balanced are the external flows?
Balance of payments & trade balance
Exchange rate pressure, import/export conditions and repatriation risk for multinationals. Question for discussion: what is Peru's greatest strength on this dashboard — and its greatest vulnerability?<br>
slide6. 1. Gross Domestic Product (GDP) The total market value of all final goods and services produced within the borders of a country in a given year. GDP = C + I + G + (X − M) C = household consumption · I = investment · G = government spending (consumption and investment) · X = exports · M = imports Nominal GDP
Uses current-year prices.
Vulnerable to inflation — it can overstate real growth. Real GDP
Adjusted for inflation using base-year prices.
The key measure of real economic growth. GDP growth rate
Percentage change in real GDP between two periods.
Recession rule of thumb: two consecutive quarters of negative growth. Limits of GDP
Excludes or understates the informal economy, unpaid work, inequality and environmental degradation (Kuznets, 1930s). GDP tells you how big the market is; real GDP growth tells you whether it is getting bigger.<br>
slide7. 1. GDP — where the largest economies stand Nominal GDP at 2025 prices, in trillions of USD, with real year-on-year growth. REAL GDP GROWTH (year-on-year) USA 2.2% China 5.0% Germany 0.2% Japan 1.2% India 7.6% Peru* 3.4% *Peru is classified by the World Bank as an upper-middle-income economy. Source: IMF, World Economic Outlook Database; World Bank national accounts data.<br>
slide8. 1. GDP per capita — World Bank income classification Countries are grouped into four income bands; the band shapes market size, pricing and entry mode. HIGH INCOME > US$ 13,845 Luxembourg ~US$ 130K | United States ~US$ 80K | Germany ~US$ 51K UPPER-MIDDLE INCOME US$ 4,466 – 13,844 China ~US$ 12.5K | Mexico ~US$ 11K | Brazil ~US$ 9.6K | Peru ~US$ 5K LOWER-MIDDLE INCOME US$ 1,136 – 4,465 India ~US$ 2.4K | Nigeria ~US$ 2.2K LOW INCOME < US$ 1,135 Sub-Saharan Africa average ~US$ 1,800 | Chad ~US$ 705 Source: World Bank, World Bank Country and Lending Groups (GNI per capita, Atlas method).<br>
slide9. 2. Inflation and the Consumer Price Index (CPI) A general and sustained rise in the prices of goods and services over a period of time, which erodes the purchasing power of money. DEMAND-PULL INFLATION
Excess aggregate demand outstrips supply — 'too much money chasing too few goods'. Common in economic booms.
Example: rising public spending and household consumption. COST-PUSH INFLATION
Supply-side shocks raise production costs (oil price rises, raw material shortages) and are passed on as higher consumer prices.
Example: fertiliser and food transport costs after the Russia–Ukraine war. BUILT-IN INFLATION
Structural. Wage–price spiral: workers expect higher prices → demand higher wages → firms raise prices → the cycle repeats.
Example: Argentina, where persistent inflation feeds indexed wage agreements. DEFLATION RISK
A sustained fall in the general price level over a prolonged period, usually with contracting aggregate demand and falling incomes.
Example: Japan in the 1990s, after the property crisis. Target: ~2% in advanced economies | above 10% = high risk | above 50% per month = hyperinflation.<br>
slide10. 2. Inflation in real time — where economies stand today The same indicator produces very different business environments depending on its level. 3.4% USA 2.9% Germany 4.4% Brazil 31.5% Turkey 33.8% Argentina TARGET ZONE
~2% in advanced economies. Predictable costs, stable contracts and reliable long-term pricing. WATCH ZONE
Above 10% a year. Margins erode, contracts need indexation clauses and FX hedging becomes essential. HYPERINFLATION
Above 50% per month. Prices lose their signalling function; firms shift to hard currency and shorten every contract. Source: national statistical institutes and central banks; IMF, World Economic Outlook.<br>
slide11. 2. CPI and inflation — a worked example A fixed basket is priced in two consecutive years; only prices are allowed to change. 1. FIXED BASKET (monthly quantities)
Rice: 10 kg
Petrol: 20 gallons
Electricity: 1 monthly bill
These quantities do not change. 2. BASE YEAR (t−1 = 2025)
Rice: S/ 4/kg → 10 × 4 = S/ 40
Petrol: S/ 16/gal → 20 × 16 = S/ 320
Electricity: S/ 80
Basket cost 2025 = S/ 440 · CPI 2025 = 100 3. CURRENT YEAR (t = 2026)
Rice: S/ 5/kg → 10 × 5 = S/ 50
Petrol: S/ 18/gal → 20 × 18 = S/ 360
Electricity: S/ 90
Basket cost 2026 = S/ 500 4. CALCULATE THE CURRENT CPI
CPI(t) = (Cost t / Cost t−1) × 100
= (500 / 440) × 100
CPI 2026 = 113.6 5. CALCULATE INFLATION
Inflation = [(CPI t − CPI t−1) / CPI t−1] × 100
= [(113.6 − 100) / 100] × 100
Inflation = 13.6% (year-on-year) 6. INTERPRETATION
Holding the basket constant, its cost rose from S/ 440 to S/ 500. The CPI therefore moved from 100 to 113.6, and inflation between 2025 and 2026 was 13.6%. Key point: the basket is held fixed on purpose — that is what isolates the price effect from a change in consumption habits.<br>
slide12. 2. Inflation in Latin America (percentage change) HOW TO READ THE CHART
Inflation fell sharply across Latin America after the very high levels reached between 2022 and 2023, but in several countries it has started to rise again.
Total vs. core inflation
Core inflation strips out food and energy, so it shows the underlying trend rather than temporary shocks.
Why it matters for IB
Converging inflation across the region lowers FX volatility and makes regional pricing and long-term supply contracts far easier to manage. Source: Banco Central de Reserva del Perú (2026). Reporte de Inflación, marzo 2026 — Chart 17. Data: national statistical institutes and central banks.<br>
slide13. 3. Unemployment — how it is measured Unemployment rate = (Unemployed ÷ Labour force) × 100 LABOUR FORCE
Employed people plus the unemployed who are actively looking for work. People who are not looking are excluded from the denominator. GENERAL BENCHMARKS
Full employment: 3–5%. High structural risk: above 10%. The benchmark must always be read against the country's own history. THE INFORMALITY CAVEAT
In economies with high informality, a low unemployment rate does not necessarily mean adequate or good-quality employment. Read the two indicators together. A country can report 4% unemployment and still offer a shallow formal consumer market, because half of its workers are informal, uninsured and outside the credit system.<br>
slide14. 3. The four types of unemployment Each type calls for a different policy response — and signals a different kind of business risk. FRICTIONAL
Between jobs — the natural transition of the labour market. Short-term and healthy.
Hiring is quick; the talent pool circulates. STRUCTURAL
Skills mismatch — technological or industrial change displaces workers permanently.
Expect training costs and a scarcity of specific profiles. CYCLICAL
Demand contraction caused by recession — most severe during economic downturns.
Consumer demand falls at the same time as hiring gets cheaper. SEASONAL
Industry-specific cycles — agriculture, tourism, construction, retail.
Plan working capital and staffing around the season. For a market-entry decision, what matters is not the headline rate but which type dominates it.<br>
slide15. 3. The simplified Phillips curve (1958) A short-run inverse trade-off between unemployment and inflation. THE SHORT-RUN TRADE-OFF
Low unemployment → higher inflation
High unemployment → lower inflation
Tight labour markets push wages up, and wages feed into prices. BUT THE RELATIONSHIP IS NOT AUTOMATIC
A fall in unemployment can generate inflationary pressure in the short run, but this relationship is neither automatic nor permanent. Expectations, productivity and supply shocks can all change it. Implication for firms: a central bank fighting inflation is usually also cooling the labour market you plan to hire from.<br>
slide16. 3. Unemployment — a worked example A population of 1,000 people, and what happens when discouraged workers return to the market. 1. POPULATION (1,000 people)
600 are employed
100 are looking for work
300 are not looking (students, retirees, discouraged workers)
Labour force = employed + actively looking = 600 + 100 = 700 people 2. UNEMPLOYMENT RATE (base case)
Unemployed ÷ labour force × 100
(100 ÷ 700) × 100 = 14.3%
Key reading: the 300 who are not looking are NOT included — so the rate can look lower than reality. 3. DISCOURAGED WORKERS RETURN
What if 50 discouraged workers start looking?
New labour force: 700 + 50 = 750
New unemployed: 100 + 50 = 150
(150 ÷ 750) × 100 = 20.0% Conclusion. The unemployment rate can rise without the economy getting worse — simply because more people have entered the market to look for work.<br>
slide17. 3. Unemployment in Latin America 1. Labour supply
Colombia (10.0%) and Chile (8.1%) offer more available labour and less wage pressure — a cost advantage. 2. Demand
High unemployment means lower consumption. Colombia is weaker than Mexico (3.8%) and Ecuador (4.0%). 3. Risk
Above 8–10% unemployment, political pressure and regulatory change become a warning sign for long-horizon investment. 4. Economic cycle
The IMF projects stability — no regional recession in sight, so the environment is reasonable for investing. 5. Informality vs. unemployment
Mexico and Bolivia show low unemployment but high informality — employment is not necessarily solid. 6. Entry decision
High unemployment attracts manufacturing and BPO; low unemployment with high informality calls for a productivity and turnover analysis. Source: Statista, based on IMF, World Economic Outlook 2025. *April 2025 projections; national unemployment definitions may vary.<br>
slide18. 3. Labour informality in Latin America Work carried out outside the legal and regulatory framework of the State, without basic labour rights or social protection. LABOUR SUPPLY
High informality means a cheap labour pool with no guarantees — a reputational risk for global brands. PRODUCTIVITY
Informal workers are excluded from training and credit, producing structurally low productivity. LEGAL RISK
A firm operating in informal markets can face audits and regulatory sanctions. DEMAND
High informality compresses real wages and narrows the formal mass-consumption market. Key figure. Latin America and the Caribbean average around 49% informality. Bolivia leads with 80.8%; Uruguay is the lowest at 21%. Source: Statista, based on ILO data. *Second-quarter 2024 data or latest year available.<br>
slide19. 3. Unemployment, informality and GDP per capita Reading the three indicators together for Latin America. Signal: green = attractive market · amber = potential with risks · red = high structural risk Sources: IMF, World Economic Outlook 2025 (unemployment projections); ILO (informality); World Bank (GDP per capita).<br>
slide20. 4. Public debt as a share of GDP Total government debt as a percentage of GDP — it measures fiscal sustainability and capacity to pay. MANAGEABLE
< 60%
Room for fiscal stimulus. Low default risk. CAUTION
60 – 90%
IMF monitoring zone. Growth effects begin to emerge. HIGH CONCERN
> 90%
IMF 'danger' zone. Crowding-out risk. Austerity likely. CRITICAL
> 130%
Sovereign default risk. Capital flight. Currency crisis. WHERE COUNTRIES ACTUALLY SIT ~250% Japan · low risk ~130% United States · reserve currency ~64% Germany · fiscal rule ~34% Peru · regional low Japan proves the threshold is not mechanical: who holds the debt, in which currency and at what maturity matters as much as the level. Source: IMF, World Economic Outlook Database (April 2024). https://www.imf.org/en/publications/weo/weo-database/2024/april<br>
slide21. 4. Public debt / GDP — IMF WEO data General government net debt, selected economies of Latin America and the Caribbean, 2020–2027. Read Peru against the region. Peru stays in the 20–24% band throughout the period, well inside the manageable zone and among the lowest in the region — a fiscal strength that partly offsets its political volatility. Source: International Monetary Fund, World Economic Outlook Database, April 2024.<br>
slide22. 5. The Gini coefficient — income inequality It measures how unequally income is distributed within a country. THE SCALE
0 = everyone earns exactly the same (perfect equality)
1 = a single person holds all the income (maximum inequality)
In practice no country sits at 0 or 1 — the real range runs from about 0.25 (Nordic countries) to about 0.63 (South Africa). WHY IT MATTERS FOR IB
It defines the breadth of the consumer market: who can actually afford your product.
High inequality means a narrow premium segment plus a large low-income mass market — two different value propositions, not one. LOW INEQUALITY < 0.30 Nordic countries: Sweden 0.27, Denmark 0.28 MODERATE 0.30 – 0.40 Germany 0.31, France 0.32, United Kingdom 0.35 HIGH 0.40 – 0.50 United States 0.40, Peru 0.43, China 0.38 EXTREME INEQUALITY > 0.50 Brazil 0.52, Colombia 0.52, South Africa 0.63 Source: World Bank, World Development Indicators — Gini index (SI.POV.GINI). https://data.worldbank.org/indicator/SI.POV.GINI<br>
slide23. 5. The Gini coefficient — World Bank series Gini index, selected countries, 2000–2024. Peru and Norway are highlighted as reference points. PERU: A SLOW IMPROVEMENT
Peru falls from 49.1 in 2000 to around 40.1 in 2024 — real progress, but still in the 'high inequality' band. NORWAY: THE FLOOR
Norway moves in the 25–28 range, illustrating what a broad, homogeneous consumer market looks like. WHAT IT MEANS FOR ENTRY
In Peru and Brazil, a single price point rarely works: segmentation by income is a design requirement, not an option. Source: World Bank, World Development Indicators — Gini index (SI.POV.GINI). Data last updated 13 July 2026.<br>
slide24. 6. The balance of payments A complete record of the economic transactions of a country — its individuals, firms and government — with the rest of the world.
It shows whether a country's relationship with the world is sustainable. WHO RECORDS IT
The central bank — in Peru, the BCRP. WHY IT MATTERS
It anticipates exchange rate pressure and dividend repatriation risk. THE ACCOUNTING RULE
By construction the accounts balance: every inflow has a matching outflow.<br>
slide25. 6. The balance of payments — structure A. CURRENT ACCOUNT
Flow of income from real activity (trade, services, remittances).
Formula: trade (X – M) + primary income + secondary income.
Goods, services, investment income, remittances.
Germany +US$ 285bn | United States −US$ 800bn (2023). B. CAPITAL ACCOUNT
Transfer of rights over assets, usually non-repayable and infrequent.
Formula: capital transfers + transactions in non-produced, non-financial assets.
Debt forgiveness, migrants' transfers, rights over natural resources.
Relatively small in most economies. C. FINANCIAL ACCOUNT
Flow of investment and lending.
Formula: FDI + portfolio investment + financial derivatives + reserves.
Foreign direct investment, equity and bond flows, loans.
A large surplus here can mask a current account deficit. D. ERRORS AND OMISSIONS
What could not be recorded — it varies from year to year.
It is the balancing item that closes the accounts.
Unrecorded trade, timing differences, valuation effects.
A persistently large figure is itself a data-quality signal. Source: IMF, Balance of Payments and International Investment Position Manual (BPM6); World Bank BOP data, 2024.<br>
slide26. 6. Balance of payments — A. Current account Flow of income from real activity: trade, services and remittances. Three Peruvian examples. COPPER EXPORTS — THE LARGEST ITEM
Peru is the world's second largest copper producer. In 2023 it exported around US$ 12,000 million in copper alone (BCRP, 2024). Every shipment from Las Bambas or Antamina to China is recorded as an inflow in the current account. REMITTANCES — UNDERESTIMATED BUT LARGE
In 2023 Peruvians abroad sent around US$ 4,200 million home (BCRP, 2024). In some years that exceeds total FDI. It enters as secondary income in the current account. DIVIDENDS PAID ABROAD — THE OTHER SIDE
Foreign mining companies (Glencore, BHP, Freeport) repatriated profits of around US$ 3,500 million in 2023. That leaves the current account as primary income. Source: IMF, Balance of Payments Manual (BPM6); BCRP balance of payments statistics, 2024.<br>
slide27. 6. Balance of payments — B. Capital account Transfer of rights over assets: usually non-repayable and infrequent. Inflows above, outflows below. INFLOWS EXTERNAL DEBT FORGIVENESS
The Paris Club tells Peru: 'we forgive the US$ 500 million you owed us'. Peru receives no cash, but in accounting terms it is released from an obligation. That enters as income in the capital account because it improves the country's external financial position. ARRIVING MIGRANTS' TRANSFERS
A Peruvian who emigrates back from Canada and liquidates their savings there to bring them to Peru — that transfer of wealth enters Peru. CAPITAL GRANTS FROM INTERNATIONAL ORGANISATIONS
The IDB or the World Bank donates US$ 200 million to build infrastructure in Peru — not a loan, a non-repayable grant. That enters as a capital transfer. OUTFLOWS CONCESSIONS OF NATURAL RESOURCES ABROAD
When Peru grants a foreign firm the right to exploit a mine or an oil field, it is transferring a non-produced asset abroad. That leaves the capital account. EMIGRANTS TAKING THEIR WEALTH OUT
A Peruvian entrepreneur who moves to Miami and transfers their savings and assets abroad — that wealth leaves the capital account. Source: IMF, Balance of Payments Manual (BPM6); World Bank BOP data, 2024.<br>
slide28. 6. Balance of payments — C. Financial account Flow of investment and lending. Three Peruvian examples from 2023. IN FDI IN MINING
In 2023 Peru received around US$ 3,500 million in FDI, mainly in mining and energy (ProInversión, 2024). It enters as foreign direct investment in the financial account. IN SOVEREIGN BONDS
In 2023 the government issued around US$ 1,000 million of bonds on international markets. That money enters the financial account as other investment. OUT PRIVATE CAPITAL OUTFLOWS
Peruvian firms and individuals invested around US$ 800 million abroad in 2023. That leaves the financial account. Source: IMF, Balance of Payments Manual (BPM6); BCRP and ProInversión, 2024.<br>
slide29. 6. Peru's balance of payments (millions of USD) HOW TO READ THE TABLE
Section I is the current account, section II the financial account, section III errors and omissions, and section IV the overall balance-of-payments result.
The columns compare the 2025 outturn with the projections published in the December 2025 and March 2026 Inflation Reports for 2026 and 2027. WHAT TO LOOK FOR
A current account surplus driven by the trade balance, while primary income stays strongly negative — profit repatriation by foreign mining firms.
Remittances from abroad keep growing, cushioning the external accounts. Source: BCRP, Reporte de Inflación — Panorama actual y proyecciones macroeconómicas 2026-2027, marzo 2026, Table 10. *Projection.<br>
slide30. References Banco Central de Reserva del Perú. (2026). Reporte de Inflación: panorama actual y proyecciones macroeconómicas 2026-2027, marzo 2026. BCRP. https://www.bcrp.gob.pe/docs/Publicaciones/Reporte-Inflacion/2026/marzo/reporte-de-inflacion-marzo-2026.pdf Banco Central de Reserva del Perú. (2024). Estadísticas de balanza de pagos y cuentas nacionales. BCRP. https://www.bcrp.gob.pe/estadisticas.html Hill, C. W. L., & Hult, G. T. M. (2022). International Business: Competing in the Global Marketplace (13th ed.). McGraw-Hill. International Labour Organization. (2024). Statistics on the informal economy. ILOSTAT. https://ilostat.ilo.org/topics/informality/ International Monetary Fund. (2024). World Economic Outlook Database, April 2024. IMF. https://www.imf.org/en/publications/weo/weo-database/2024/april International Monetary Fund. (2025). World Economic Outlook 2025: unemployment projections for Latin America. IMF. https://www.imf.org/en/Publications/WEO International Monetary Fund. (2009/2024). Balance of Payments and International Investment Position Manual (BPM6). IMF. https://www.imf.org/external/pubs/ft/bop/2007/bopman6.htm Keynes, J. M. (1936). The General Theory of Employment, Interest and Money. Macmillan.<br>
slide31. References Kuznets, S. (1934). National Income, 1929–1932. Senate Document No. 124, 73rd US Congress, 2nd Session. Phillips, A. W. (1958). The relation between unemployment and the rate of change of money wage rates in the United Kingdom, 1861–1957. Economica, 25(100), 283–299. ProInversión. (2024). Estadísticas de inversión extranjera directa en el Perú. Agencia de Promoción de la Inversión Privada. https://www.investinperu.pe Statista. (2025). El desempleo en Latinoamérica: tasa de desempleo en países seleccionados de América Latina [Infographic], based on IMF, World Economic Outlook 2025. https://es.statista.com Statista. (2024). La informalidad laboral en Latinoamérica [Infographic], based on ILO data. https://es.statista.com World Bank. (2026). World Development Indicators — Gini index (SI.POV.GINI). World Bank Group. https://data.worldbank.org/indicator/SI.POV.GINI World Bank. (2025). World Bank Country and Lending Groups — income classifications by GNI per capita (Atlas method). https://datahelpdesk.worldbank.org/knowledgebase/articles/906519<br>
slide32. Thank you!<br>