
KS3 Mean, Mode, Range Dr J Frost




Description: KS3 Mean, Mode, Range Dr J Frost (jfrosttiffin.kingston.sch.uk) Last modified: 12th October 2013 Averages There are different averages: some are more meaningful than others depending on the context. What is the average number of ears in
Related Topics
Download Presentation
"KS3 Mean, Mode, Range Dr J Frost" is the property of its rightful owner. Permission is granted to download and print the materials on this website for personal, non-commercial use only, and to display it on your personal computer provided you do not modify the materials and that you retain all copyright notices contained in the materials. By downloading content from our website, you accept the terms of this agreement.
Presentation Transcript
slide1. KS3 Mean, Mode, Range Dr J Frost (jfrost@tiffin.kingston.sch.uk) Last modified: 12th October 2013<br>
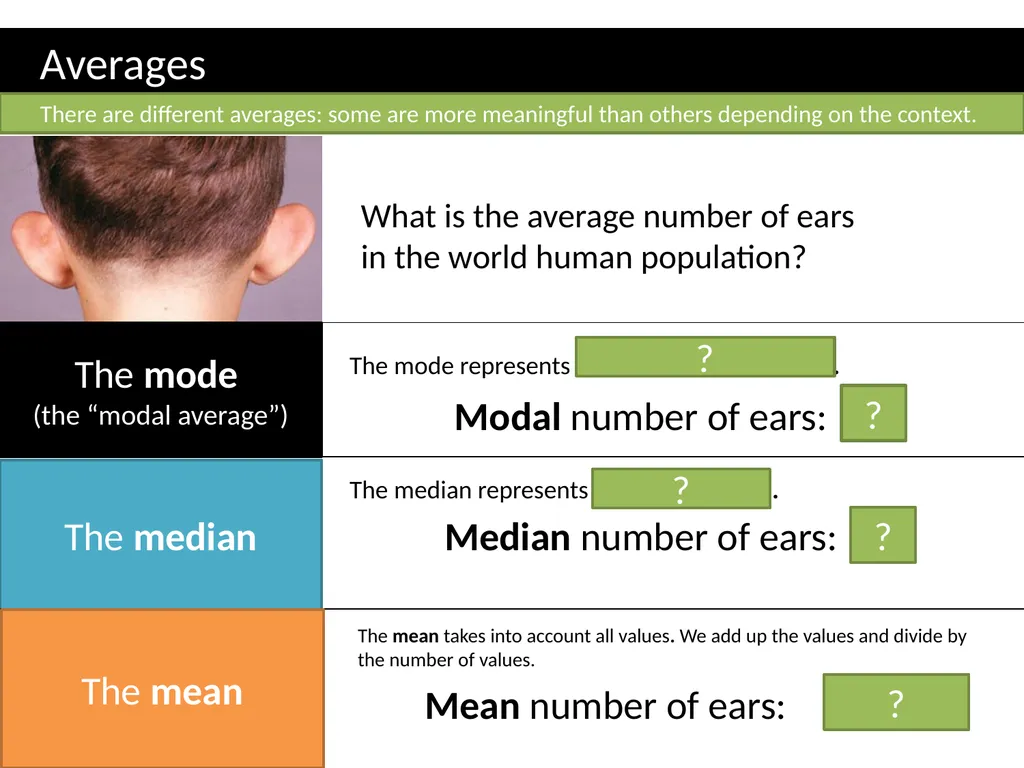
slide2. Averages There are different averages: some are more meaningful than others depending on the context. What is the average number of ears in the world human population? The mode
(the “modal average”) The median The mean The mode represents the most common value. Modal number of ears: 2 ? Median number of ears: 2 ? ? The median represents the middle value. ? The mean takes into account all values. We add up the values and divide by the number of values. Mean number of ears: 1.99999 ?<br>
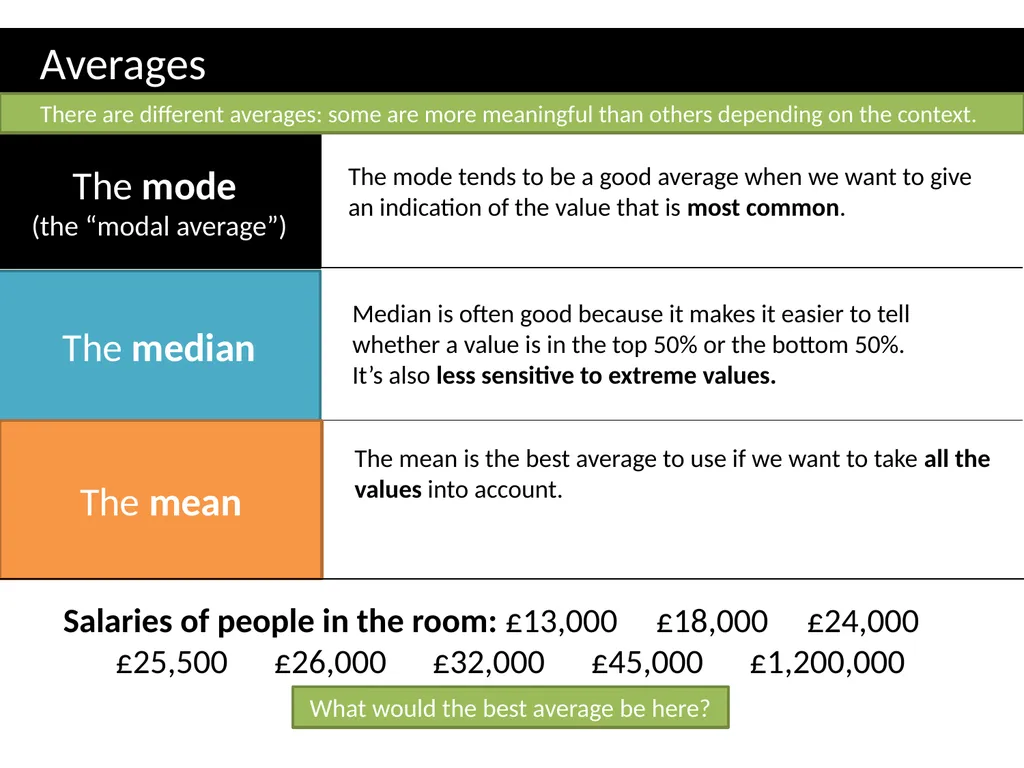
slide3. Averages The mode
(the “modal average”) The median The mean The mode tends to be a good average when we want to give an indication of the value that is most common. Median is often good because it makes it easier to tell whether a value is in the top 50% or the bottom 50%.
It’s also less sensitive to extreme values. The mean is the best average to use if we want to take all the values into account. There are different averages: some are more meaningful than others depending on the context. Salaries of people in the room: £13,000 £18,000 £24,000 £25,500 £26,000 £32,000 £45,000 £1,200,000 What would the best average be here?<br>
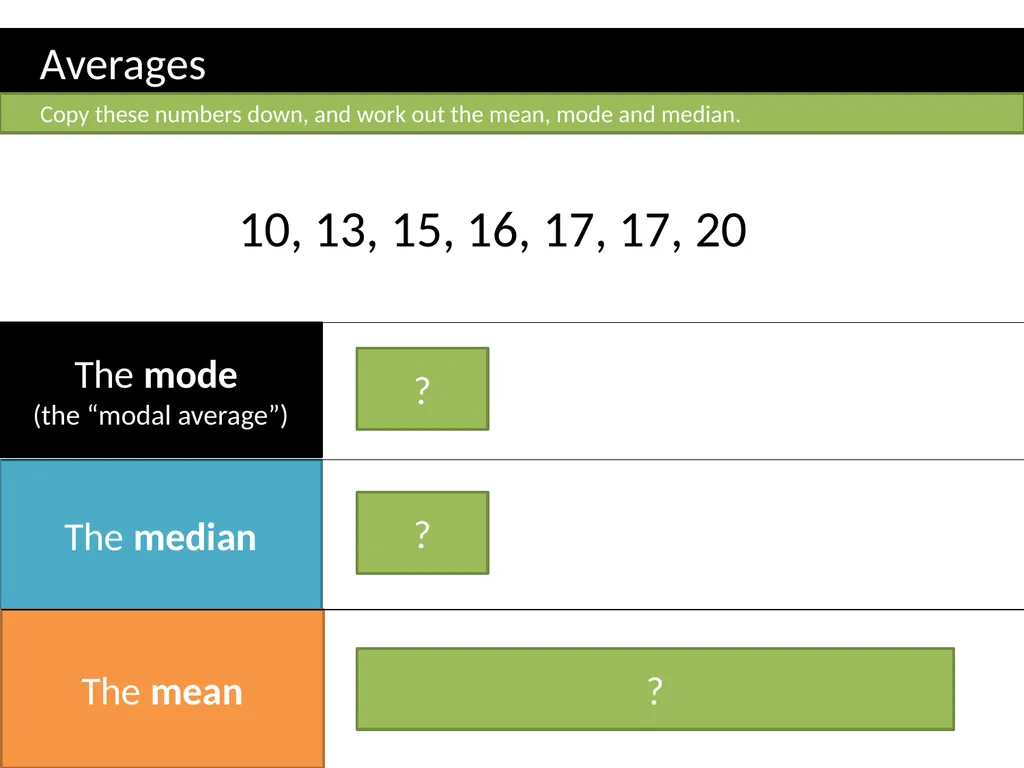
slide4. Averages Copy these numbers down, and work out the mean, mode and median. 10, 13, 15, 16, 17, 17, 20 The mode
(the “modal average”) The median The mean 10 + 13 + 15 + 16 + 17 + 17 + 20
7 = 15.43 ? 16 ? 17 ?<br>
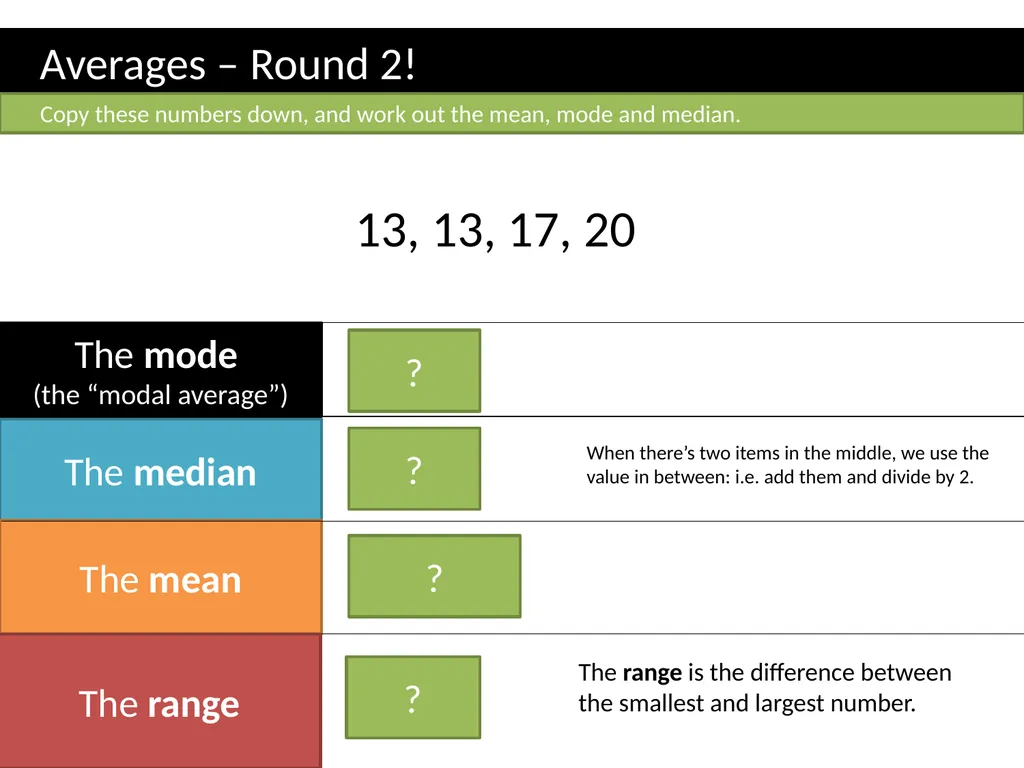
slide5. Averages – Round 2! Copy these numbers down, and work out the mean, mode and median. 13, 13, 17, 20 The mode
(the “modal average”) The median The mean 15 ? 13 ? The range 15.75 7 ? ? The range is the difference between the smallest and largest number. When there’s two items in the middle, we use the value in between: i.e. add them and divide by 2.<br>
slide6. In pairs, see how many of these puzzles you can work out… The mean average of Dr Frost and Sebastian’s age is 19.5. If Sebastian is 13, how old is Dr Frost? Answer: 26 ? If the range of two numbers is 6 and the their mean is 15, what are the two numbers? Answer: 12 and 18 ? The mode of four numbers is 5. The median is 6.5 and the mean is 7. What is the range? Answer: 7
(The numbers are 5, 5, 6, 12) ? The mean of the four numbers is 8. What is the missing number? 3 4 5 ? Answer: 20 ? 1 2 3 4<br>
slide7. Worksheet provided!<br>
slide8. KS3 Mean of Frequency Tables Dr J Frost (jfrost@tiffin.kingston.sch.uk) Last modified: 22nd November 2013<br>
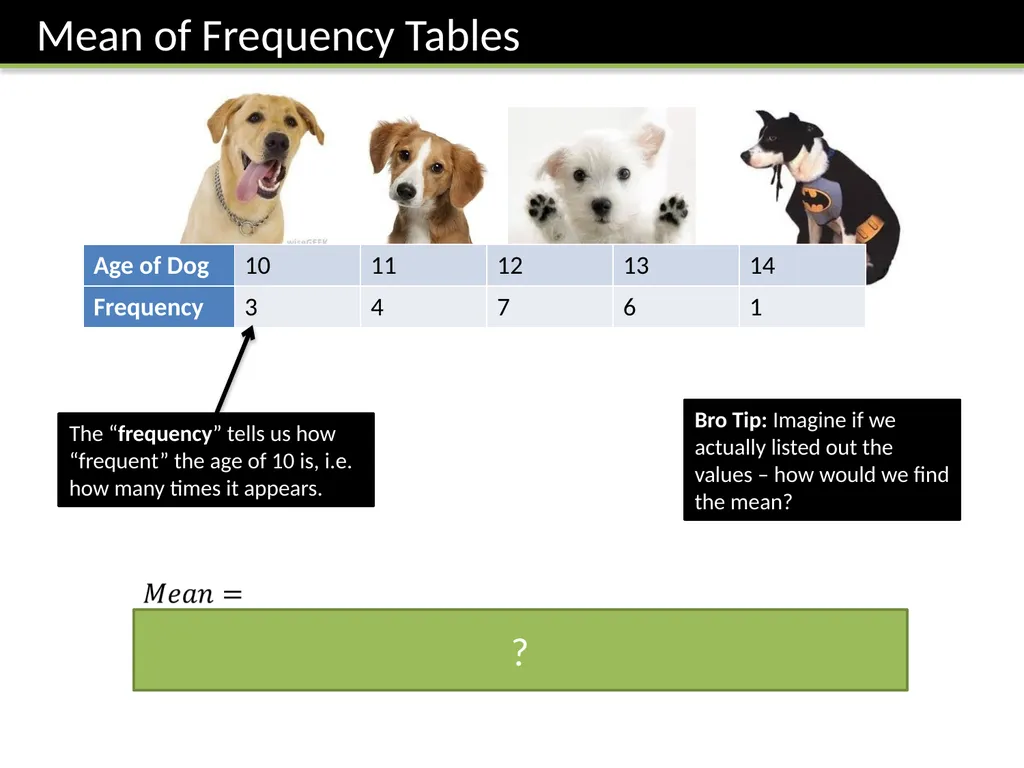
slide9. The “frequency” tells us how “frequent” the age of 10 is, i.e. how many times it appears. ? Bro Tip: Imagine if we actually listed out the values – how would we find the mean?<br>
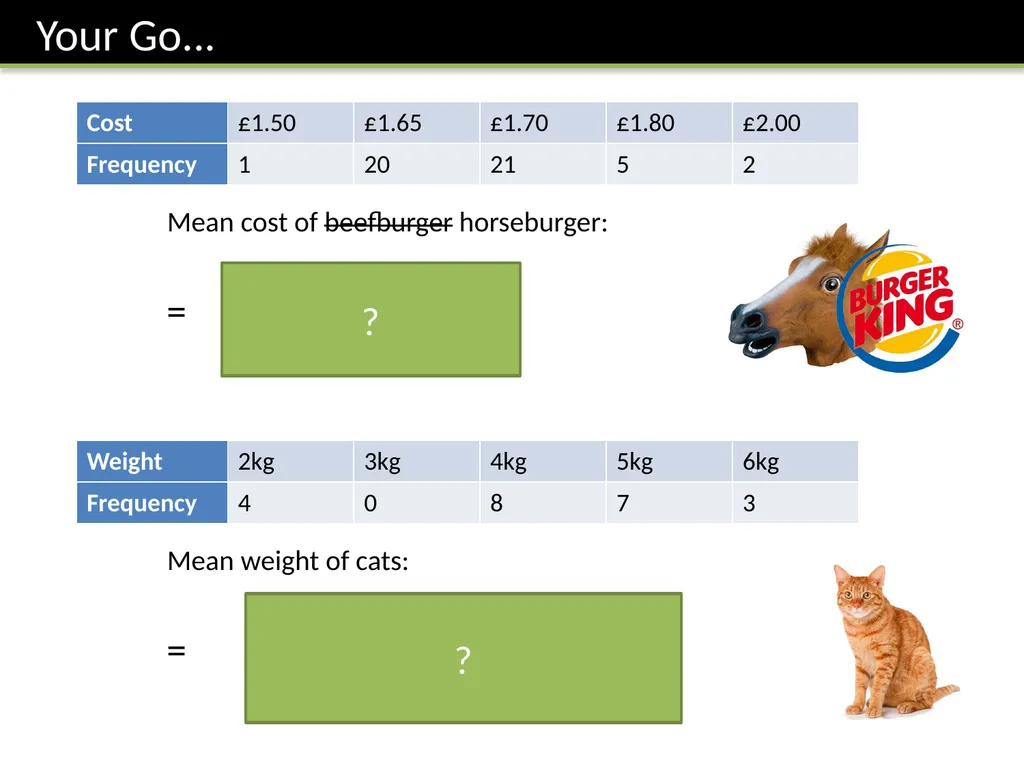
slide10. ? ?<br>
slide11. A number of members of 8IW are running in a race.
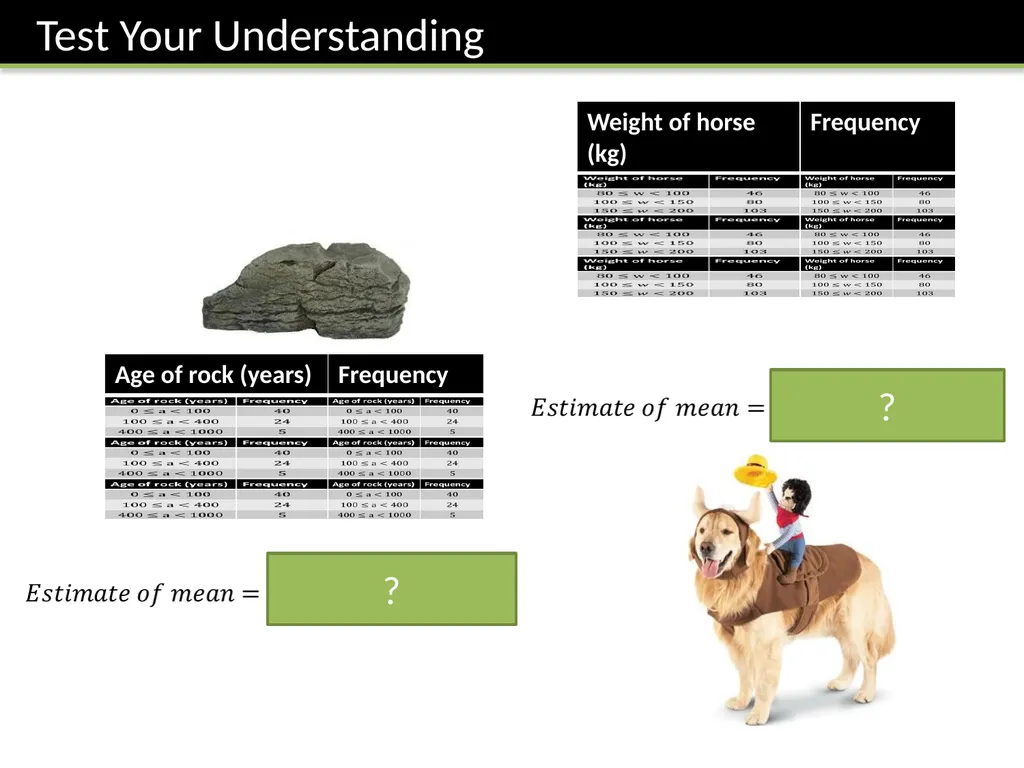
Their times were as follows ? Why is it an estimate? Because we don’t know the exact times within each group. ?<br>
slide12. ? ?<br>
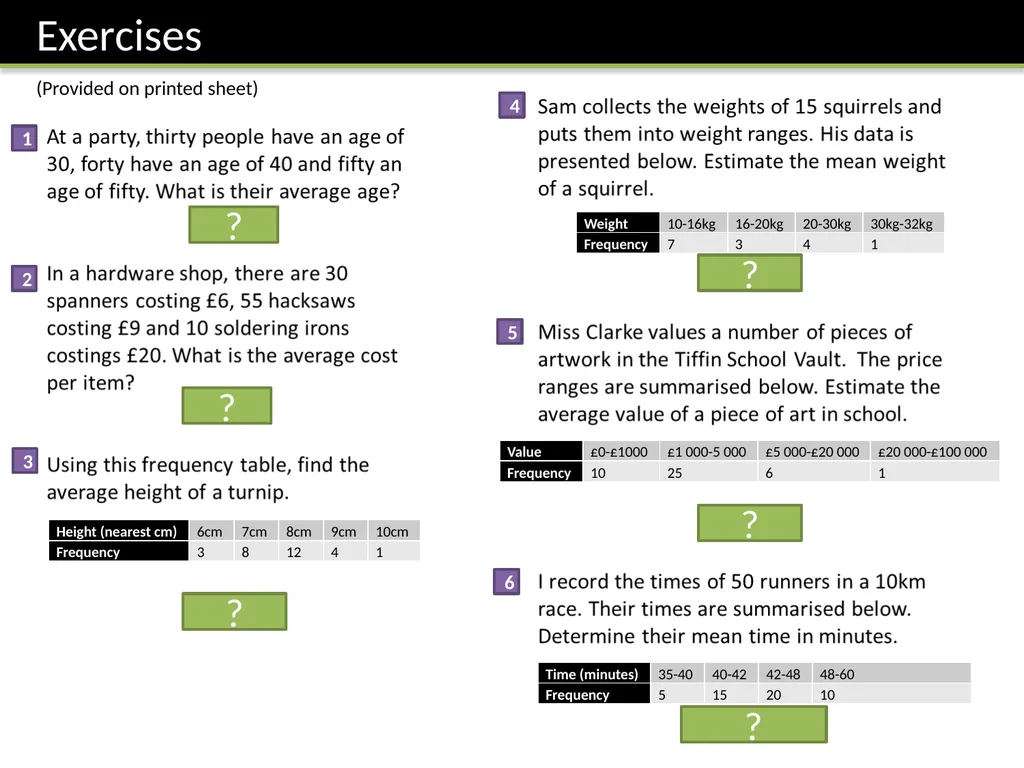
slide13. (Provided on printed sheet) ? ? ? ? ? ? 1 2 3 4 5 6<br>
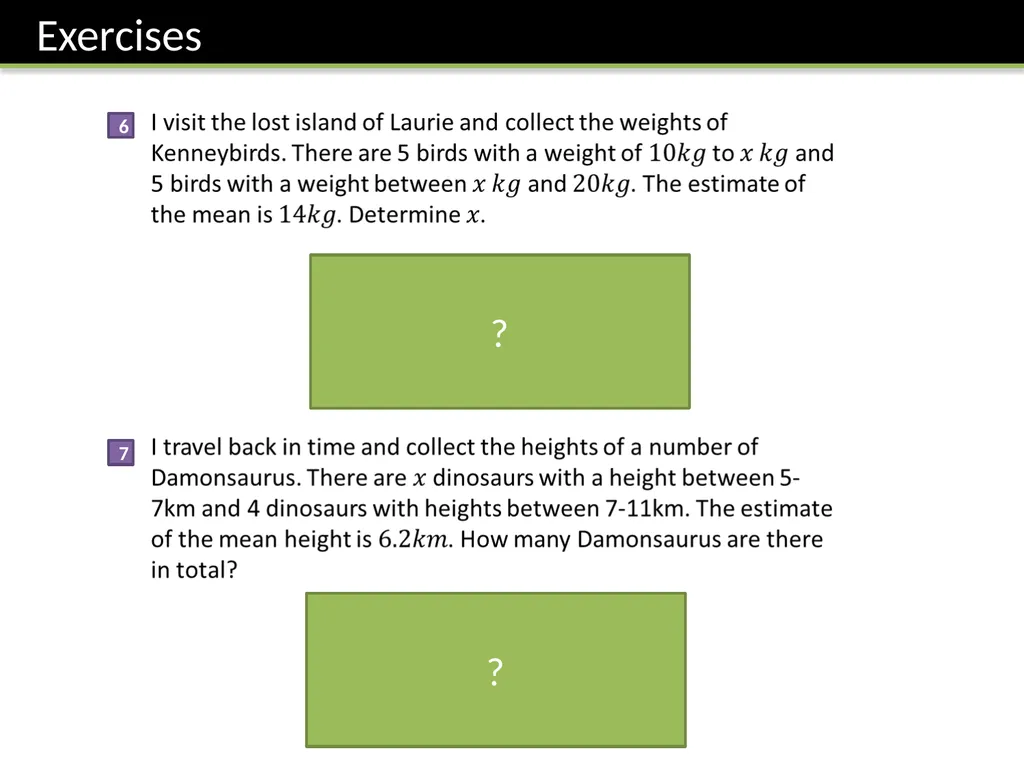
slide14. ? ? 6 7<br>
slide2. Averages There are different averages: some are more meaningful than others depending on the context. What is the average number of ears in the world human population? The mode
(the “modal average”) The median The mean The mode represents the most common value. Modal number of ears: 2 ? Median number of ears: 2 ? ? The median represents the middle value. ? The mean takes into account all values. We add up the values and divide by the number of values. Mean number of ears: 1.99999 ?<br>
slide3. Averages The mode
(the “modal average”) The median The mean The mode tends to be a good average when we want to give an indication of the value that is most common. Median is often good because it makes it easier to tell whether a value is in the top 50% or the bottom 50%.
It’s also less sensitive to extreme values. The mean is the best average to use if we want to take all the values into account. There are different averages: some are more meaningful than others depending on the context. Salaries of people in the room: £13,000 £18,000 £24,000 £25,500 £26,000 £32,000 £45,000 £1,200,000 What would the best average be here?<br>
slide4. Averages Copy these numbers down, and work out the mean, mode and median. 10, 13, 15, 16, 17, 17, 20 The mode
(the “modal average”) The median The mean 10 + 13 + 15 + 16 + 17 + 17 + 20
7 = 15.43 ? 16 ? 17 ?<br>
slide5. Averages – Round 2! Copy these numbers down, and work out the mean, mode and median. 13, 13, 17, 20 The mode
(the “modal average”) The median The mean 15 ? 13 ? The range 15.75 7 ? ? The range is the difference between the smallest and largest number. When there’s two items in the middle, we use the value in between: i.e. add them and divide by 2.<br>
slide6. In pairs, see how many of these puzzles you can work out… The mean average of Dr Frost and Sebastian’s age is 19.5. If Sebastian is 13, how old is Dr Frost? Answer: 26 ? If the range of two numbers is 6 and the their mean is 15, what are the two numbers? Answer: 12 and 18 ? The mode of four numbers is 5. The median is 6.5 and the mean is 7. What is the range? Answer: 7
(The numbers are 5, 5, 6, 12) ? The mean of the four numbers is 8. What is the missing number? 3 4 5 ? Answer: 20 ? 1 2 3 4<br>
slide7. Worksheet provided!<br>
slide8. KS3 Mean of Frequency Tables Dr J Frost (jfrost@tiffin.kingston.sch.uk) Last modified: 22nd November 2013<br>
slide9. The “frequency” tells us how “frequent” the age of 10 is, i.e. how many times it appears. ? Bro Tip: Imagine if we actually listed out the values – how would we find the mean?<br>
slide10. ? ?<br>
slide11. A number of members of 8IW are running in a race.
Their times were as follows ? Why is it an estimate? Because we don’t know the exact times within each group. ?<br>
slide12. ? ?<br>
slide13. (Provided on printed sheet) ? ? ? ? ? ? 1 2 3 4 5 6<br>
slide14. ? ? 6 7<br>