
Laboratory Demonstration - 1 Analytical Chemistry
MY
Published · 33 slides · 0 views
1 / 1


Description
Laboratory Demonstration - 1 Analytical Chemistry Dr Sotiris Kyriakou 5th October 2026 Chromatography is a separation technique based on the different interactions of compounds with two phases, a mobile phase and a stationary phase, as the
Related Topics
Share
Embed code
Download this presentation From Below
"Laboratory Demonstration - 1 Analytical Chemistry" is the property of its rightful owner. Permission is granted to download and print the materials on this website for personal, non-commercial use only, and to display it on your personal computer provided you do not modify the materials and that you retain all copyright notices contained in the materials. By downloading content from our website, you accept the terms of this agreement.
Presentation Transcript
01
Laboratory Demonstration - 1
Analytical Chemistry Dr Sotiris Kyriakou
5th October 2026<br>
02
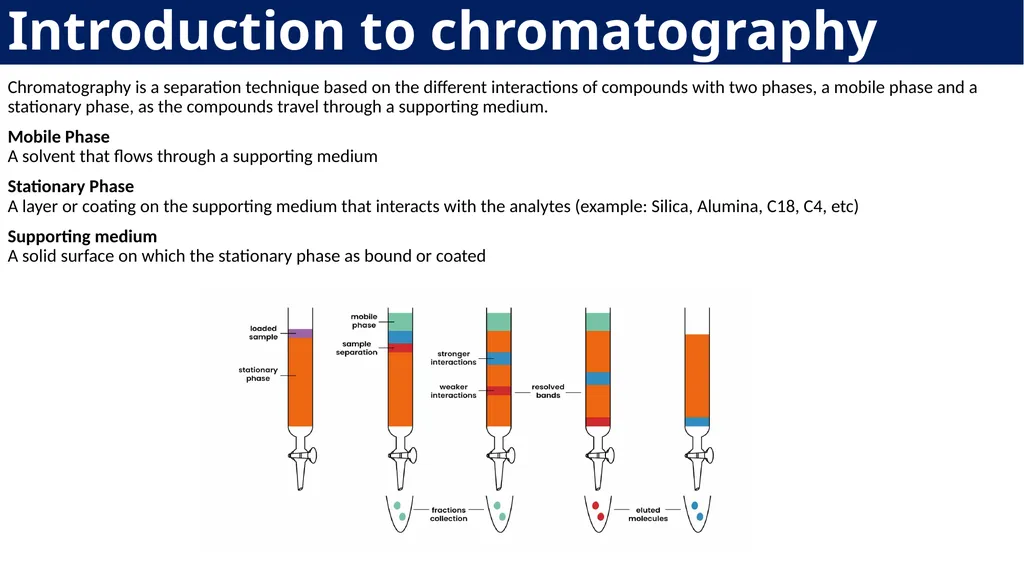
Chromatography is a separation technique based on the different interactions of compounds with two phases, a mobile phase and a stationary phase, as the compounds travel through a supporting medium.
Mobile Phase A solvent that flows through a supporting medium
Stationary Phase A layer or coating on the supporting medium that interacts with the analytes (example: Silica, Alumina, C18, C4, etc)
Supporting medium A solid surface on which the stationary phase as bound or coated Introduction to chromatography<br>
Mobile Phase A solvent that flows through a supporting medium
Stationary Phase A layer or coating on the supporting medium that interacts with the analytes (example: Silica, Alumina, C18, C4, etc)
Supporting medium A solid surface on which the stationary phase as bound or coated Introduction to chromatography<br>
03
Principles of chromatography The main principle involved in column chromatography is the adsorption of the solutes of the solution with the help of a stationary phase and afterward separates the mixture into independent components.
At the point when the mobile phase together with the mixture that requires to be isolated is brought in from the top of the column, the movement of the individual components of the mixture is at various rates.
The components with lower adsorption and affinity to the stationary phase head out quicker when contrasted with the greater adsorption and affinity with the stationary phase. The components that move rapidly are taken out first through the components that move slowly are eluted out last.
The absorption of solute molecules to the column happens reversibly.
The pace of the movement of the components is communicated as: Rf (retardation factor )= the distance traveled by solute/ the distance traveled by the solvent<br>
At the point when the mobile phase together with the mixture that requires to be isolated is brought in from the top of the column, the movement of the individual components of the mixture is at various rates.
The components with lower adsorption and affinity to the stationary phase head out quicker when contrasted with the greater adsorption and affinity with the stationary phase. The components that move rapidly are taken out first through the components that move slowly are eluted out last.
The absorption of solute molecules to the column happens reversibly.
The pace of the movement of the components is communicated as: Rf (retardation factor )= the distance traveled by solute/ the distance traveled by the solvent<br>
04
It is a time-consuming process for the separation of compounds.
It is expensive as higher quantities of solvents are required.
The automated process becomes complicated and therefore costly.
It has a low separation power Disadvantages of convectional chromatography NEED FOR AUTOMATION<br>
It is expensive as higher quantities of solvents are required.
The automated process becomes complicated and therefore costly.
It has a low separation power Disadvantages of convectional chromatography NEED FOR AUTOMATION<br>
05
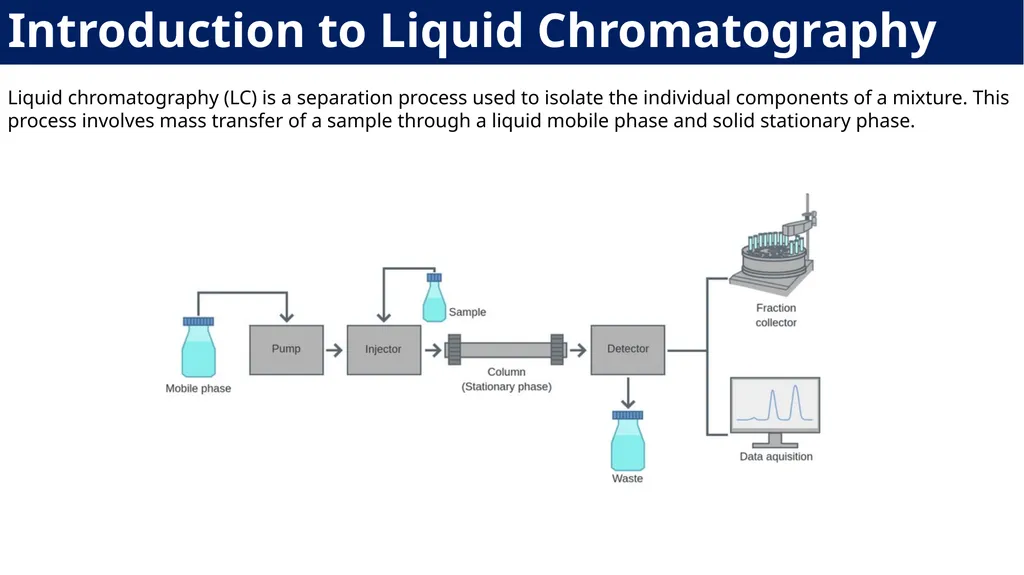
Liquid chromatography (LC) is a separation process used to isolate the individual components of a mixture. This process involves mass transfer of a sample through a liquid mobile phase and solid stationary phase. Introduction to Liquid Chromatography<br>
06
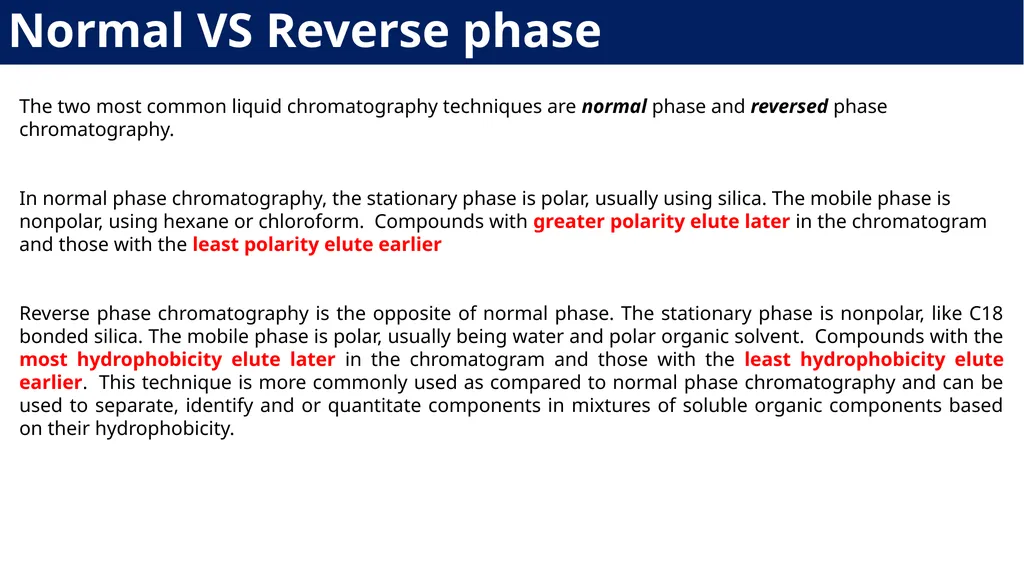
Normal VS Reverse phase The two most common liquid chromatography techniques are normal phase and reversed phase chromatography.
In normal phase chromatography, the stationary phase is polar, usually using silica. The mobile phase is nonpolar, using hexane or chloroform. Compounds with greater polarity elute later in the chromatogram and those with the least polarity elute earlier
Reverse phase chromatography is the opposite of normal phase. The stationary phase is nonpolar, like C18 bonded silica. The mobile phase is polar, usually being water and polar organic solvent. Compounds with the most hydrophobicity elute later in the chromatogram and those with the least hydrophobicity elute earlier. This technique is more commonly used as compared to normal phase chromatography and can be used to separate, identify and or quantitate components in mixtures of soluble organic components based on their hydrophobicity.<br>
In normal phase chromatography, the stationary phase is polar, usually using silica. The mobile phase is nonpolar, using hexane or chloroform. Compounds with greater polarity elute later in the chromatogram and those with the least polarity elute earlier
Reverse phase chromatography is the opposite of normal phase. The stationary phase is nonpolar, like C18 bonded silica. The mobile phase is polar, usually being water and polar organic solvent. Compounds with the most hydrophobicity elute later in the chromatogram and those with the least hydrophobicity elute earlier. This technique is more commonly used as compared to normal phase chromatography and can be used to separate, identify and or quantitate components in mixtures of soluble organic components based on their hydrophobicity.<br>
07
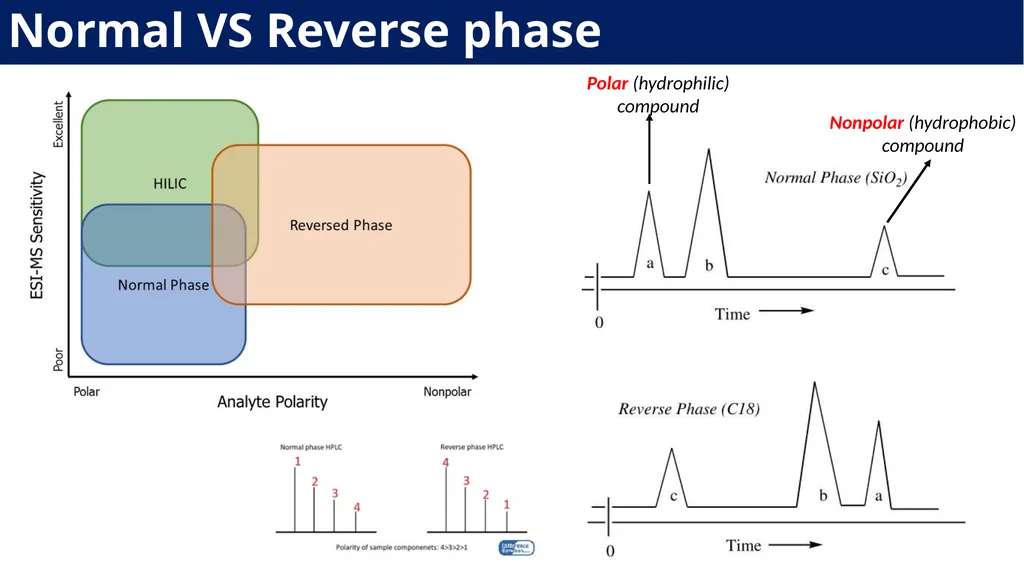
Normal VS Reverse phase Polar (hydrophilic) compound Nonpolar (hydrophobic) compound<br>
08
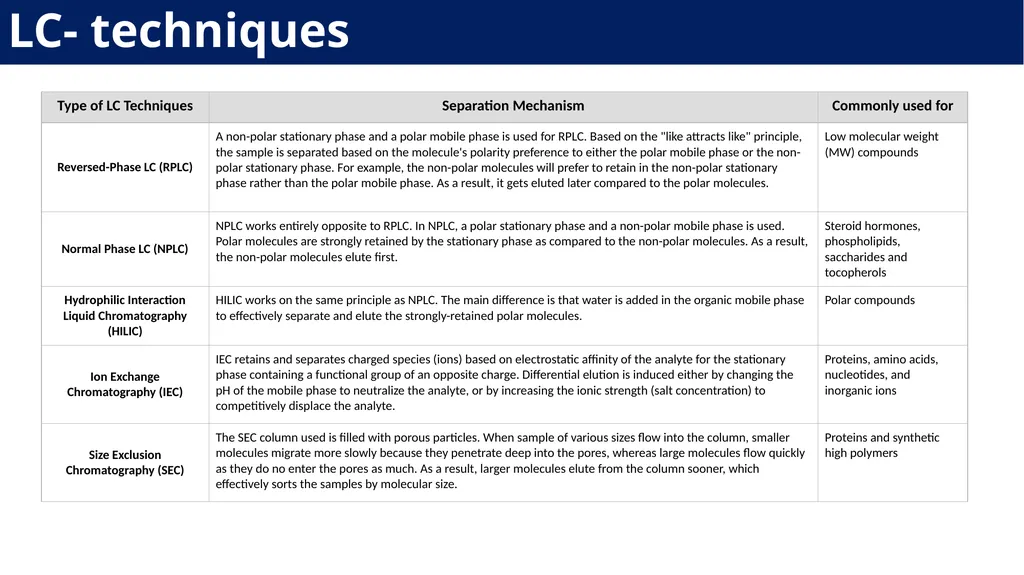
LC- techniques<br>
09
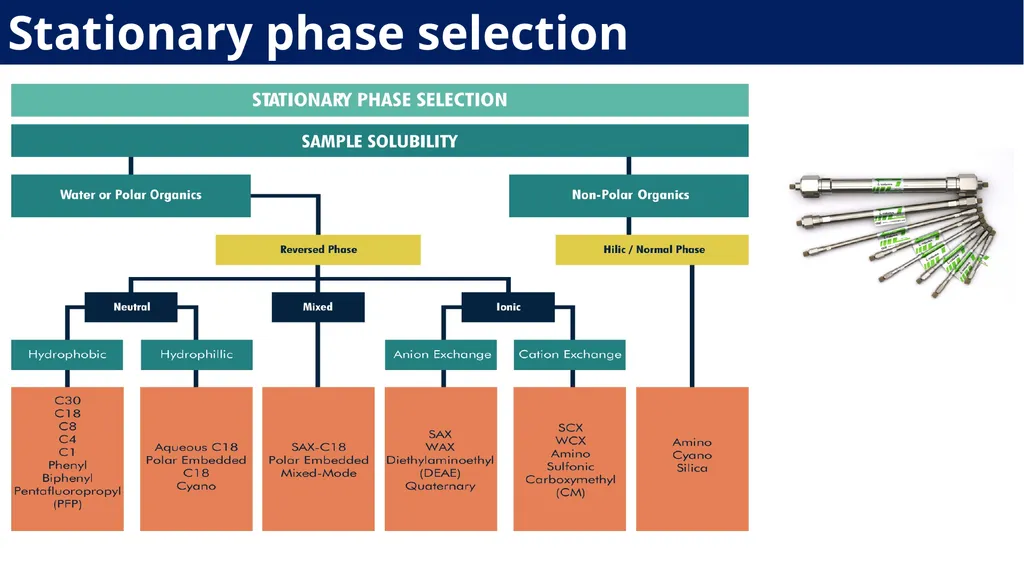
Stationary phase selection<br>
10
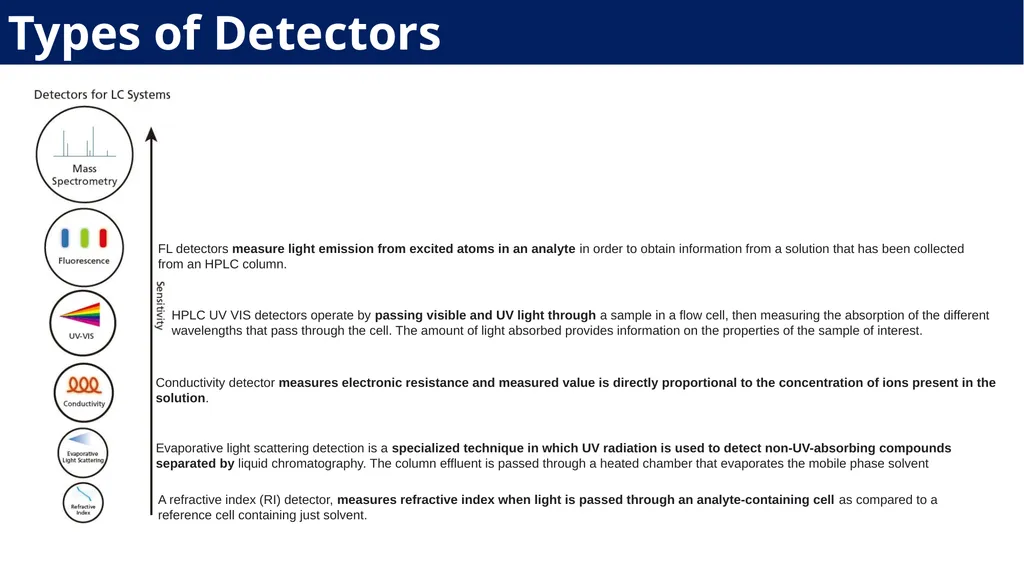
Types of Detectors Evaporative light scattering detection is a specialized technique in which UV radiation is used to detect non-UV-absorbing compounds separated by liquid chromatography. The column effluent is passed through a heated chamber that evaporates the mobile phase solvent A refractive index (RI) detector, measures refractive index when light is passed through an analyte-containing cell as compared to a reference cell containing just solvent. Conductivity detector measures electronic resistance and measured value is directly proportional to the concentration of ions present in the solution. HPLC UV VIS detectors operate by passing visible and UV light through a sample in a flow cell, then measuring the absorption of the different wavelengths that pass through the cell. The amount of light absorbed provides information on the properties of the sample of interest. FL detectors measure light emission from excited atoms in an analyte in order to obtain information from a solution that has been collected from an HPLC column.<br>
11
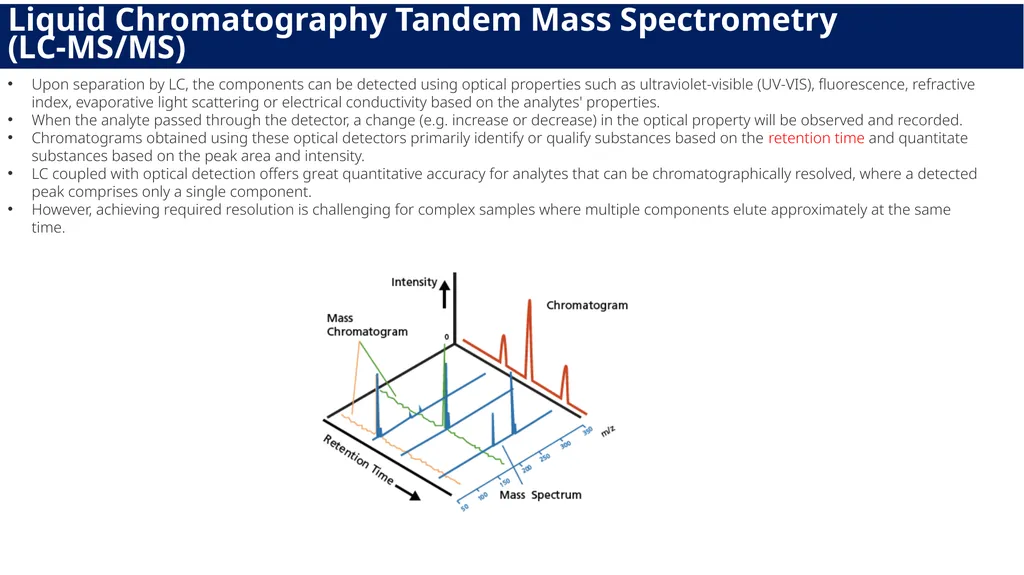
Upon separation by LC, the components can be detected using optical properties such as ultraviolet-visible (UV-VIS), fluorescence, refractive index, evaporative light scattering or electrical conductivity based on the analytes' properties.
When the analyte passed through the detector, a change (e.g. increase or decrease) in the optical property will be observed and recorded.
Chromatograms obtained using these optical detectors primarily identify or qualify substances based on the retention time and quantitate substances based on the peak area and intensity.
LC coupled with optical detection offers great quantitative accuracy for analytes that can be chromatographically resolved, where a detected peak comprises only a single component.
However, achieving required resolution is challenging for complex samples where multiple components elute approximately at the same time. Liquid Chromatography Tandem Mass Spectrometry (LC-MS/MS)<br>
When the analyte passed through the detector, a change (e.g. increase or decrease) in the optical property will be observed and recorded.
Chromatograms obtained using these optical detectors primarily identify or qualify substances based on the retention time and quantitate substances based on the peak area and intensity.
LC coupled with optical detection offers great quantitative accuracy for analytes that can be chromatographically resolved, where a detected peak comprises only a single component.
However, achieving required resolution is challenging for complex samples where multiple components elute approximately at the same time. Liquid Chromatography Tandem Mass Spectrometry (LC-MS/MS)<br>
12
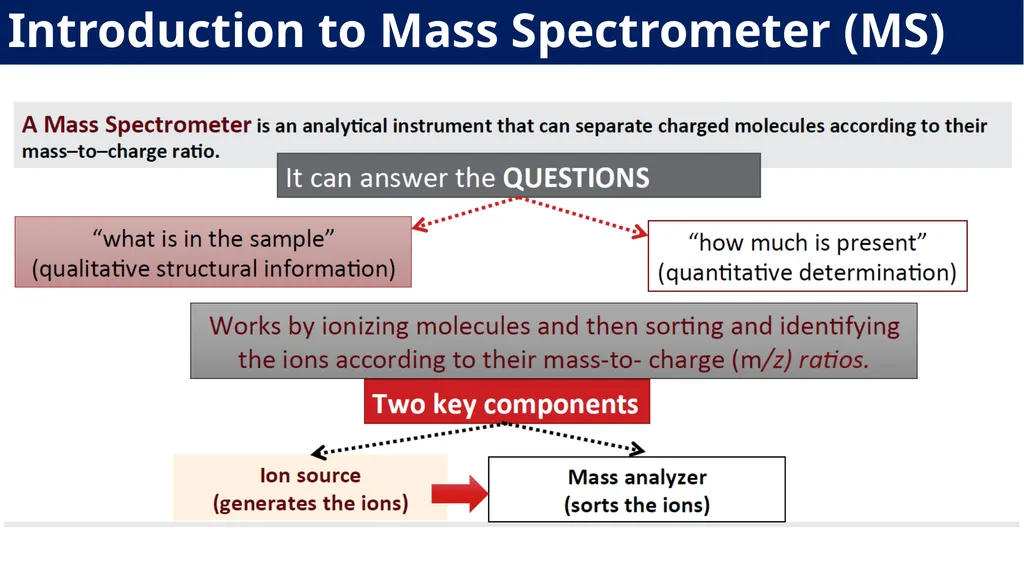
Introduction to Mass Spectrometer (MS)<br>
13
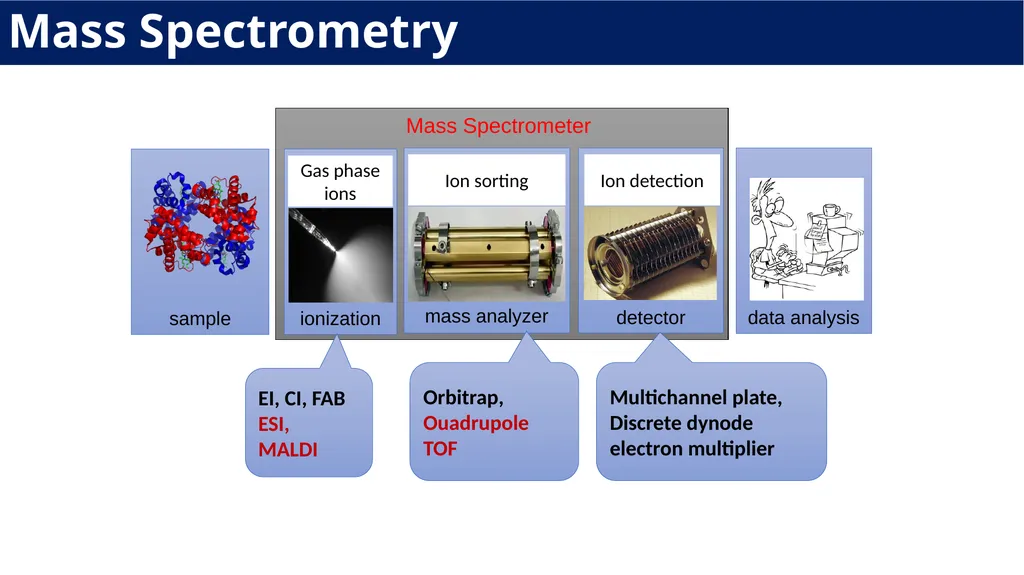
EI, CI, FAB
ESI,
MALDI Orbitrap,
Ouadrupole
TOF Multichannel plate,
Discrete dynode electron multiplier Mass Spectrometry<br>
ESI,
MALDI Orbitrap,
Ouadrupole
TOF Multichannel plate,
Discrete dynode electron multiplier Mass Spectrometry<br>
14
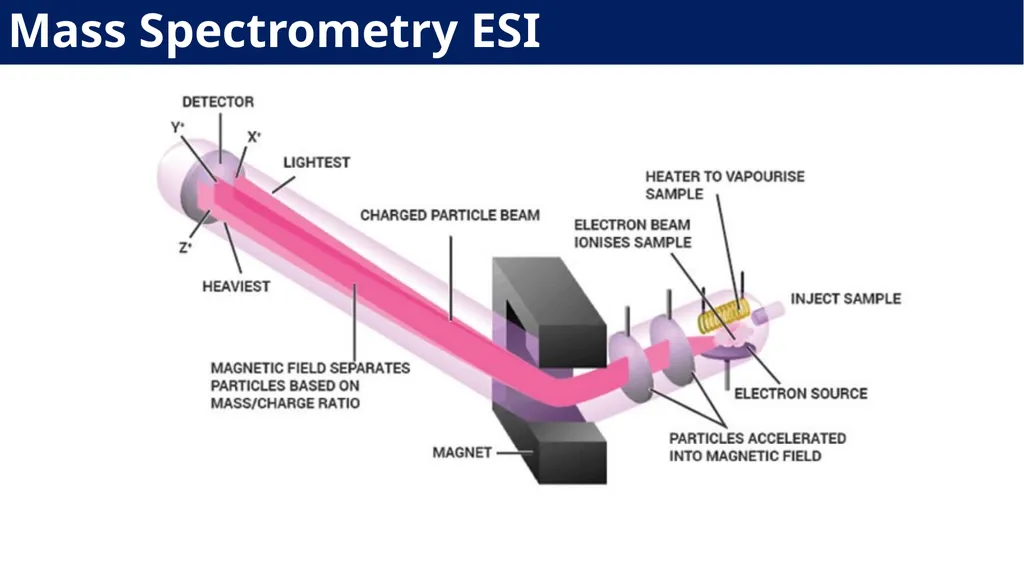
Mass Spectrometry ESI<br>
15
ESI is so useful in omics analysis because it:
allows non-volatile molecules to be transferred into the vapor phase
can produce multiply charged ions, bringing high m into the range of many mass analyzers
is easily coupled to HPLC Mass Spectrometry ESI<br>
allows non-volatile molecules to be transferred into the vapor phase
can produce multiply charged ions, bringing high m into the range of many mass analyzers
is easily coupled to HPLC Mass Spectrometry ESI<br>
16
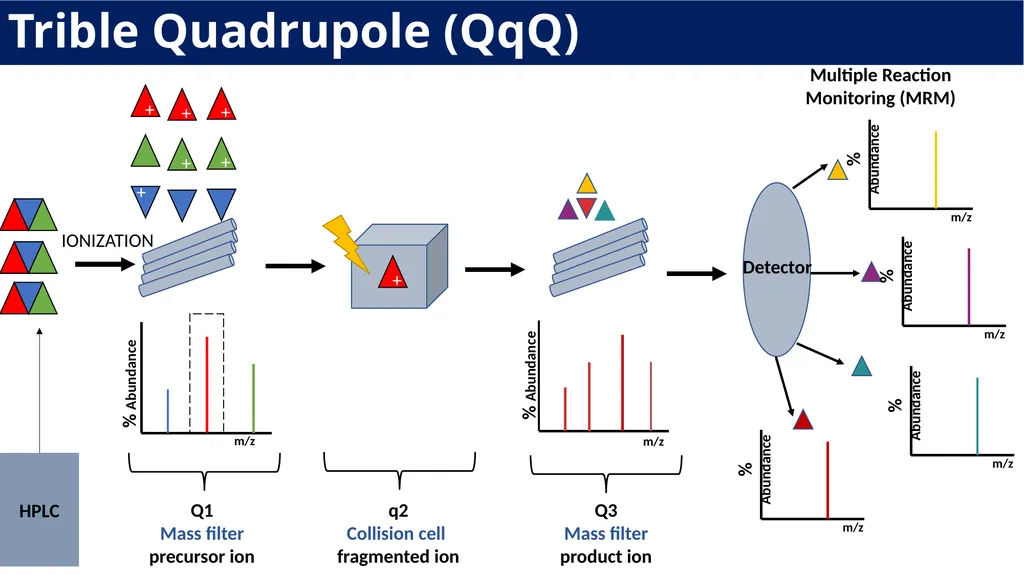
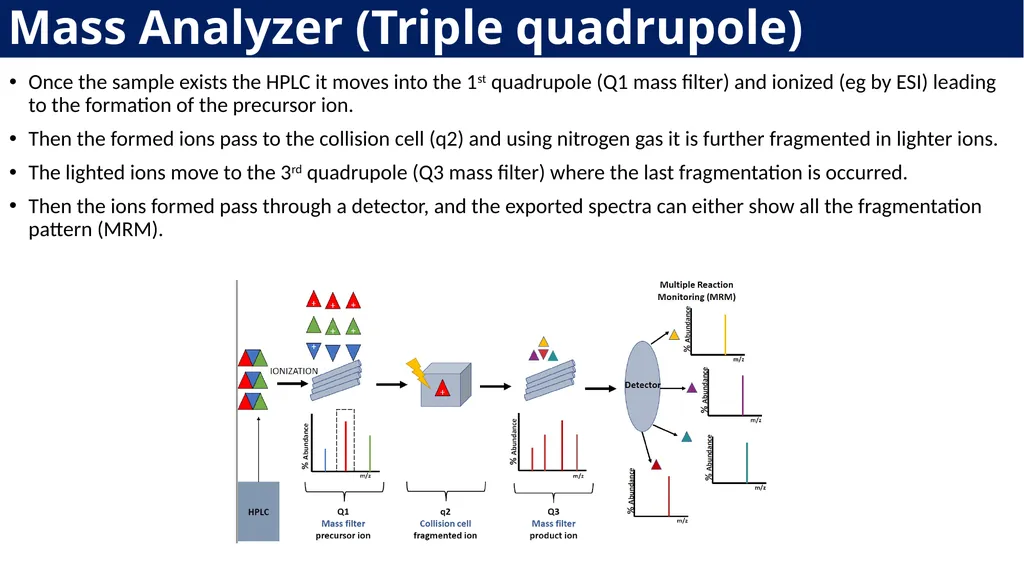
Trible Quadrupole (QqQ) HPLC IONIZATION Q1
Mass filter
precursor ion q2
Collision cell
fragmented ion Q3
Mass filter
product ion Detector m/z m/z % Abundance % Abundance Multiple Reaction Monitoring (MRM)<br>
17
Once the sample exists the HPLC it moves into the 1st quadrupole (Q1 mass filter) and ionized (eg by ESI) leading to the formation of the precursor ion.
Then the formed ions pass to the collision cell (q2) and using nitrogen gas it is further fragmented in lighter ions.
The lighted ions move to the 3rd quadrupole (Q3 mass filter) where the last fragmentation is occurred.
Then the ions formed pass through a detector, and the exported spectra can either show all the fragmentation pattern (MRM). Mass Analyzer (Triple quadrupole)<br>
Then the formed ions pass to the collision cell (q2) and using nitrogen gas it is further fragmented in lighter ions.
The lighted ions move to the 3rd quadrupole (Q3 mass filter) where the last fragmentation is occurred.
Then the ions formed pass through a detector, and the exported spectra can either show all the fragmentation pattern (MRM). Mass Analyzer (Triple quadrupole)<br>
18
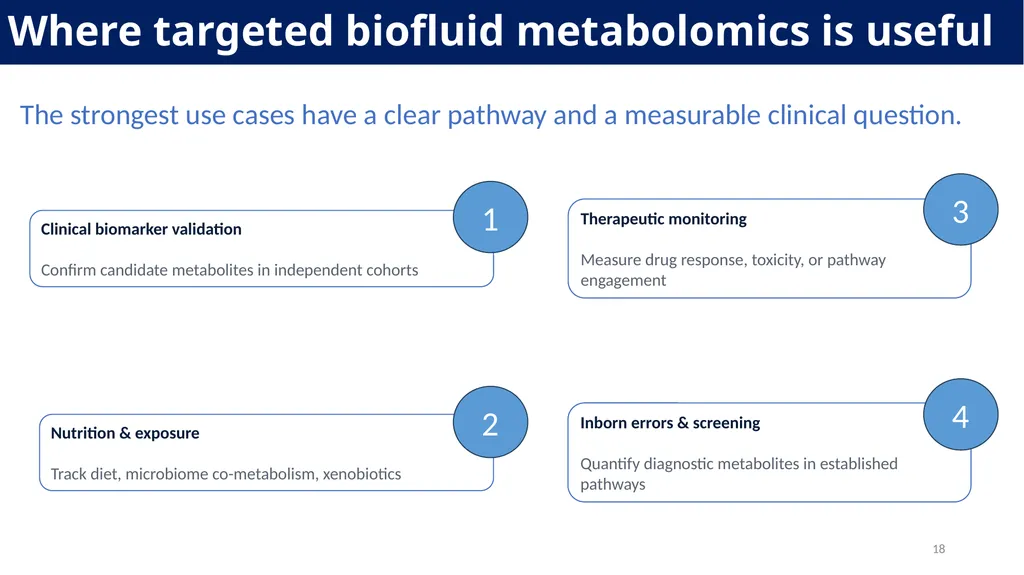
The strongest use cases have a clear pathway and a measurable clinical question. Clinical biomarker validation
Confirm candidate metabolites in independent cohorts Therapeutic monitoring
Measure drug response, toxicity, or pathway engagement Nutrition & exposure
Track diet, microbiome co-metabolism, xenobiotics Inborn errors & screening
Quantify diagnostic metabolites in established pathways 1 2 3 4 18 Where targeted biofluid metabolomics is useful<br>
Confirm candidate metabolites in independent cohorts Therapeutic monitoring
Measure drug response, toxicity, or pathway engagement Nutrition & exposure
Track diet, microbiome co-metabolism, xenobiotics Inborn errors & screening
Quantify diagnostic metabolites in established pathways 1 2 3 4 18 Where targeted biofluid metabolomics is useful<br>
19
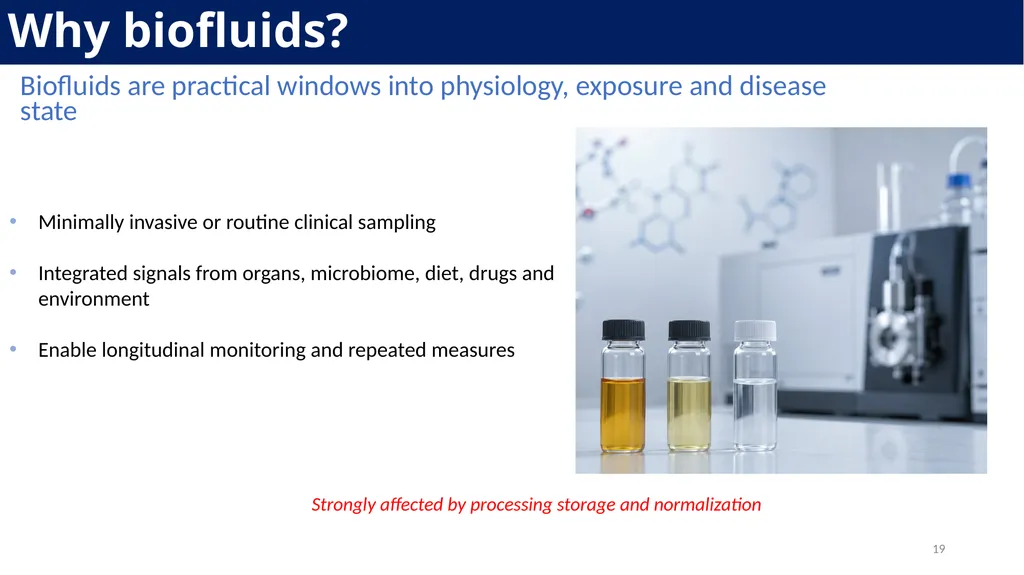
Minimally invasive or routine clinical sampling
Integrated signals from organs, microbiome, diet, drugs and environment
Enable longitudinal monitoring and repeated measures Biofluids are practical windows into physiology, exposure and disease state Strongly affected by processing storage and normalization 19 Why biofluids?<br>
Integrated signals from organs, microbiome, diet, drugs and environment
Enable longitudinal monitoring and repeated measures Biofluids are practical windows into physiology, exposure and disease state Strongly affected by processing storage and normalization 19 Why biofluids?<br>
20
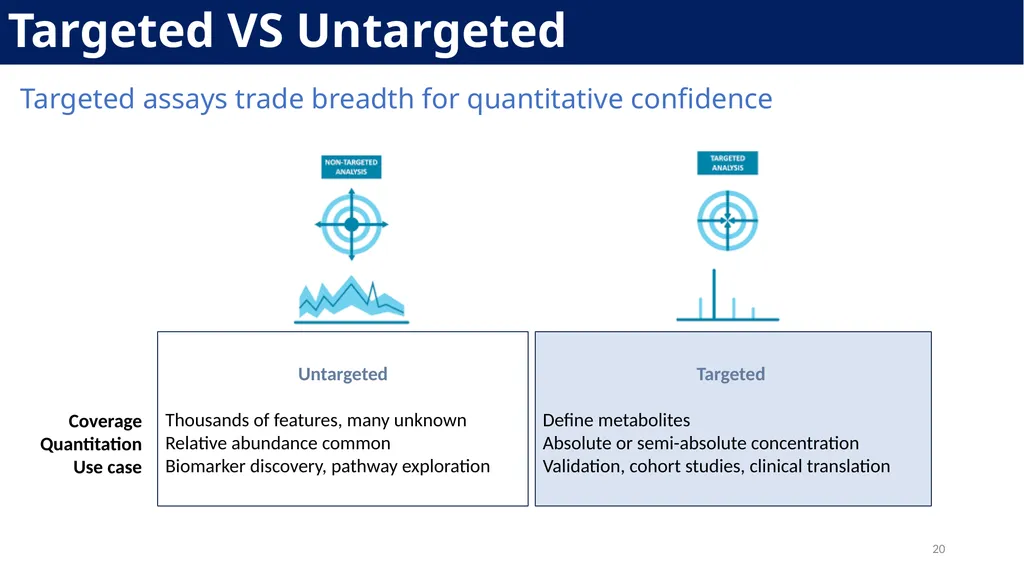
Untargeted
Thousands of features, many unknown
Relative abundance common
Biomarker discovery, pathway exploration Targeted
Define metabolites
Absolute or semi-absolute concentration
Validation, cohort studies, clinical translation Coverage
Quantitation
Use case Targeted assays trade breadth for quantitative confidence 20 Targeted VS Untargeted<br>
Thousands of features, many unknown
Relative abundance common
Biomarker discovery, pathway exploration Targeted
Define metabolites
Absolute or semi-absolute concentration
Validation, cohort studies, clinical translation Coverage
Quantitation
Use case Targeted assays trade breadth for quantitative confidence 20 Targeted VS Untargeted<br>
21
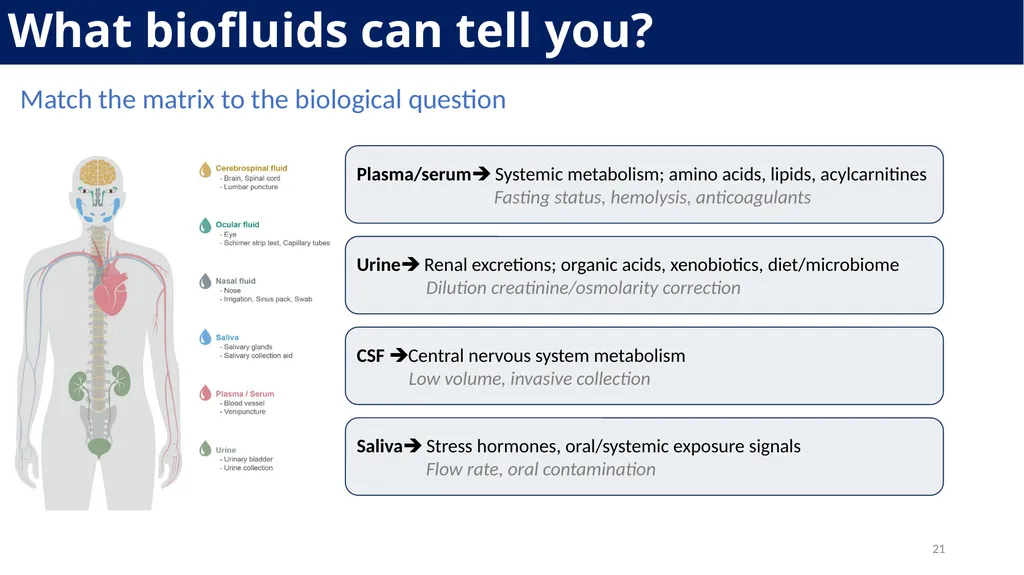
Plasma/serum Systemic metabolism; amino acids, lipids, acylcarnitines
Fasting status, hemolysis, anticoagulants Urine Renal excretions; organic acids, xenobiotics, diet/microbiome
Dilution creatinine/osmolarity correction CSF Central nervous system metabolism
Low volume, invasive collection Saliva Stress hormones, oral/systemic exposure signals
Flow rate, oral contamination Match the matrix to the biological question 21 What biofluids can tell you?<br>
22
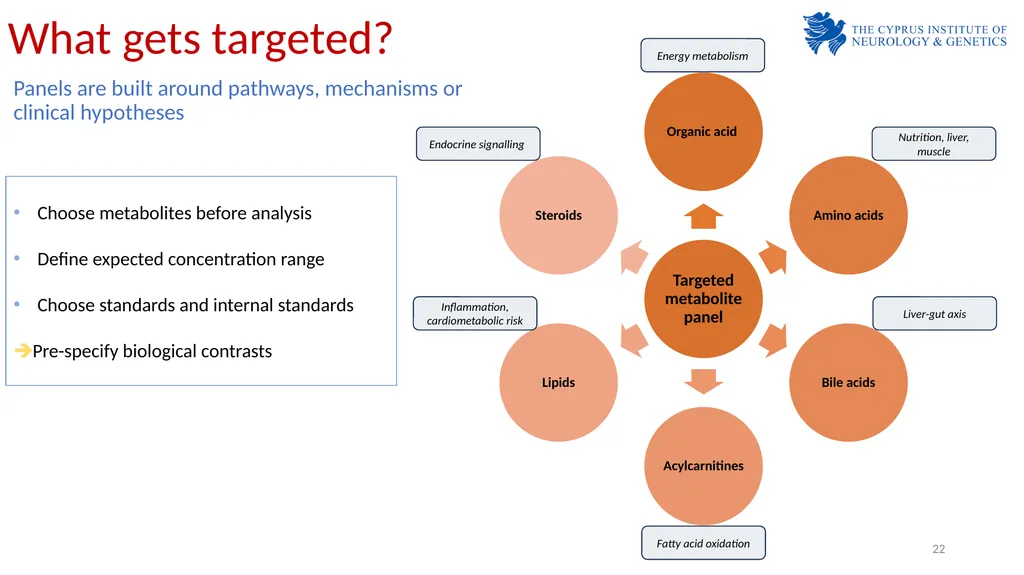
Energy metabolism Nutrition, liver, muscle Liver-gut axis Fatty acid oxidation Inflammation, cardiometabolic risk Endocrine signalling What gets targeted? Choose metabolites before analysis
Define expected concentration range
Choose standards and internal standards
Pre-specify biological contrasts Panels are built around pathways, mechanisms or
clinical hypotheses 22<br>
Define expected concentration range
Choose standards and internal standards
Pre-specify biological contrasts Panels are built around pathways, mechanisms or
clinical hypotheses 22<br>
23
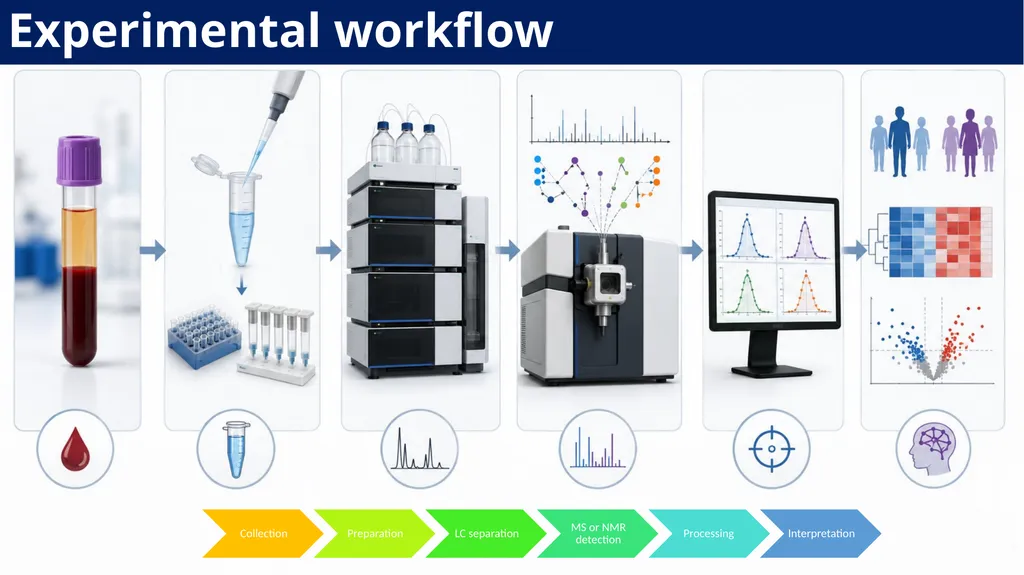
23 Experimental workflow<br>
24
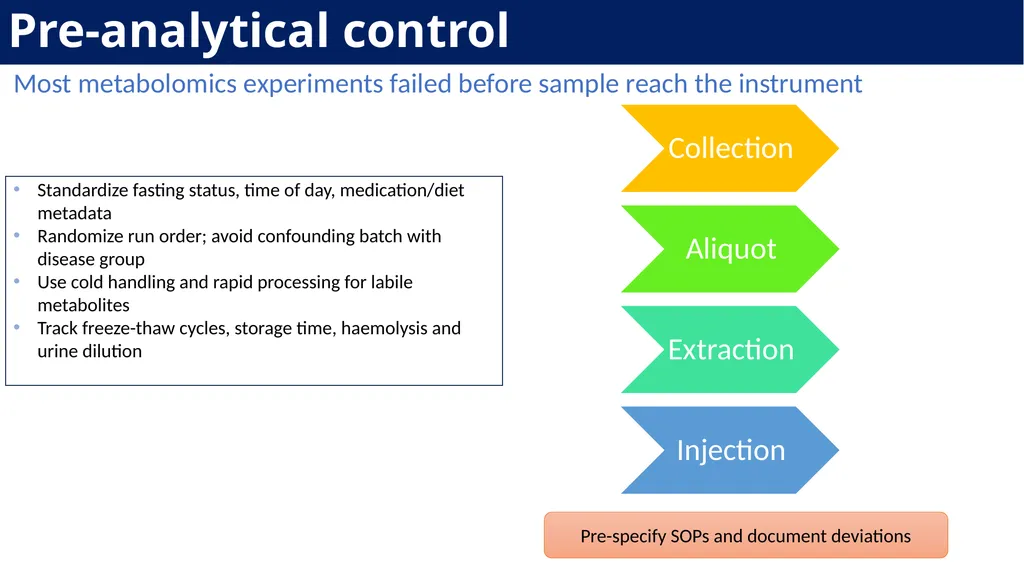
Standardize fasting status, time of day, medication/diet metadata
Randomize run order; avoid confounding batch with disease group
Use cold handling and rapid processing for labile metabolites
Track freeze-thaw cycles, storage time, haemolysis and urine dilution Pre-specify SOPs and document deviations Most metabolomics experiments failed before sample reach the instrument 24 Pre-analytical control<br>
Randomize run order; avoid confounding batch with disease group
Use cold handling and rapid processing for labile metabolites
Track freeze-thaw cycles, storage time, haemolysis and urine dilution Pre-specify SOPs and document deviations Most metabolomics experiments failed before sample reach the instrument 24 Pre-analytical control<br>
25
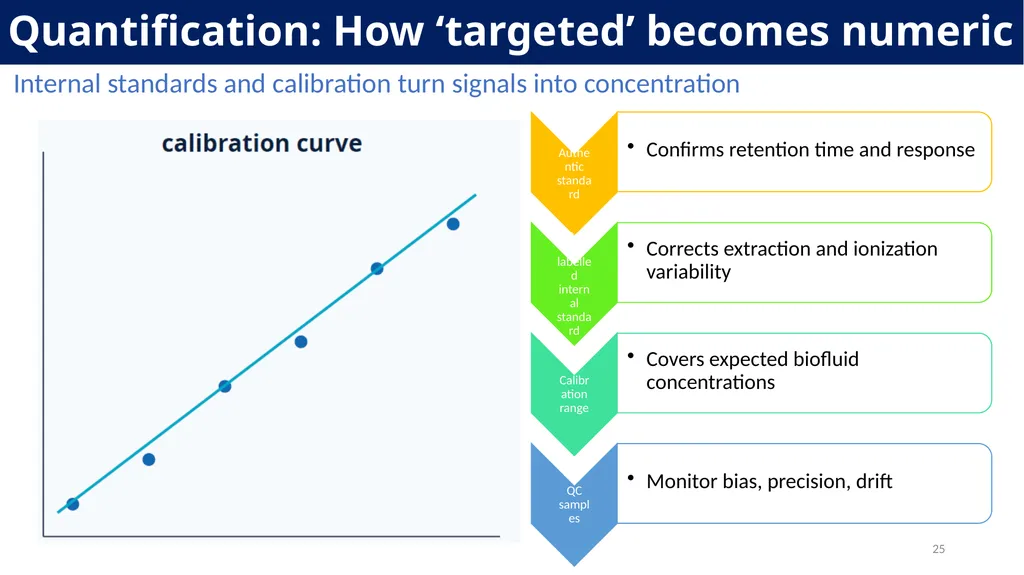
Internal standards and calibration turn signals into concentration 25 Quantification: How ‘targeted’ becomes numeric<br>
26
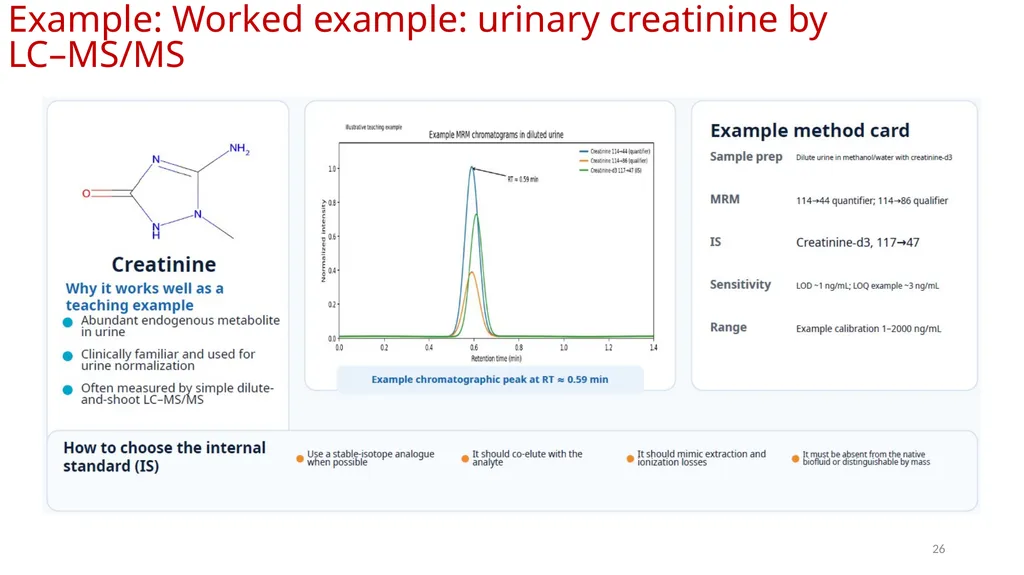
Example: Worked example: urinary creatinine by LC–MS/MS 26<br>
27
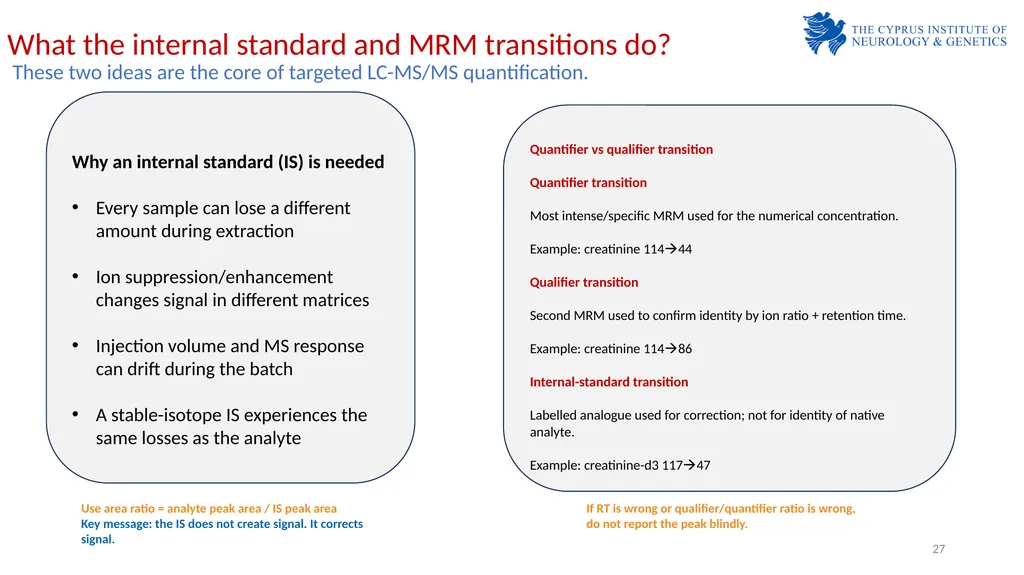
What the internal standard and MRM transitions do? Why an internal standard (IS) is needed
Every sample can lose a different amount during extraction
Ion suppression/enhancement changes signal in different matrices
Injection volume and MS response can drift during the batch
A stable-isotope IS experiences the same losses as the analyte Quantifier vs qualifier transition
Quantifier transition
Most intense/specific MRM used for the numerical concentration.
Example: creatinine 11444
Qualifier transition
Second MRM used to confirm identity by ion ratio + retention time.
Example: creatinine 11486
Internal-standard transition
Labelled analogue used for correction; not for identity of native analyte.
Example: creatinine-d3 11747 Use area ratio = analyte peak area / IS peak area
Key message: the IS does not create signal. It corrects signal. If RT is wrong or qualifier/quantifier ratio is wrong, do not report the peak blindly. These two ideas are the core of targeted LC-MS/MS quantification. 27<br>
Every sample can lose a different amount during extraction
Ion suppression/enhancement changes signal in different matrices
Injection volume and MS response can drift during the batch
A stable-isotope IS experiences the same losses as the analyte Quantifier vs qualifier transition
Quantifier transition
Most intense/specific MRM used for the numerical concentration.
Example: creatinine 11444
Qualifier transition
Second MRM used to confirm identity by ion ratio + retention time.
Example: creatinine 11486
Internal-standard transition
Labelled analogue used for correction; not for identity of native analyte.
Example: creatinine-d3 11747 Use area ratio = analyte peak area / IS peak area
Key message: the IS does not create signal. It corrects signal. If RT is wrong or qualifier/quantifier ratio is wrong, do not report the peak blindly. These two ideas are the core of targeted LC-MS/MS quantification. 27<br>
28
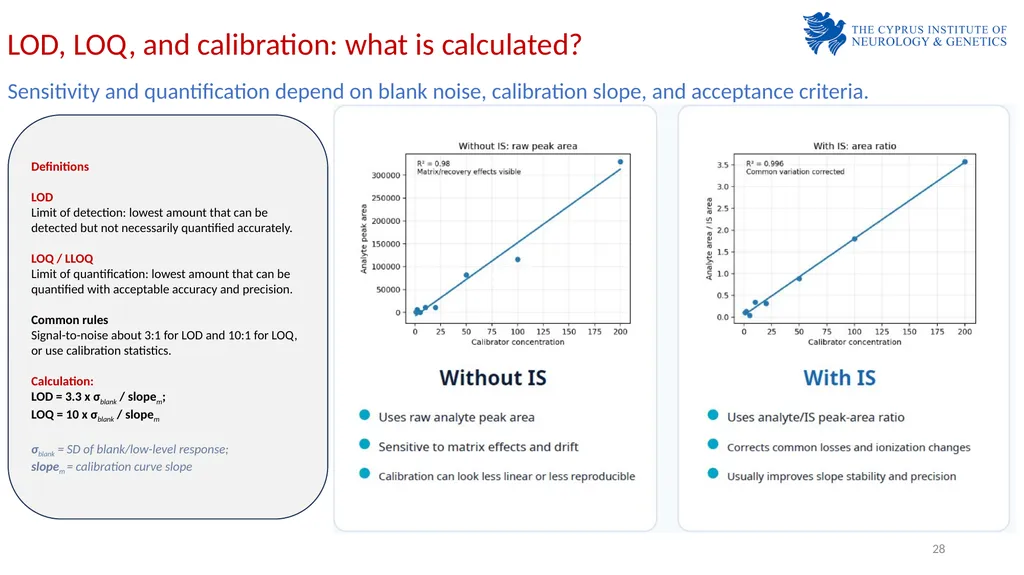
Definitions
LOD
Limit of detection: lowest amount that can be detected but not necessarily quantified accurately.
LOQ / LLOQ
Limit of quantification: lowest amount that can be quantified with acceptable accuracy and precision.
Common rules
Signal-to-noise about 3:1 for LOD and 10:1 for LOQ, or use calibration statistics.
Calculation: LOD = 3.3 x σblank / slopem; LOQ = 10 x σblank / slopem
σblank = SD of blank/low-level response; slopem = calibration curve slope LOD, LOQ, and calibration: what is calculated? Sensitivity and quantification depend on blank noise, calibration slope, and acceptance criteria. 28<br>
LOD
Limit of detection: lowest amount that can be detected but not necessarily quantified accurately.
LOQ / LLOQ
Limit of quantification: lowest amount that can be quantified with acceptable accuracy and precision.
Common rules
Signal-to-noise about 3:1 for LOD and 10:1 for LOQ, or use calibration statistics.
Calculation: LOD = 3.3 x σblank / slopem; LOQ = 10 x σblank / slopem
σblank = SD of blank/low-level response; slopem = calibration curve slope LOD, LOQ, and calibration: what is calculated? Sensitivity and quantification depend on blank noise, calibration slope, and acceptance criteria. 28<br>
29
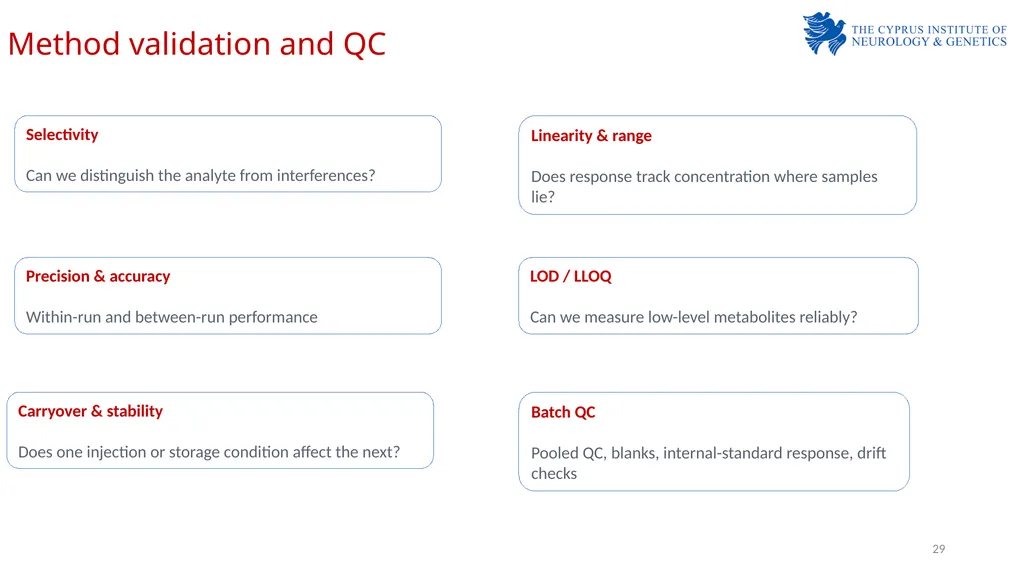
Method validation and QC Selectivity
Can we distinguish the analyte from interferences? Linearity & range
Does response track concentration where samples lie? Precision & accuracy
Within-run and between-run performance LOD / LLOQ
Can we measure low-level metabolites reliably? Batch QC
Pooled QC, blanks, internal-standard response, drift checks Carryover & stability
Does one injection or storage condition affect the next? 29<br>
Can we distinguish the analyte from interferences? Linearity & range
Does response track concentration where samples lie? Precision & accuracy
Within-run and between-run performance LOD / LLOQ
Can we measure low-level metabolites reliably? Batch QC
Pooled QC, blanks, internal-standard response, drift checks Carryover & stability
Does one injection or storage condition affect the next? 29<br>
30
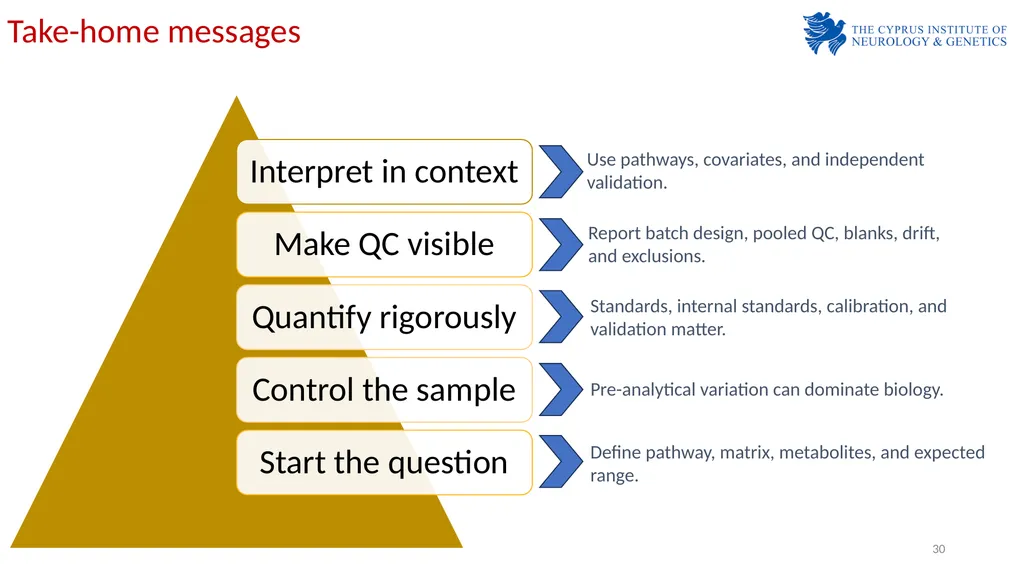
Take-home messages Define pathway, matrix, metabolites, and expected range. Pre-analytical variation can dominate biology. Standards, internal standards, calibration, and validation matter. Report batch design, pooled QC, blanks, drift, and exclusions. Use pathways, covariates, and independent validation. 30<br>
31
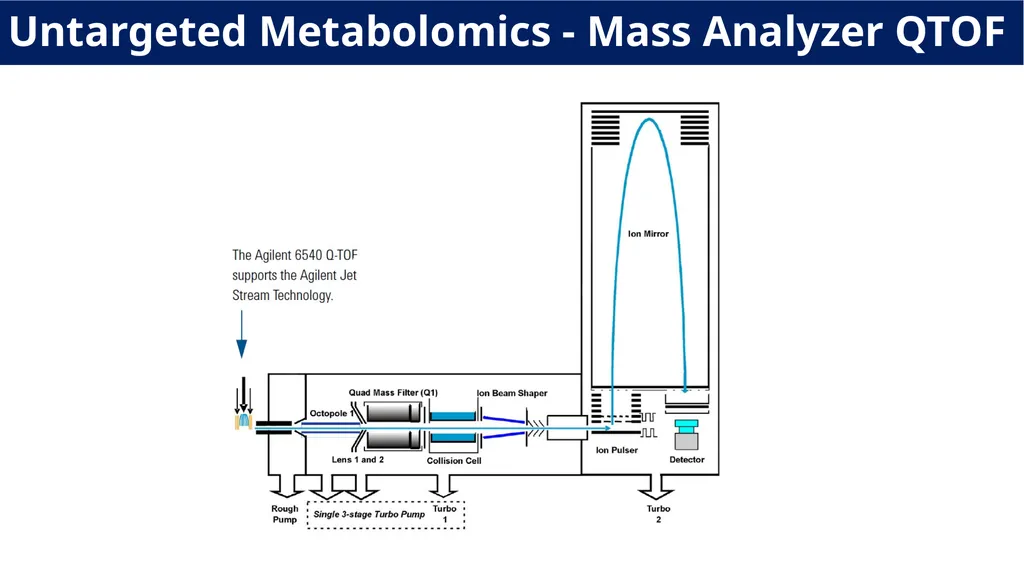
Untargeted Metabolomics - Mass Analyzer QTOF<br>
32
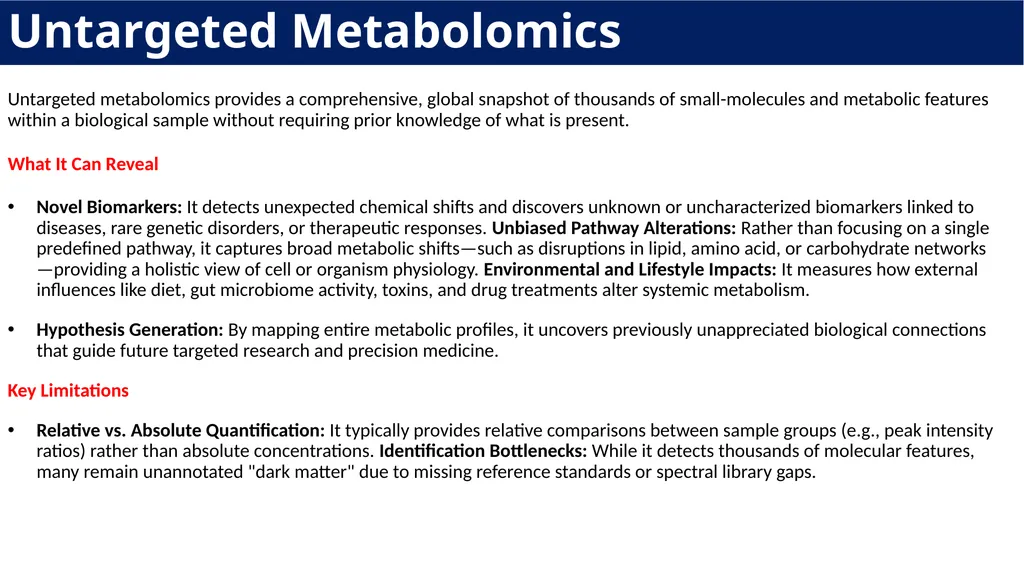
Untargeted metabolomics provides a comprehensive, global snapshot of thousands of small-molecules and metabolic features within a biological sample without requiring prior knowledge of what is present.
What It Can Reveal
Novel Biomarkers: It detects unexpected chemical shifts and discovers unknown or uncharacterized biomarkers linked to diseases, rare genetic disorders, or therapeutic responses. Unbiased Pathway Alterations: Rather than focusing on a single predefined pathway, it captures broad metabolic shifts—such as disruptions in lipid, amino acid, or carbohydrate networks—providing a holistic view of cell or organism physiology. Environmental and Lifestyle Impacts: It measures how external influences like diet, gut microbiome activity, toxins, and drug treatments alter systemic metabolism.
Hypothesis Generation: By mapping entire metabolic profiles, it uncovers previously unappreciated biological connections that guide future targeted research and precision medicine.
Key Limitations
Relative vs. Absolute Quantification: It typically provides relative comparisons between sample groups (e.g., peak intensity ratios) rather than absolute concentrations. Identification Bottlenecks: While it detects thousands of molecular features, many remain unannotated "dark matter" due to missing reference standards or spectral library gaps. Untargeted Metabolomics<br>
What It Can Reveal
Novel Biomarkers: It detects unexpected chemical shifts and discovers unknown or uncharacterized biomarkers linked to diseases, rare genetic disorders, or therapeutic responses. Unbiased Pathway Alterations: Rather than focusing on a single predefined pathway, it captures broad metabolic shifts—such as disruptions in lipid, amino acid, or carbohydrate networks—providing a holistic view of cell or organism physiology. Environmental and Lifestyle Impacts: It measures how external influences like diet, gut microbiome activity, toxins, and drug treatments alter systemic metabolism.
Hypothesis Generation: By mapping entire metabolic profiles, it uncovers previously unappreciated biological connections that guide future targeted research and precision medicine.
Key Limitations
Relative vs. Absolute Quantification: It typically provides relative comparisons between sample groups (e.g., peak intensity ratios) rather than absolute concentrations. Identification Bottlenecks: While it detects thousands of molecular features, many remain unannotated "dark matter" due to missing reference standards or spectral library gaps. Untargeted Metabolomics<br>
33
Thank you 33<br>