Lesson 5.6 Graphing Linear Inequalities in Two Variables Warm-Up Tell whether the value is a solution of the inequality. 4x 11; x 3 7b 25; b 4 Learning Target: Graph linear inequalities in two variables. Success Criteria: I can
"Lesson 5.6 Graphing Linear Inequalities in Two" is the property of its rightful owner. Permission is granted to
download and print the materials on this website for personal, non-commercial use only, and to display it
on your personal computer provided you do not modify the materials and that you retain all copyright
notices contained in the materials. By downloading content from our website, you accept the terms of this
agreement.
Presentation Transcript
01
Lesson 5.6 Graphing Linear Inequalities in Two Variables<br>
02
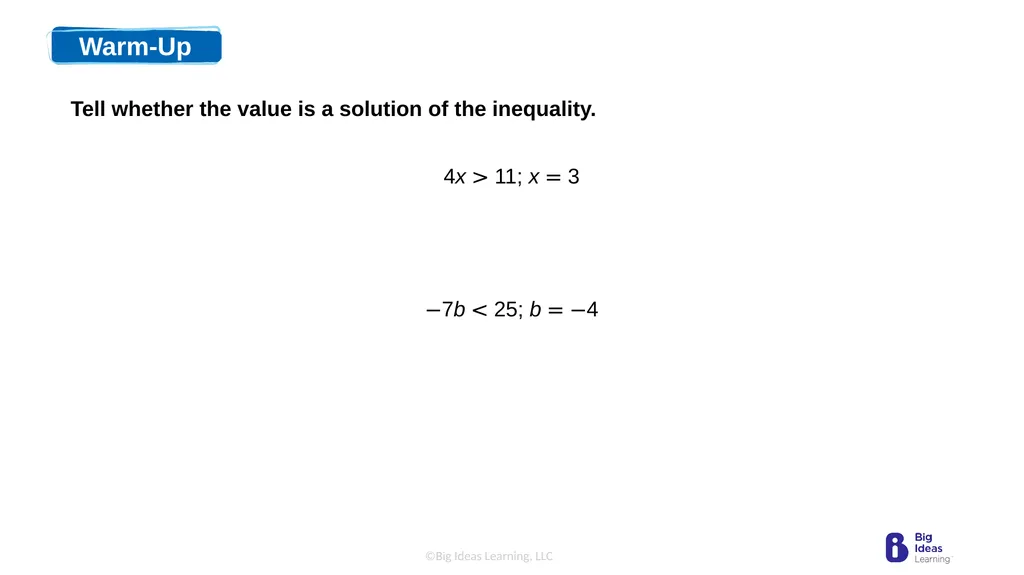
Warm-Up Tell whether the value is a solution of the inequality. 4x > 11; x = 3 −7b < 25; b = −4<br>
03
Learning Target:
Graph linear inequalities in two variables. Success Criteria:
I can determine whether an ordered pair is a solution of a linear inequality in two variables.
I can graph linear inequalities in two variables.
I can interpret solutions of a linear inequality in two variables in a real-life situation.<br>
04
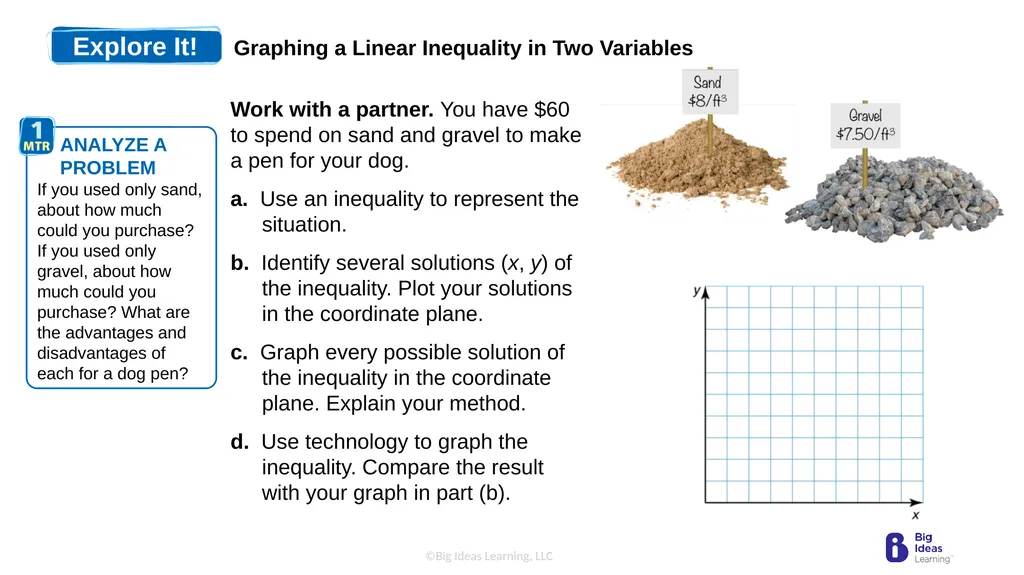
Explore It! Graphing a Linear Inequality in Two Variables Work with a partner. You have $60 to spend on sand and gravel to make a pen for your dog.
a. Use an inequality to represent the situation.
b. Identify several solutions (x, y) of the inequality. Plot your solutions in the coordinate plane.
c. Graph every possible solution of the inequality in the coordinate plane. Explain your method.
d. Use technology to graph the inequality. Compare the result with your graph in part (b).<br>
05
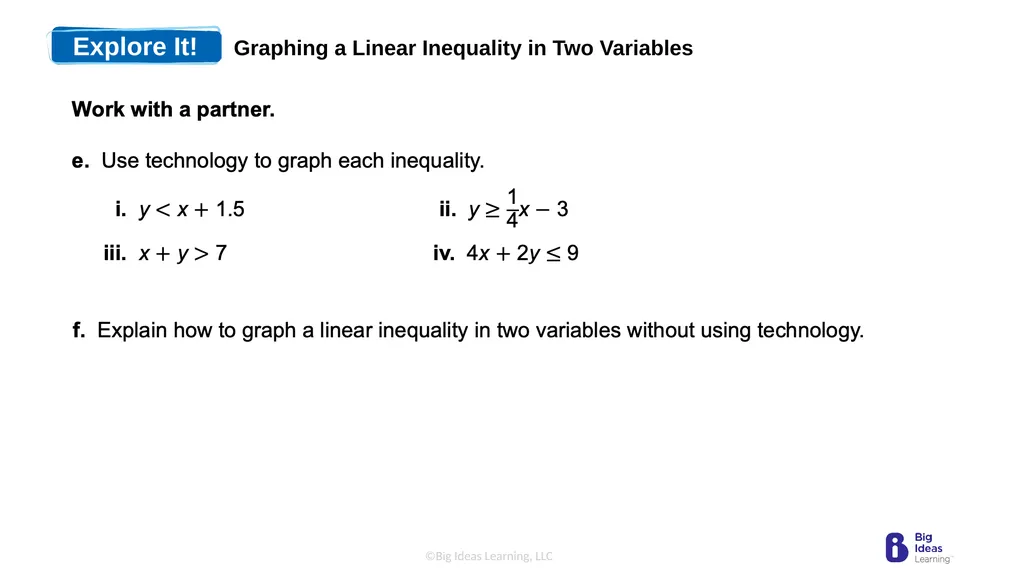
Explore It! Graphing a Linear Inequality in Two Variables<br>
06
Vocabulary
linear inequality in
two variables, p. 264
solution of a linear inequality
in two variables, p. 264
graph of a linear inequality,
p. 264
half-planes, p. 264 Linear Inequalities
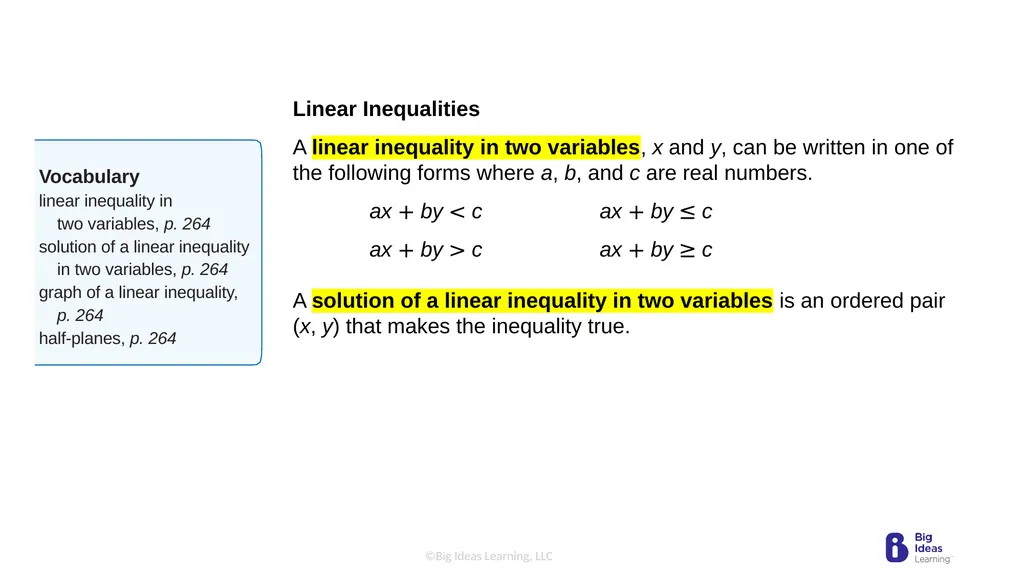
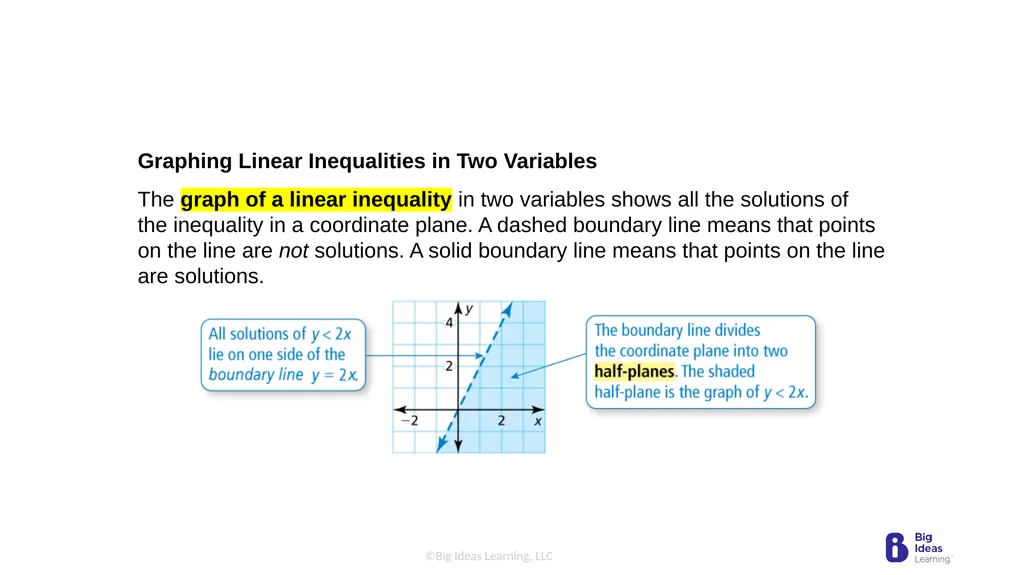
A linear inequality in two variables, x and y, can be written in one of the following forms where a, b, and c are real numbers.
ax + by < c ax + by ≤ c
ax + by > c ax + by ≥ c
A solution of a linear inequality in two variables is an ordered pair (x, y) that makes the inequality true.<br>
07
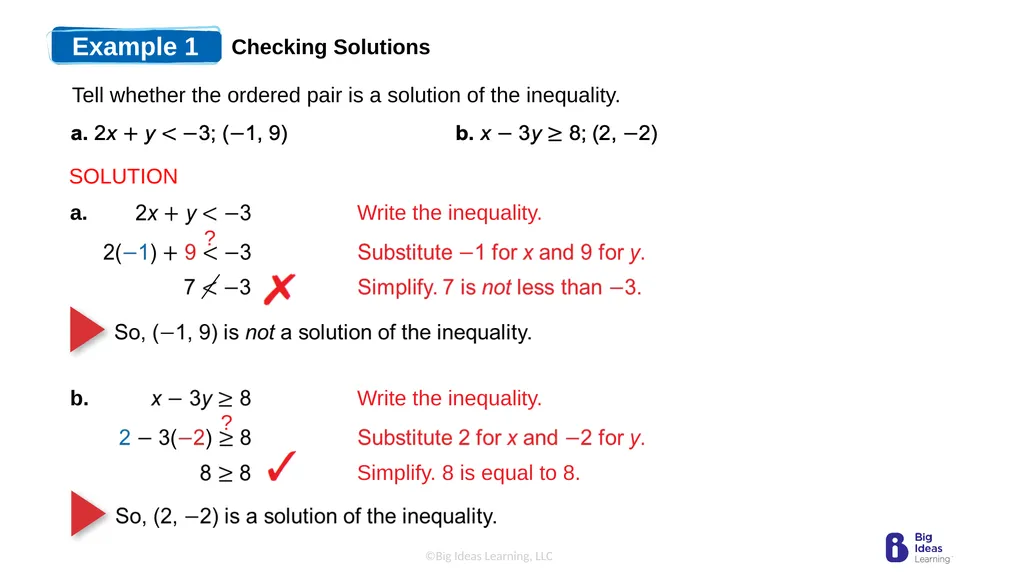
Example 1 Checking Solutions Tell whether the ordered pair is a solution of the inequality. SOLUTION<br>
08
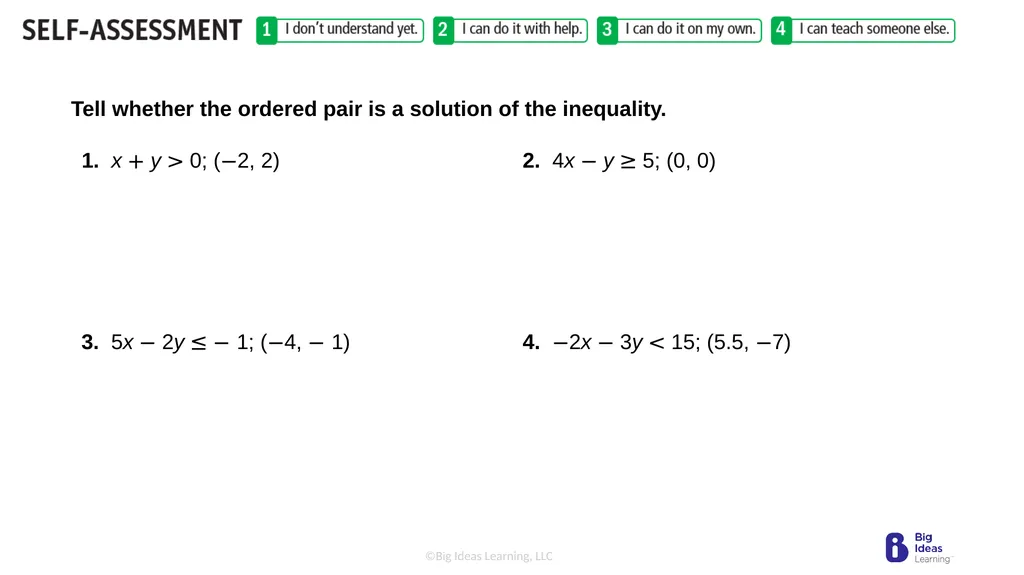
Tell whether the ordered pair is a solution of the inequality. 1. x + y > 0; (−2, 2) 2. 4x − y ≥ 5; (0, 0) 3. 5x − 2y ≤ − 1; (−4, − 1) 4. −2x − 3y < 15; (5.5, −7)<br>
09
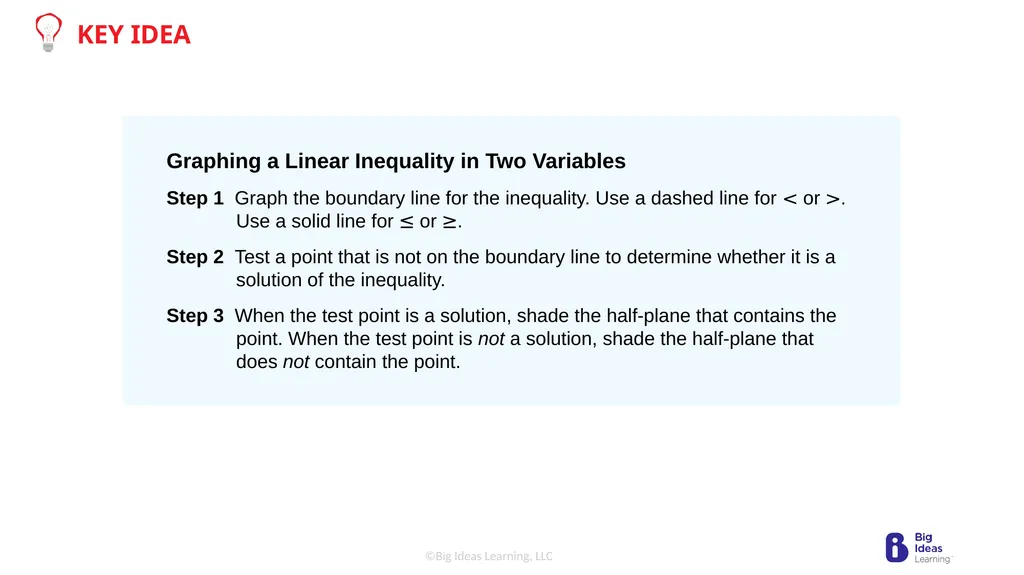
Graphing a Linear Inequality in Two Variables
Step 1 Graph the boundary line for the inequality. Use a dashed line for < or >. Use a solid line for ≤ or ≥.
Step 2 Test a point that is not on the boundary line to determine whether it is a solution of the inequality.
Step 3 When the test point is a solution, shade the half-plane that contains the point. When the test point is not a solution, shade the half-plane that does not contain the point. KEY IDEA<br>
10
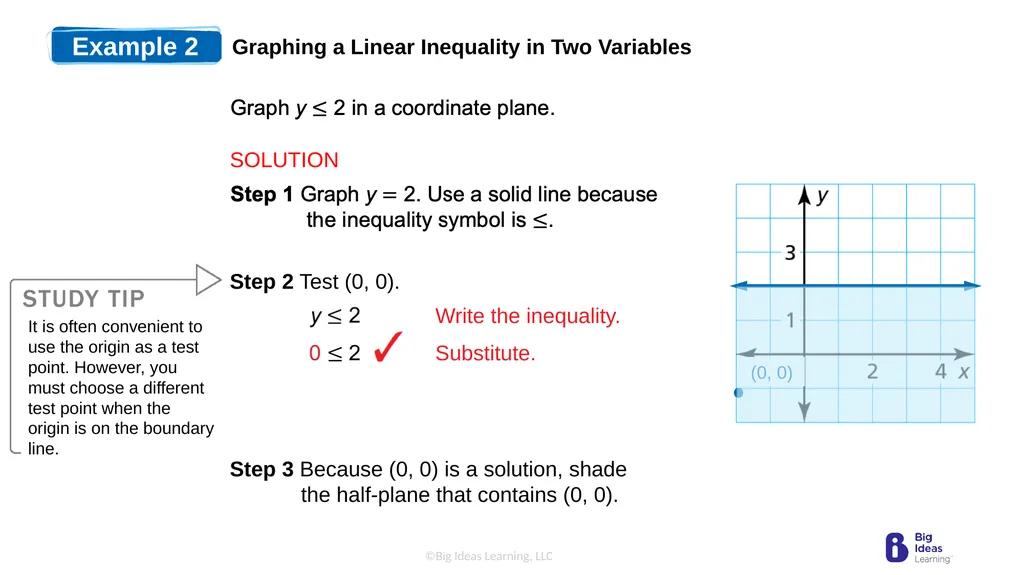
Example 2 Graphing a Linear Inequality in Two Variables Step 3 Because (0, 0) is a solution, shade
the half-plane that contains (0, 0). SOLUTION<br>
11
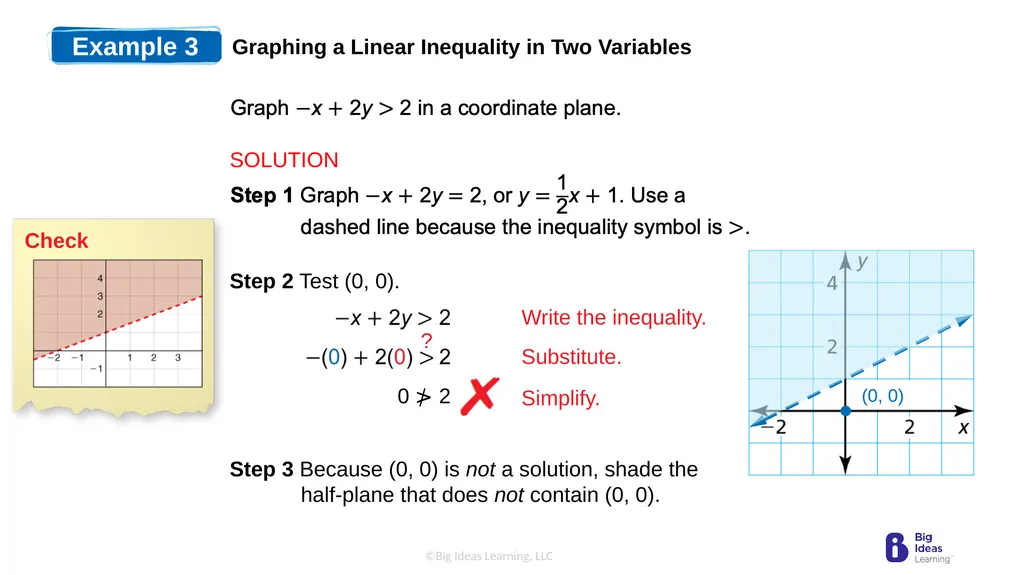
Example 3 Graphing a Linear Inequality in Two Variables Step 3 Because (0, 0) is not a solution, shade the
half-plane that does not contain (0, 0). SOLUTION<br>
12
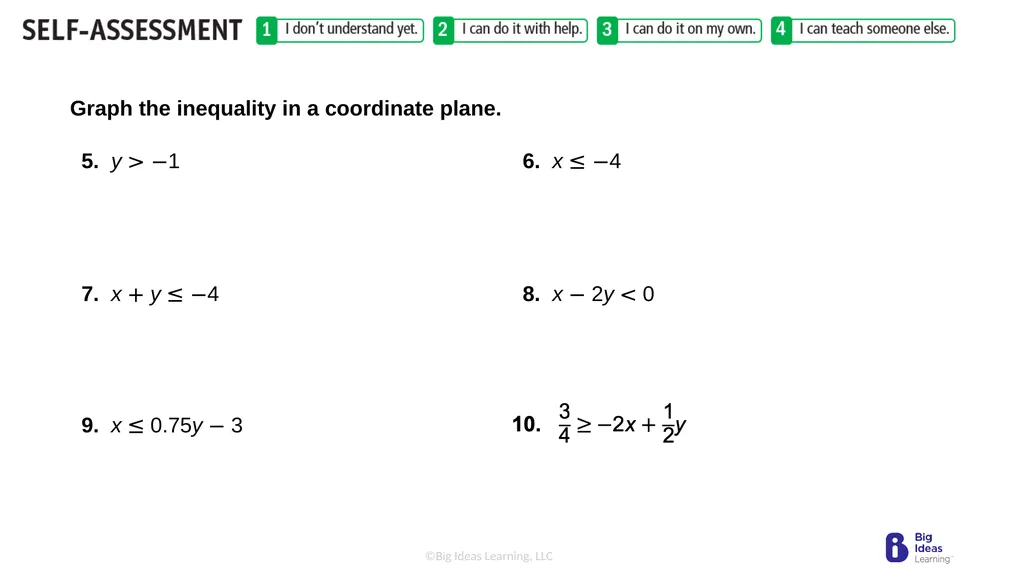
Graph the inequality in a coordinate plane. 5. y > −1 6. x ≤ −4 7. x + y ≤ −4 8. x − 2y < 0 9. x ≤ 0.75y − 3<br>
13
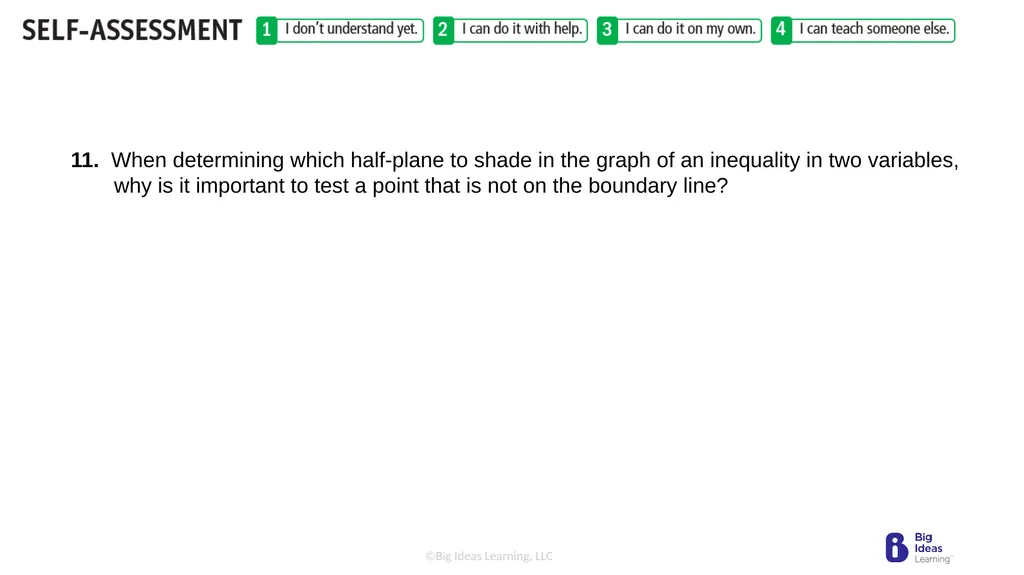
11. When determining which half-plane to shade in the graph of an inequality in two variables, why is it important to test a point that is not on the boundary line?<br>
14
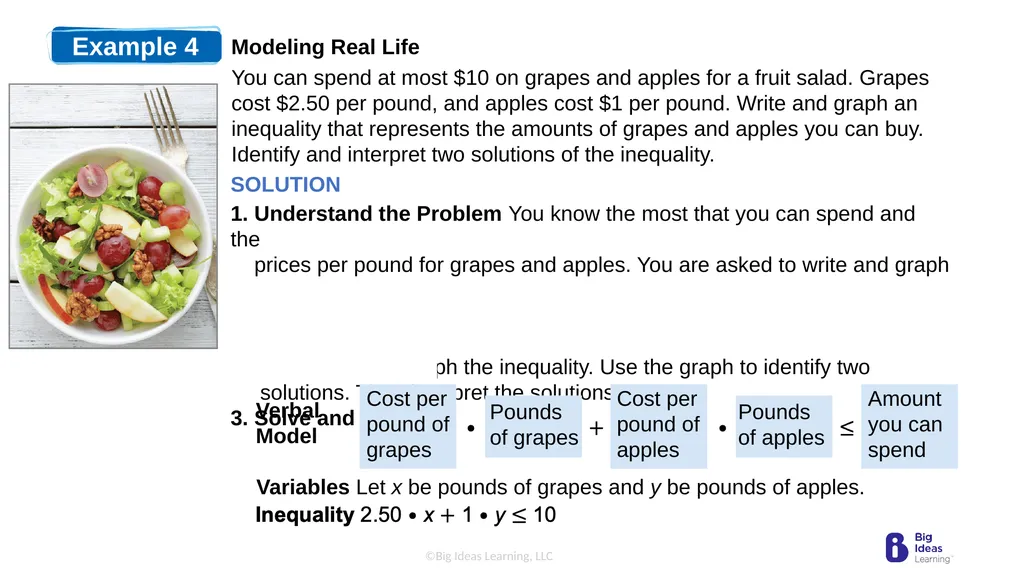
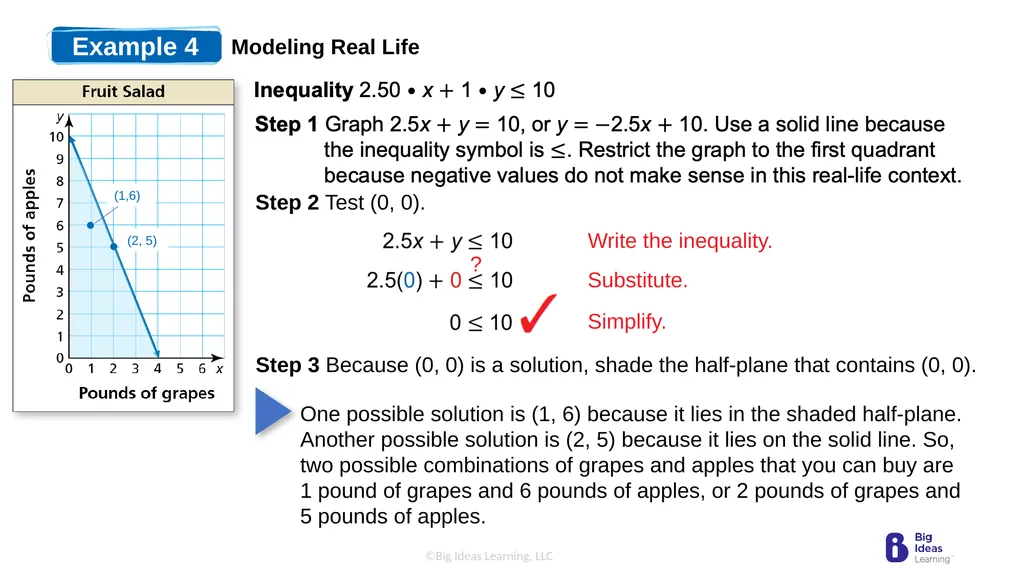
Example 4 Modeling Real Life You can spend at most $10 on grapes and apples for a fruit salad. Grapes cost $2.50 per pound, and apples cost $1 per pound. Write and graph an inequality that represents the amounts of grapes and apples you can buy. Identify and interpret two solutions of the inequality. 1. Understand the Problem You know the most that you can spend and the
prices per pound for grapes and apples. You are asked to write and graph
an inequality and then identify and interpret two solutions.
2. Make a Plan Use a verbal model to write an inequality that represents the
problem. Then graph the inequality. Use the graph to identify two
solutions. Then interpret the solutions.
3. Solve and Check Verbal Model Variables Let x be pounds of grapes and y be pounds of apples. Cost per
pound of
grapes Pounds
of grapes Cost per
pound of
apples Pounds
of apples Amount
you can
spend SOLUTION<br>
15
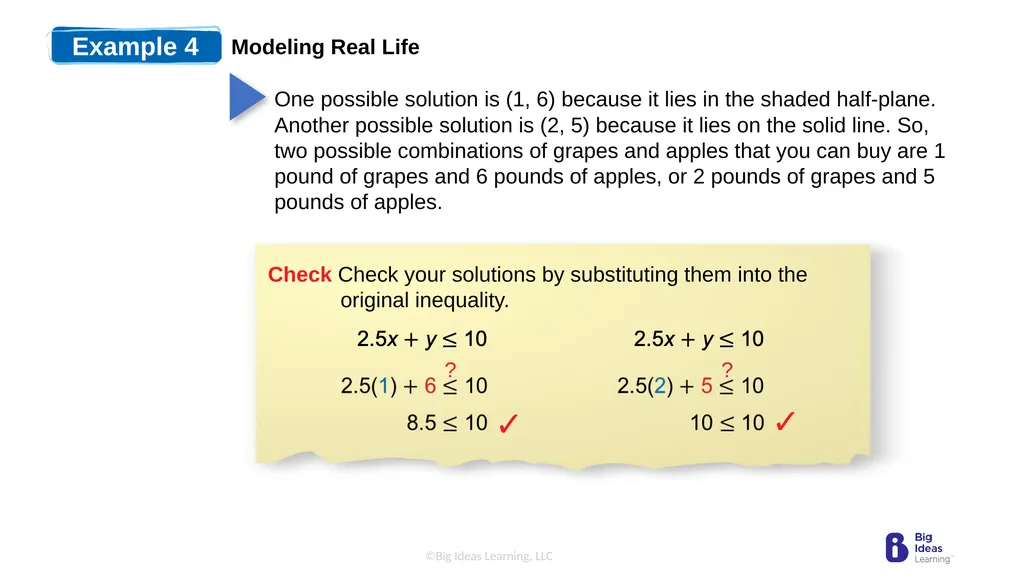
Example 4 Modeling Real Life Step 2 Test (0, 0). Step 3 Because (0, 0) is a solution, shade the half-plane that contains (0, 0).<br>
16
Example 4 Modeling Real Life<br>
17
12. You can spend at most $12 on red peppers and tomatoes for salsa. Red peppers cost $4 per pound, and tomatoes cost $3 per pound. Write and graph an inequality that represents the amounts of red peppers and tomatoes you can buy. Identify and interpret two solutions of the inequality.<br>
18
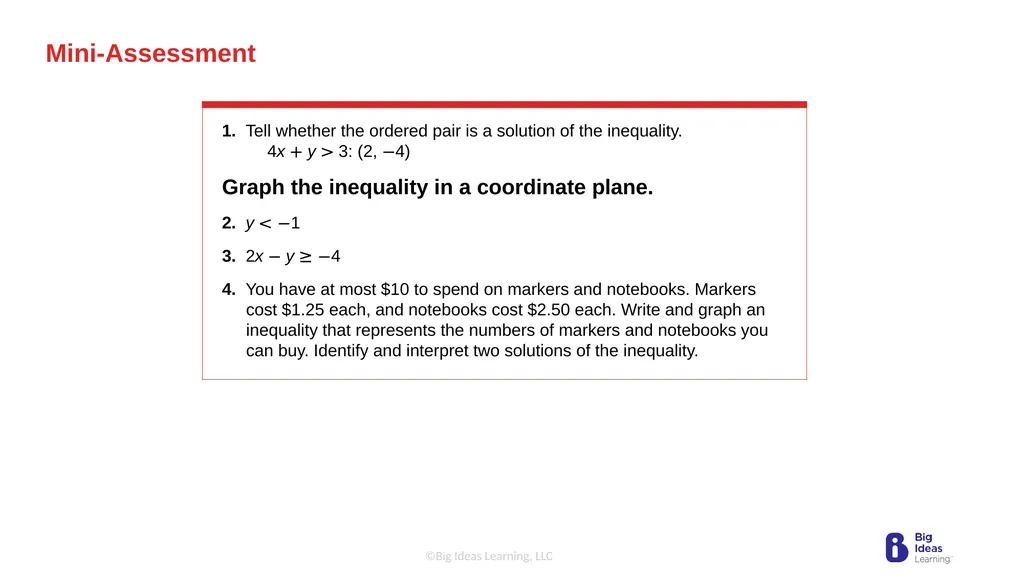
In-Class Practice Mini-Assessment 1. Tell whether the ordered pair is a solution of the inequality. 4x + y > 3: (2, −4)
Graph the inequality in a coordinate plane.
2. y < −1
3. 2x − y ≥ −4
4. You have at most $10 to spend on markers and notebooks. Markers cost $1.25 each, and notebooks cost $2.50 each. Write and graph an inequality that represents the numbers of markers and notebooks you can buy. Identify and interpret two solutions of the inequality.<br>