04
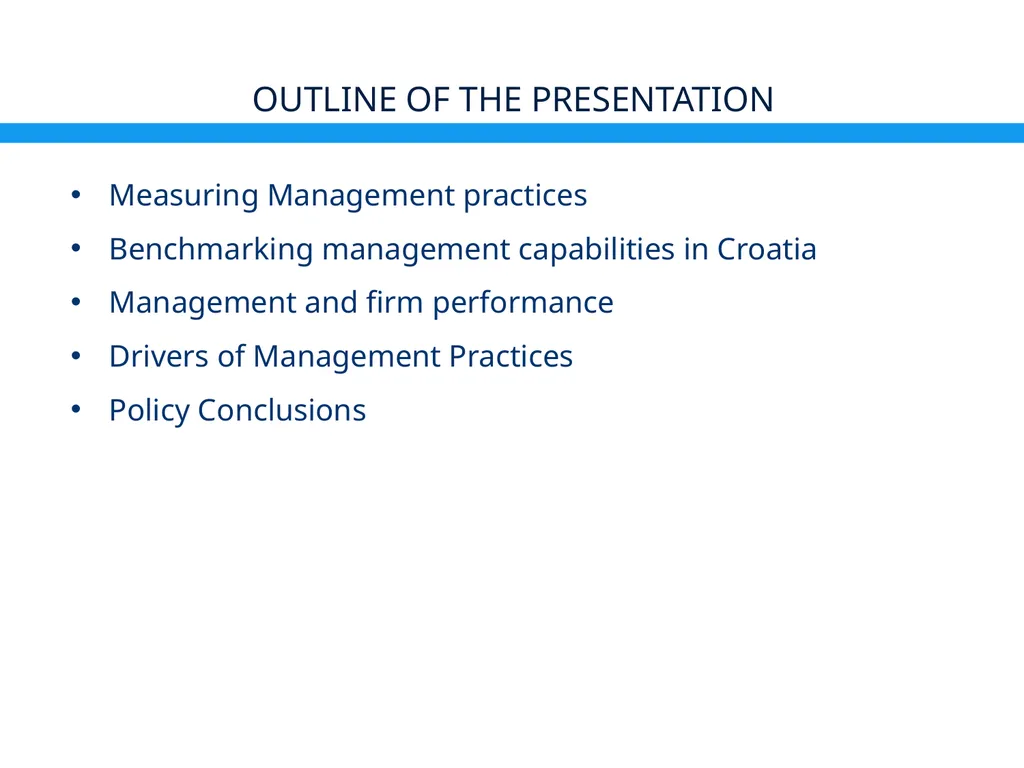
Outline of the presentation Measuring Management practices
Benchmarking management capabilities in Croatia
Management and firm performance
Drivers of Management Practices
Policy Conclusions<br>
05
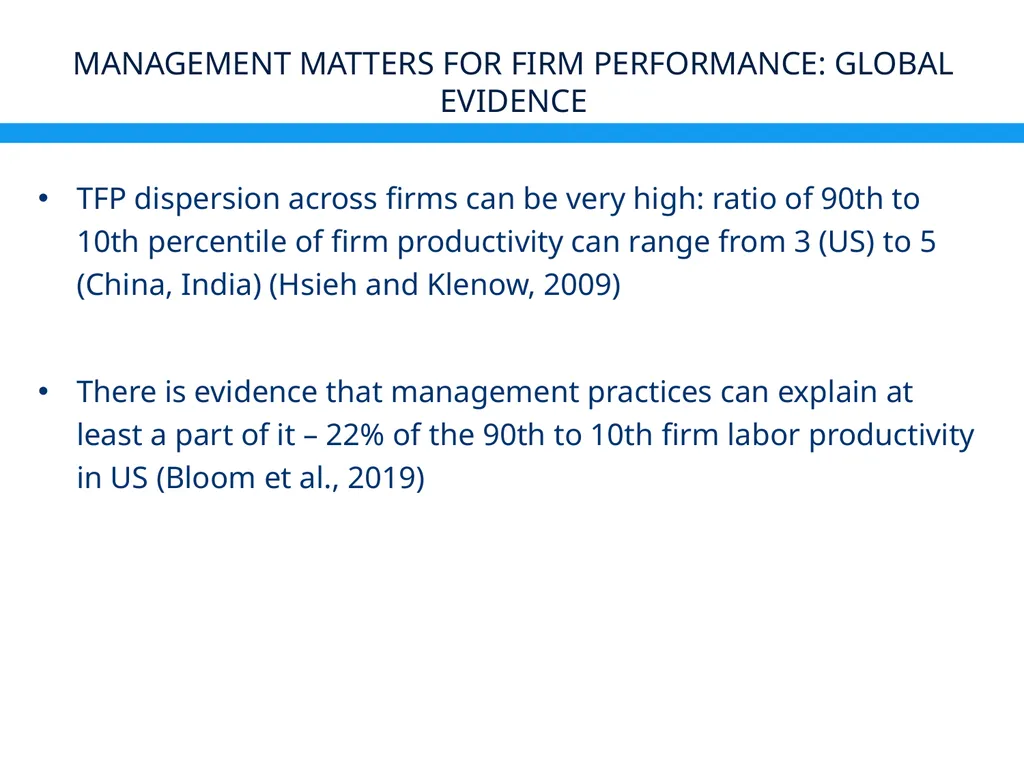
Management matters for firm performance: Global Evidence TFP dispersion across firms can be very high: ratio of 90th to 10th percentile of firm productivity can range from 3 (US) to 5 (China, India) (Hsieh and Klenow, 2009)
There is evidence that management practices can explain at least a part of it – 22% of the 90th to 10th firm labor productivity in US (Bloom et al., 2019)<br>
06
Management matters, but why is there Skepticism? Bloom et al. (2013) detail two reasons for skepticism:
Skepticism #1: Management is a complex phenomenon, so measurement is particularly hard
Response: focus on management practices – more narrow definition
Skepticism #2: “Optimal” management practices may not be the same across countries/firms. Firms are always profit maximizing, and the practices they choose are a result of that – not a cause.
Response: look at cases of random variation in management; there should be no association with profit or productivity if variation is always optimal.<br>
07
FIRM CAPABILITIES SURVEY IN CROATIA<br>
08
MOPS in Croatia: Modules & Questionnaire US Census Bureau MOPS 2015: Modules A (Management practices) and E (Background characteristics)
Additional modules/questions:
Training of managers and operational staff
Innovation and technology use
Access to finance
Government programs: participation by firms in such programs<br>
09
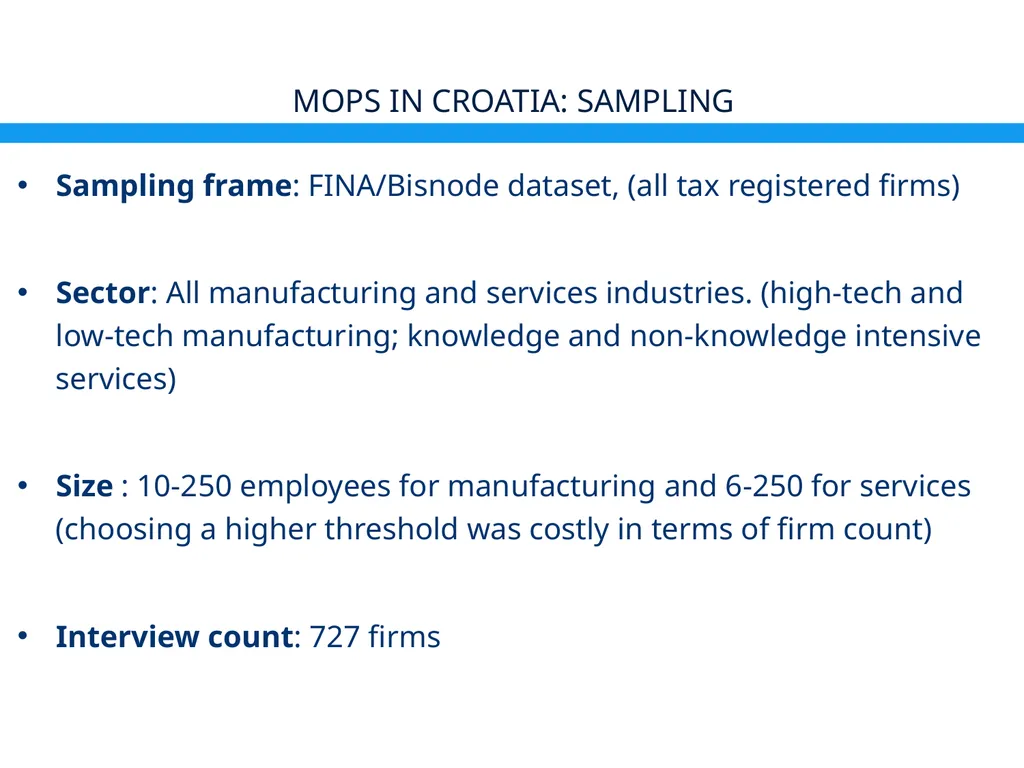
MOPS in Croatia: Sampling Sampling frame: FINA/Bisnode dataset, (all tax registered firms)
Sector: All manufacturing and services industries. (high-tech and low-tech manufacturing; knowledge and non-knowledge intensive services)
Size : 10-250 employees for manufacturing and 6-250 for services (choosing a higher threshold was costly in terms of firm count)
Interview count: 727 firms<br>
10
Benchmarking Structured Management Practices<br>
11
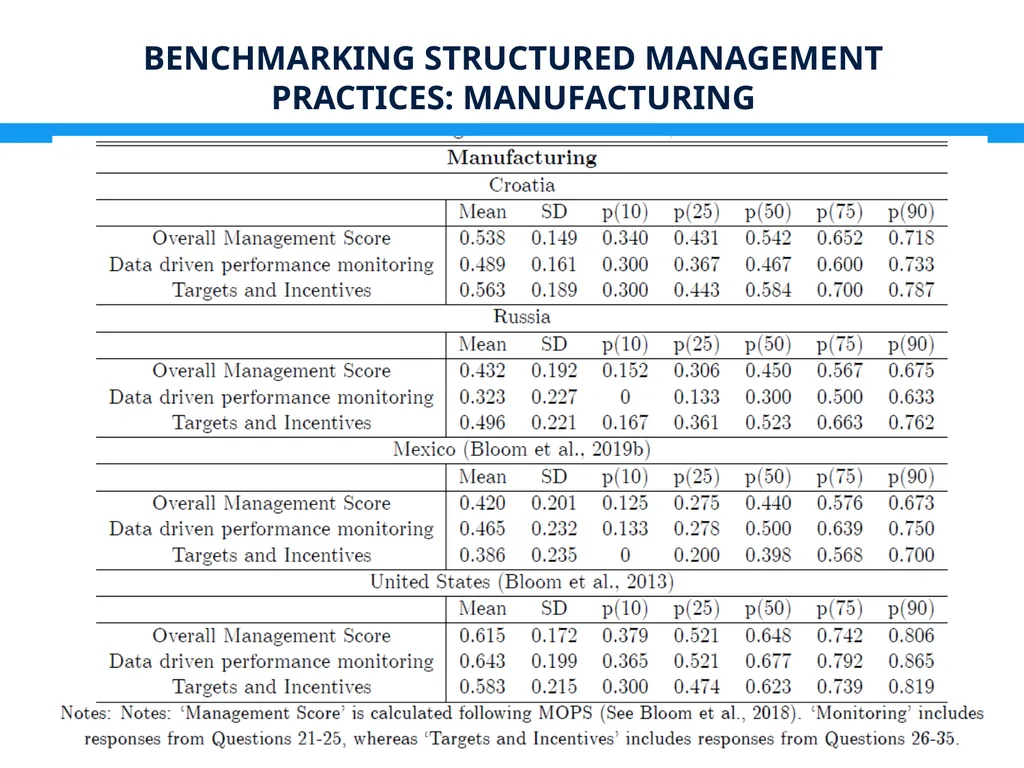
Benchmarking Structured Management Practices: Manufacturing<br>
12
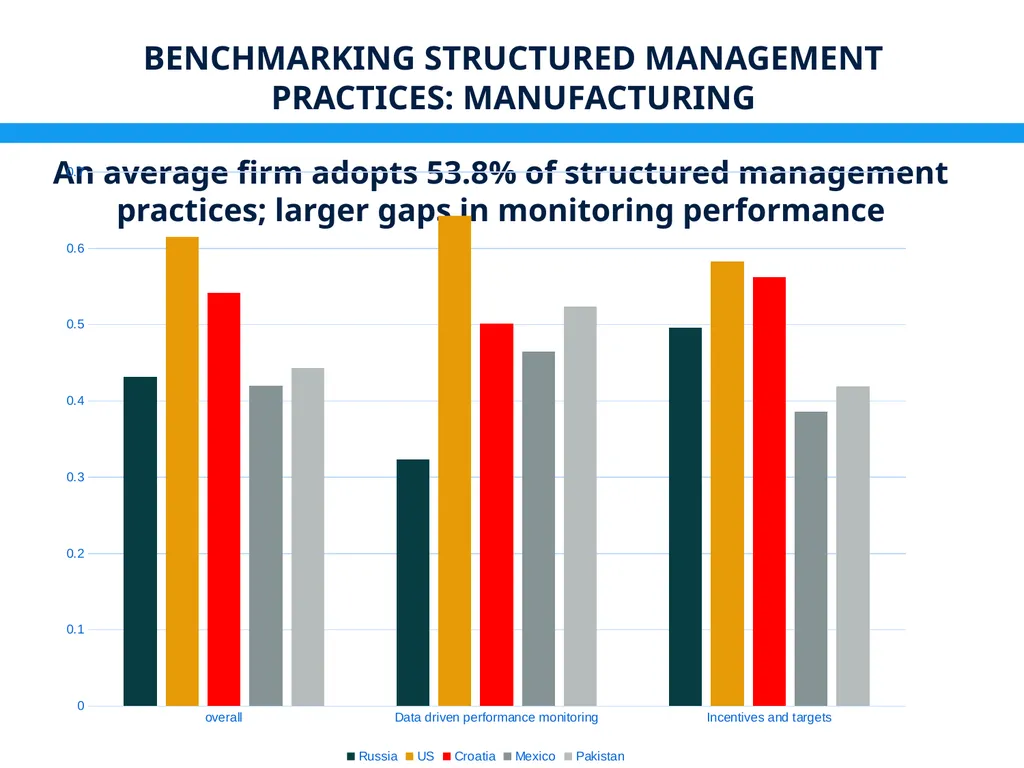
An average firm adopts 53.8% of structured management practices; larger gaps in monitoring performance Benchmarking Structured Management Practices: Manufacturing<br>
13
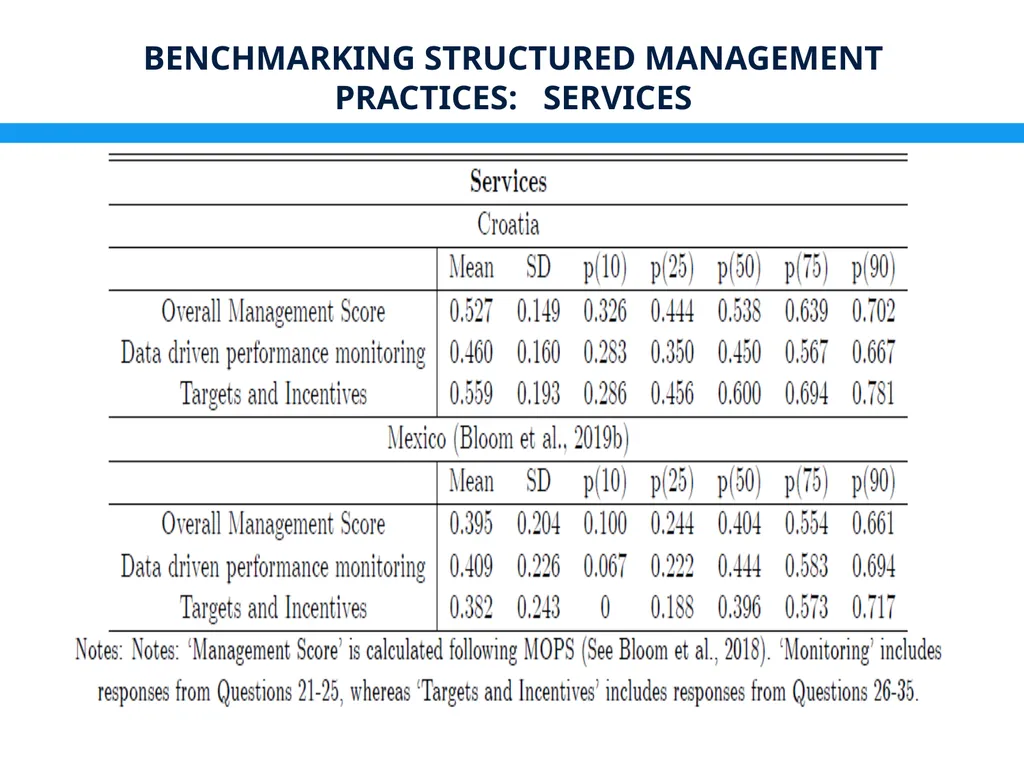
Benchmarking Structured Management Practices: Services<br>
14
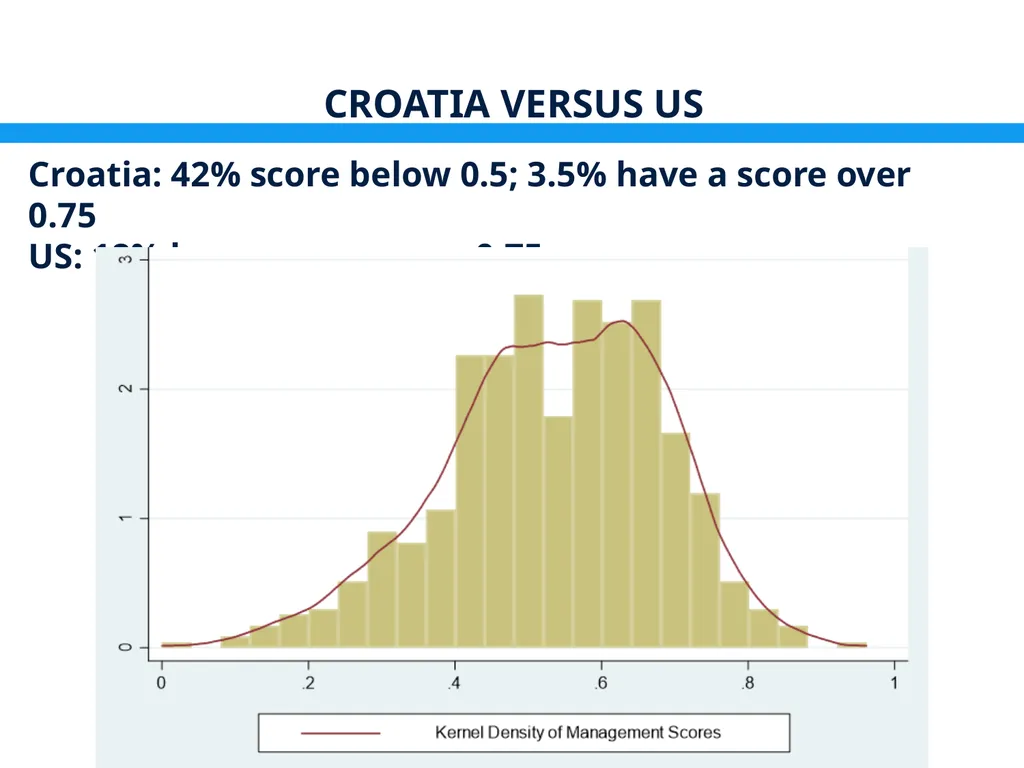
CROATIA VERSUS US Croatia: 42% score below 0.5; 3.5% have a score over 0.75
US: 18% have a score over 0.75<br>
15
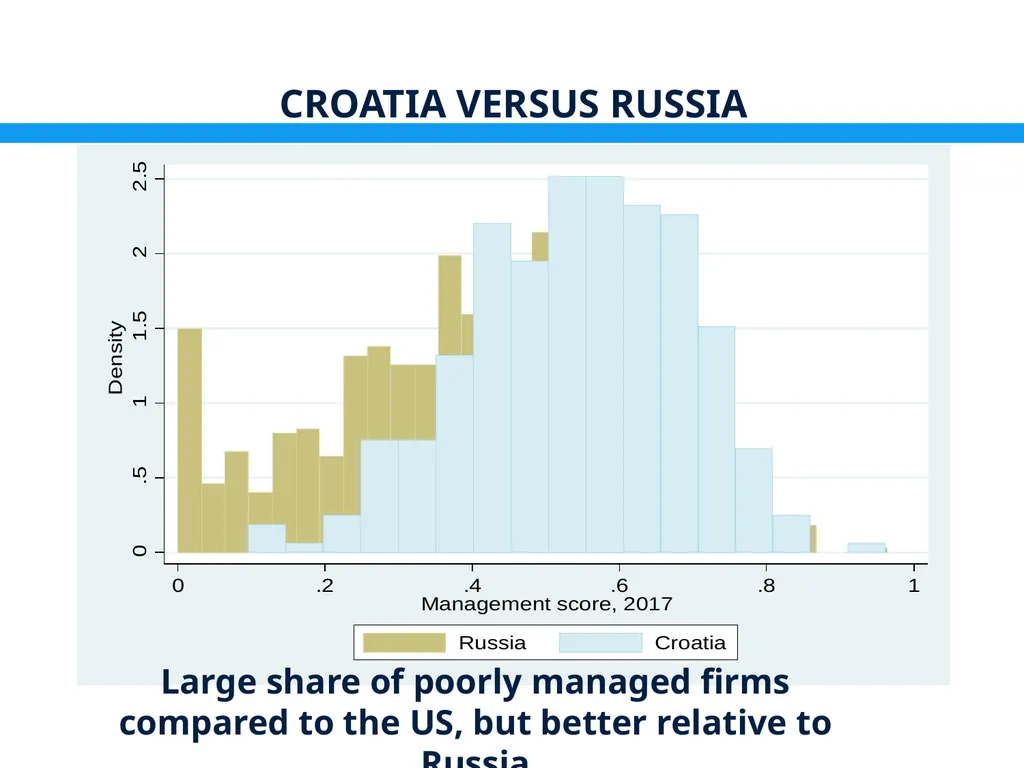
CROATIA VERSUS RUSSIA Large share of poorly managed firms compared to the US, but better relative to Russia<br>
16
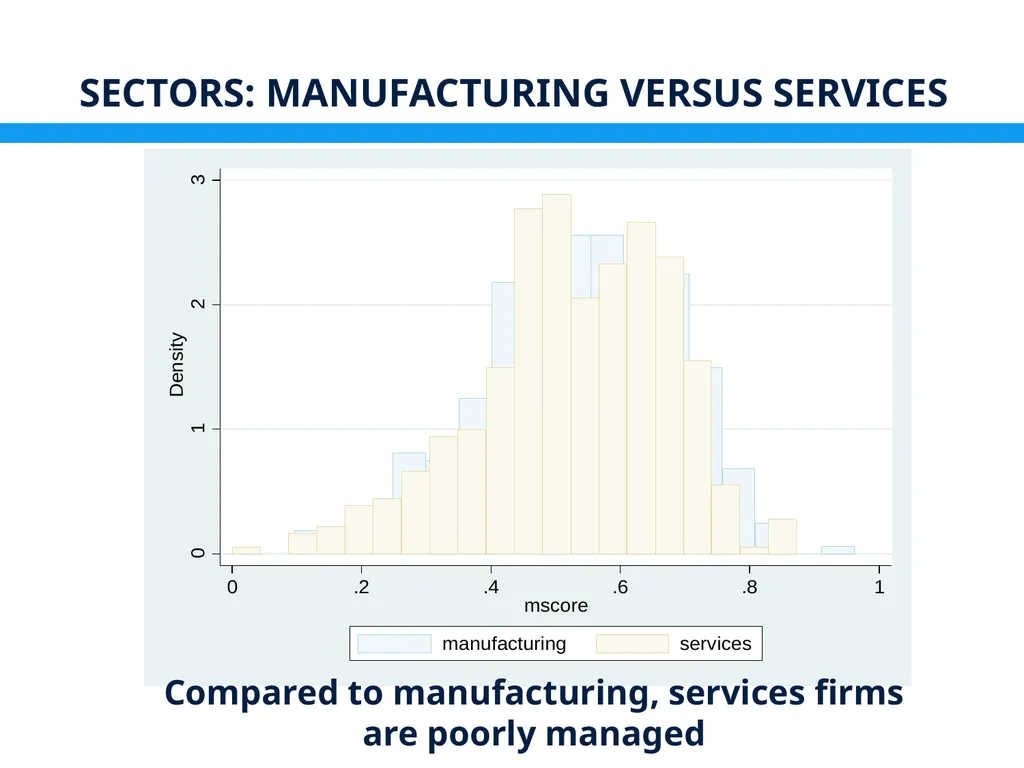
Sectors: manufacturing versus services Compared to manufacturing, services firms are poorly managed<br>
17
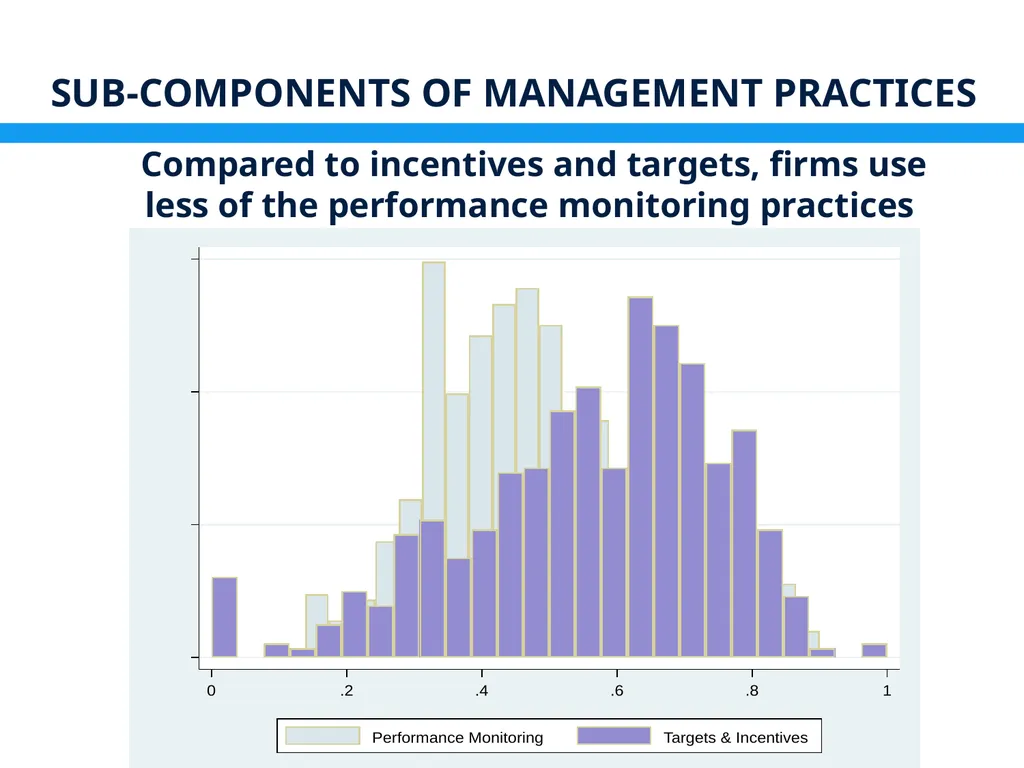
Sub-components of management Practices Compared to incentives and targets, firms use less of the performance monitoring practices<br>
18
Structured Management Practices and Firm Performance<br>
19
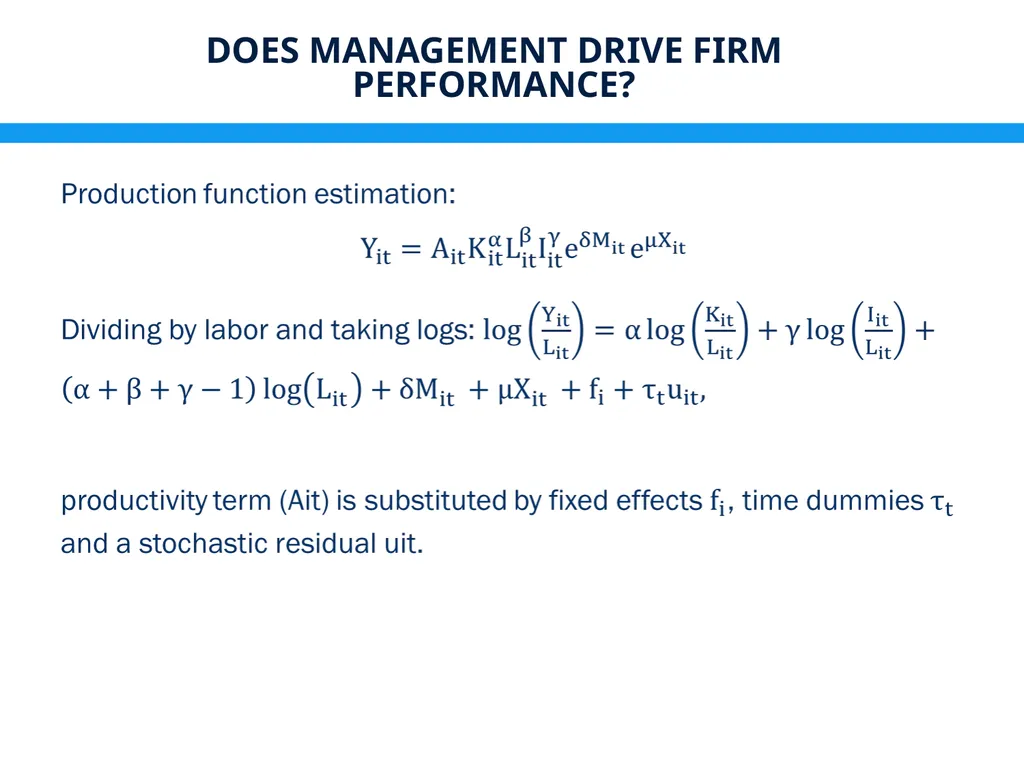
Does management drive firm performance?<br>
20
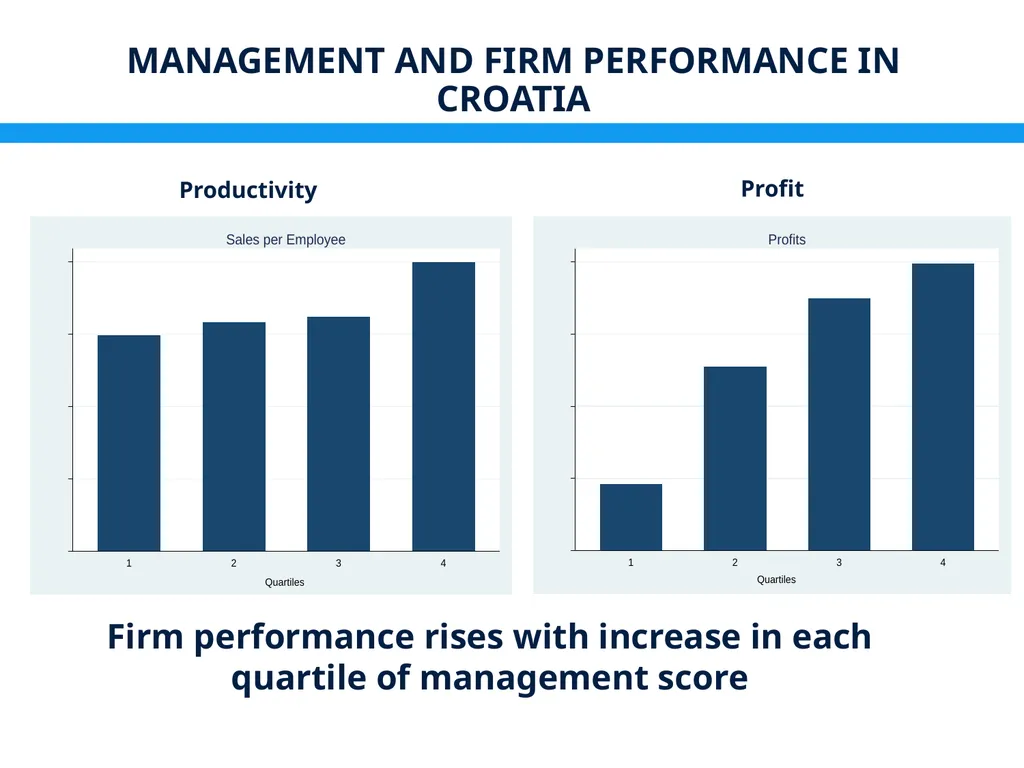
Management and firm performance in Croatia Firm performance rises with increase in each quartile of management score Productivity Profit<br>
21
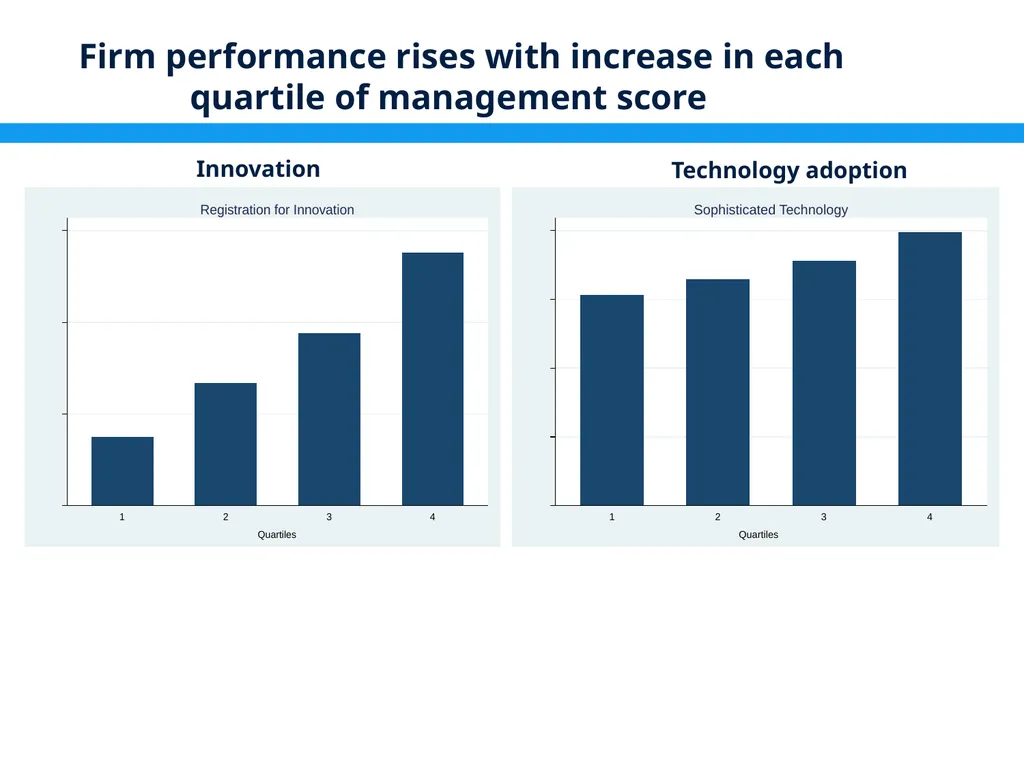
Firm performance rises with increase in each quartile of management score Innovation Technology adoption<br>
22
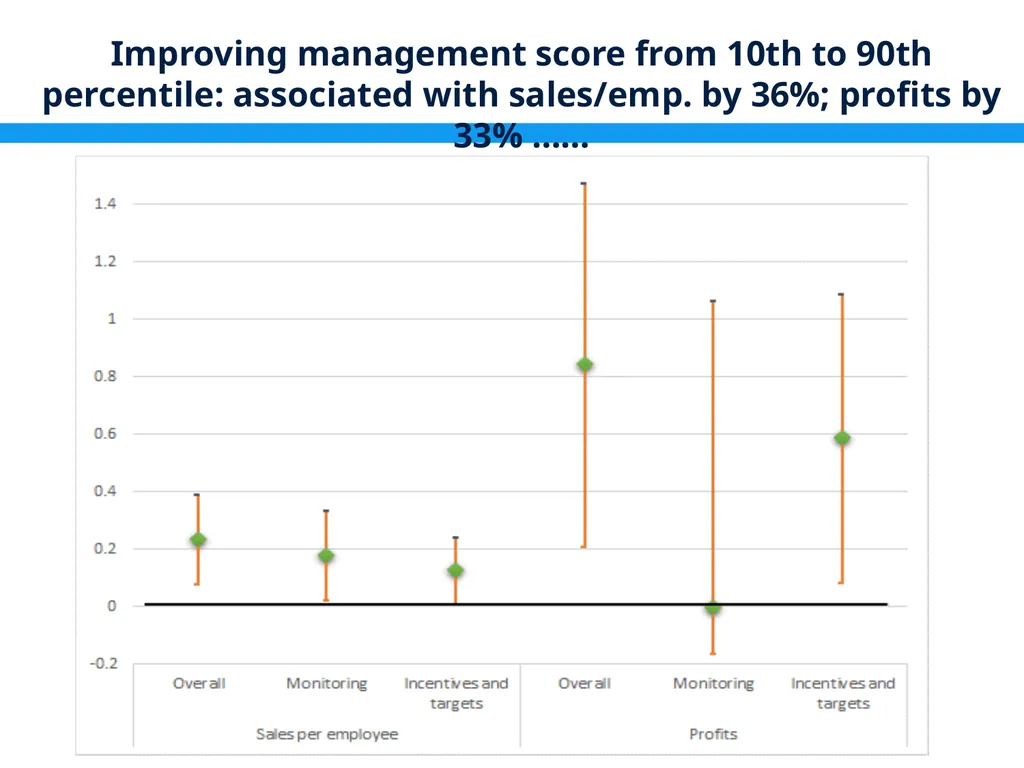
Improving management score from 10th to 90th percentile: associated with sales/emp. by 36%; profits by 33% ……<br>
23
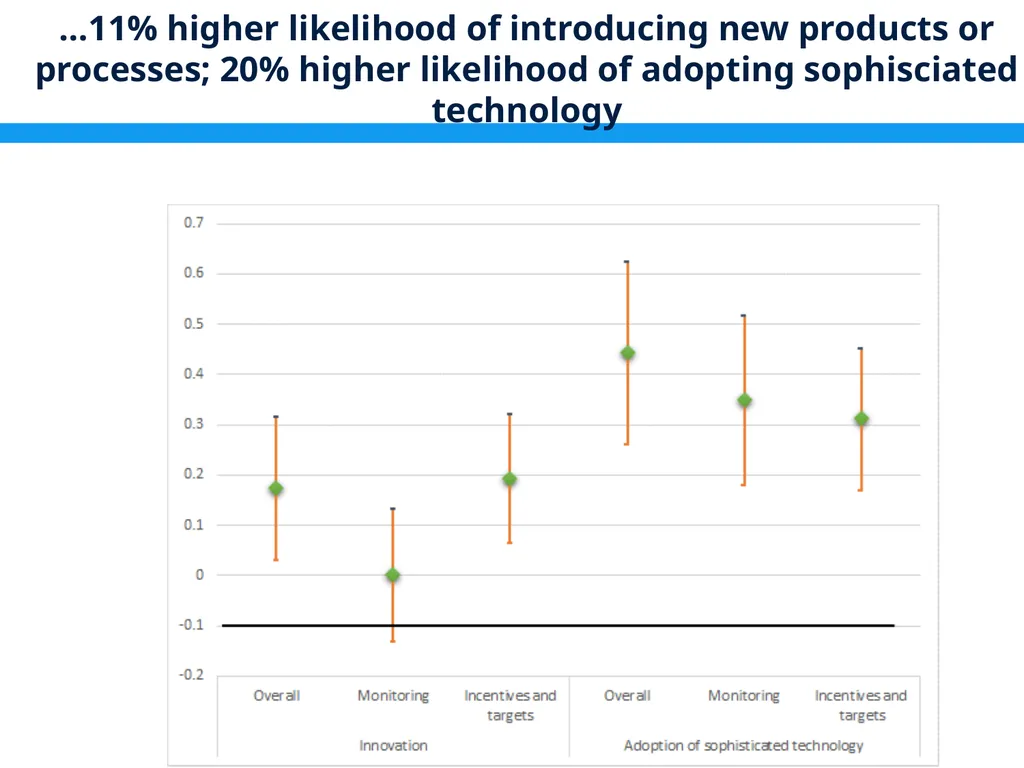
…11% higher likelihood of introducing new products or processes; 20% higher likelihood of adopting sophisciated technology<br>
24
Why Firms Don’t Adopt Structured Management Practices<br>
25
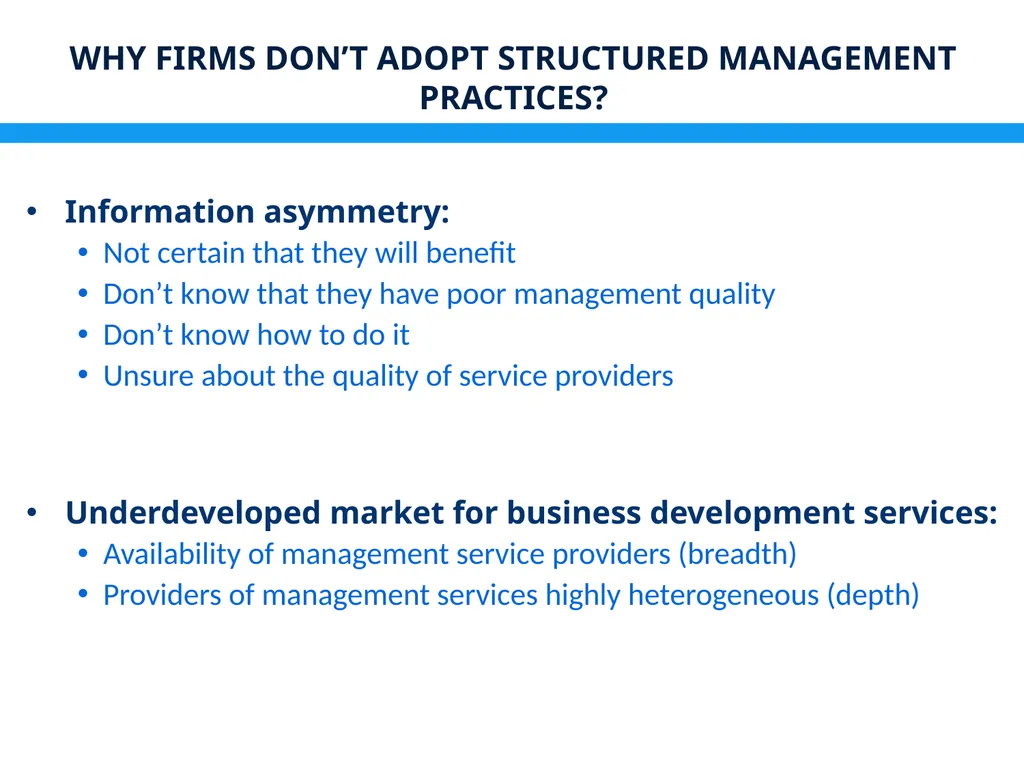
Why firms don’t adopt structured management practices? Information asymmetry:
Not certain that they will benefit
Don’t know that they have poor management quality
Don’t know how to do it
Unsure about the quality of service providers
Underdeveloped market for business development services:
Availability of management service providers (breadth)
Providers of management services highly heterogeneous (depth)<br>
26
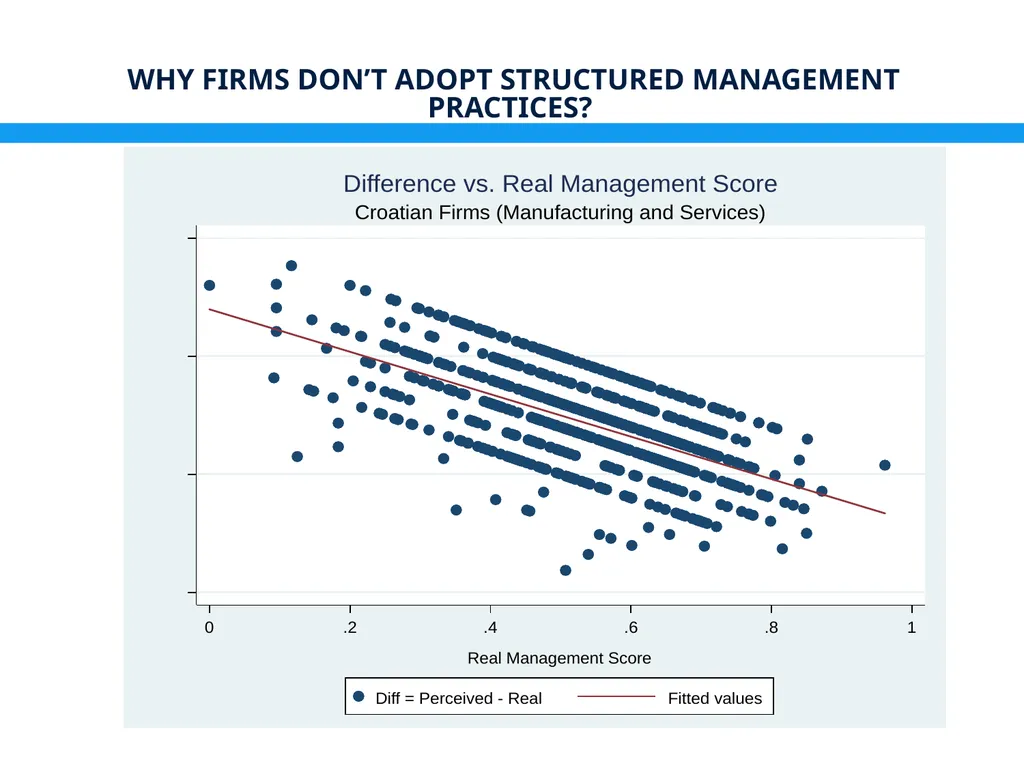
Why firms don’t adopt structured management practices?<br>
27
What Drives Adoption of Structured Management Practices?<br>
28
What drives better management practices Regions and sectors
Foreign ownership or supplier to foreign firms?
Exporters?
Size?
Age?
Managers’ and workers’ education?<br>
29
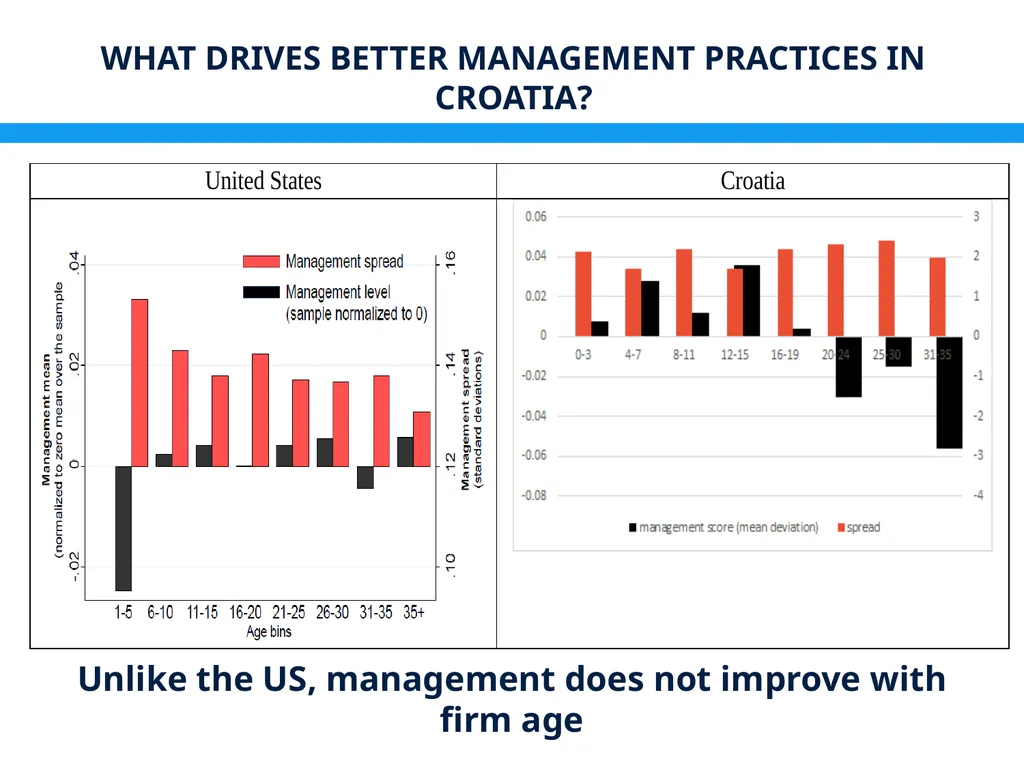
What drives better management practices in Croatia? Unlike the US, management does not improve with firm age<br>
30
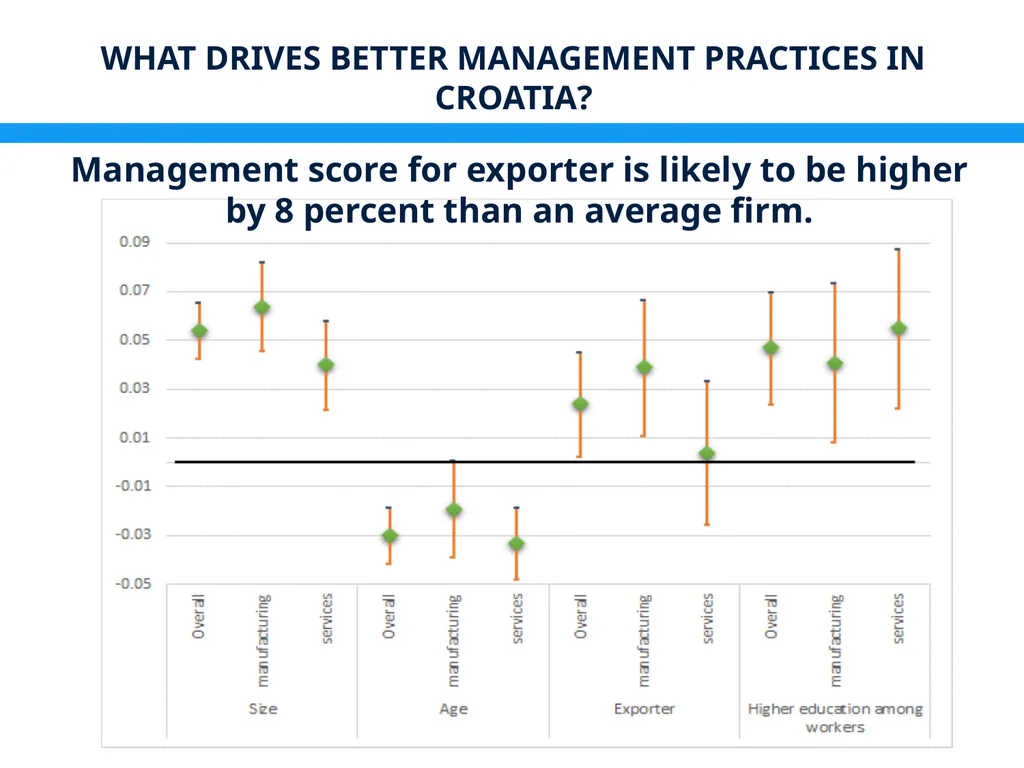
What drives better management practices in Croatia? Management score for exporter is likely to be higher by 8 percent than an average firm.<br>
31
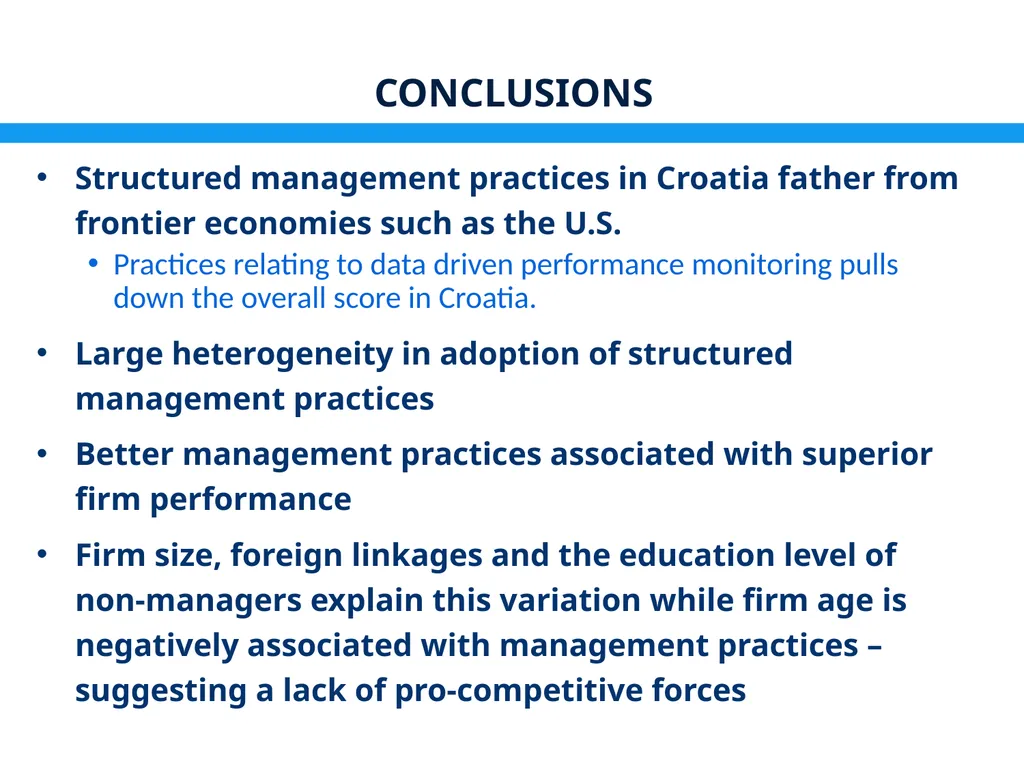
Conclusions Structured management practices in Croatia father from frontier economies such as the U.S.
Practices relating to data driven performance monitoring pulls down the overall score in Croatia.
Large heterogeneity in adoption of structured management practices
Better management practices associated with superior firm performance
Firm size, foreign linkages and the education level of non-managers explain this variation while firm age is negatively associated with management practices – suggesting a lack of pro-competitive forces<br>
32
What Does this Mean for Policy?<br>
33
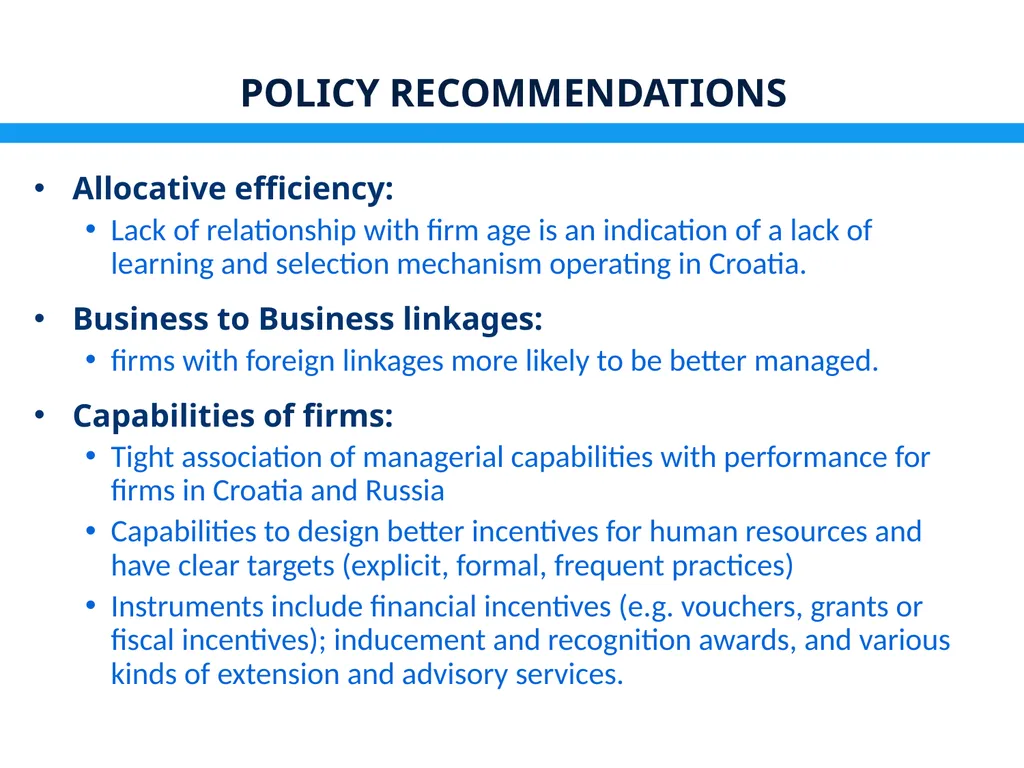
Policy recommendations Allocative efficiency:
Lack of relationship with firm age is an indication of a lack of learning and selection mechanism operating in Croatia.
Business to Business linkages:
firms with foreign linkages more likely to be better managed.
Capabilities of firms:
Tight association of managerial capabilities with performance for firms in Croatia and Russia
Capabilities to design better incentives for human resources and have clear targets (explicit, formal, frequent practices)
Instruments include financial incentives (e.g. vouchers, grants or fiscal incentives); inducement and recognition awards, and various kinds of extension and advisory services.<br>
34
Some lessons from the survey in Croatia��Credits: Šime Smolić (Asst. Professor/ Survey Specialist)<br>
35
How are problems resolved in Croatia’s firms? What response best describes what happened in the company when a problem arose in its processes?<br>
36
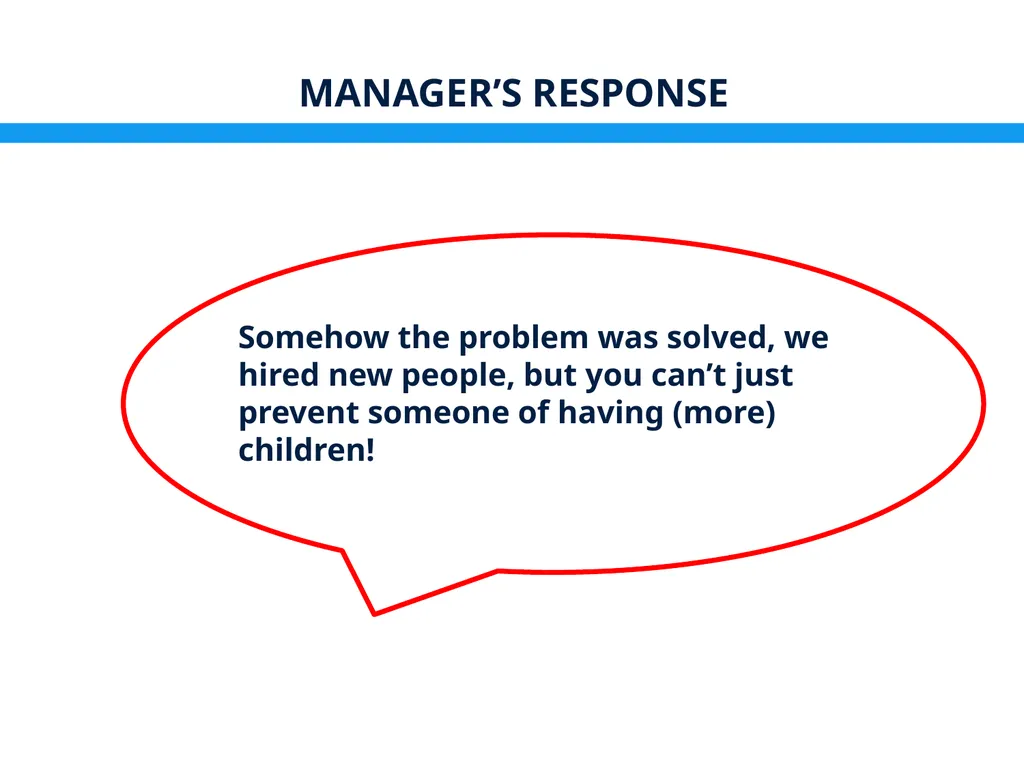
Manager’s response Somehow the problem was solved, we hired new people, but you can’t just prevent someone of having (more) children!<br>
37
How are problems resolved in Croatia’s firms? What response best describes what happened in the company when a problem arose in its processes?<br>
38
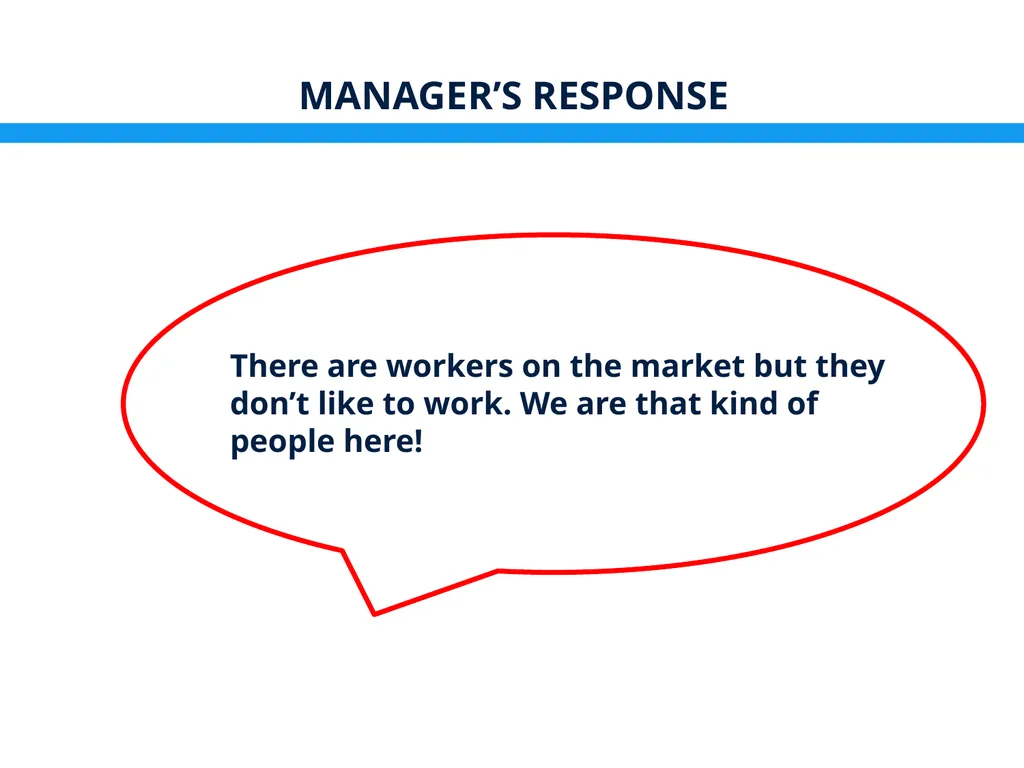
There are workers on the market but they don’t like to work. We are that kind of people here! manager’s response<br>
39
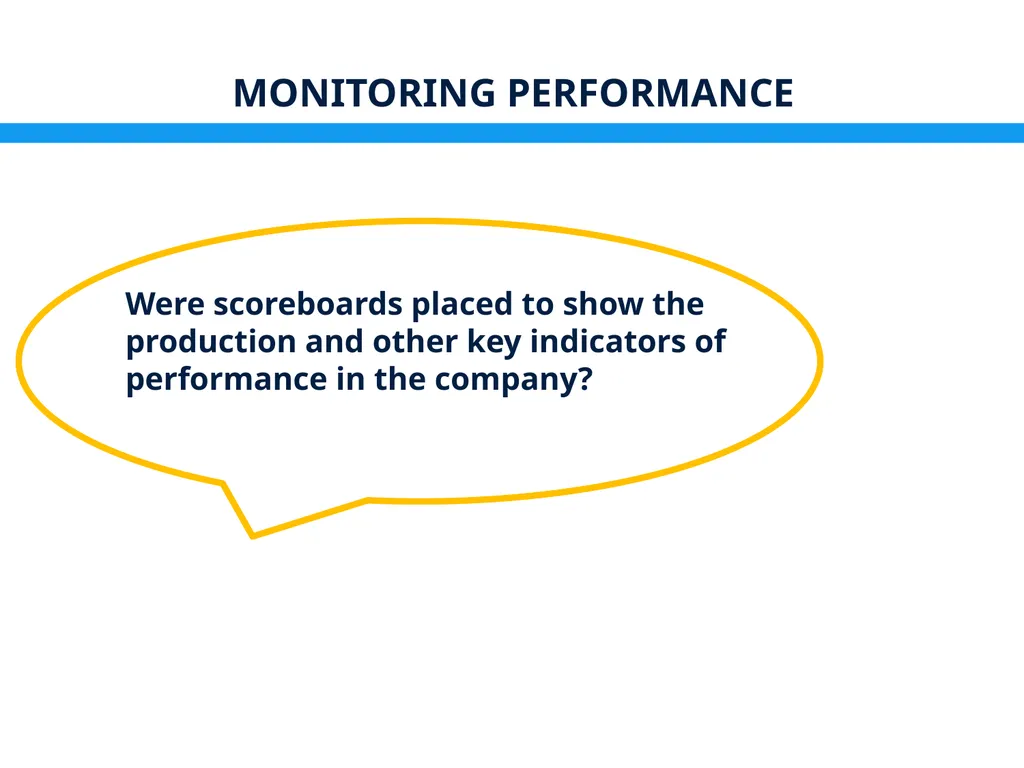
Monitoring performance Were scoreboards placed to show the production and other key indicators of performance in the company?<br>
40
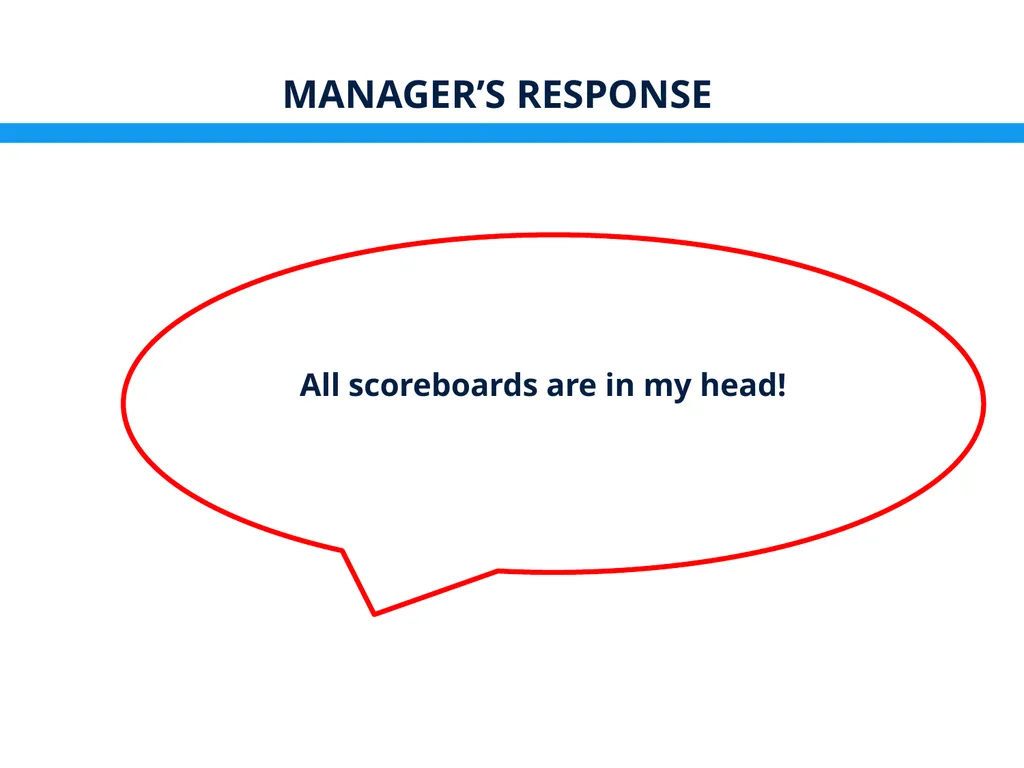
All scoreboards are in my head! Manager’s response<br>
43
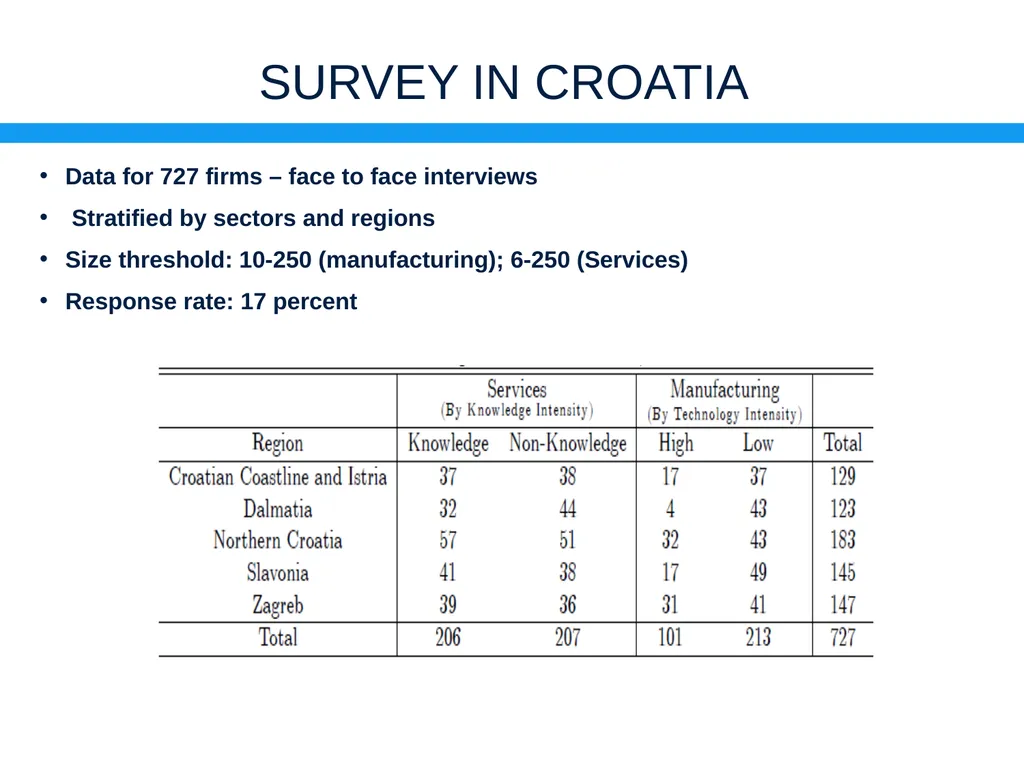
Survey in Croatia Data for 727 firms – face to face interviews
Stratified by sectors and regions
Size threshold: 10-250 (manufacturing); 6-250 (Services)
Response rate: 17 percent<br>
44
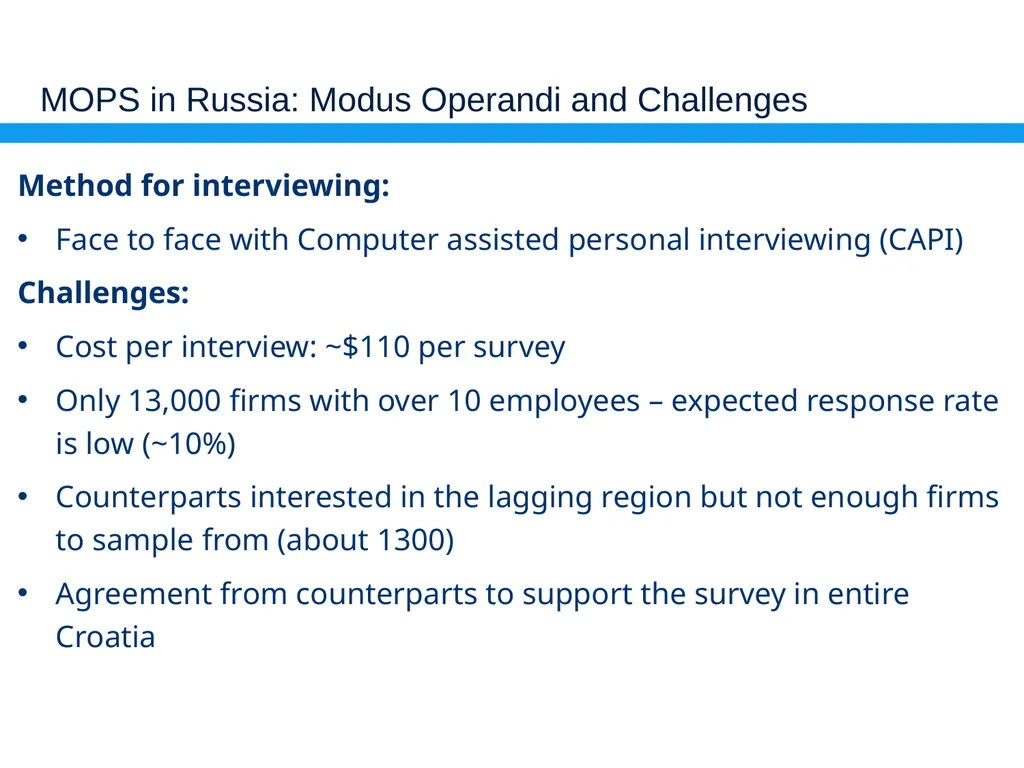
MOPS in Russia: Modus Operandi and Challenges Method for interviewing:
Face to face with Computer assisted personal interviewing (CAPI)
Challenges:
Cost per interview: ~$110 per survey
Only 13,000 firms with over 10 employees – expected response rate is low (~10%)
Counterparts interested in the lagging region but not enough firms to sample from (about 1300)
Agreement from counterparts to support the survey in entire Croatia<br>
45
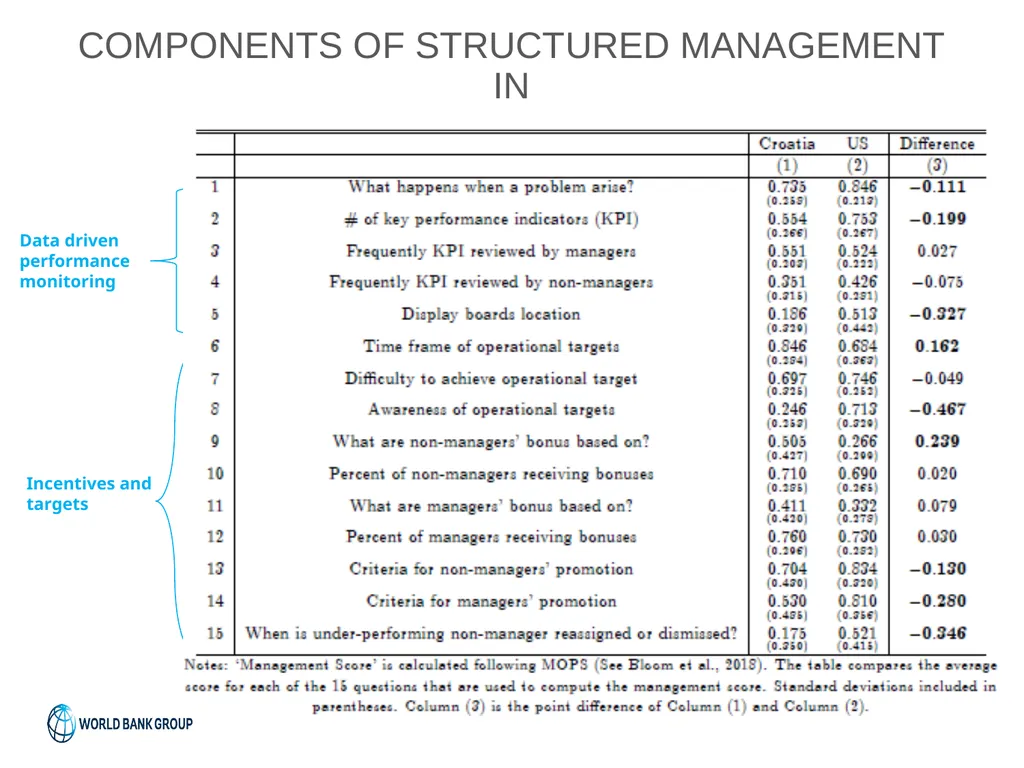
Components of structured management in Data driven performance monitoring Incentives and targets<br>
46
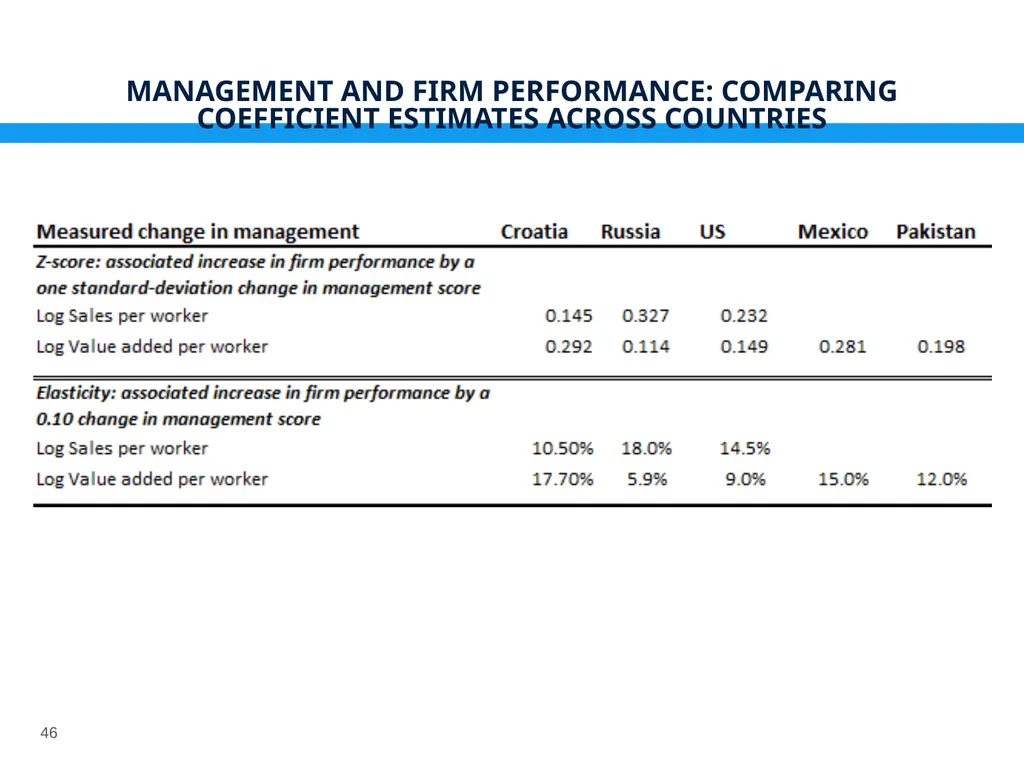
45 Management and firm performance: Comparing coefficient estimates across countries<br>
47
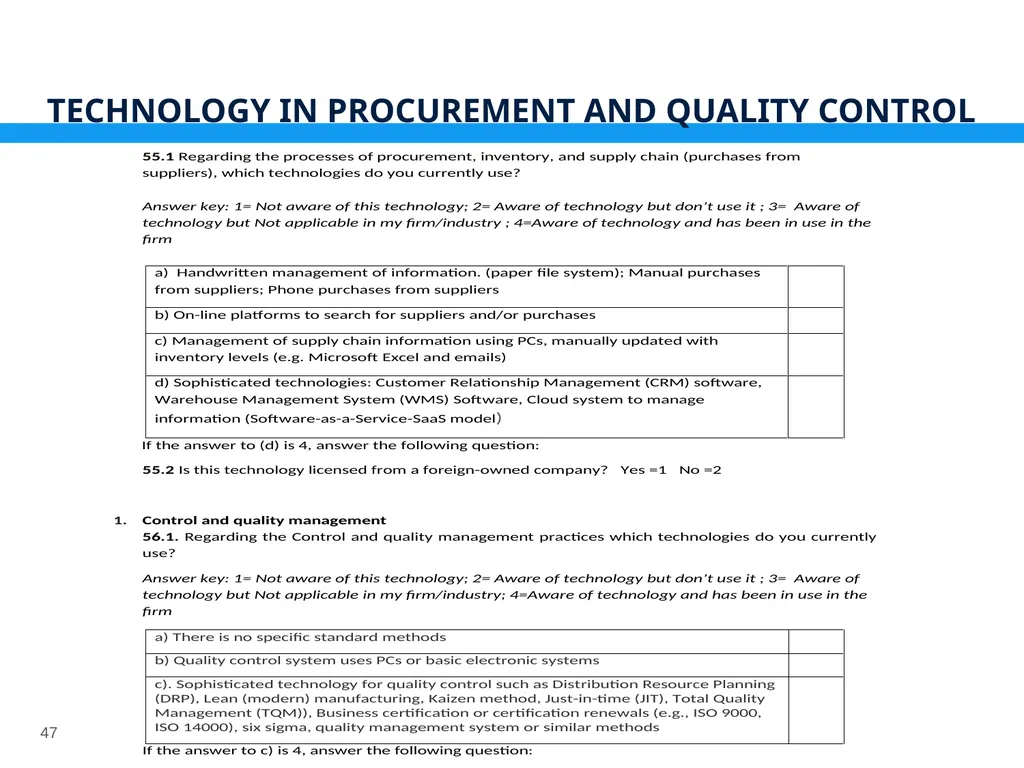
46 TECHNOLOGY IN PROCUREMENT AND QUALITY CONTROL<br>