
Managing a Salary Survey Project Patricia A.
SB
Published · 47 slides · 0 views

1 / 1



Description
Managing a Salary Survey Project Patricia A. Meglich, Ph.D., SPHR 2011 Key concepts Session 1: Motivation theories. External equity. Determine the compensation philosophy. Purposes of a salary survey. Legal considerations. Make or buy
Related Topics
Share
Embed code
Download this presentation From Below
"Managing a Salary Survey Project Patricia A." is the property of its rightful owner. Permission is granted to download and print the materials on this website for personal, non-commercial use only, and to display it on your personal computer provided you do not modify the materials and that you retain all copyright notices contained in the materials. By downloading content from our website, you accept the terms of this agreement.
Presentation Transcript
01
Managing a Salary Survey Project Patricia A. Meglich, Ph.D., SPHR • 2011<br>
02
Key concepts Session 1:
Motivation theories.
External equity.
Determine the compensation philosophy.
Purposes of a salary survey.
Legal considerations.
Make or buy decision. SHRM© 2011 2<br>
Motivation theories.
External equity.
Determine the compensation philosophy.
Purposes of a salary survey.
Legal considerations.
Make or buy decision. SHRM© 2011 2<br>
03
Key concepts Session 2:
Planning a salary survey project.
Designing a survey.
Collecting data.
Session 3:
Analyzing and interpreting survey results.
Adjusting pay scales. SHRM© 2011 3<br>
Planning a salary survey project.
Designing a survey.
Collecting data.
Session 3:
Analyzing and interpreting survey results.
Adjusting pay scales. SHRM© 2011 3<br>
04
SHRM© 2011 Learning objectives for Session 1 External equity.
Determine the compensation philosophy.
Purposes of a salary survey.
Legal considerations.
Make-or-buy decision. 4<br>
Determine the compensation philosophy.
Purposes of a salary survey.
Legal considerations.
Make-or-buy decision. 4<br>
05
Motivation theories Maslow’s hierarchy of needs.
Herzberg’s two-factor theory.
Vroom’s expectancy theory.
Adams’ equity theory. SHRM© 2011 5<br>
Herzberg’s two-factor theory.
Vroom’s expectancy theory.
Adams’ equity theory. SHRM© 2011 5<br>
06
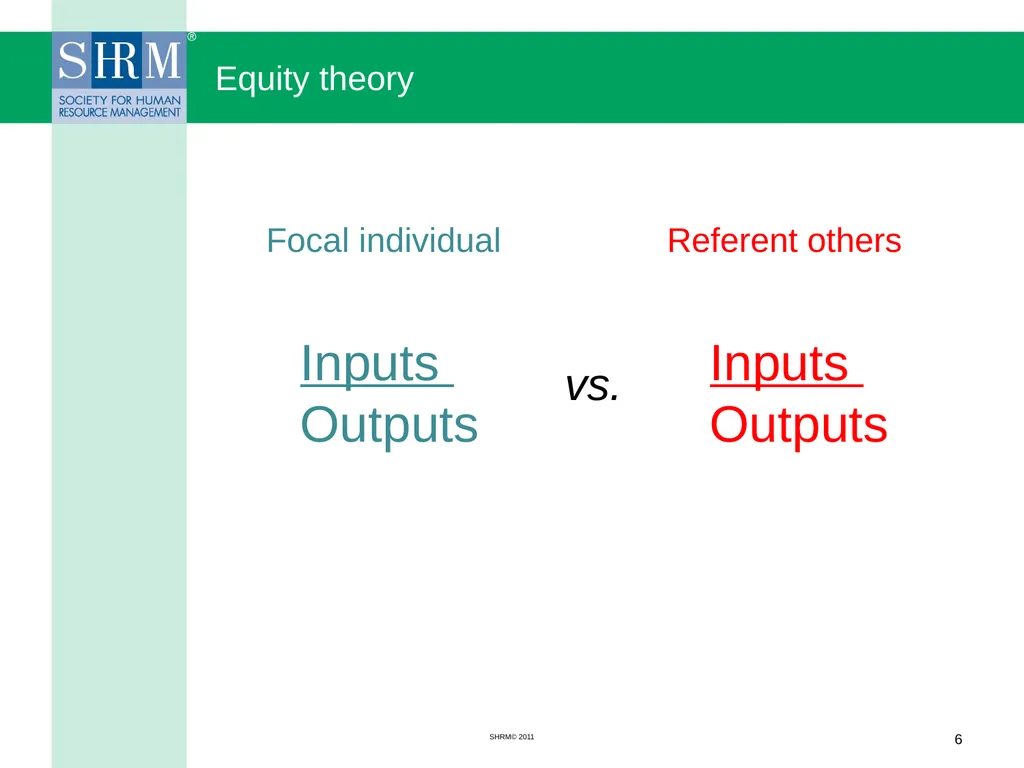
Equity theory Inputs
Outputs Inputs
Outputs vs. Focal individual Referent others SHRM© 2011 6<br>
Outputs Inputs
Outputs vs. Focal individual Referent others SHRM© 2011 6<br>
07
Rebalancing the equity comparison Decrease your inputs:
Stop working overtime.
Take longer breaks.
Don’t offer ideas or suggestions.
Try to increase your outputs:
Ask for a raise.
Look for a new job with higher pay. SHRM© 2011 7<br>
Stop working overtime.
Take longer breaks.
Don’t offer ideas or suggestions.
Try to increase your outputs:
Ask for a raise.
Look for a new job with higher pay. SHRM© 2011 7<br>
08
Equity considerations Internal equity:
Job evaluation – relative worth of jobs within the organization.
Parity between jobs.
Parity between individuals in the same job.
External equity:
Market data – relative position in the marketplace.
Attract and retain quality talent.
Competitive position. SHRM© 2011 8<br>
Job evaluation – relative worth of jobs within the organization.
Parity between jobs.
Parity between individuals in the same job.
External equity:
Market data – relative position in the marketplace.
Attract and retain quality talent.
Competitive position. SHRM© 2011 8<br>
09
External equity Objectives:
Attract talent.
Retain talent.
Reward desired performance.
Cost-effective, affordable.
Compensation philosophy:
Competitive position.
Compensation mix. SHRM© 2011 9<br>
Attract talent.
Retain talent.
Reward desired performance.
Cost-effective, affordable.
Compensation philosophy:
Competitive position.
Compensation mix. SHRM© 2011 9<br>
10
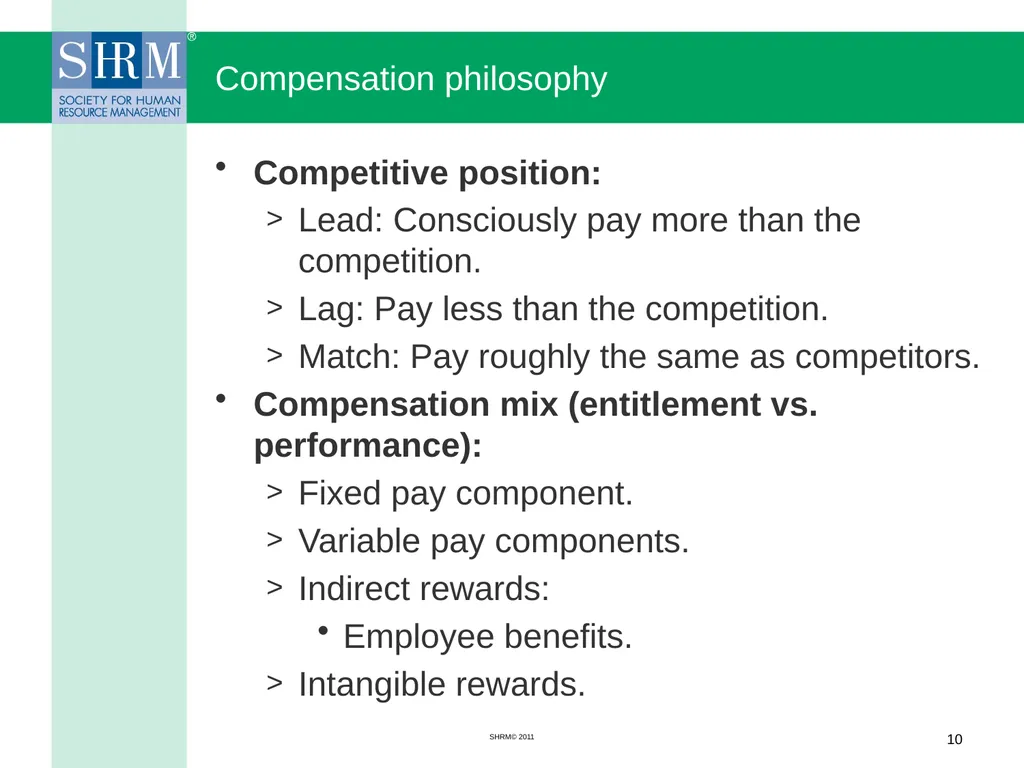
Compensation philosophy Competitive position:
Lead: Consciously pay more than the competition.
Lag: Pay less than the competition.
Match: Pay roughly the same as competitors.
Compensation mix (entitlement vs. performance):
Fixed pay component.
Variable pay components.
Indirect rewards:
Employee benefits.
Intangible rewards. SHRM© 2011 10<br>
Lead: Consciously pay more than the competition.
Lag: Pay less than the competition.
Match: Pay roughly the same as competitors.
Compensation mix (entitlement vs. performance):
Fixed pay component.
Variable pay components.
Indirect rewards:
Employee benefits.
Intangible rewards. SHRM© 2011 10<br>
11
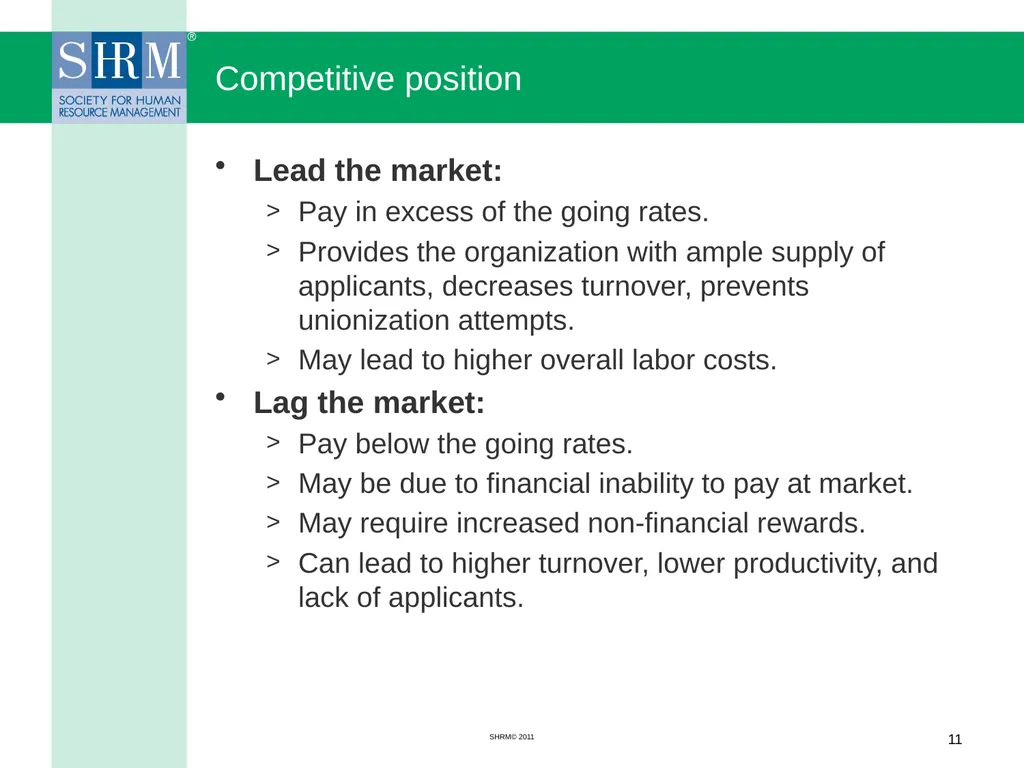
Competitive position Lead the market:
Pay in excess of the going rates.
Provides the organization with ample supply of applicants, decreases turnover, prevents unionization attempts.
May lead to higher overall labor costs.
Lag the market:
Pay below the going rates.
May be due to financial inability to pay at market.
May require increased non-financial rewards.
Can lead to higher turnover, lower productivity, and lack of applicants. SHRM© 2011 11<br>
12
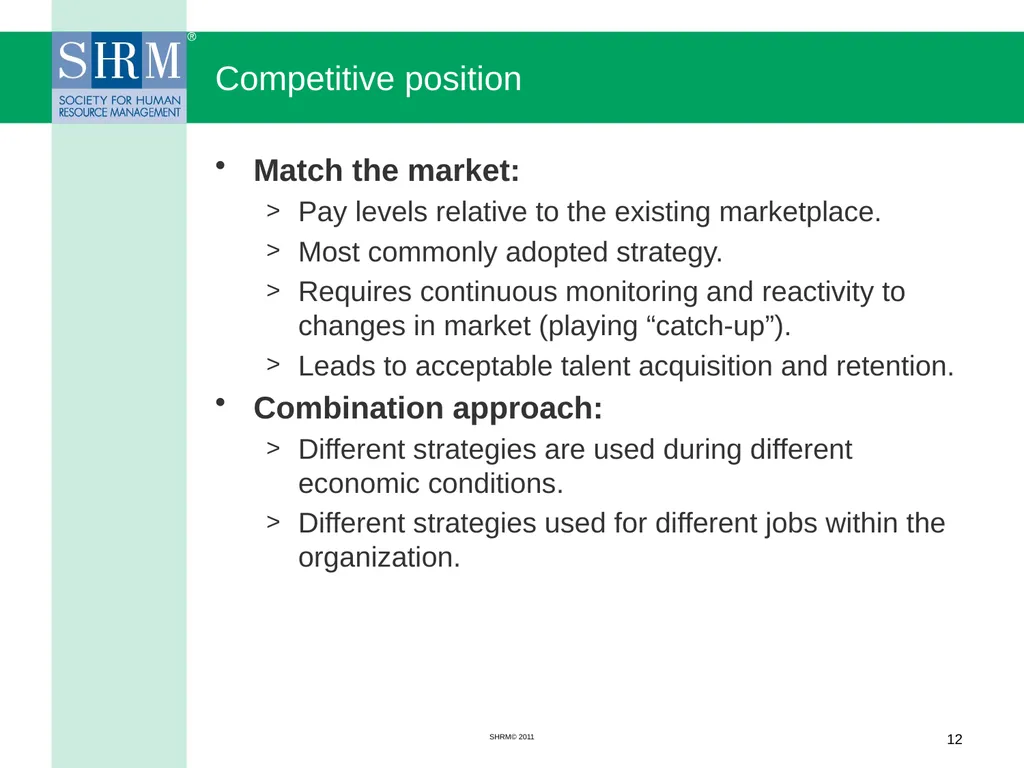
Competitive position Match the market:
Pay levels relative to the existing marketplace.
Most commonly adopted strategy.
Requires continuous monitoring and reactivity to changes in market (playing “catch-up”).
Leads to acceptable talent acquisition and retention.
Combination approach:
Different strategies are used during different economic conditions.
Different strategies used for different jobs within the organization. SHRM© 2011 12<br>
13
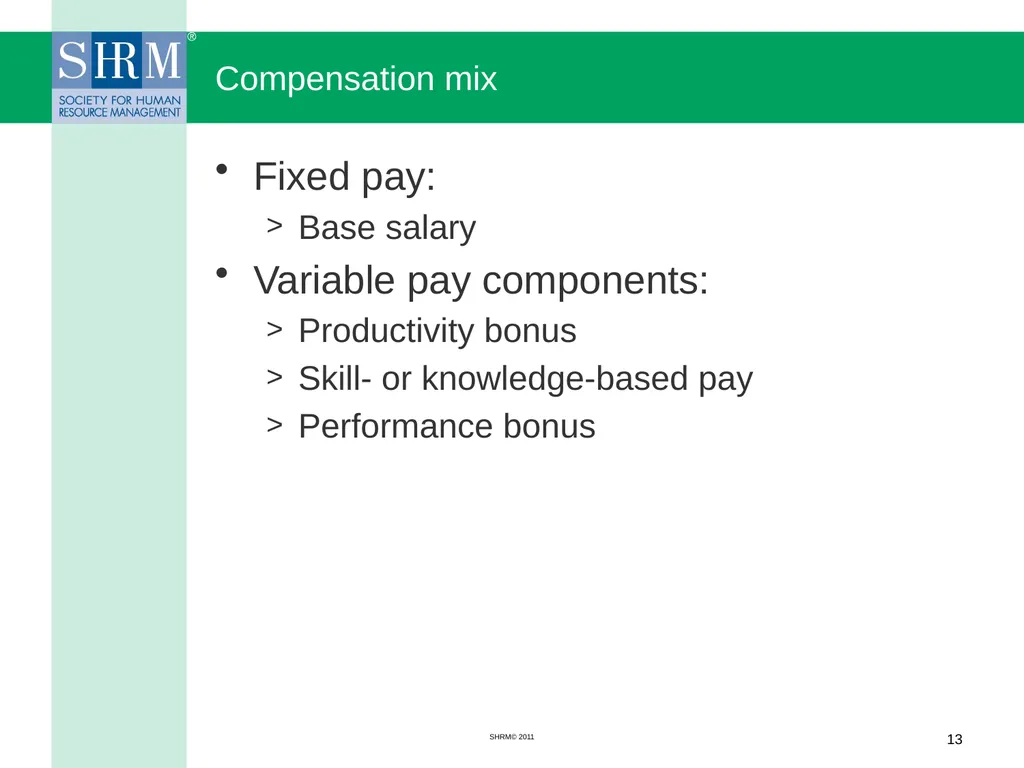
Compensation mix Fixed pay:
Base salary
Variable pay components:
Productivity bonus
Skill- or knowledge-based pay
Performance bonus SHRM© 2011 13<br>
Base salary
Variable pay components:
Productivity bonus
Skill- or knowledge-based pay
Performance bonus SHRM© 2011 13<br>
14
Compensation mix Indirect rewards:
Mandatory benefits
Voluntary benefits
Intangible rewards
Challenging work
Autonomy
Feedback
Supportive work relationships SHRM© 2011 14<br>
Mandatory benefits
Voluntary benefits
Intangible rewards
Challenging work
Autonomy
Feedback
Supportive work relationships SHRM© 2011 14<br>
15
What is a salary survey? A salary survey is the systematic process of collecting information and making judgments about the compensation paid by other employers.
Milkovich, Newman and Gerhart, 2011 SHRM© 2011 15<br>
Milkovich, Newman and Gerhart, 2011 SHRM© 2011 15<br>
16
Purposes of a salary survey Establish or adjust pay levels.
Establish or adjust pay mix.
Establish or price a pay structure.
Analyze pay-related problems:
Employee turnover.
Union organizing activity. SHRM© 2011 16<br>
Establish or adjust pay mix.
Establish or price a pay structure.
Analyze pay-related problems:
Employee turnover.
Union organizing activity. SHRM© 2011 16<br>
17
Purposes of a salary survey Estimate competitors’ labor costs.
Decide where to locate an operation:
New operations.
Expanding operations. SHRM© 2011 17<br>
Decide where to locate an operation:
New operations.
Expanding operations. SHRM© 2011 17<br>
18
Legal considerations Anti-trust issues:
Sherman Antitrust Act of 1890.
Purpose of the survey.
Collusion among participants.
Privacy concerns:
De-identify information.
Labor union considerations:
“Prevailing wage” issues. SHRM© 2011 18<br>
Sherman Antitrust Act of 1890.
Purpose of the survey.
Collusion among participants.
Privacy concerns:
De-identify information.
Labor union considerations:
“Prevailing wage” issues. SHRM© 2011 18<br>
19
Make-or-buy decision Investigate off-the-shelf options
Consulting firms:
Mercer Consulting
Trade/industry groups:
National Telecommunications Cooperative Association
Professional organizations:
Society for Human Resource Management
Government data sources:
Bureau of Labor Statistics
Ad hoc research:
Common websites
Salary.com
Payscale.com SHRM© 2011 19<br>
20
Evaluating vendor surveys Background of the survey vendor.
Scope of the survey.
Survey methodology.
Number of participating organizations.
Number of incumbents represented.
Effective date of the survey. SHRM© 2011 20<br>
Scope of the survey.
Survey methodology.
Number of participating organizations.
Number of incumbents represented.
Effective date of the survey. SHRM© 2011 20<br>
21
Make-or-buy decision Does the situation warrant a customized survey?
Unique internal labor considerations.
Unusual external labor conditions.
Time considerations.
Cost considerations. SHRM© 2011 21<br>
Unique internal labor considerations.
Unusual external labor conditions.
Time considerations.
Cost considerations. SHRM© 2011 21<br>
22
Activity 1 – Investigate benchmark job pay rates In this activity, students will research and analyze benchmark jobs in two different geographic areas.
You will use publicly available data, assess the quality of that data and incorporate it into your results.
Finally, you will make a recommendation to the management team regarding where the company should locate its new facility.
Good luck! SHRM© 2011 22<br>
You will use publicly available data, assess the quality of that data and incorporate it into your results.
Finally, you will make a recommendation to the management team regarding where the company should locate its new facility.
Good luck! SHRM© 2011 22<br>
23
End of Session 1 This concludes Session 1.
Assignment for Session 2: Complete the activity.
Groups of 4-5 students.
Research pay rates for six benchmark jobs:
Two geographic areas.
At least two different sources.
BRING YOUR RESULTS TO SESSION 2 SHRM© 2011 23<br>
Assignment for Session 2: Complete the activity.
Groups of 4-5 students.
Research pay rates for six benchmark jobs:
Two geographic areas.
At least two different sources.
BRING YOUR RESULTS TO SESSION 2 SHRM© 2011 23<br>
24
SHRM© 2011 Learning objectives for Session 2 Debrief results from Activity 1.
Planning a salary survey project.
Designing a salary survey.
Collecting data. 24<br>
Planning a salary survey project.
Designing a salary survey.
Collecting data. 24<br>
25
Planning the salary survey project Gather background information:
Compensation philosophy and mix.
Purpose of survey.
Internal job evaluation/pay levels.
Timeliness of data.
Determine competitor/participants to include.
Select jobs to include.
Decide what information to collect.
Design survey instrument. SHRM© 2011 25<br>
Compensation philosophy and mix.
Purpose of survey.
Internal job evaluation/pay levels.
Timeliness of data.
Determine competitor/participants to include.
Select jobs to include.
Decide what information to collect.
Design survey instrument. SHRM© 2011 25<br>
26
Planning the survey project Collect data.
Analyze data.
Determine appropriate adjustments.
Make pay adjustments as needed. SHRM© 2011 26<br>
Analyze data.
Determine appropriate adjustments.
Make pay adjustments as needed. SHRM© 2011 26<br>
27
Background information/timeliness of data Background information:
Compensation philosophy.
Compensation mix.
Purpose of survey.
Legal considerations.
Internal job evaluation. Timeliness of data:
Purpose of survey.
Volatility or fluctuation in economic situation. SHRM© 2011 27<br>
Compensation philosophy.
Compensation mix.
Purpose of survey.
Legal considerations.
Internal job evaluation. Timeliness of data:
Purpose of survey.
Volatility or fluctuation in economic situation. SHRM© 2011 27<br>
28
Competitors to include How many:
6-10.
Industry:
Industry-specific.
Generic. Geographic:
Metropolitan.
Regional.
National.
Size/age:
Revenue.
Headcount. SHRM© 2011 28<br>
6-10.
Industry:
Industry-specific.
Generic. Geographic:
Metropolitan.
Regional.
National.
Size/age:
Revenue.
Headcount. SHRM© 2011 28<br>
29
Jobs to include Benchmark job approach:
Stable job content.
Common across different employers.
Include sizable number of employees.
Low-high approach:
Lowest paid.
Highest paid. SHRM© 2011 29<br>
Stable job content.
Common across different employers.
Include sizable number of employees.
Low-high approach:
Lowest paid.
Highest paid. SHRM© 2011 29<br>
30
Jobs to include Benchmark conversion/survey leveling:
Rely on internal job evaluation to “convert” to benchmark job data. SHRM© 2011 30<br>
Rely on internal job evaluation to “convert” to benchmark job data. SHRM© 2011 30<br>
31
Information to collect Organization data:
Identification.
Industry classification.
Financial performance.
Size.
Structure.
Age.
Total compensation:
Direct compensation.
Indirect compensation. SHRM© 2011 31<br>
Identification.
Industry classification.
Financial performance.
Size.
Structure.
Age.
Total compensation:
Direct compensation.
Indirect compensation. SHRM© 2011 31<br>
32
Information to collect Incumbent/job:
Job description.
Education.
Experience.
Pay range.
Pay rate.
HR outcomes:
Productivity.
Retention rates. SHRM© 2011 32<br>
Job description.
Education.
Experience.
Pay range.
Pay rate.
HR outcomes:
Productivity.
Retention rates. SHRM© 2011 32<br>
33
Design the survey instrument Response method:
Paper and pencil.
Electronic:
SurveyMonkey.
Zoomerang.
QuestionPro.
Ease of response:
Don’t over-complicate.
Don’t ask for too much.
Assure anonymity:
Use of third party.
Make it worth their time:
Free/discount results for participants. SHRM© 2011 33<br>
Paper and pencil.
Electronic:
SurveyMonkey.
Zoomerang.
QuestionPro.
Ease of response:
Don’t over-complicate.
Don’t ask for too much.
Assure anonymity:
Use of third party.
Make it worth their time:
Free/discount results for participants. SHRM© 2011 33<br>
34
Activity 2 – Gantt chart activity You will plan the survey project using a Gantt chart.
Review all steps in the process from Sessions 1 and 2. You don’t want to forget an important step.
Make a list of all tasks and how long they will take to complete.
Transfer all data to the Gantt chart.
Good luck! SHRM© 2011 34<br>
Review all steps in the process from Sessions 1 and 2. You don’t want to forget an important step.
Make a list of all tasks and how long they will take to complete.
Transfer all data to the Gantt chart.
Good luck! SHRM© 2011 34<br>
35
End of Session 2 This concludes Session 2.
Session 3 will ideally be held in a computer lab. Alternatively, ask students to bring calculators to Session 3.
Data analysis requires calculations and graphing. SHRM© 2011 35<br>
Session 3 will ideally be held in a computer lab. Alternatively, ask students to bring calculators to Session 3.
Data analysis requires calculations and graphing. SHRM© 2011 35<br>
36
SHRM© 2011 Learning objectives for Session 3 Collect and analyze data.
Interpret survey results.
Construct a market line.
Discuss dealing with pay issues. 36<br>
Interpret survey results.
Construct a market line.
Discuss dealing with pay issues. 36<br>
37
Collecting data Recruiting participants:
Consulting firm or other third party.
Managing data:
Complete responses.
Contact information.
Deadline.
Aggregated database.
Resource limits:
Time.
Money. SHRM© 2011 37<br>
Consulting firm or other third party.
Managing data:
Complete responses.
Contact information.
Deadline.
Aggregated database.
Resource limits:
Time.
Money. SHRM© 2011 37<br>
38
Analyzing survey results Verify accuracy of job matches.
Deal with outliers/anomalies.
Run statistical analyses.
Construct the market pay line and the pay policy line. SHRM© 2011 38<br>
Deal with outliers/anomalies.
Run statistical analyses.
Construct the market pay line and the pay policy line. SHRM© 2011 38<br>
39
Dealing with outliers/anomalies Does any one organization dominate?
Perhaps delete responses to avoid aberrations.
Do all organizations show similar patterns?
Look for trends regarding compensation mix.
Do jobs tend to fall in the same high-low order in terms of market pay?
Are there outliers or odd data points?
Questions to consider:
What difference will it make if outliers are dropped?
What difference will it make if outliers are included in the analysis? SHRM© 2011 39<br>
40
Statistical analysis Frequency distribution.
Mean: mathematical average.
Simple mean.
Trimmed mean.
Weighted average.
Median: middle data point in ordered data set.
Mode: most frequently occurring value. SHRM© 2011 40<br>
Mean: mathematical average.
Simple mean.
Trimmed mean.
Weighted average.
Median: middle data point in ordered data set.
Mode: most frequently occurring value. SHRM© 2011 40<br>
41
Statistical analysis Percentile: pay rate that a certain percentage of the salary data is less than.
Range:
Simple range = highest – lowest value.
Interquartile range (IRQ) = difference between 75th and 25th percentiles. SHRM© 2011 41<br>
Range:
Simple range = highest – lowest value.
Interquartile range (IRQ) = difference between 75th and 25th percentiles. SHRM© 2011 41<br>
42
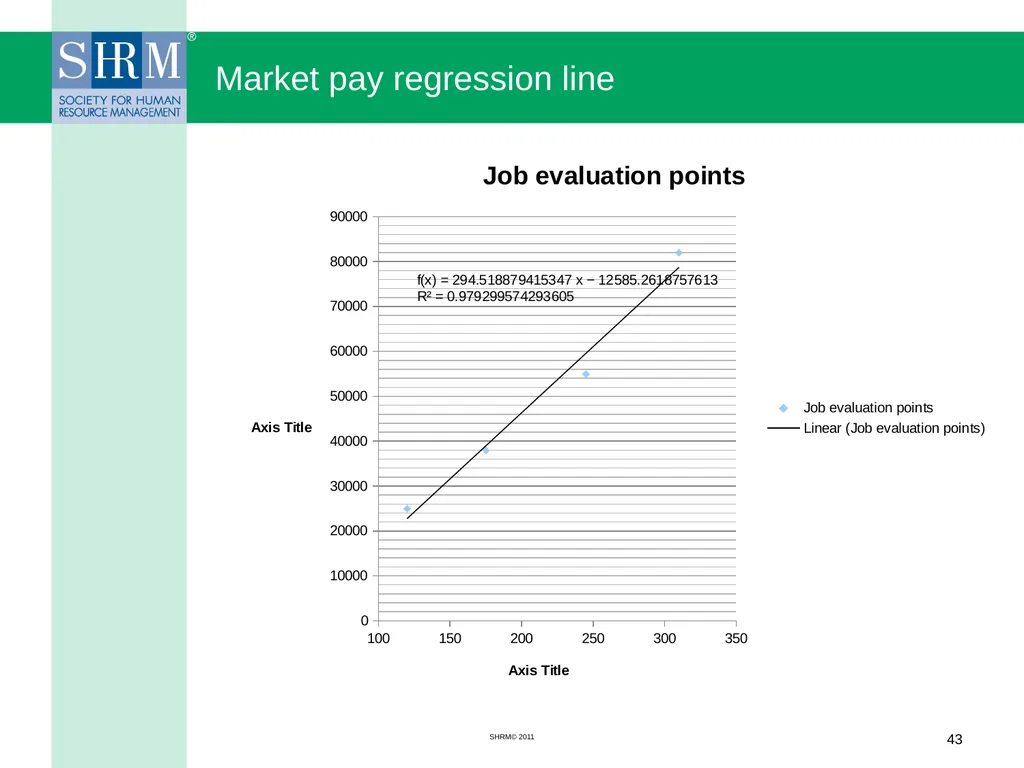
Market pay line Plot the benchmark jobs on the horizontal (x) axis and the market rates on the vertical (y) axis.
Can be drawn manually or developed through a regression analysis.
This analysis utilizes internal job evaluation points to calculate the regression line.
Excel makes this very easy.
Enter data in Excel.
Calculate slope and y-intercept.
Create the graphic (plot). SHRM© 2011 42<br>
Can be drawn manually or developed through a regression analysis.
This analysis utilizes internal job evaluation points to calculate the regression line.
Excel makes this very easy.
Enter data in Excel.
Calculate slope and y-intercept.
Create the graphic (plot). SHRM© 2011 42<br>
43
Market pay regression line SHRM© 2011 43<br>
44
Activity 3 – Analyzing survey data activity You will analyze survey sample data by computing measures of central tendency.
You will then plot the results to set a market pay line.
Good luck! SHRM© 2011 44<br>
You will then plot the results to set a market pay line.
Good luck! SHRM© 2011 44<br>
45
Dealing with pay issues Communicate findings to employees.
Above market pay issues.
Below market pay issues.
Job evaluation adjustments. SHRM© 2011 45<br>
Above market pay issues.
Below market pay issues.
Job evaluation adjustments. SHRM© 2011 45<br>
46
Wrap up Equity considerations:
Internal.
External.
Competitive market information.
Designing and conducting a salary survey.
Using survey data to make compensation decisions. SHRM© 2011 46<br>
Internal.
External.
Competitive market information.
Designing and conducting a salary survey.
Using survey data to make compensation decisions. SHRM© 2011 46<br>
47
SHRM© 2011 End of Session 3; End of Module This concludes the learning module on managing a salary survey project. 47<br>