Markowitz Model Of Portfolio Selection Study Material Relating Portfolio Mangement MBA-4th Semester Prof. A. K. Sarkar Mean-variance analysis An investor is supposed to be risk-averse, hence heshe wants a small variance of the return (i.e.
"Markowitz Model Of Portfolio Selection Study" is the property of its rightful owner. Permission is granted to
download and print the materials on this website for personal, non-commercial use only, and to display it
on your personal computer provided you do not modify the materials and that you retain all copyright
notices contained in the materials. By downloading content from our website, you accept the terms of this
agreement.
Presentation Transcript
01
Markowitz Model Of Portfolio Selection Study Material Relating
Portfolio Mangement
MBA-4th Semester
Prof. A. K. Sarkar Mean-variance analysis<br>
02
An investor is supposed to be risk-averse, hence he/she wants a small variance of the return (i.e. a small risk) and a high expected return.
Provides a method to analyse how good a given portfolio is.
It is based only on the means and the variance of the returns of the assets contained in the portfolio.
It is a quantitative tool that allows an investor to allocate his resources by considering trade-off between risk and return.
For a given level of expected return in a group of securities, one security will dominate.
Concept of Diversification introduced. Markowitz Portfolio Theory<br>
03
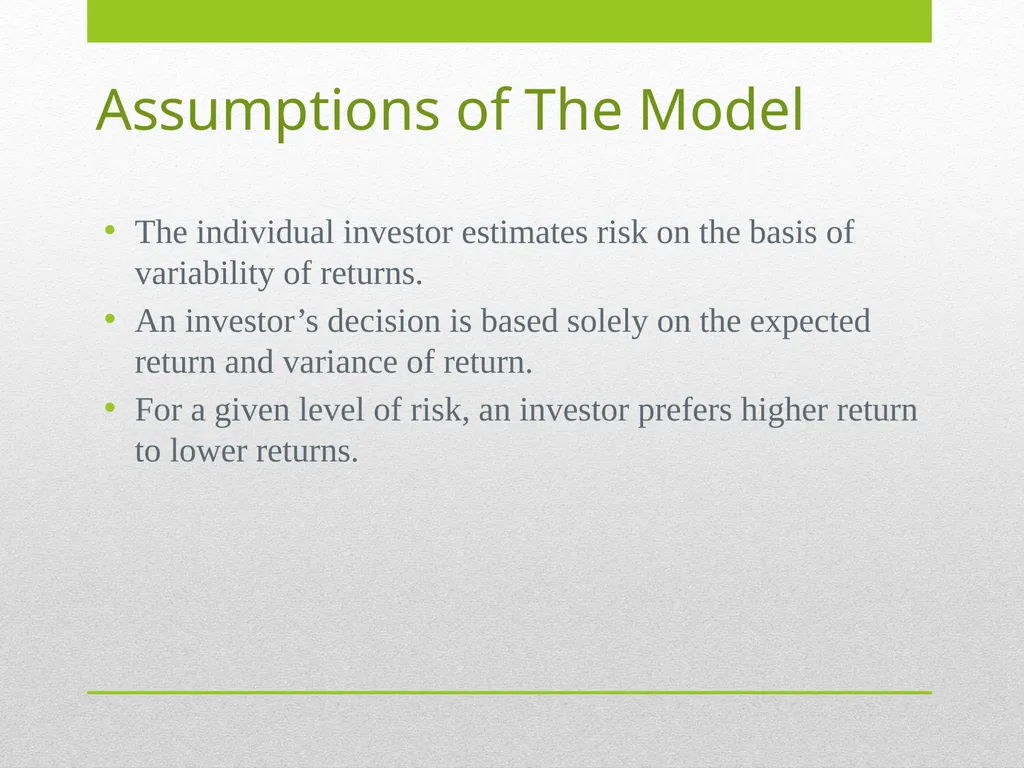
Assumptions of The Model The individual investor estimates risk on the basis of variability of returns.
An investor’s decision is based solely on the expected return and variance of return.
For a given level of risk, an investor prefers higher return to lower returns.<br>
04
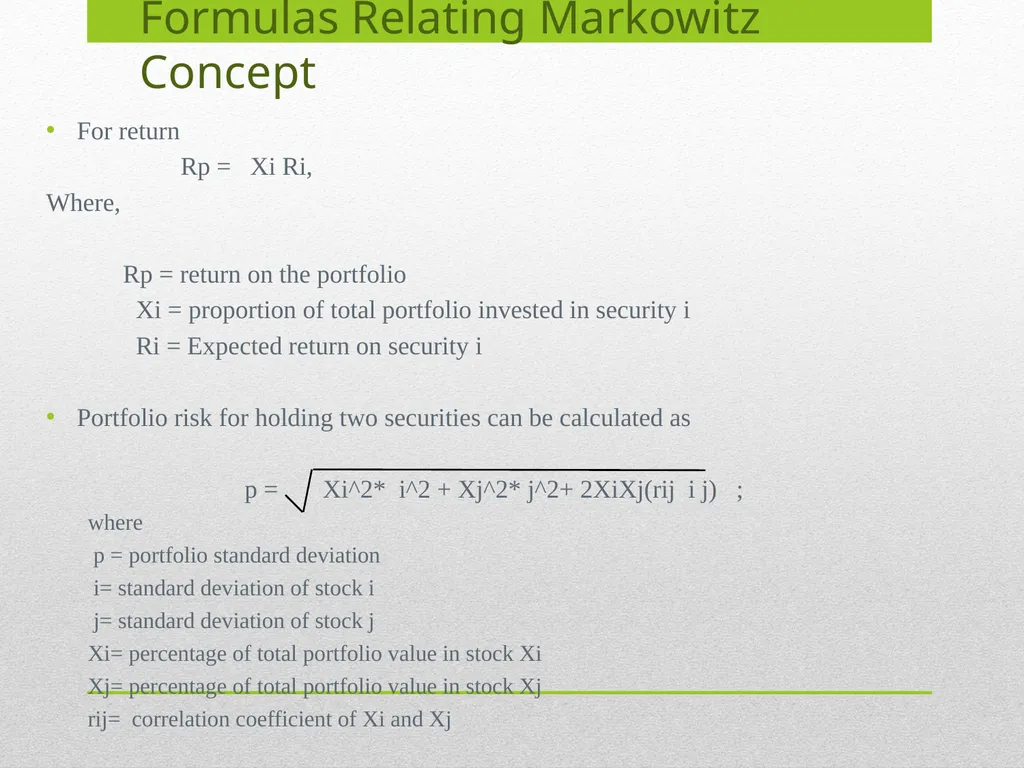
For return
Rp = Xi Ri,
Where,
Rp = return on the portfolio
Xi = proportion of total portfolio invested in security i
Ri = Expected return on security i
Portfolio risk for holding two securities can be calculated as
p = Xi^2*i^2 + Xj^2*j^2+ 2XiXj(rij ij) ;
where
p = portfolio standard deviation
i= standard deviation of stock i
j= standard deviation of stock j
Xi= percentage of total portfolio value in stock Xi
Xj= percentage of total portfolio value in stock Xj
rij= correlation coefficient of Xi and Xj Formulas Relating Markowitz Concept<br>
05
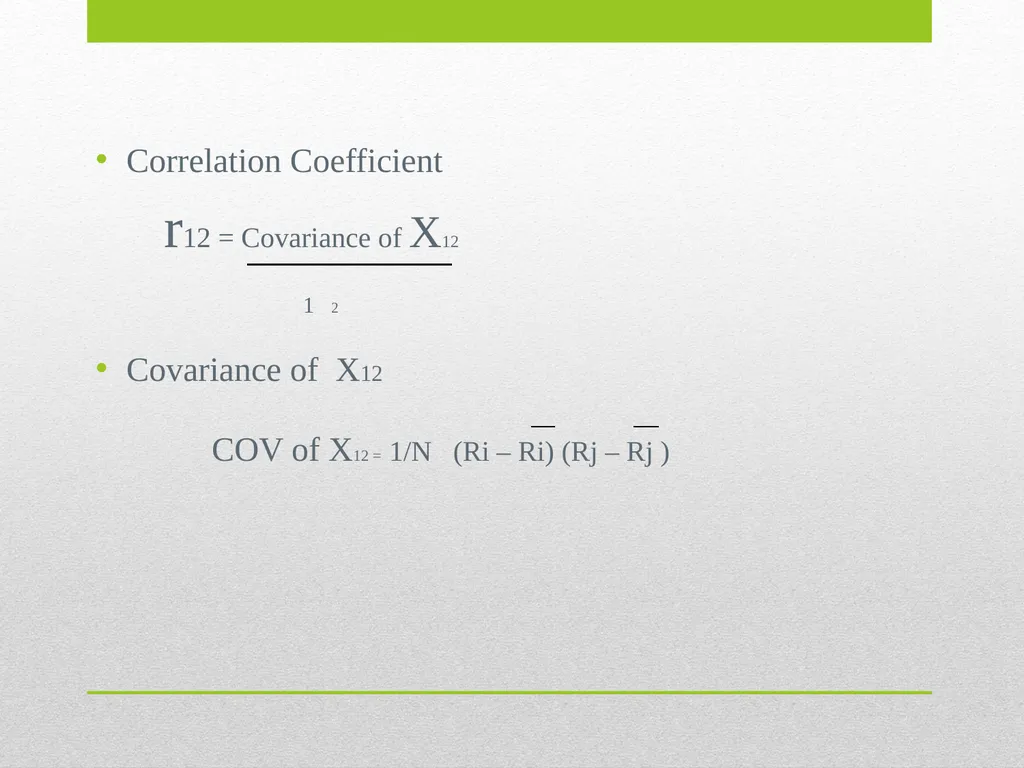
Correlation Coefficient
r12 = Covariance of X12
1 2
Covariance of X12
COV of X12 = 1/N (Ri – Ri) (Rj – Rj )<br>
06
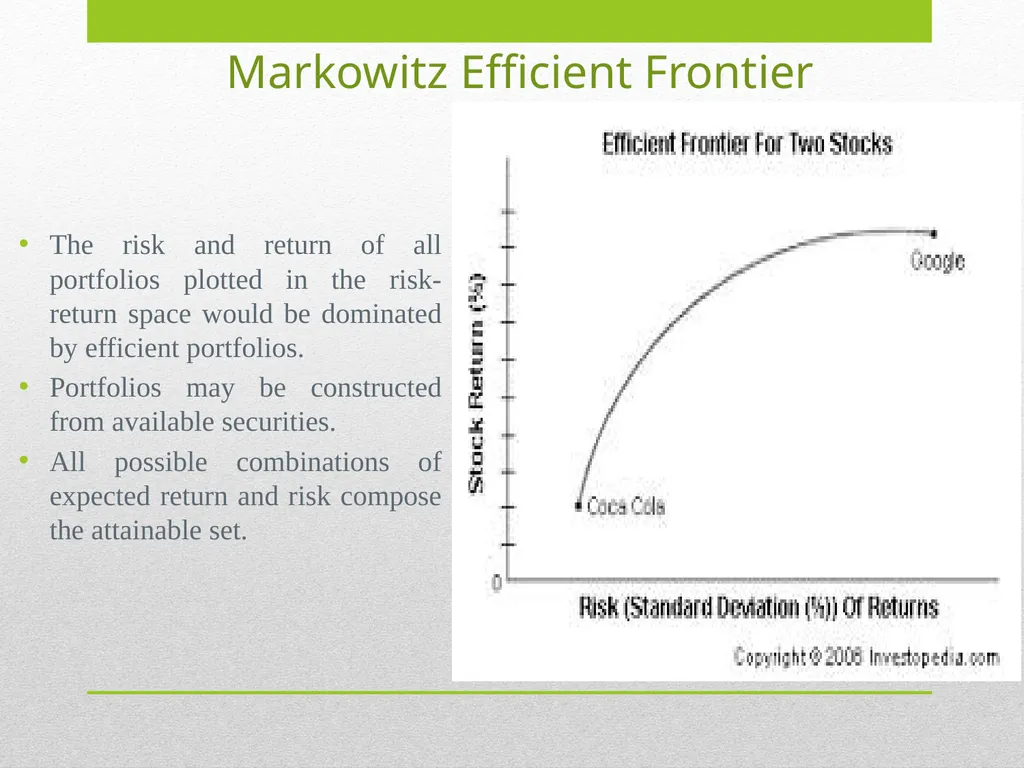
Markowitz Efficient Frontier The risk and return of all portfolios plotted in the risk-return space would be dominated by efficient portfolios.
Portfolios may be constructed from available securities.
All possible combinations of expected return and risk compose the attainable set.<br>
07
Diversification Portfolio risk can be reduced by the simplest kind of diversification.
Diversification reduces the un-systematic risk or unique risk.
It can not reduce systematic risk.
For securities diversification securities are selected at random and no analytical procedure is used.
This type of diversification reduces risk only to a certain extent.<br>
08
Problems regarding diversification . Spreading the investment across too many assets can give problems.
Poor performers
Information inadequacy
High research cost
High transaction costs<br>
09
Drawbacks of Markowitz Model The variance of a portfolio is not a complete measure of the risk taken by the investor.
Number of calculations will be high.<br>
10
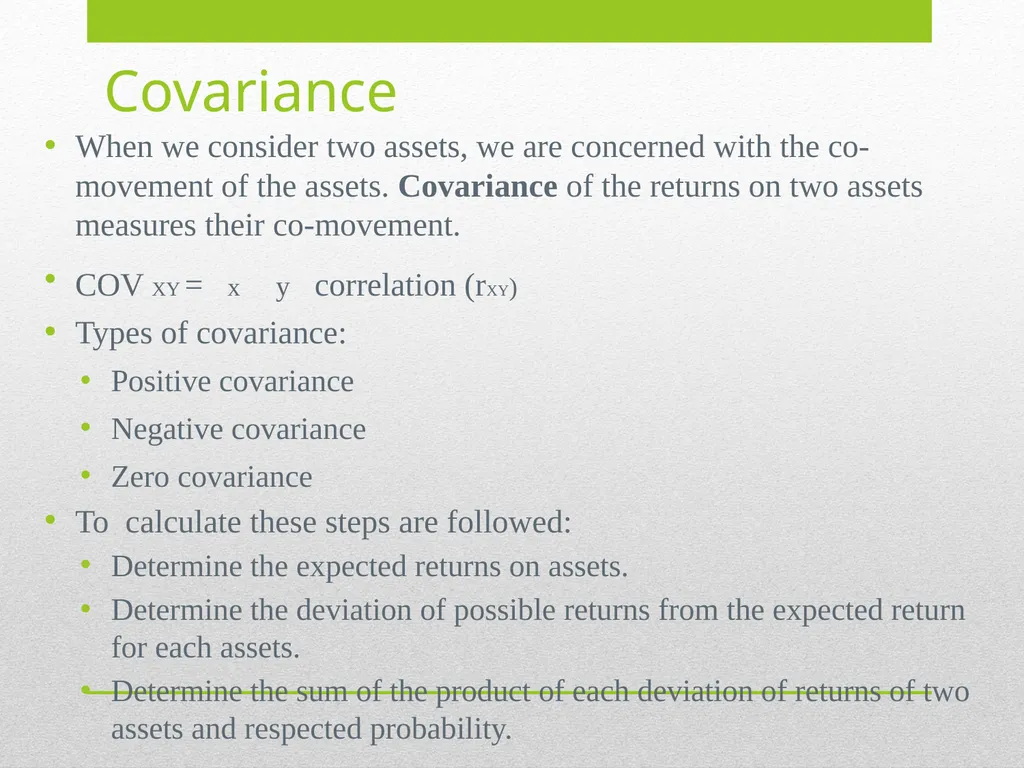
Covariance When we consider two assets, we are concerned with the co-movement of the assets. Covariance of the returns on two assets measures their co-movement.
COV XY = x y correlation (rXY)
Types of covariance:
Positive covariance
Negative covariance
Zero covariance
To calculate these steps are followed:
Determine the expected returns on assets.
Determine the deviation of possible returns from the expected return for each assets.
Determine the sum of the product of each deviation of returns of two assets and respected probability.<br>
11
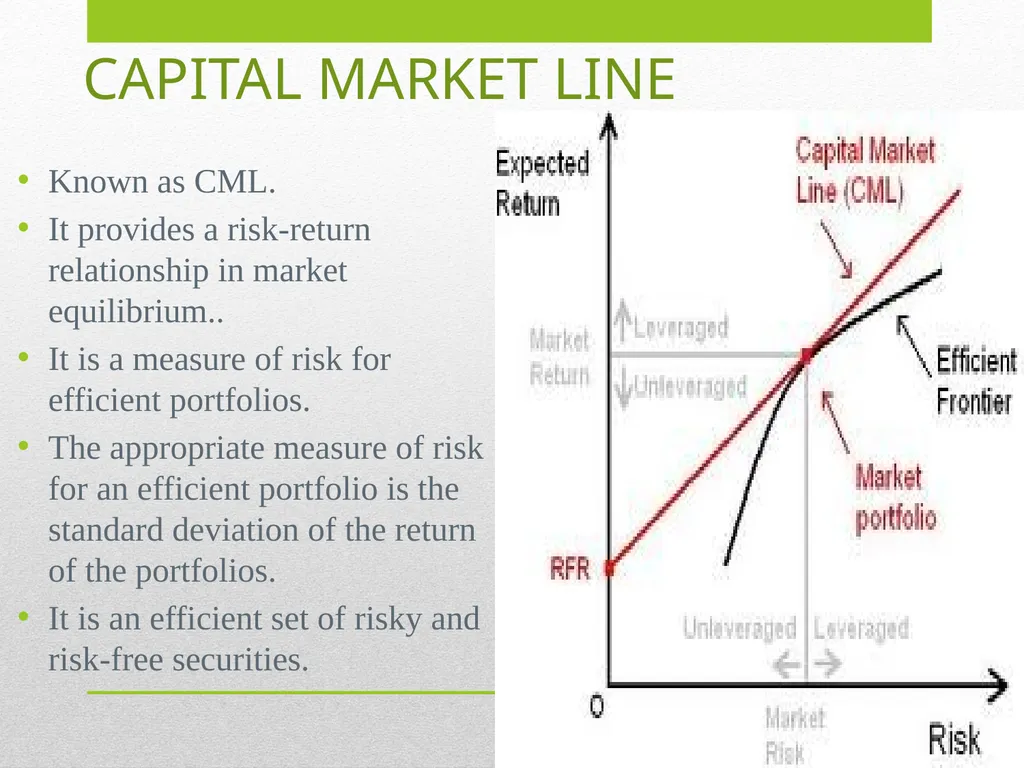
CAPITAL MARKET LINE Known as CML.
It provides a risk-return relationship in market equilibrium..
It is a measure of risk for efficient portfolios.
The appropriate measure of risk for an efficient portfolio is the standard deviation of the return of the portfolios.
It is an efficient set of risky and risk-free securities.<br>
12
Capital Assets Pricing Model Known as CAPM.
Provides a framework to determine the required rate of return on an asset.
Indicates the relationship between return and risk of the assets.
The required rate of return specified by CAPM helps in valuing an asset.
Expected and required rate of return can be compared.
Helps to determine whether the asset is fairly valued.<br>
13
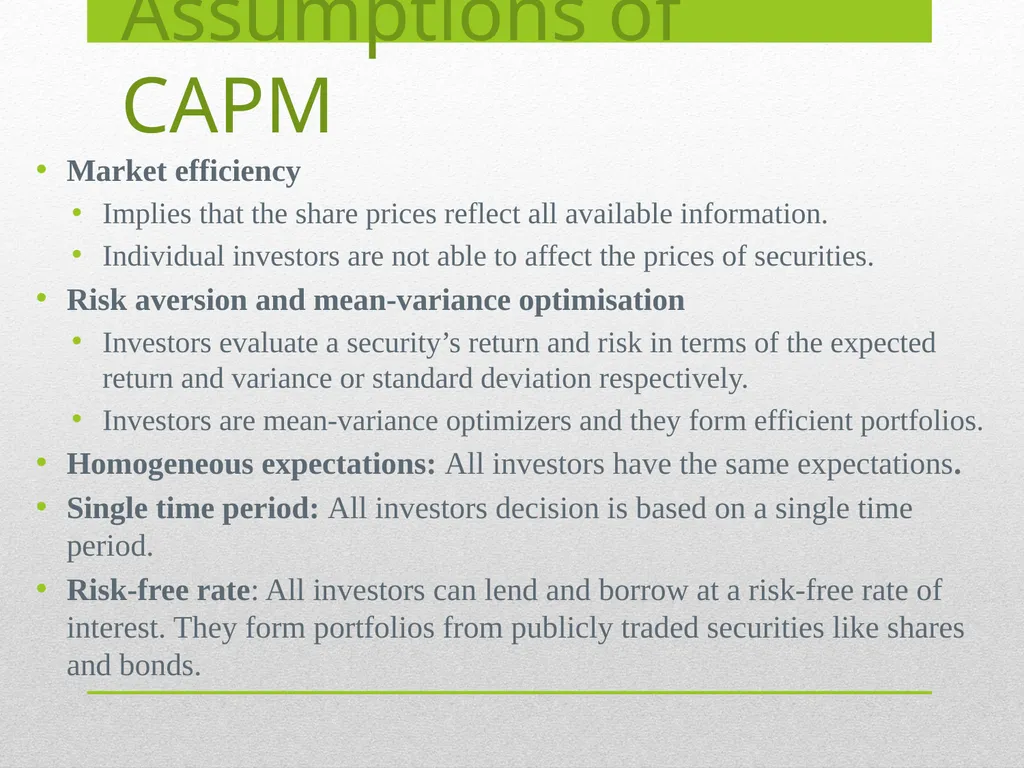
Assumptions of CAPM Market efficiency
Implies that the share prices reflect all available information.
Individual investors are not able to affect the prices of securities.
Risk aversion and mean-variance optimisation
Investors evaluate a security’s return and risk in terms of the expected return and variance or standard deviation respectively.
Investors are mean-variance optimizers and they form efficient portfolios.
Homogeneous expectations: All investors have the same expectations.
Single time period: All investors decision is based on a single time period.
Risk-free rate: All investors can lend and borrow at a risk-free rate of interest. They form portfolios from publicly traded securities like shares and bonds.<br>
14
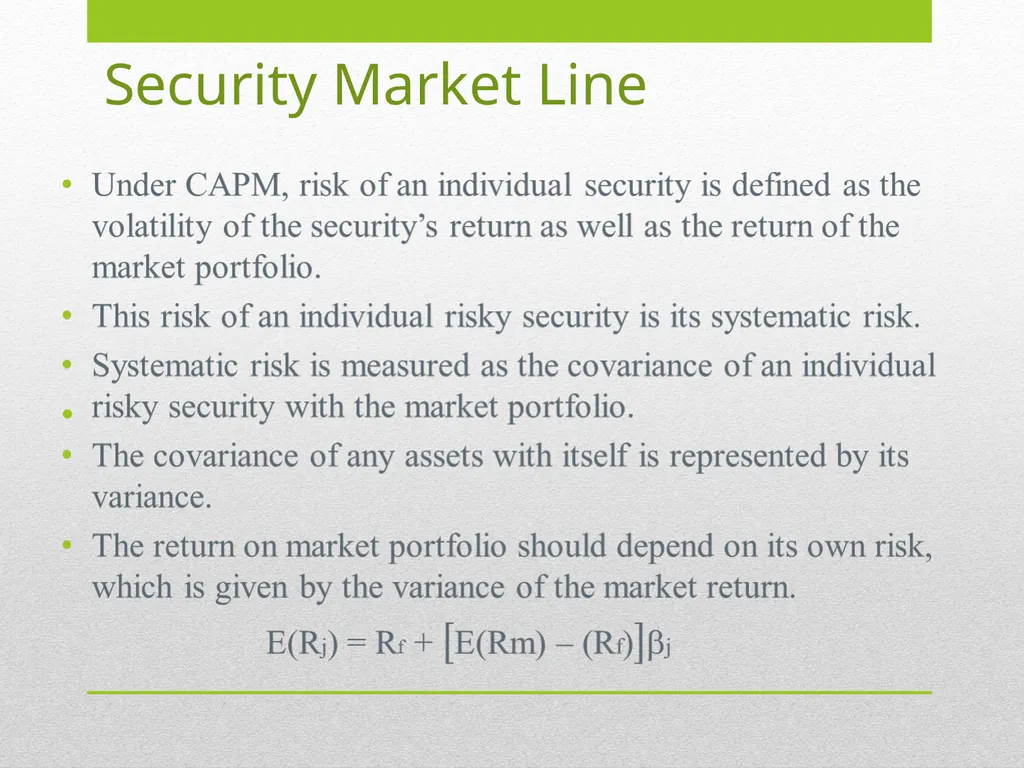
Security Market Line<br>
15
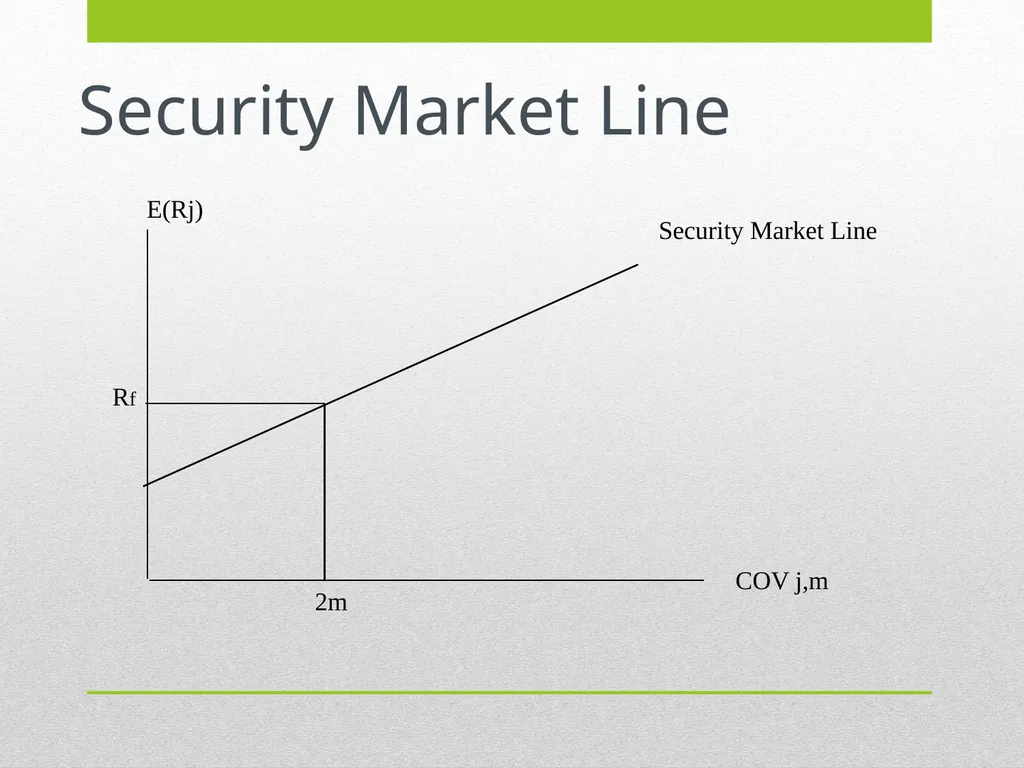
Security Market Line E(Rj) Security Market Line COV j,m 2m Rf<br>
16
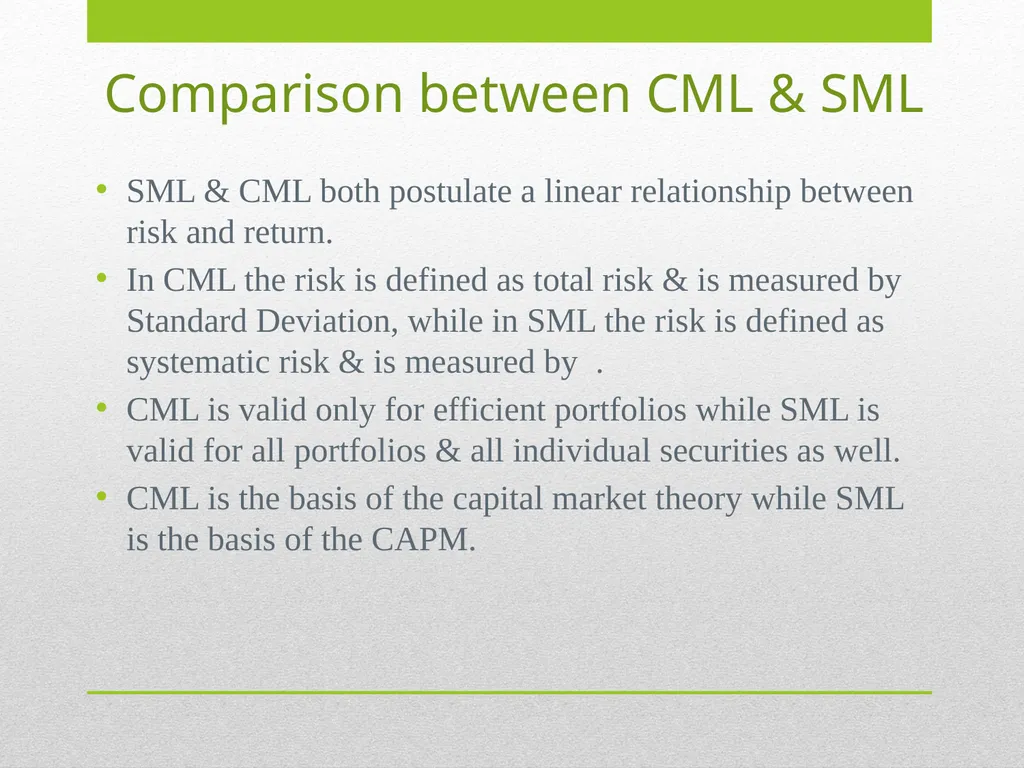
Comparison between CML & SML SML & CML both postulate a linear relationship between risk and return.
In CML the risk is defined as total risk & is measured by Standard Deviation, while in SML the risk is defined as systematic risk & is measured by .
CML is valid only for efficient portfolios while SML is valid for all portfolios & all individual securities as well.
CML is the basis of the capital market theory while SML is the basis of the CAPM.<br>
17
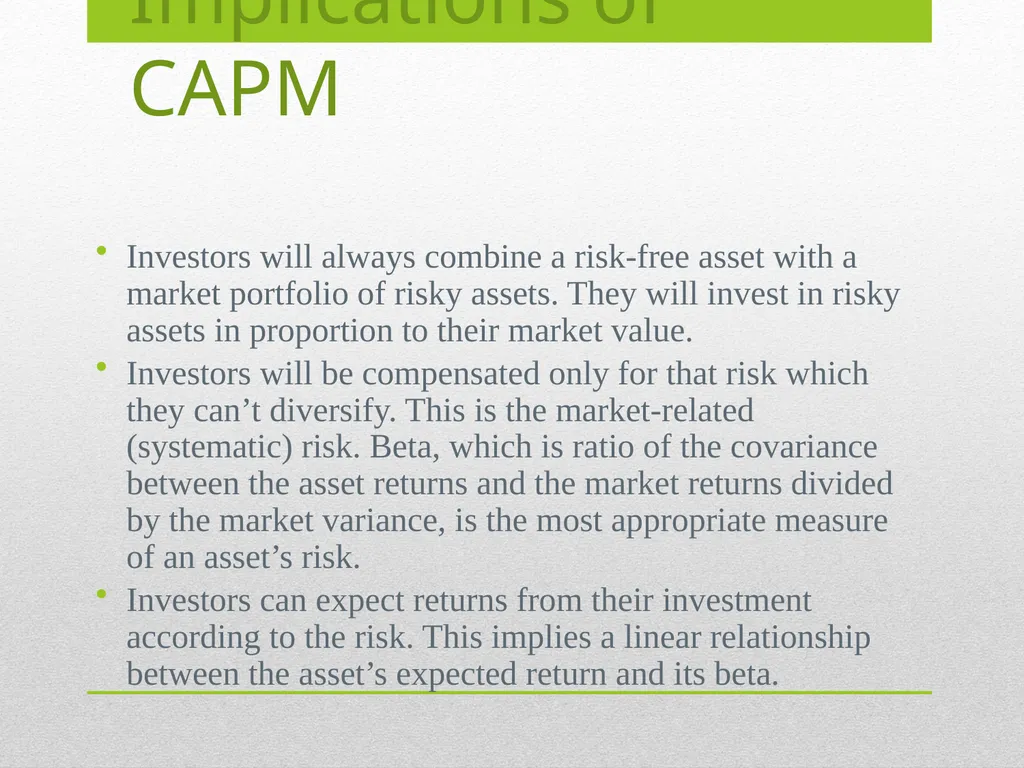
Implications of CAPM Investors will always combine a risk-free asset with a market portfolio of risky assets. They will invest in risky assets in proportion to their market value.
Investors will be compensated only for that risk which they can’t diversify. This is the market-related (systematic) risk. Beta, which is ratio of the covariance between the asset returns and the market returns divided by the market variance, is the most appropriate measure of an asset’s risk.
Investors can expect returns from their investment according to the risk. This implies a linear relationship between the asset’s expected return and its beta.<br>
18
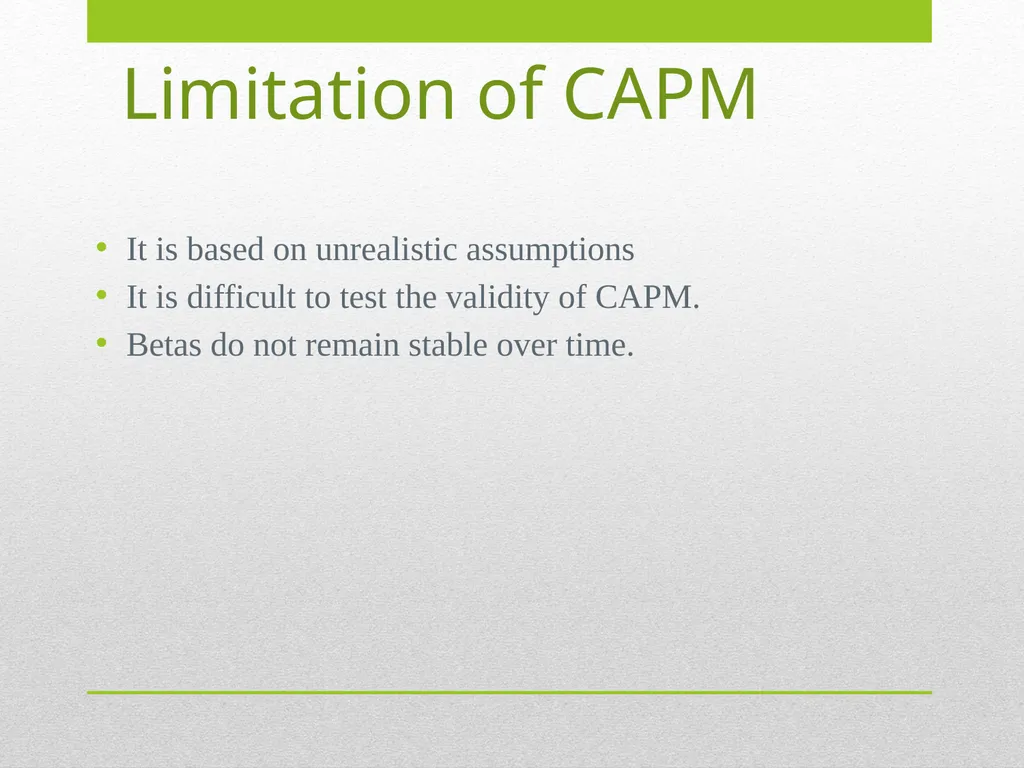
Limitation of CAPM It is based on unrealistic assumptions
It is difficult to test the validity of CAPM.
Betas do not remain stable over time.<br>