
Measuring Historical Financial Performance Let’s

Description: Measuring Historical Financial Performance Lets Start With Understanding the Financial System! The Funds Flow System Essentially a Financial System is Interrelated so Most Financial and Technical Indicators also Relate to Each Other
Related Topics
Download Presentation
"Measuring Historical Financial Performance Let’s" is the property of its rightful owner. Permission is granted to download and print the materials on this website for personal, non-commercial use only, and to display it on your personal computer provided you do not modify the materials and that you retain all copyright notices contained in the materials. By downloading content from our website, you accept the terms of this agreement.
Presentation Transcript
slide1. Measuring Historical Financial
Performance<br>
slide2. Let’s Start With Understanding the Financial System!<br>
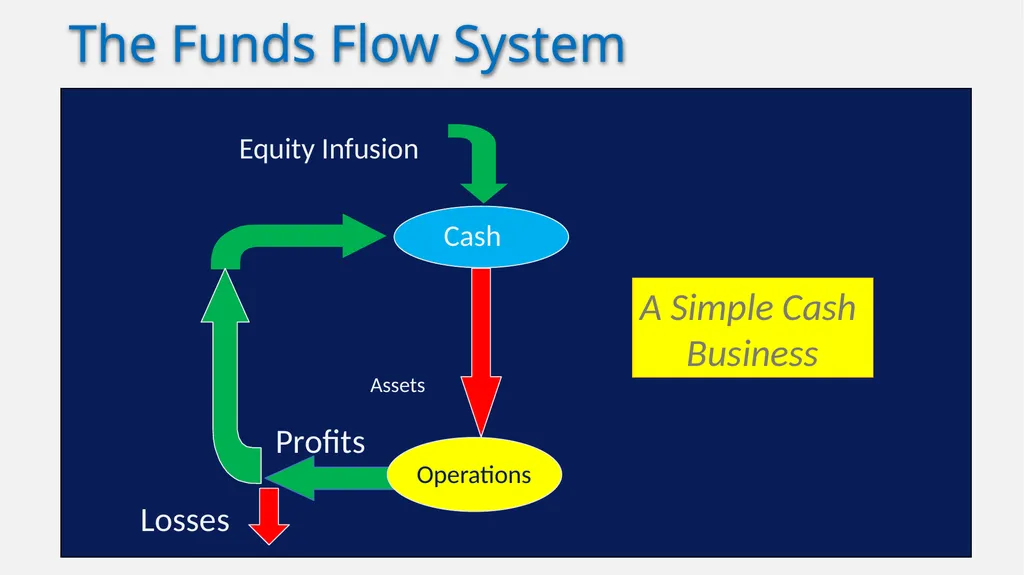
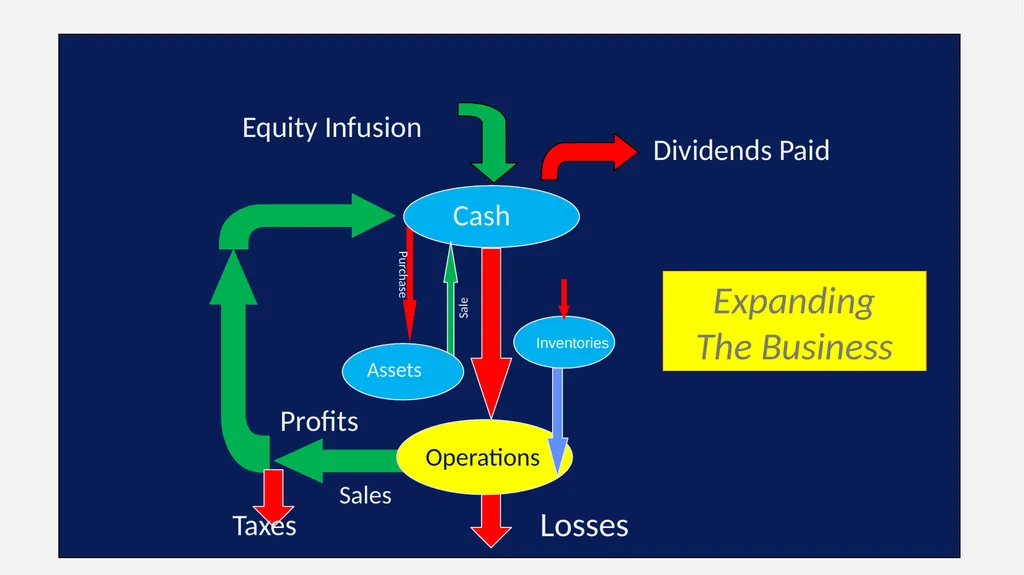
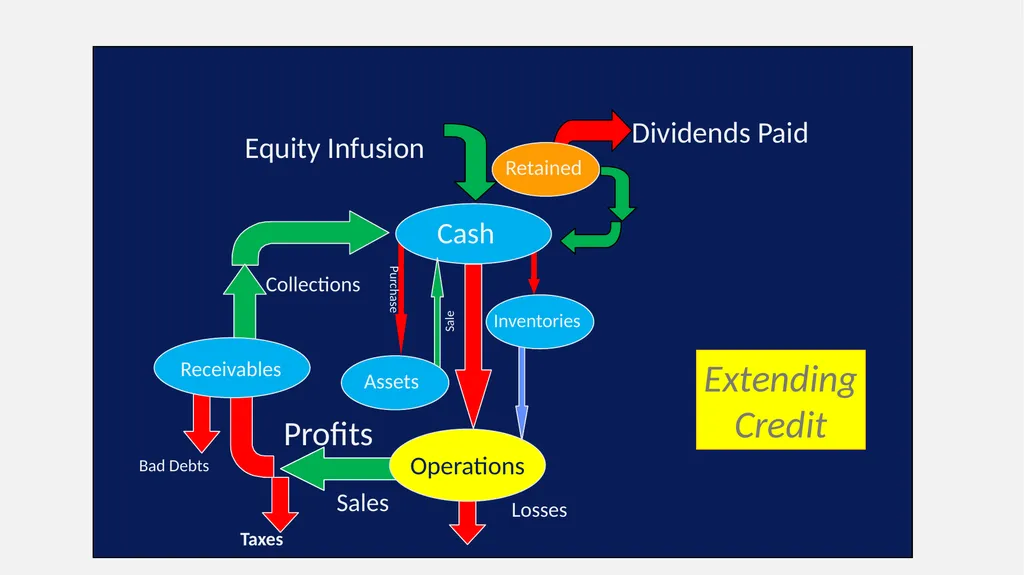
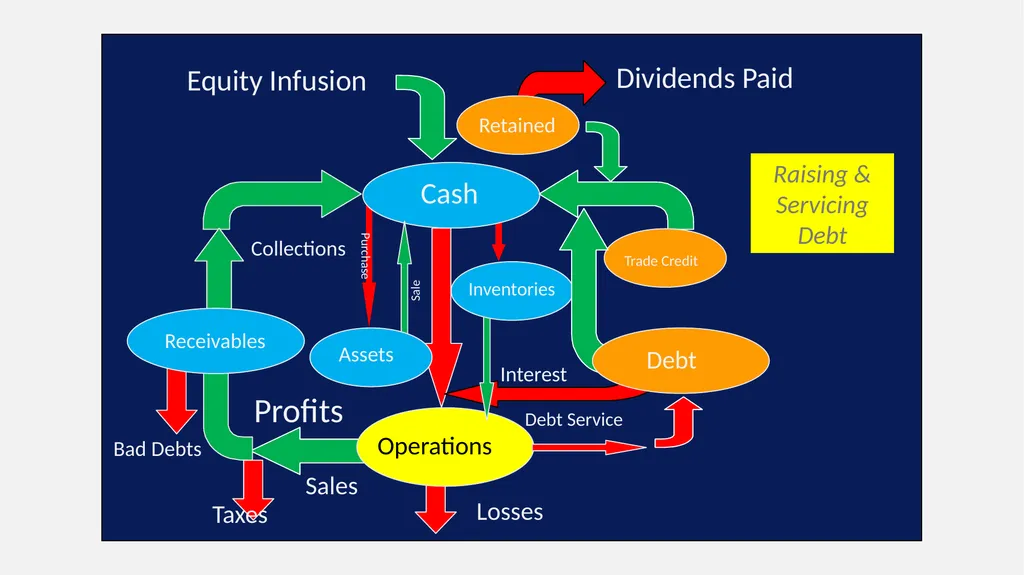
slide3. The Funds Flow System<br>
slide7. Essentially a Financial System is Interrelated so Most Financial and Technical Indicators also Relate to Each Other<br>
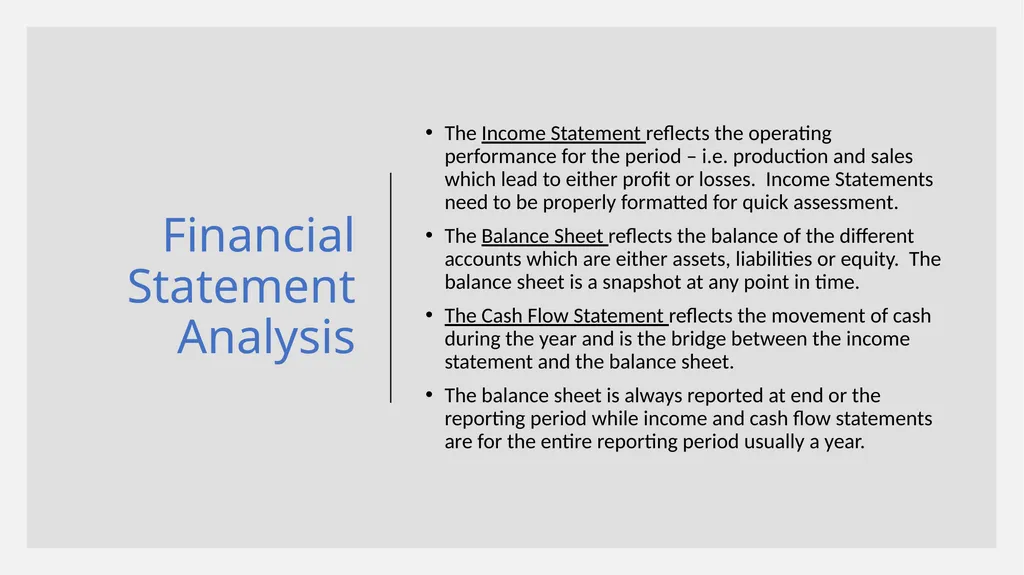
slide8. Financial Statement Analysis The Income Statement reflects the operating performance for the period – i.e. production and sales which lead to either profit or losses. Income Statements need to be properly formatted for quick assessment.
The Balance Sheet reflects the balance of the different accounts which are either assets, liabilities or equity. The balance sheet is a snapshot at any point in time.
The Cash Flow Statement reflects the movement of cash during the year and is the bridge between the income statement and the balance sheet.
The balance sheet is always reported at end or the reporting period while income and cash flow statements are for the entire reporting period usually a year.<br>
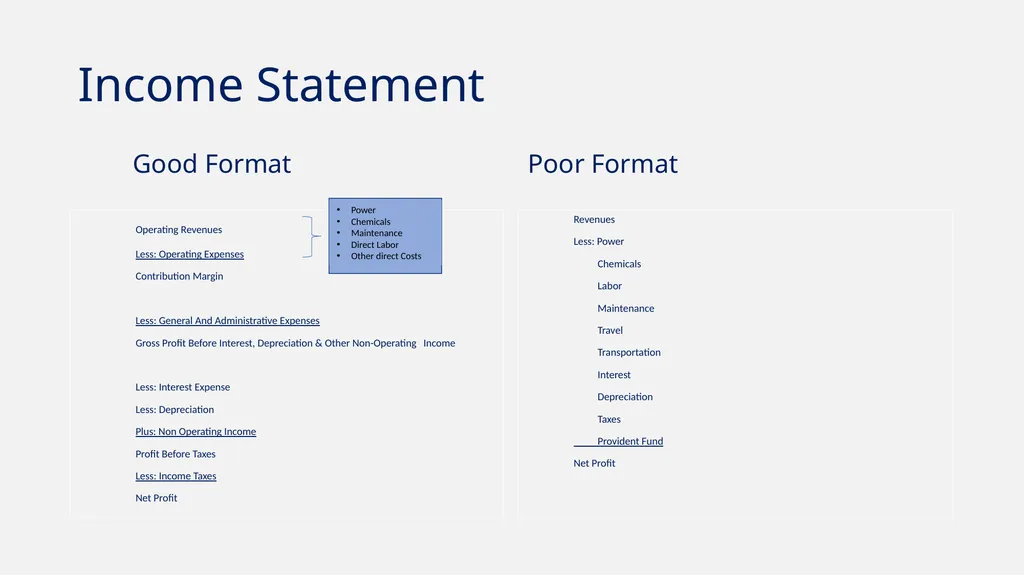
slide9. Income Statement Good Format Operating Revenues
Less: Operating Expenses
Contribution Margin
Less: General And Administrative Expenses
Gross Profit Before Interest, Depreciation & Other Non-Operating Income
Less: Interest Expense
Less: Depreciation
Plus: Non Operating Income
Profit Before Taxes
Less: Income Taxes
Net Profit Poor Format Revenues
Less: Power
Chemicals
Labor
Maintenance
Travel
Transportation
Interest
Depreciation
Taxes
Provident Fund
Net Profit Power
Chemicals
Maintenance
Direct Labor
Other direct Costs<br>
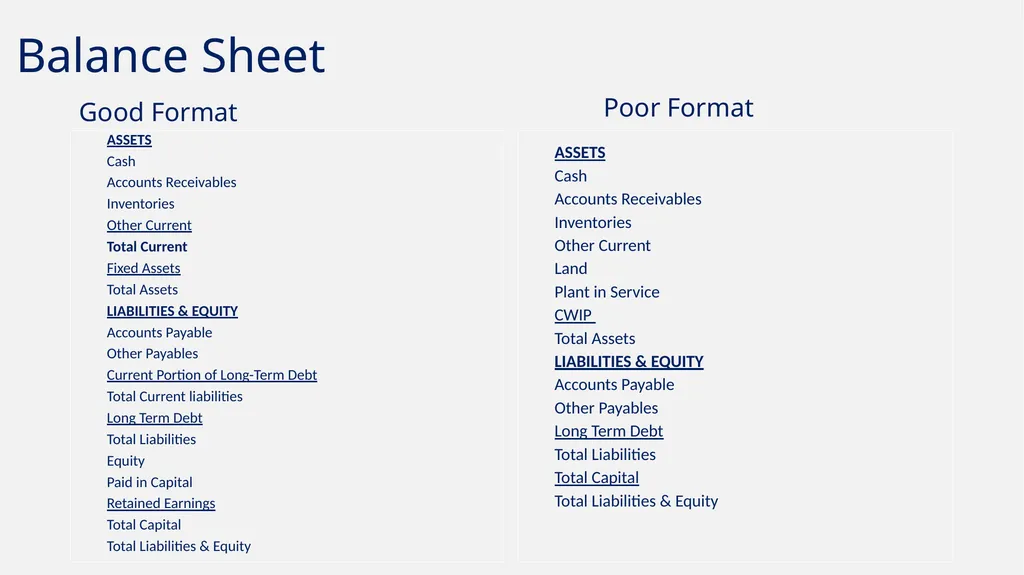
slide10. Balance Sheet Good Format ASSETS
Cash
Accounts Receivables
Inventories
Other Current
Total Current
Fixed Assets
Total Assets
LIABILITIES & EQUITY
Accounts Payable
Other Payables
Current Portion of Long-Term Debt
Total Current liabilities
Long Term Debt
Total Liabilities
Equity
Paid in Capital
Retained Earnings
Total Capital
Total Liabilities & Equity Poor Format ASSETS
Cash
Accounts Receivables
Inventories
Other Current
Land
Plant in Service
CWIP
Total Assets
LIABILITIES & EQUITY
Accounts Payable
Other Payables
Long Term Debt
Total Liabilities
Total Capital
Total Liabilities & Equity<br>
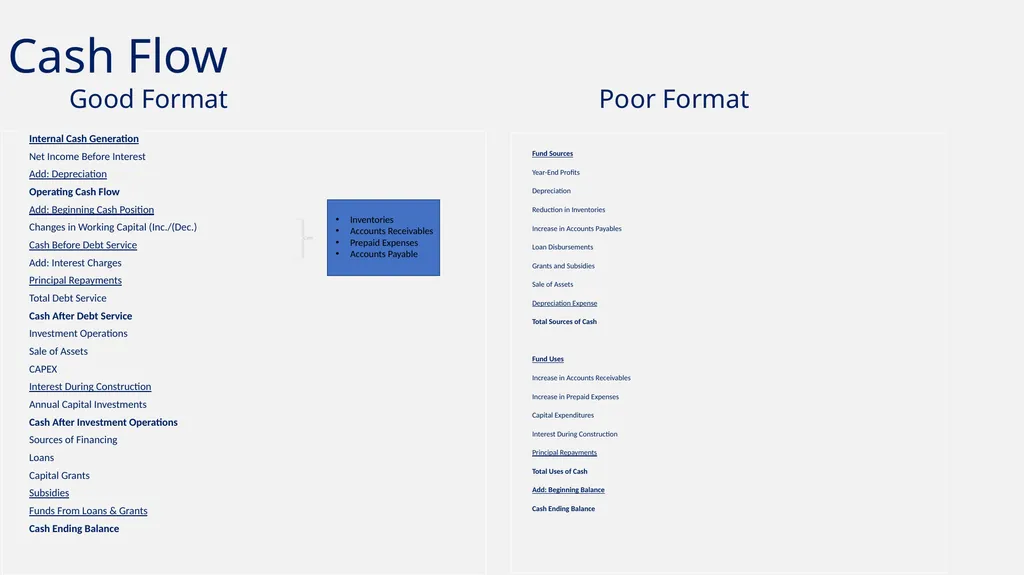
slide11. Cash Flow Good Format Internal Cash Generation
Net Income Before Interest
Add: Depreciation
Operating Cash Flow
Add: Beginning Cash Position
Changes in Working Capital (Inc./(Dec.)
Cash Before Debt Service
Add: Interest Charges
Principal Repayments
Total Debt Service
Cash After Debt Service
Investment Operations
Sale of Assets
CAPEX
Interest During Construction
Annual Capital Investments
Cash After Investment Operations
Sources of Financing
Loans
Capital Grants
Subsidies
Funds From Loans & Grants
Cash Ending Balance Poor Format Fund Sources
Year-End Profits
Depreciation
Reduction in Inventories
Increase in Accounts Payables
Loan Disbursements
Grants and Subsidies
Sale of Assets
Depreciation Expense
Total Sources of Cash
Fund Uses
Increase in Accounts Receivables
Increase in Prepaid Expenses
Capital Expenditures
Interest During Construction
Principal Repayments
Total Uses of Cash
Add: Beginning Balance
Cash Ending Balance Inventories
Accounts Receivables
Prepaid Expenses
Accounts Payable<br>
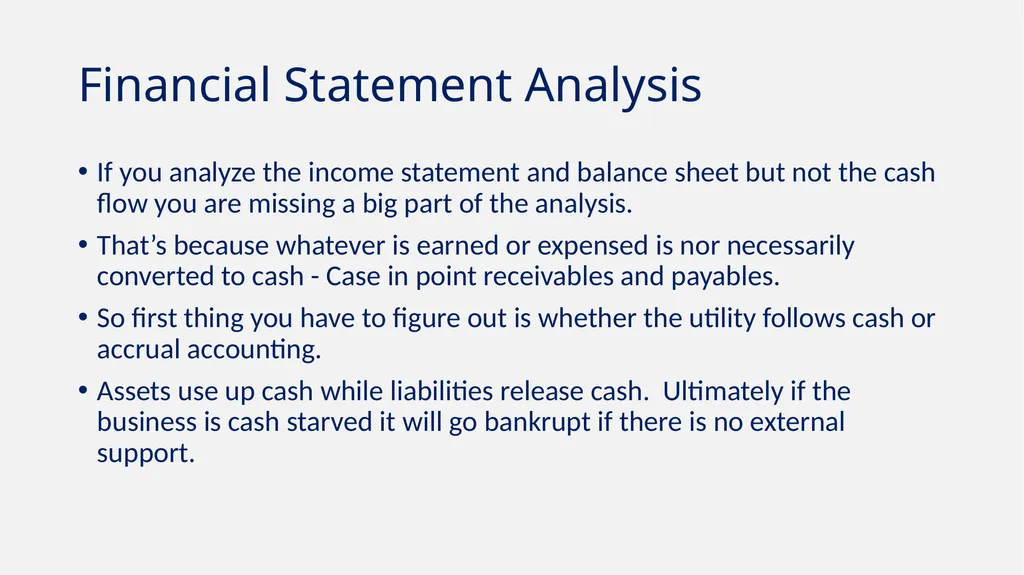
slide12. Financial Statement Analysis If you analyze the income statement and balance sheet but not the cash flow you are missing a big part of the analysis.
That’s because whatever is earned or expensed is nor necessarily converted to cash - Case in point receivables and payables.
So first thing you have to figure out is whether the utility follows cash or accrual accounting.
Assets use up cash while liabilities release cash. Ultimately if the business is cash starved it will go bankrupt if there is no external support.<br>
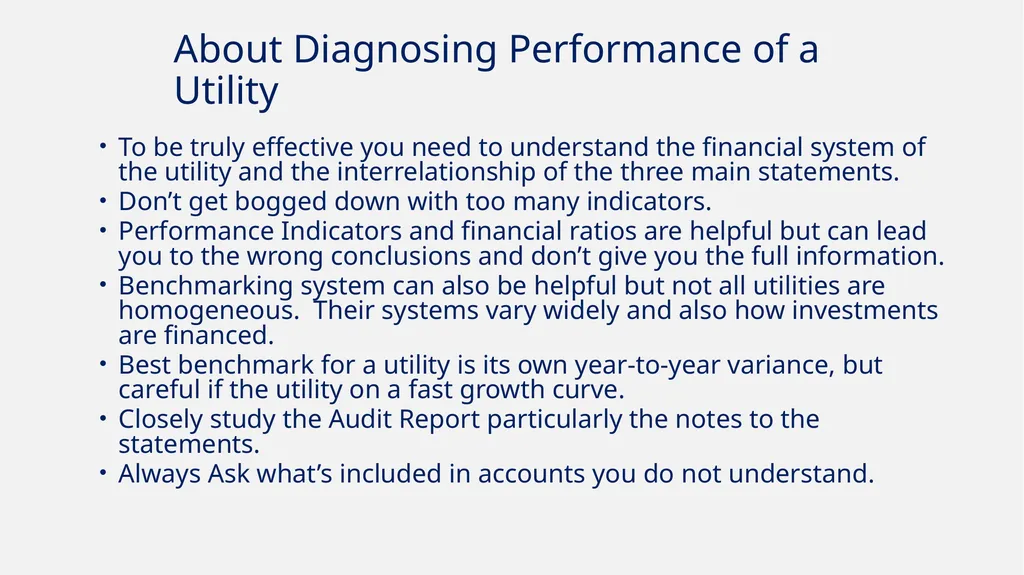
slide13. To be truly effective you need to understand the financial system of the utility and the interrelationship of the three main statements.
Don’t get bogged down with too many indicators.
Performance Indicators and financial ratios are helpful but can lead you to the wrong conclusions and don’t give you the full information.
Benchmarking system can also be helpful but not all utilities are homogeneous. Their systems vary widely and also how investments are financed.
Best benchmark for a utility is its own year-to-year variance, but careful if the utility on a fast growth curve.
Closely study the Audit Report particularly the notes to the statements.
Always Ask what’s included in accounts you do not understand. About Diagnosing Performance of a Utility<br>
slide14. A Good Diagnostic is Not Just about Finance!<br>
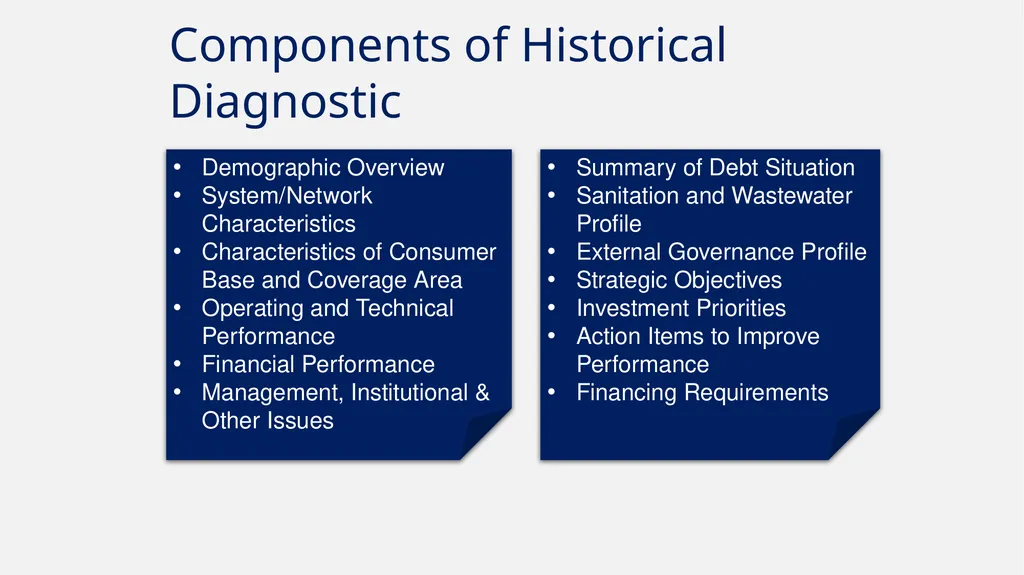
slide15. Components of Historical Diagnostic Demographic Overview
System/Network Characteristics
Characteristics of Consumer Base and Coverage Area
Operating and Technical Performance
Financial Performance
Management, Institutional & Other Issues Summary of Debt Situation
Sanitation and Wastewater Profile
External Governance Profile
Strategic Objectives
Investment Priorities
Action Items to Improve Performance
Financing Requirements<br>
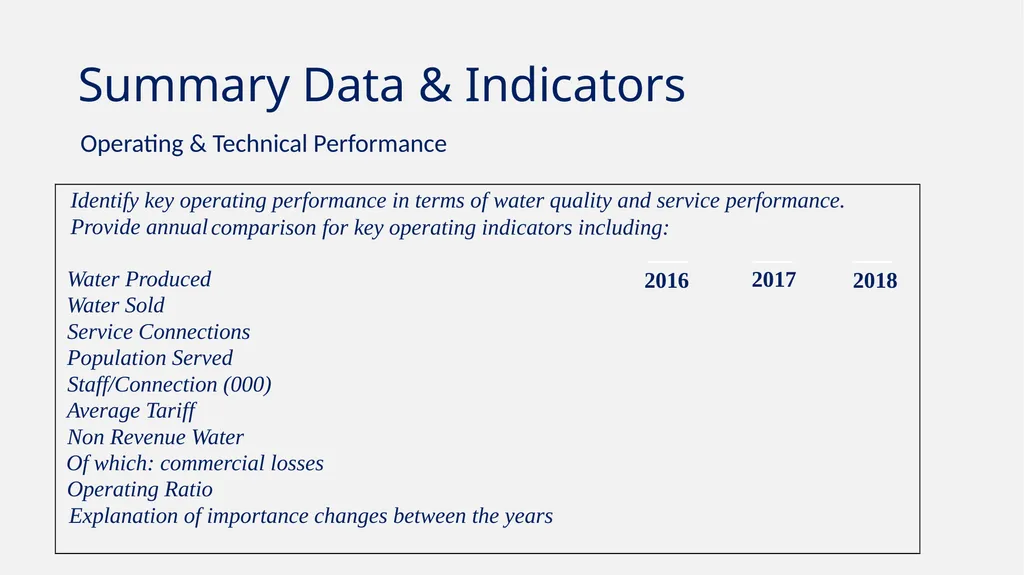
slide16. Summary Data & Indicators Operating & Technical Performance<br>
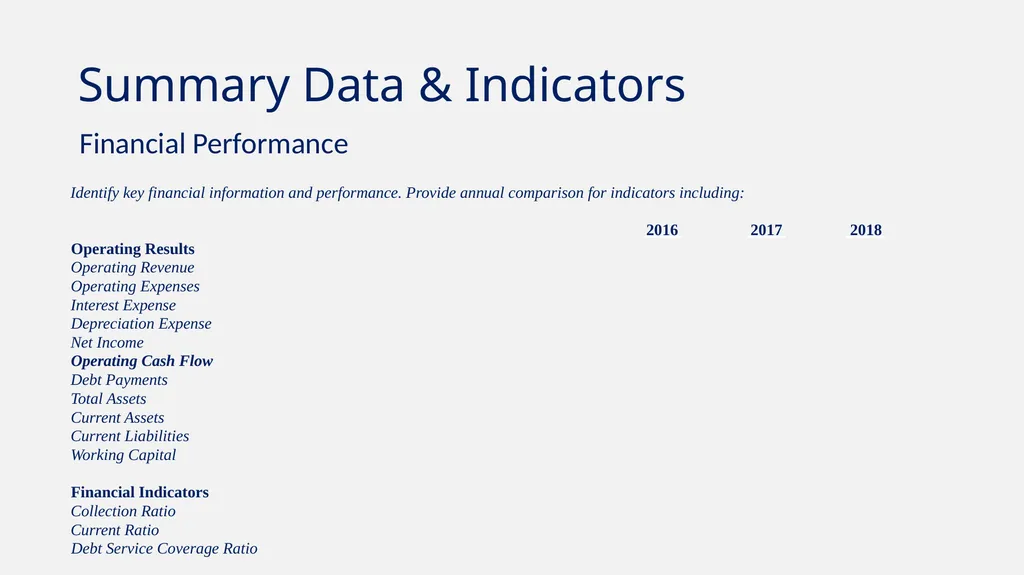
slide17. Summary Data & Indicators Financial Performance<br>
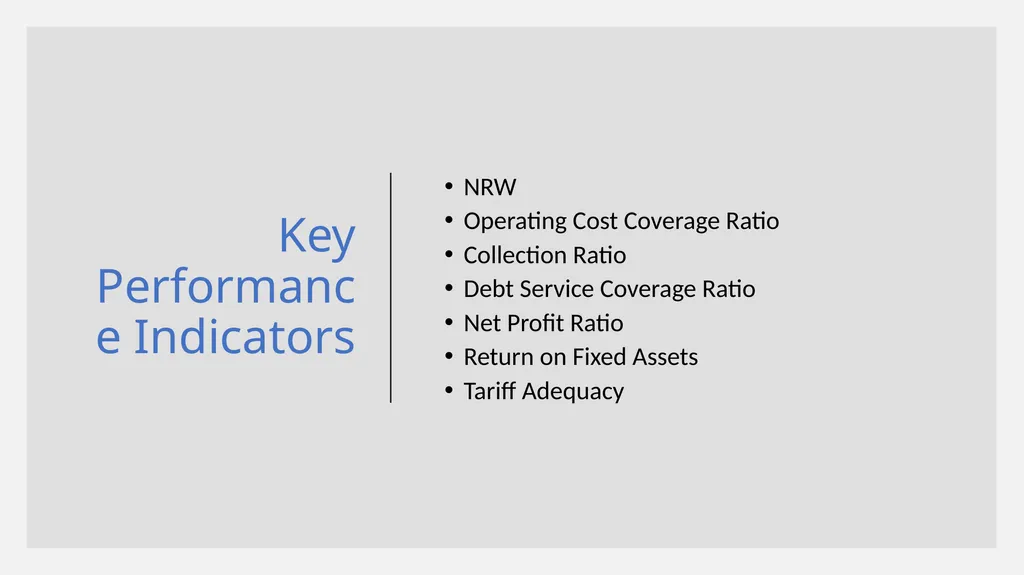
slide18. Key Performance Indicators NRW
Operating Cost Coverage Ratio
Collection Ratio
Debt Service Coverage Ratio
Net Profit Ratio
Return on Fixed Assets
Tariff Adequacy<br>
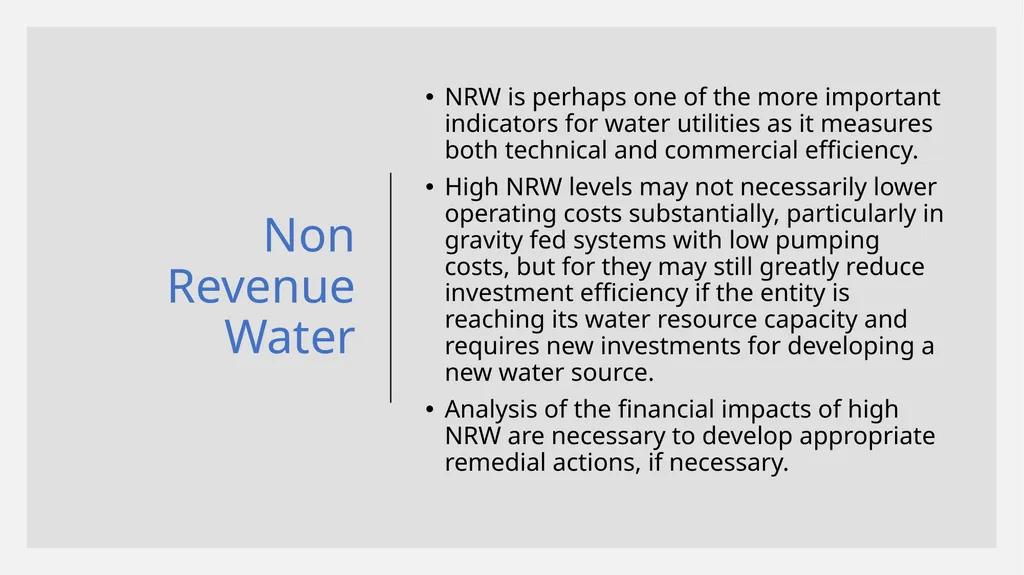
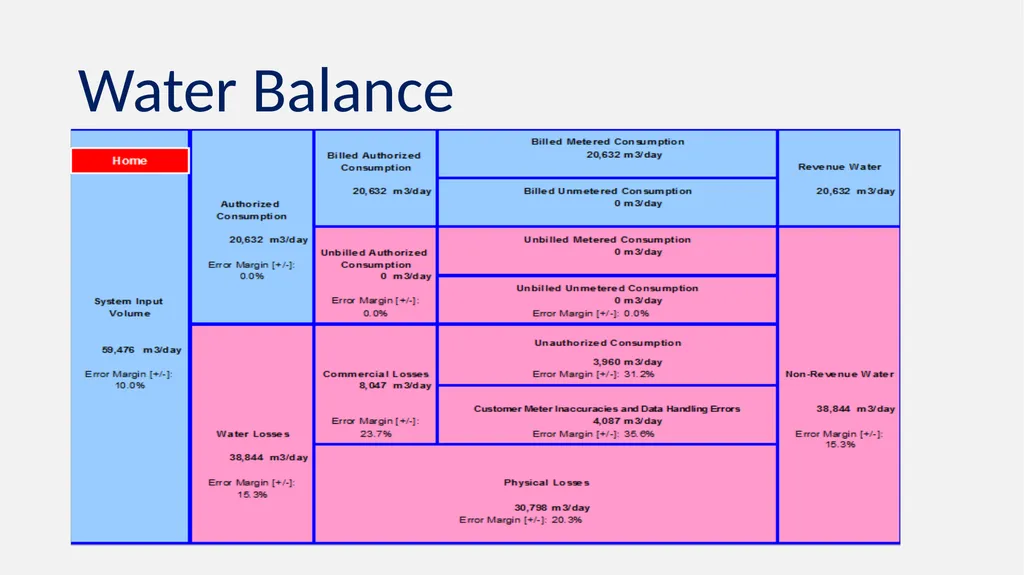
slide19. Non Revenue Water NRW is perhaps one of the more important indicators for water utilities as it measures both technical and commercial efficiency.
High NRW levels may not necessarily lower operating costs substantially, particularly in gravity fed systems with low pumping costs, but for they may still greatly reduce investment efficiency if the entity is reaching its water resource capacity and requires new investments for developing a new water source.
Analysis of the financial impacts of high NRW are necessary to develop appropriate remedial actions, if necessary.<br>
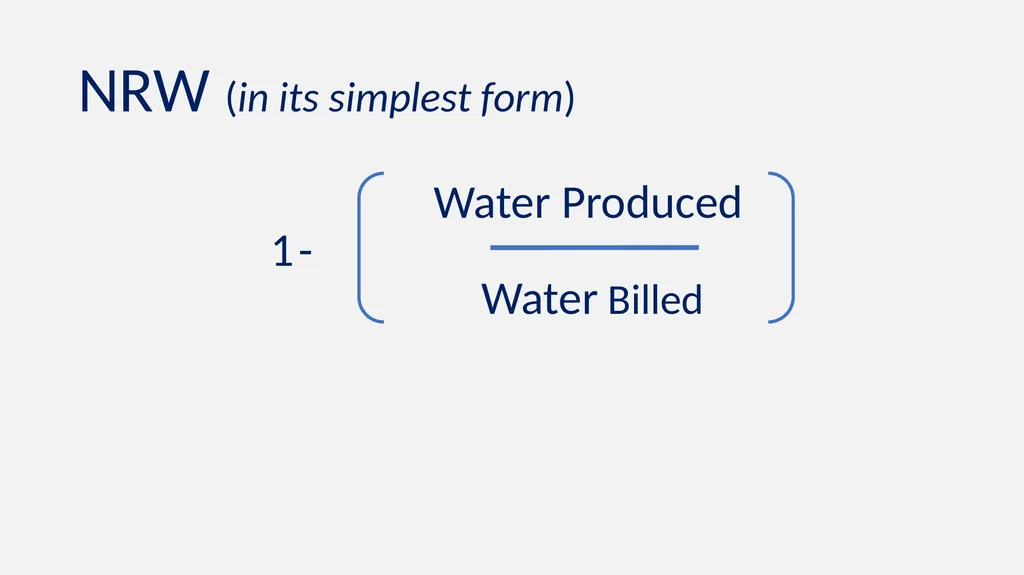
slide20. NRW (in its simplest form) Water Produced Water Billed 1 -<br>
slide21. Water Balance<br>
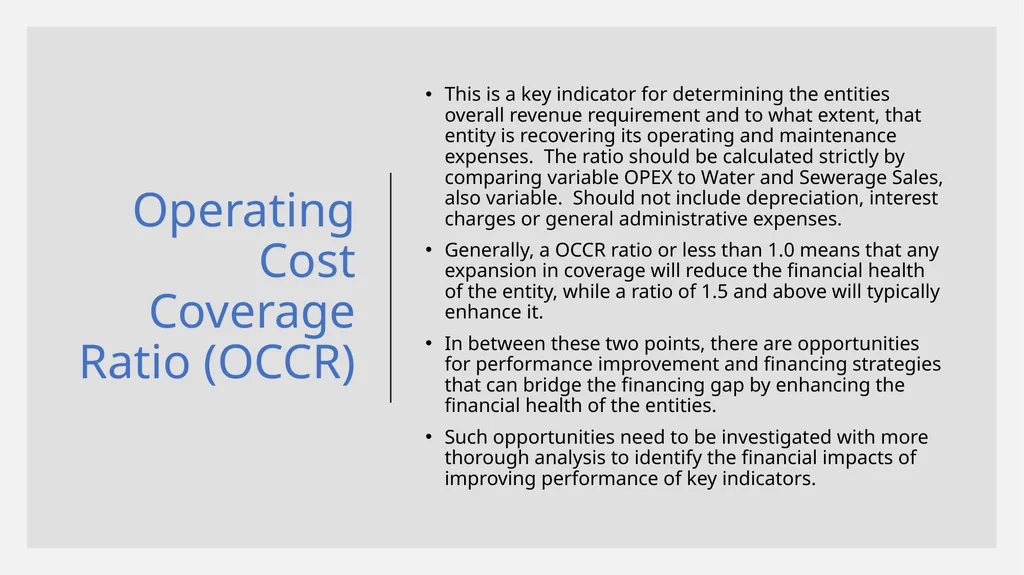
slide22. Operating Cost Coverage Ratio (OCCR) This is a key indicator for determining the entities overall revenue requirement and to what extent, that entity is recovering its operating and maintenance expenses. The ratio should be calculated strictly by comparing variable OPEX to Water and Sewerage Sales, also variable. Should not include depreciation, interest charges or general administrative expenses.
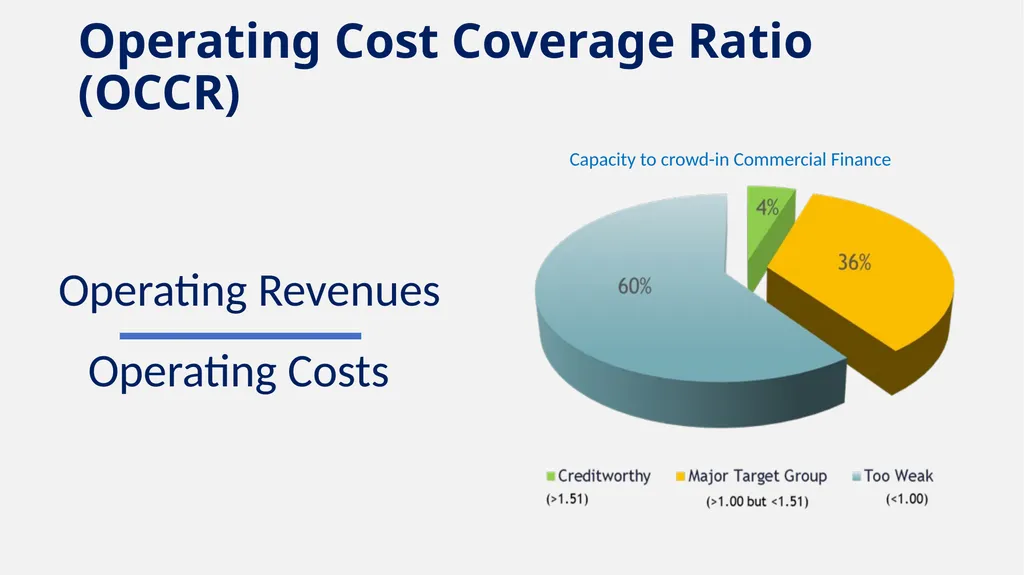
Generally, a OCCR ratio or less than 1.0 means that any expansion in coverage will reduce the financial health of the entity, while a ratio of 1.5 and above will typically enhance it.
In between these two points, there are opportunities for performance improvement and financing strategies that can bridge the financing gap by enhancing the financial health of the entities.
Such opportunities need to be investigated with more thorough analysis to identify the financial impacts of improving performance of key indicators.<br>
slide23. Operating Cost Coverage Ratio (OCCR) Operating Costs Operating Revenues Capacity to crowd-in Commercial Finance<br>
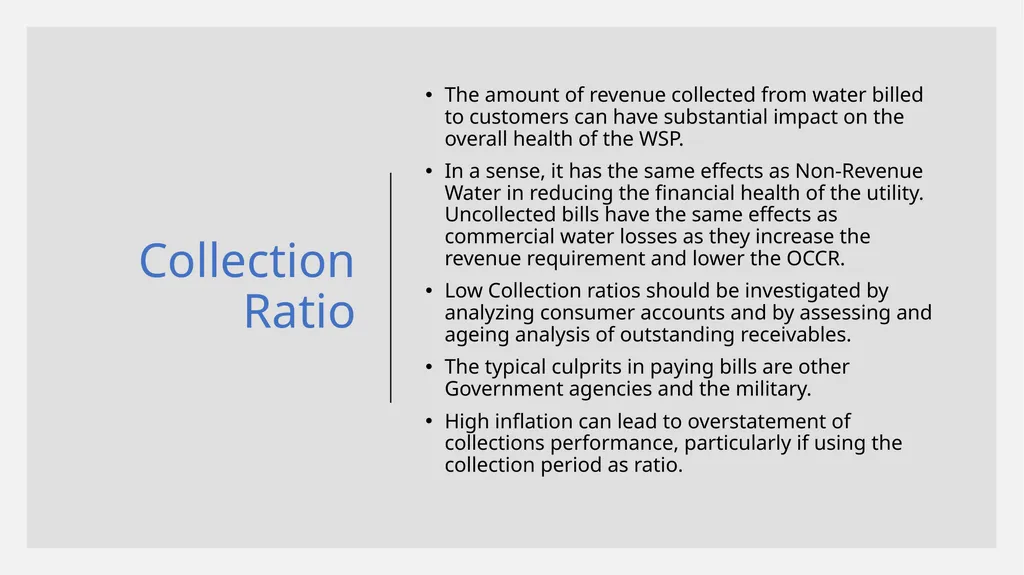
slide24. Collection Ratio The amount of revenue collected from water billed to customers can have substantial impact on the overall health of the WSP.
In a sense, it has the same effects as Non-Revenue Water in reducing the financial health of the utility. Uncollected bills have the same effects as commercial water losses as they increase the revenue requirement and lower the OCCR.
Low Collection ratios should be investigated by analyzing consumer accounts and by assessing and ageing analysis of outstanding receivables.
The typical culprits in paying bills are other Government agencies and the military.
High inflation can lead to overstatement of collections performance, particularly if using the collection period as ratio.<br>
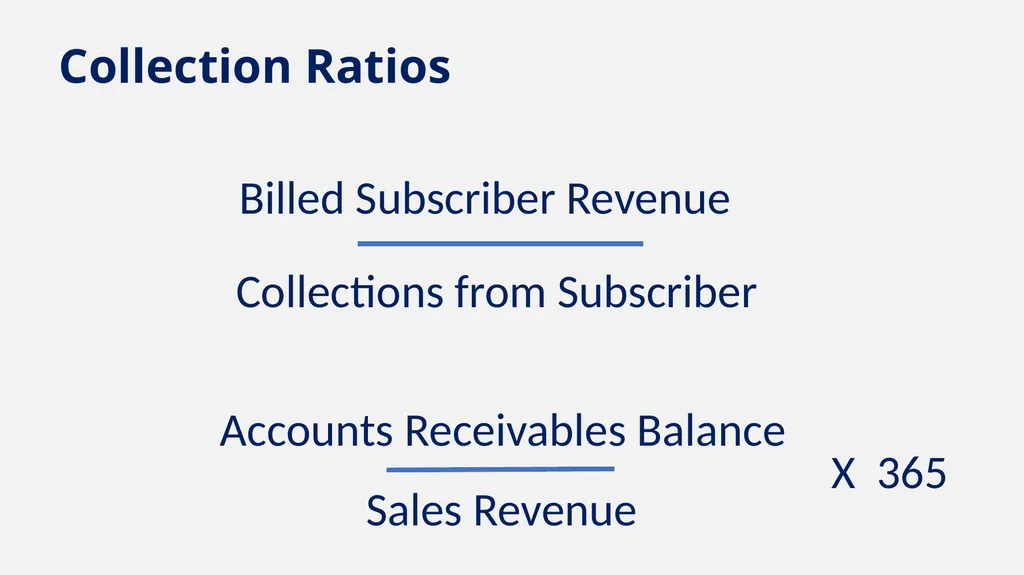
slide25. Collection Ratios Accounts Receivables Balance Sales Revenue X 365<br>
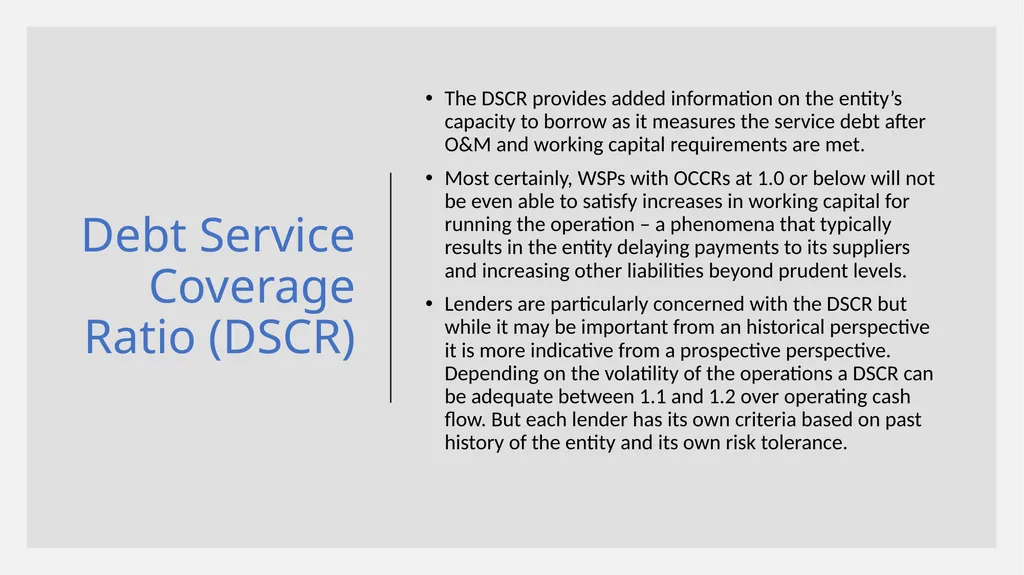
slide26. Debt Service Coverage Ratio (DSCR) The DSCR provides added information on the entity’s capacity to borrow as it measures the service debt after O&M and working capital requirements are met.
Most certainly, WSPs with OCCRs at 1.0 or below will not be even able to satisfy increases in working capital for running the operation – a phenomena that typically results in the entity delaying payments to its suppliers and increasing other liabilities beyond prudent levels.
Lenders are particularly concerned with the DSCR but while it may be important from an historical perspective it is more indicative from a prospective perspective. Depending on the volatility of the operations a DSCR can be adequate between 1.1 and 1.2 over operating cash flow. But each lender has its own criteria based on past history of the entity and its own risk tolerance.<br>
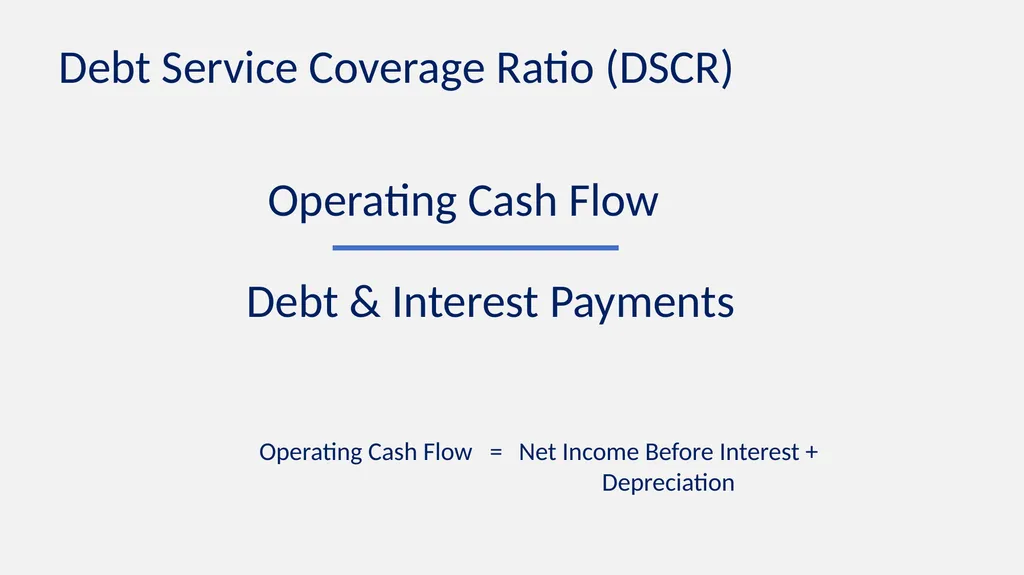
slide27. Debt Service Coverage Ratio (DSCR)<br>
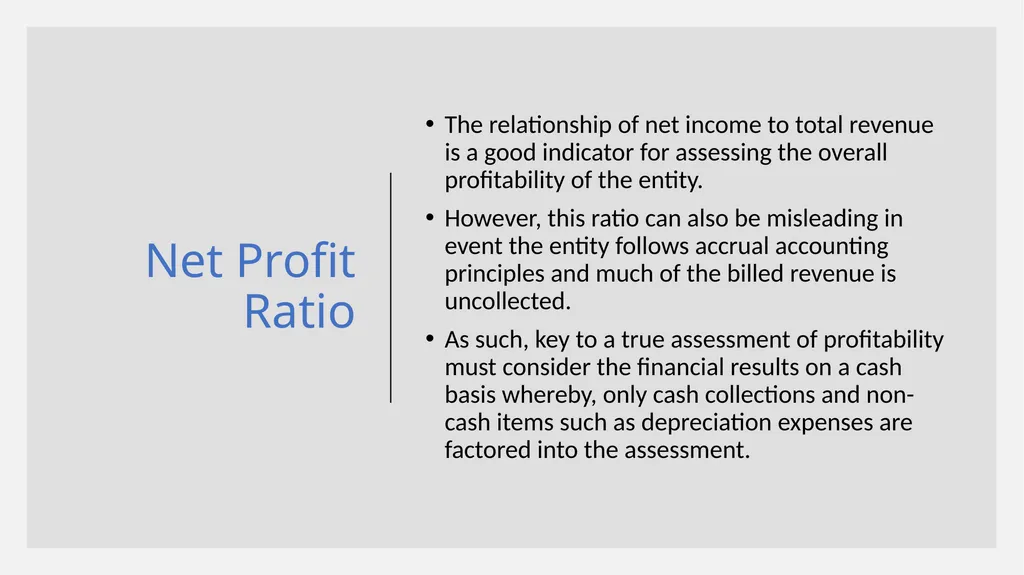
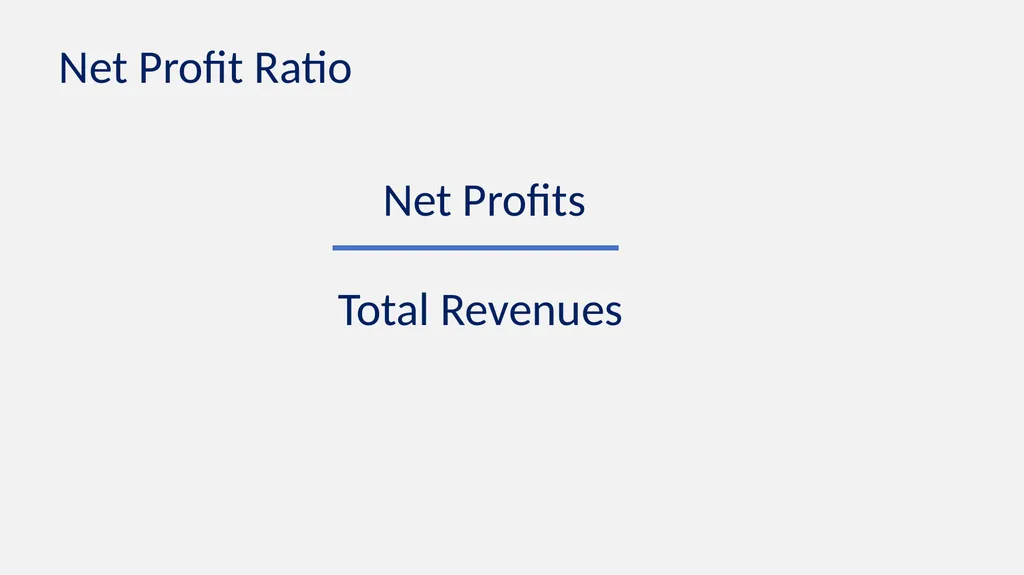
slide28. Net Profit Ratio The relationship of net income to total revenue is a good indicator for assessing the overall profitability of the entity.
However, this ratio can also be misleading in event the entity follows accrual accounting principles and much of the billed revenue is uncollected.
As such, key to a true assessment of profitability must consider the financial results on a cash basis whereby, only cash collections and non-cash items such as depreciation expenses are factored into the assessment.<br>
slide29. Net Profit Ratio<br>
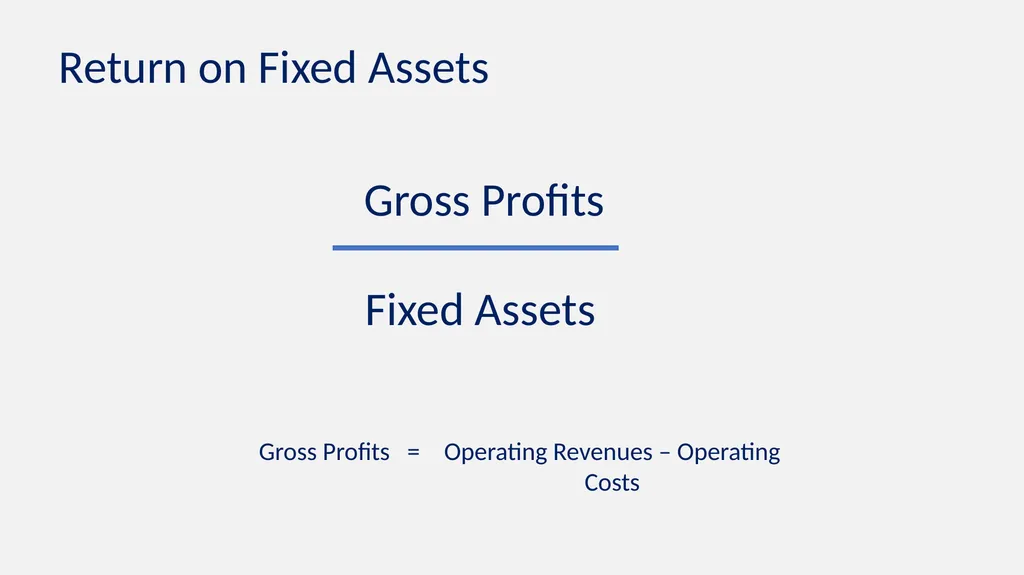
slide30. Return on Fixed Assets Measures the return to assets that have been specifically commissioned to produce operating revenues and provides an indication of the efficiency of the WSS plant and equipment in generating revenues for the utility.
Low returns may indicate that either the fixed assets are not fully utilized or that the system is overbuilt or that tariff are not appropriate levels.
Low consumer consumption rates would also indicate an underutilized system and poor investment planning.<br>
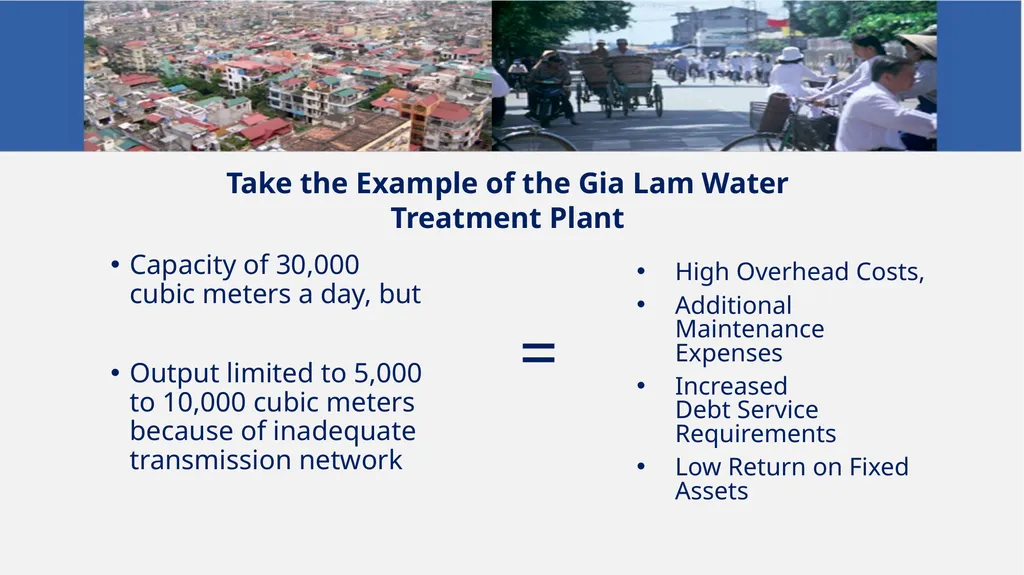
slide31. Capacity of 30,000 cubic meters a day, but
Output limited to 5,000 to 10,000 cubic meters because of inadequate transmission network = High Overhead Costs,
Additional Maintenance Expenses
Increased Debt Service Requirements
Low Return on Fixed Assets Take the Example of the Gia Lam Water Treatment Plant<br>
slide32. Return on Fixed Assets<br>
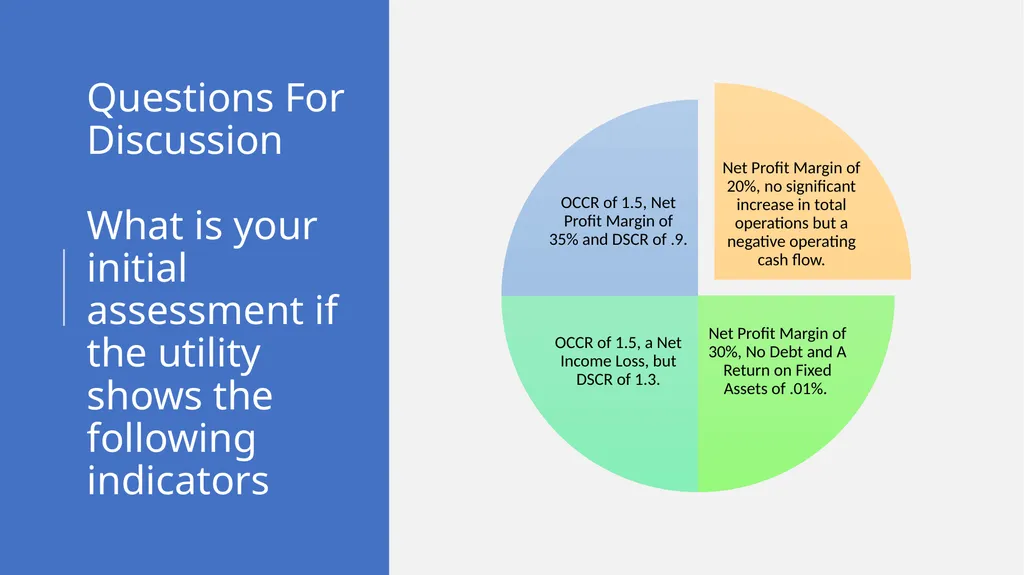
slide33. Questions For Discussion What is your initial assessment if the utility shows the following indicators<br>
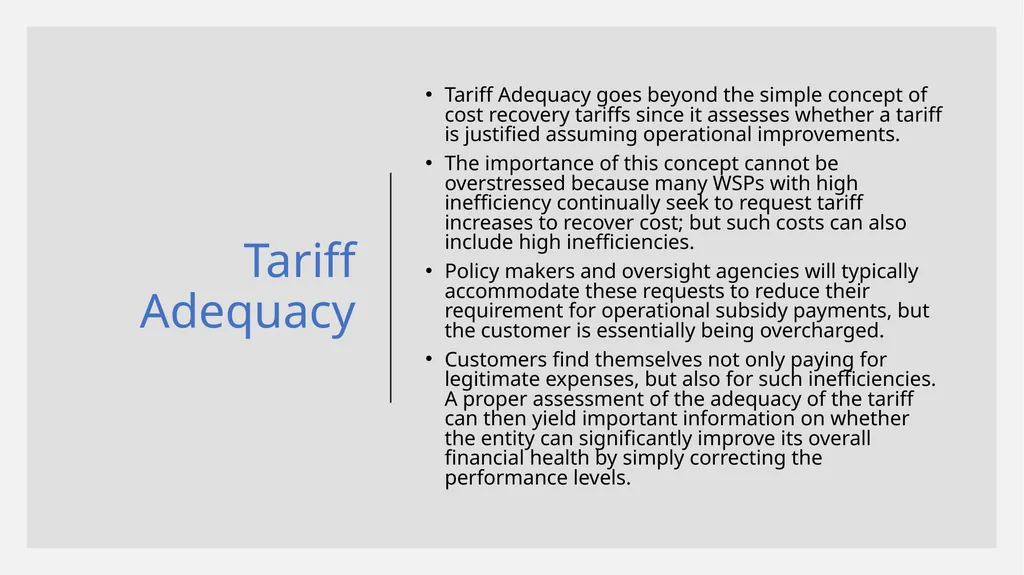
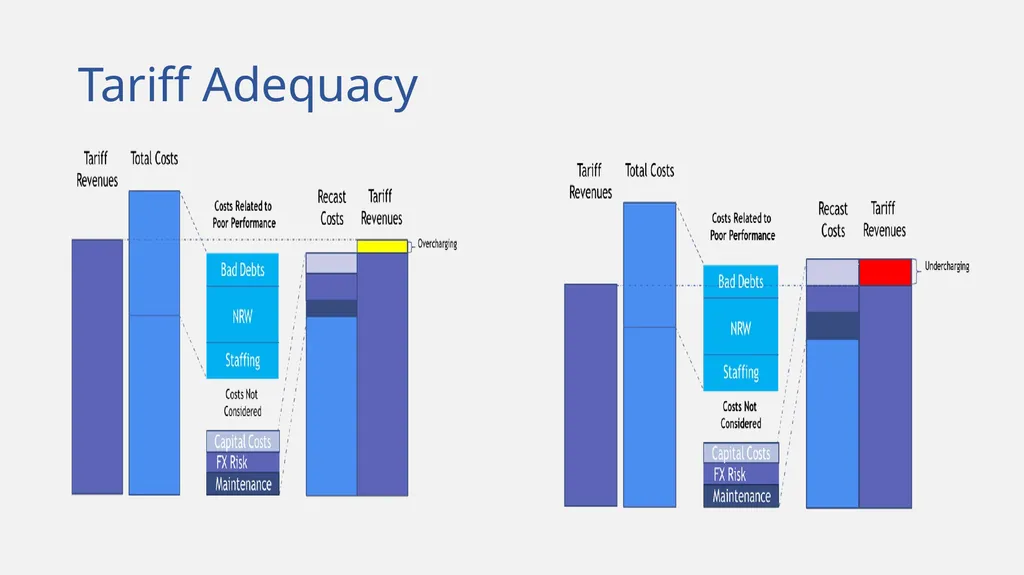
slide34. Tariff Adequacy Tariff Adequacy goes beyond the simple concept of cost recovery tariffs since it assesses whether a tariff is justified assuming operational improvements.
The importance of this concept cannot be overstressed because many WSPs with high inefficiency continually seek to request tariff increases to recover cost; but such costs can also include high inefficiencies.
Policy makers and oversight agencies will typically accommodate these requests to reduce their requirement for operational subsidy payments, but the customer is essentially being overcharged.
Customers find themselves not only paying for legitimate expenses, but also for such inefficiencies. A proper assessment of the adequacy of the tariff can then yield important information on whether the entity can significantly improve its overall financial health by simply correcting the performance levels.<br>
slide35. Tariff Adequacy<br>
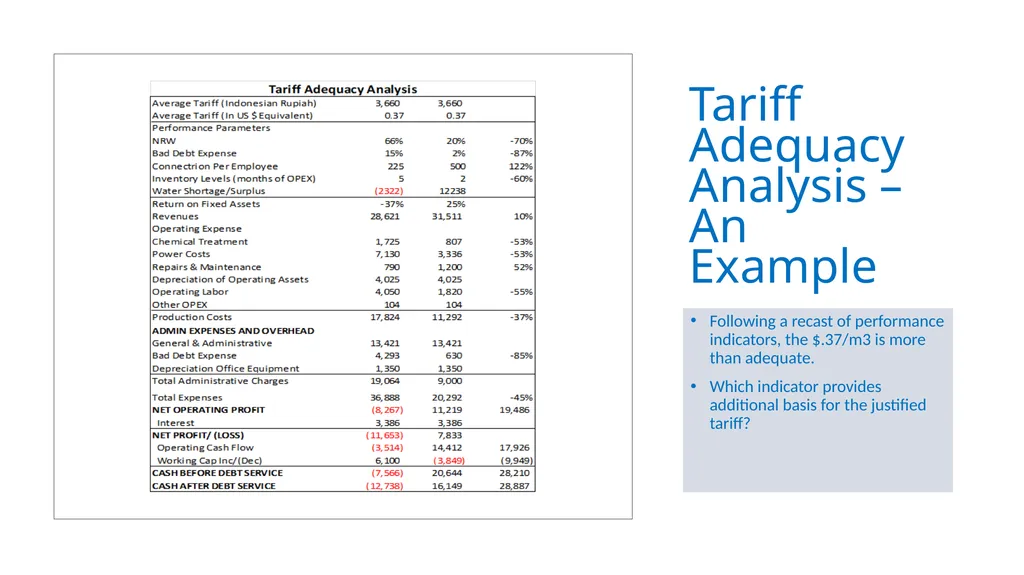
slide36. Following a recast of performance indicators, the $.37/m3 is more than adequate.
Which indicator provides additional basis for the justified tariff? Tariff Adequacy Analysis – An Example<br>
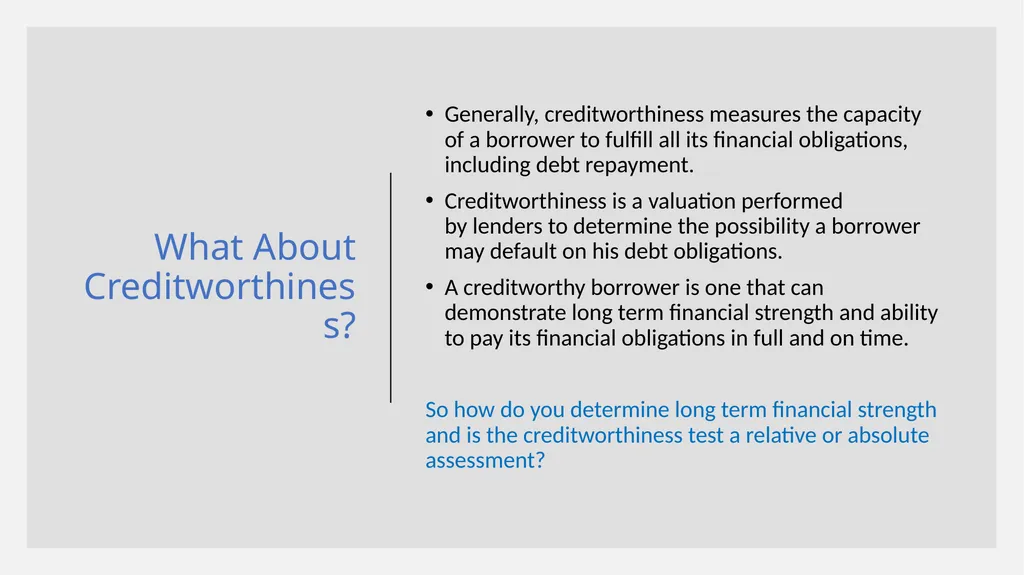
slide37. What About Creditworthiness? Generally, creditworthiness measures the capacity of a borrower to fulfill all its financial obligations, including debt repayment.
Creditworthiness is a valuation performed by lenders to determine the possibility a borrower may default on his debt obligations.
A creditworthy borrower is one that can demonstrate long term financial strength and ability to pay its financial obligations in full and on time.
So how do you determine long term financial strength and is the creditworthiness test a relative or absolute assessment?<br>
slide38. CWASA Case Study<br>
slide2. Let’s Start With Understanding the Financial System!<br>
slide3. The Funds Flow System<br>
slide7. Essentially a Financial System is Interrelated so Most Financial and Technical Indicators also Relate to Each Other<br>
slide8. Financial Statement Analysis The Income Statement reflects the operating performance for the period – i.e. production and sales which lead to either profit or losses. Income Statements need to be properly formatted for quick assessment.
The Balance Sheet reflects the balance of the different accounts which are either assets, liabilities or equity. The balance sheet is a snapshot at any point in time.
The Cash Flow Statement reflects the movement of cash during the year and is the bridge between the income statement and the balance sheet.
The balance sheet is always reported at end or the reporting period while income and cash flow statements are for the entire reporting period usually a year.<br>
slide9. Income Statement Good Format Operating Revenues
Less: Operating Expenses
Contribution Margin
Less: General And Administrative Expenses
Gross Profit Before Interest, Depreciation & Other Non-Operating Income
Less: Interest Expense
Less: Depreciation
Plus: Non Operating Income
Profit Before Taxes
Less: Income Taxes
Net Profit Poor Format Revenues
Less: Power
Chemicals
Labor
Maintenance
Travel
Transportation
Interest
Depreciation
Taxes
Provident Fund
Net Profit Power
Chemicals
Maintenance
Direct Labor
Other direct Costs<br>
slide10. Balance Sheet Good Format ASSETS
Cash
Accounts Receivables
Inventories
Other Current
Total Current
Fixed Assets
Total Assets
LIABILITIES & EQUITY
Accounts Payable
Other Payables
Current Portion of Long-Term Debt
Total Current liabilities
Long Term Debt
Total Liabilities
Equity
Paid in Capital
Retained Earnings
Total Capital
Total Liabilities & Equity Poor Format ASSETS
Cash
Accounts Receivables
Inventories
Other Current
Land
Plant in Service
CWIP
Total Assets
LIABILITIES & EQUITY
Accounts Payable
Other Payables
Long Term Debt
Total Liabilities
Total Capital
Total Liabilities & Equity<br>
slide11. Cash Flow Good Format Internal Cash Generation
Net Income Before Interest
Add: Depreciation
Operating Cash Flow
Add: Beginning Cash Position
Changes in Working Capital (Inc./(Dec.)
Cash Before Debt Service
Add: Interest Charges
Principal Repayments
Total Debt Service
Cash After Debt Service
Investment Operations
Sale of Assets
CAPEX
Interest During Construction
Annual Capital Investments
Cash After Investment Operations
Sources of Financing
Loans
Capital Grants
Subsidies
Funds From Loans & Grants
Cash Ending Balance Poor Format Fund Sources
Year-End Profits
Depreciation
Reduction in Inventories
Increase in Accounts Payables
Loan Disbursements
Grants and Subsidies
Sale of Assets
Depreciation Expense
Total Sources of Cash
Fund Uses
Increase in Accounts Receivables
Increase in Prepaid Expenses
Capital Expenditures
Interest During Construction
Principal Repayments
Total Uses of Cash
Add: Beginning Balance
Cash Ending Balance Inventories
Accounts Receivables
Prepaid Expenses
Accounts Payable<br>
slide12. Financial Statement Analysis If you analyze the income statement and balance sheet but not the cash flow you are missing a big part of the analysis.
That’s because whatever is earned or expensed is nor necessarily converted to cash - Case in point receivables and payables.
So first thing you have to figure out is whether the utility follows cash or accrual accounting.
Assets use up cash while liabilities release cash. Ultimately if the business is cash starved it will go bankrupt if there is no external support.<br>
slide13. To be truly effective you need to understand the financial system of the utility and the interrelationship of the three main statements.
Don’t get bogged down with too many indicators.
Performance Indicators and financial ratios are helpful but can lead you to the wrong conclusions and don’t give you the full information.
Benchmarking system can also be helpful but not all utilities are homogeneous. Their systems vary widely and also how investments are financed.
Best benchmark for a utility is its own year-to-year variance, but careful if the utility on a fast growth curve.
Closely study the Audit Report particularly the notes to the statements.
Always Ask what’s included in accounts you do not understand. About Diagnosing Performance of a Utility<br>
slide14. A Good Diagnostic is Not Just about Finance!<br>
slide15. Components of Historical Diagnostic Demographic Overview
System/Network Characteristics
Characteristics of Consumer Base and Coverage Area
Operating and Technical Performance
Financial Performance
Management, Institutional & Other Issues Summary of Debt Situation
Sanitation and Wastewater Profile
External Governance Profile
Strategic Objectives
Investment Priorities
Action Items to Improve Performance
Financing Requirements<br>
slide16. Summary Data & Indicators Operating & Technical Performance<br>
slide17. Summary Data & Indicators Financial Performance<br>
slide18. Key Performance Indicators NRW
Operating Cost Coverage Ratio
Collection Ratio
Debt Service Coverage Ratio
Net Profit Ratio
Return on Fixed Assets
Tariff Adequacy<br>
slide19. Non Revenue Water NRW is perhaps one of the more important indicators for water utilities as it measures both technical and commercial efficiency.
High NRW levels may not necessarily lower operating costs substantially, particularly in gravity fed systems with low pumping costs, but for they may still greatly reduce investment efficiency if the entity is reaching its water resource capacity and requires new investments for developing a new water source.
Analysis of the financial impacts of high NRW are necessary to develop appropriate remedial actions, if necessary.<br>
slide20. NRW (in its simplest form) Water Produced Water Billed 1 -<br>
slide21. Water Balance<br>
slide22. Operating Cost Coverage Ratio (OCCR) This is a key indicator for determining the entities overall revenue requirement and to what extent, that entity is recovering its operating and maintenance expenses. The ratio should be calculated strictly by comparing variable OPEX to Water and Sewerage Sales, also variable. Should not include depreciation, interest charges or general administrative expenses.
Generally, a OCCR ratio or less than 1.0 means that any expansion in coverage will reduce the financial health of the entity, while a ratio of 1.5 and above will typically enhance it.
In between these two points, there are opportunities for performance improvement and financing strategies that can bridge the financing gap by enhancing the financial health of the entities.
Such opportunities need to be investigated with more thorough analysis to identify the financial impacts of improving performance of key indicators.<br>
slide23. Operating Cost Coverage Ratio (OCCR) Operating Costs Operating Revenues Capacity to crowd-in Commercial Finance<br>
slide24. Collection Ratio The amount of revenue collected from water billed to customers can have substantial impact on the overall health of the WSP.
In a sense, it has the same effects as Non-Revenue Water in reducing the financial health of the utility. Uncollected bills have the same effects as commercial water losses as they increase the revenue requirement and lower the OCCR.
Low Collection ratios should be investigated by analyzing consumer accounts and by assessing and ageing analysis of outstanding receivables.
The typical culprits in paying bills are other Government agencies and the military.
High inflation can lead to overstatement of collections performance, particularly if using the collection period as ratio.<br>
slide25. Collection Ratios Accounts Receivables Balance Sales Revenue X 365<br>
slide26. Debt Service Coverage Ratio (DSCR) The DSCR provides added information on the entity’s capacity to borrow as it measures the service debt after O&M and working capital requirements are met.
Most certainly, WSPs with OCCRs at 1.0 or below will not be even able to satisfy increases in working capital for running the operation – a phenomena that typically results in the entity delaying payments to its suppliers and increasing other liabilities beyond prudent levels.
Lenders are particularly concerned with the DSCR but while it may be important from an historical perspective it is more indicative from a prospective perspective. Depending on the volatility of the operations a DSCR can be adequate between 1.1 and 1.2 over operating cash flow. But each lender has its own criteria based on past history of the entity and its own risk tolerance.<br>
slide27. Debt Service Coverage Ratio (DSCR)<br>
slide28. Net Profit Ratio The relationship of net income to total revenue is a good indicator for assessing the overall profitability of the entity.
However, this ratio can also be misleading in event the entity follows accrual accounting principles and much of the billed revenue is uncollected.
As such, key to a true assessment of profitability must consider the financial results on a cash basis whereby, only cash collections and non-cash items such as depreciation expenses are factored into the assessment.<br>
slide29. Net Profit Ratio<br>
slide30. Return on Fixed Assets Measures the return to assets that have been specifically commissioned to produce operating revenues and provides an indication of the efficiency of the WSS plant and equipment in generating revenues for the utility.
Low returns may indicate that either the fixed assets are not fully utilized or that the system is overbuilt or that tariff are not appropriate levels.
Low consumer consumption rates would also indicate an underutilized system and poor investment planning.<br>
slide31. Capacity of 30,000 cubic meters a day, but
Output limited to 5,000 to 10,000 cubic meters because of inadequate transmission network = High Overhead Costs,
Additional Maintenance Expenses
Increased Debt Service Requirements
Low Return on Fixed Assets Take the Example of the Gia Lam Water Treatment Plant<br>
slide32. Return on Fixed Assets<br>
slide33. Questions For Discussion What is your initial assessment if the utility shows the following indicators<br>
slide34. Tariff Adequacy Tariff Adequacy goes beyond the simple concept of cost recovery tariffs since it assesses whether a tariff is justified assuming operational improvements.
The importance of this concept cannot be overstressed because many WSPs with high inefficiency continually seek to request tariff increases to recover cost; but such costs can also include high inefficiencies.
Policy makers and oversight agencies will typically accommodate these requests to reduce their requirement for operational subsidy payments, but the customer is essentially being overcharged.
Customers find themselves not only paying for legitimate expenses, but also for such inefficiencies. A proper assessment of the adequacy of the tariff can then yield important information on whether the entity can significantly improve its overall financial health by simply correcting the performance levels.<br>
slide35. Tariff Adequacy<br>
slide36. Following a recast of performance indicators, the $.37/m3 is more than adequate.
Which indicator provides additional basis for the justified tariff? Tariff Adequacy Analysis – An Example<br>
slide37. What About Creditworthiness? Generally, creditworthiness measures the capacity of a borrower to fulfill all its financial obligations, including debt repayment.
Creditworthiness is a valuation performed by lenders to determine the possibility a borrower may default on his debt obligations.
A creditworthy borrower is one that can demonstrate long term financial strength and ability to pay its financial obligations in full and on time.
So how do you determine long term financial strength and is the creditworthiness test a relative or absolute assessment?<br>
slide38. CWASA Case Study<br>