
METHODOLOGY FOR WORKING OUT SCALE VALUES FOR
DJ
Published · 58 slides · 0 views

1 / 1










Description
METHODOLOGY FOR WORKING OUT SCALE VALUES FOR DIMENSIONS AND ITEMS Presented by: Chaithra G J, PALB-4018, 2nd Year Ph.D (Ag.Extn) PRESENTATION FLOW Introduction Objectives Scale and scale value Research evidences Conclusion INTRODUCTION
Related Topics
Share
Embed code
Download this presentation From Below
"METHODOLOGY FOR WORKING OUT SCALE VALUES FOR" is the property of its rightful owner. Permission is granted to download and print the materials on this website for personal, non-commercial use only, and to display it on your personal computer provided you do not modify the materials and that you retain all copyright notices contained in the materials. By downloading content from our website, you accept the terms of this agreement.
Presentation Transcript
01
METHODOLOGY FOR WORKING OUT SCALE VALUES FOR DIMENSIONS AND ITEMS Presented by:
Chaithra G J,
PALB-4018,
2nd Year Ph.D (Ag.Extn)<br>
Chaithra G J,
PALB-4018,
2nd Year Ph.D (Ag.Extn)<br>
02
PRESENTATION FLOW Introduction Objectives Scale and scale value Research evidences Conclusion<br>
03
INTRODUCTION<br>
04
Definition Scaling is the branch of measurement that involves the construction of an instrument that associates qualitative constructs with quantitative metric units. A Scale is a device to measure something and it is used in ordering a series of items along some sort of continuum (Kerlinger, 1973).<br>
05
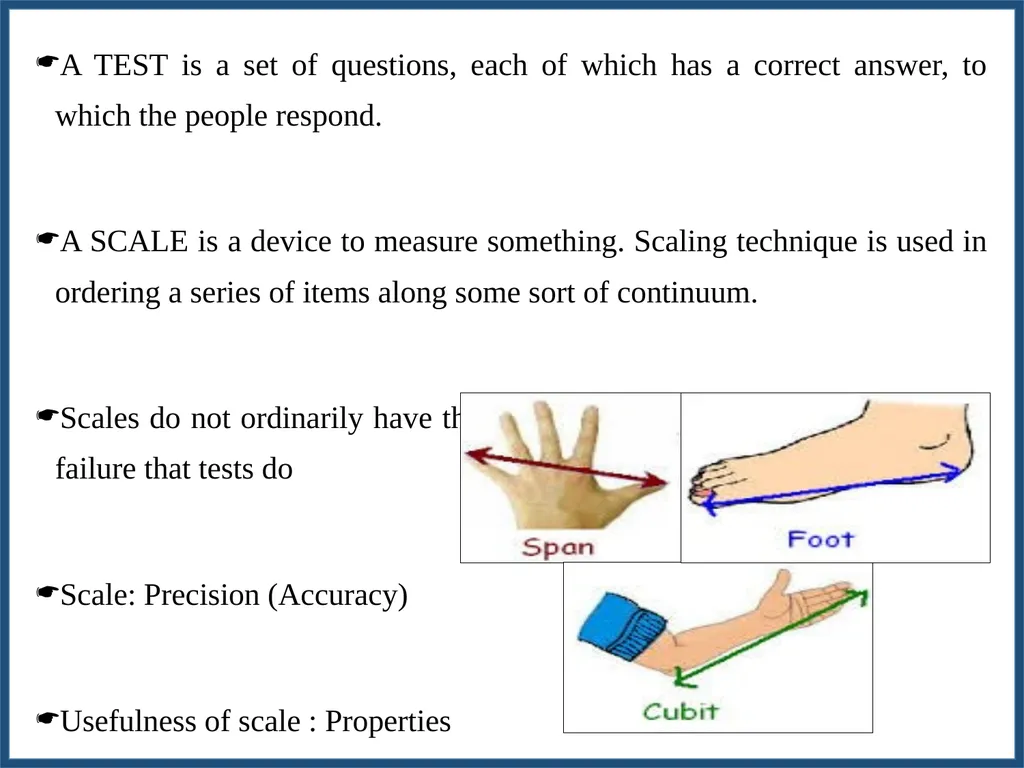
A TEST is a set of questions, each of which has a correct answer, to which the people respond.
A SCALE is a device to measure something. Scaling technique is used in ordering a series of items along some sort of continuum.
Scales do not ordinarily have the meaning of competition and success or failure that tests do
Scale: Precision (Accuracy)
Usefulness of scale : Properties<br>
A SCALE is a device to measure something. Scaling technique is used in ordering a series of items along some sort of continuum.
Scales do not ordinarily have the meaning of competition and success or failure that tests do
Scale: Precision (Accuracy)
Usefulness of scale : Properties<br>
06
Objectives To know the general steps followed in construction of scale.
To understand the steps involved in finding out scale value.
To review important scales developed in social science research<br>
To understand the steps involved in finding out scale value.
To review important scales developed in social science research<br>
07
General steps followed in construction of scale. First objective:<br>
08
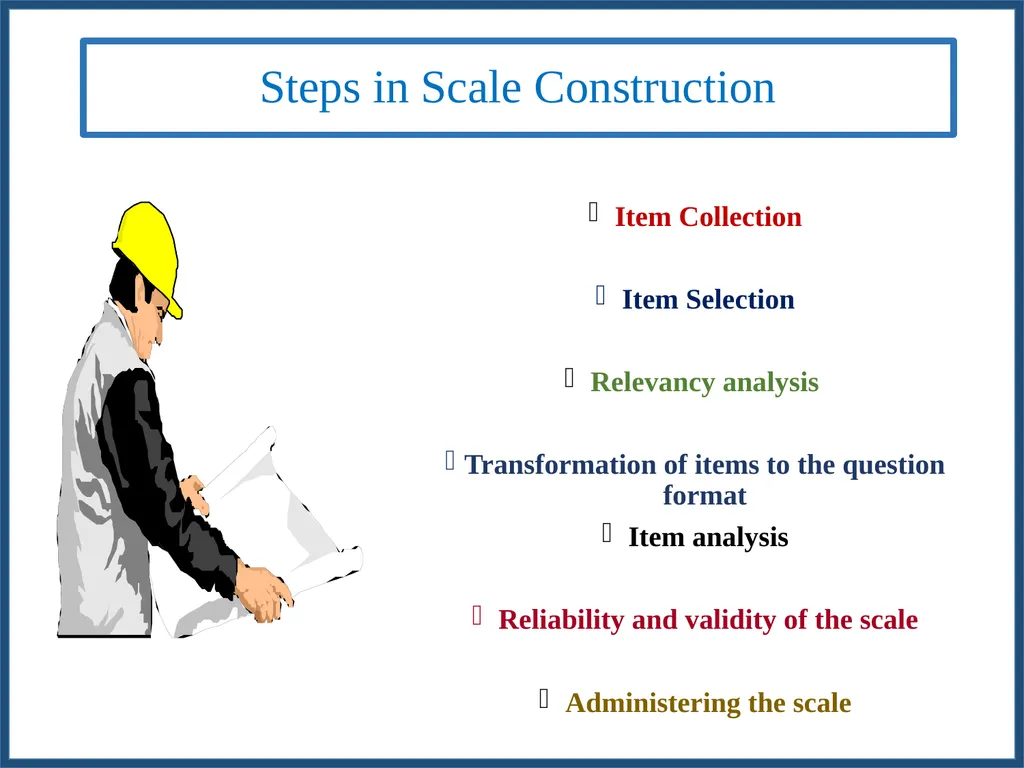
Steps in Scale Construction Item Collection
Item Selection
Relevancy analysis
Transformation of items to the question format
Item analysis
Reliability and validity of the scale
Administering the scale<br>
Item Selection
Relevancy analysis
Transformation of items to the question format
Item analysis
Reliability and validity of the scale
Administering the scale<br>
09
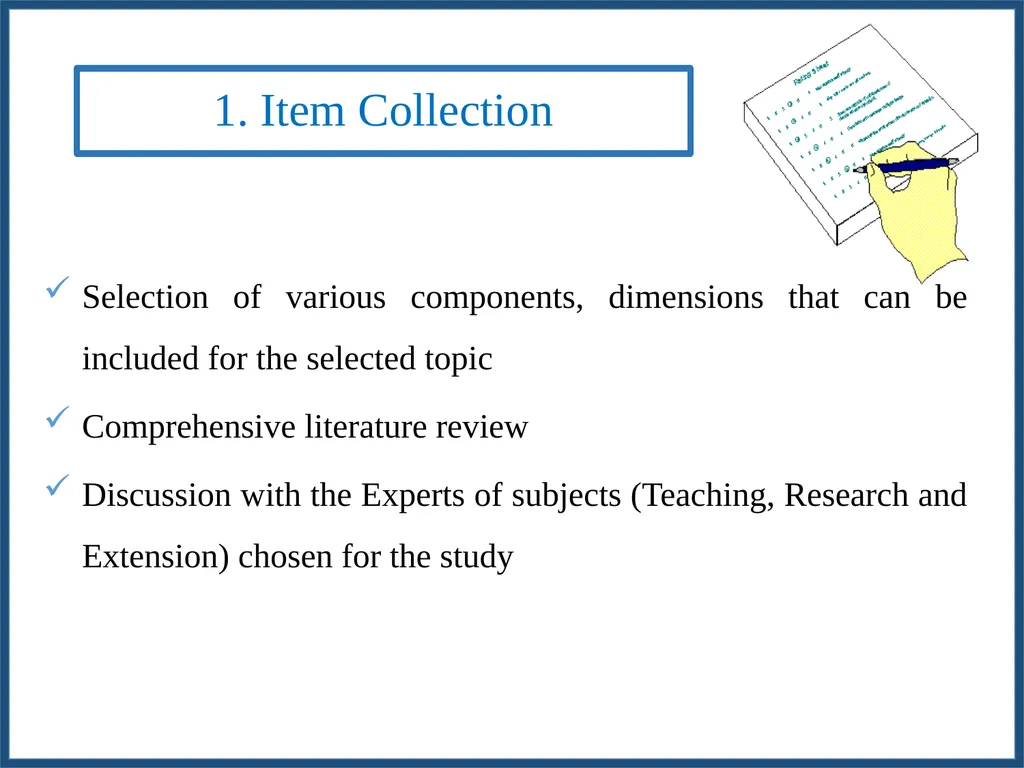
1. Item Collection Selection of various components, dimensions that can be included for the selected topic
Comprehensive literature review
Discussion with the Experts of subjects (Teaching, Research and Extension) chosen for the study<br>
Comprehensive literature review
Discussion with the Experts of subjects (Teaching, Research and Extension) chosen for the study<br>
10
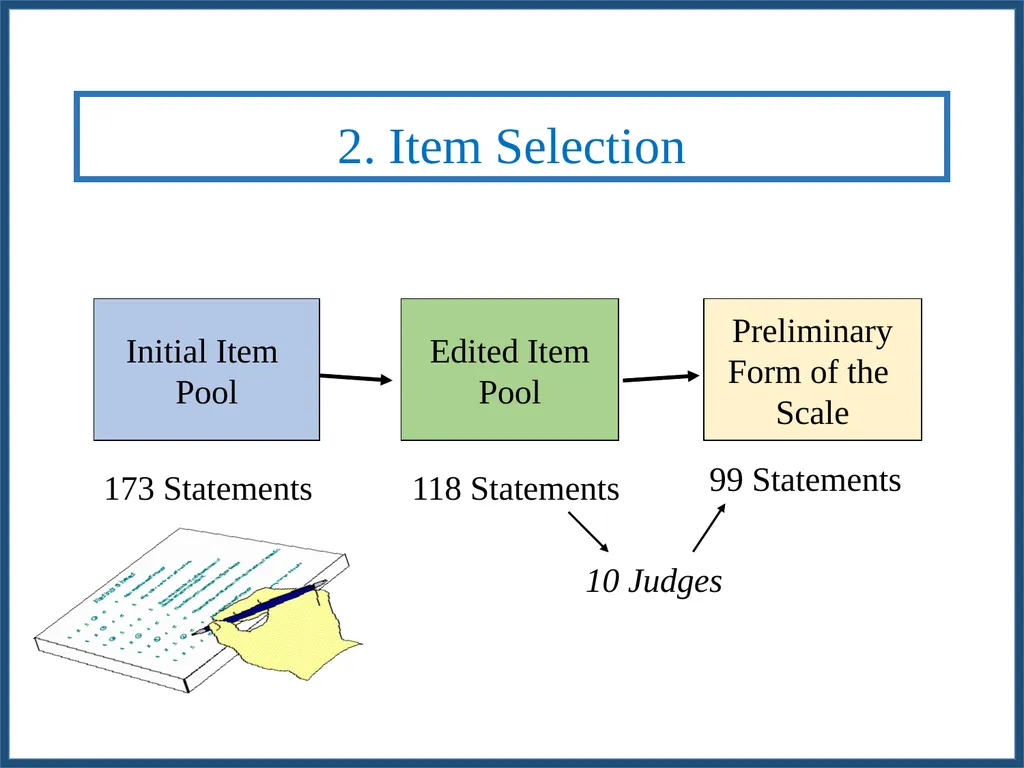
2. Item Selection Initial Item
Pool Edited Item
Pool Preliminary
Form of the
Scale 173 Statements 118 Statements 99 Statements 10 Judges<br>
Pool Edited Item
Pool Preliminary
Form of the
Scale 173 Statements 118 Statements 99 Statements 10 Judges<br>
11
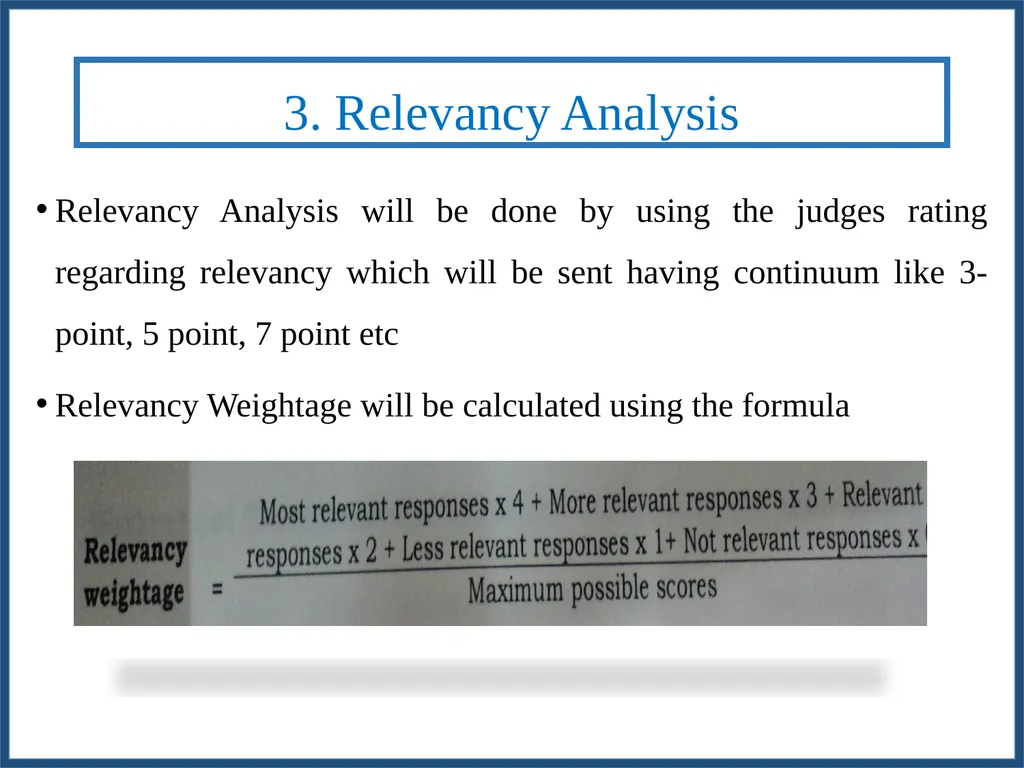
3. Relevancy Analysis Relevancy Analysis will be done by using the judges rating regarding relevancy which will be sent having continuum like 3-point, 5 point, 7 point etc
Relevancy Weightage will be calculated using the formula<br>
Relevancy Weightage will be calculated using the formula<br>
12
4. Transformation of items to the question format For each item, appropriate question tags will be used and transformed to question format
Questions will be formed in such a way that it will reflect the components of the variable considered for developing the scale<br>
Questions will be formed in such a way that it will reflect the components of the variable considered for developing the scale<br>
13
5. Item Analysis Scale will be administered to experts. Based on their rating, the item analysis will be done.
Assessing an item’s ability to differentiate significantly between subjects
t-test
Difficulty Index
Discrimination Index<br>
Assessing an item’s ability to differentiate significantly between subjects
t-test
Difficulty Index
Discrimination Index<br>
14
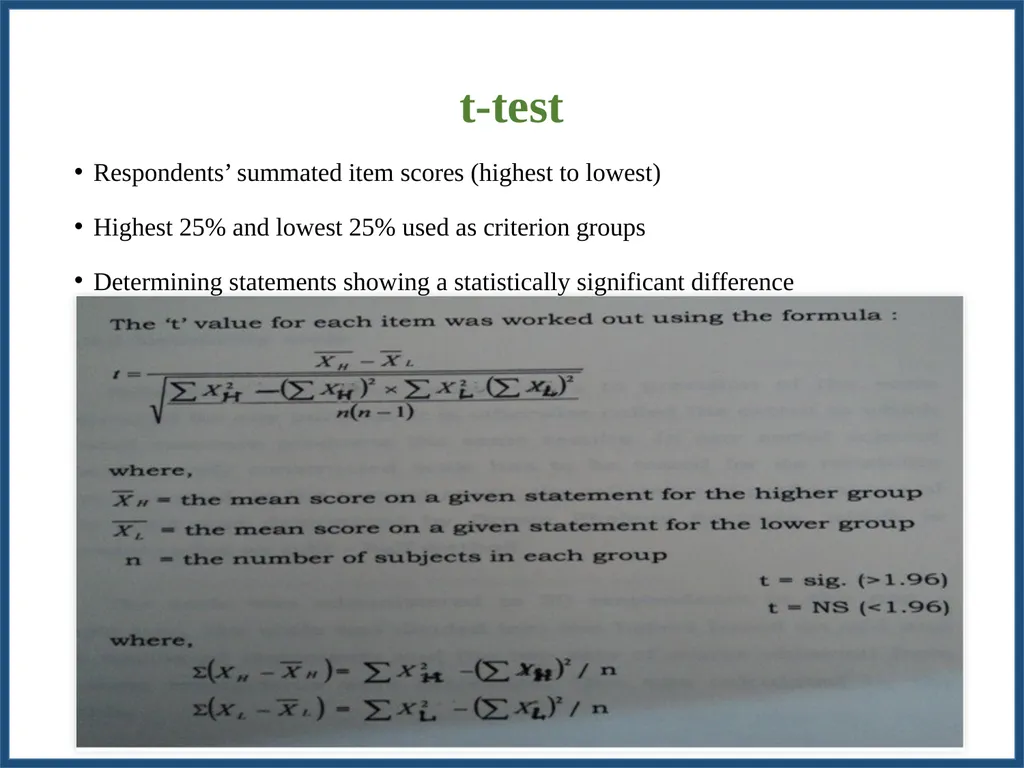
t-test
Respondents’ summated item scores (highest to lowest)
Highest 25% and lowest 25% used as criterion groups
Determining statements showing a statistically significant difference 15<br>
Respondents’ summated item scores (highest to lowest)
Highest 25% and lowest 25% used as criterion groups
Determining statements showing a statistically significant difference 15<br>
15
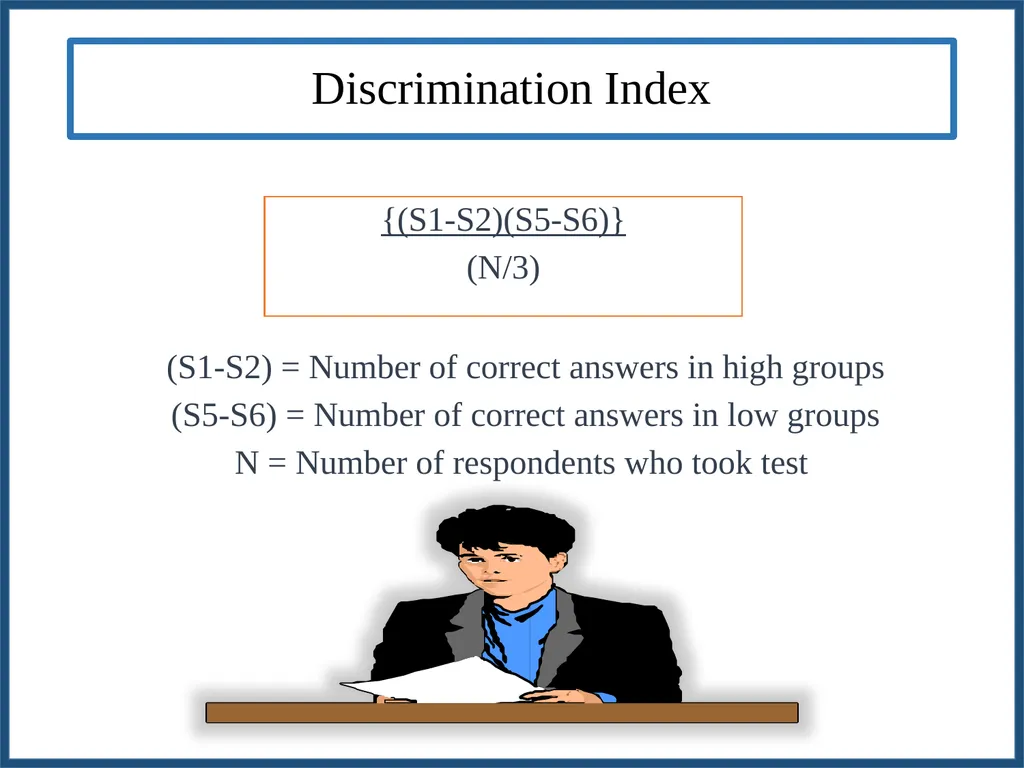
Discrimination Index {(S1-S2)(S5-S6)}
(N/3) (S1-S2) = Number of correct answers in high groups
(S5-S6) = Number of correct answers in low groups
N = Number of respondents who took test<br>
(N/3) (S1-S2) = Number of correct answers in high groups
(S5-S6) = Number of correct answers in low groups
N = Number of respondents who took test<br>
16
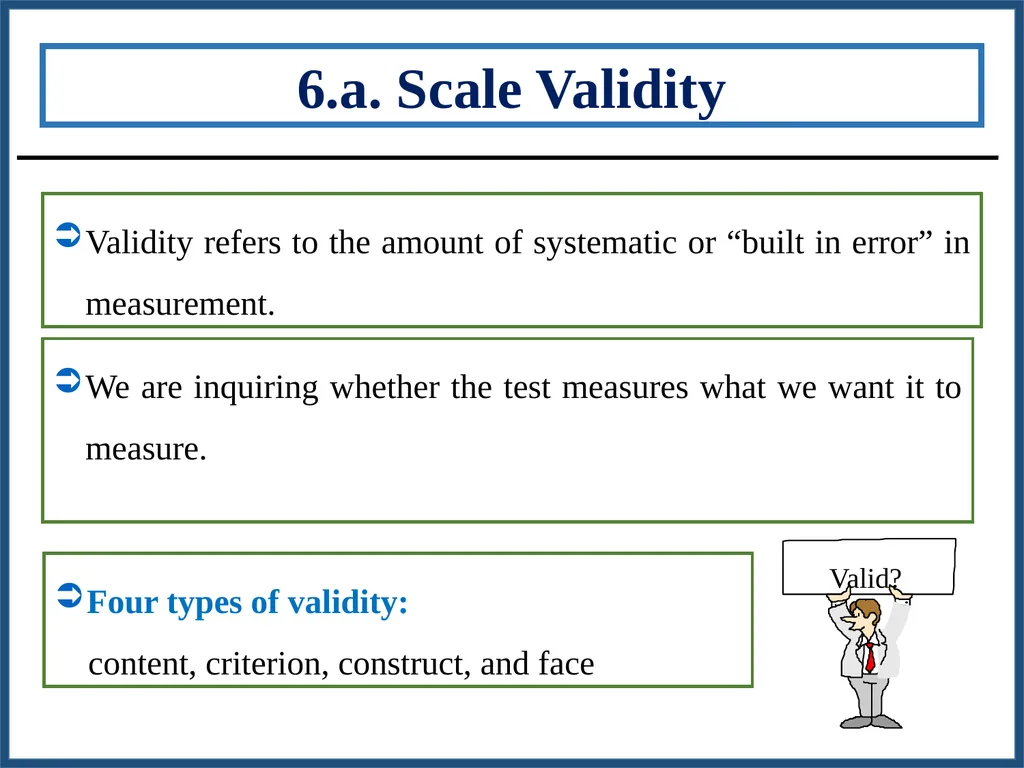
We are inquiring whether the test measures what we want it to measure. Validity refers to the amount of systematic or “built in error” in measurement. Four types of validity:
content, criterion, construct, and face 6.a. Scale Validity<br>
content, criterion, construct, and face 6.a. Scale Validity<br>
17
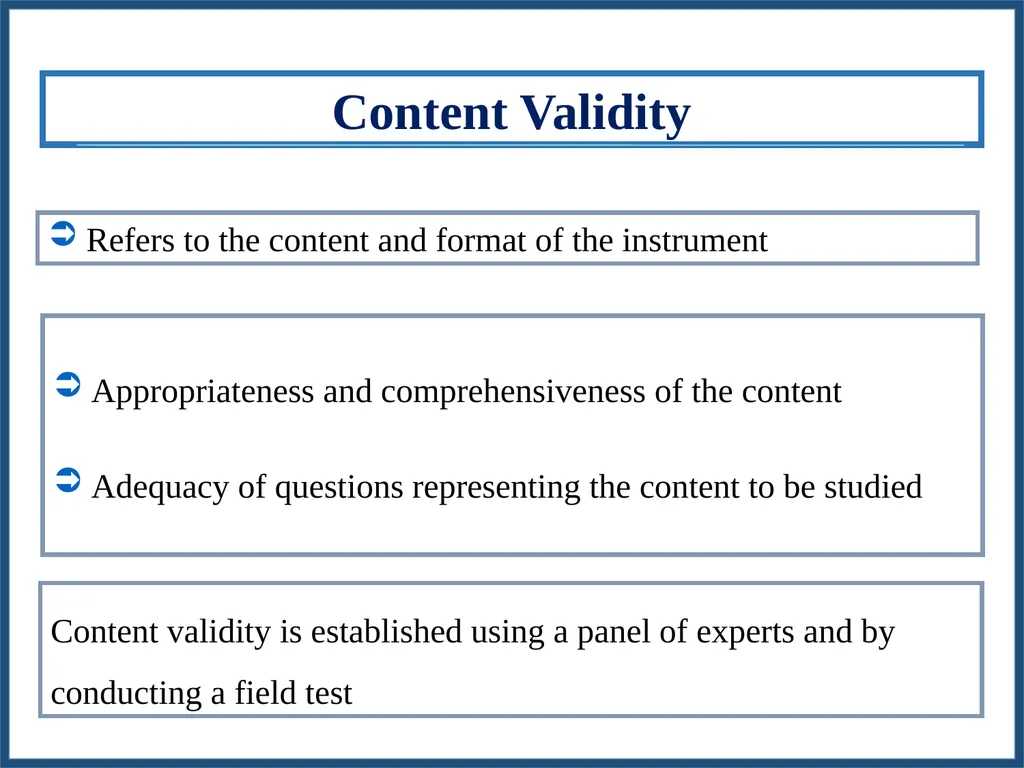
Appropriateness and comprehensiveness of the content
Adequacy of questions representing the content to be studied Refers to the content and format of the instrument Content Validity Content validity is established using a panel of experts and by conducting a field test<br>
Adequacy of questions representing the content to be studied Refers to the content and format of the instrument Content Validity Content validity is established using a panel of experts and by conducting a field test<br>
18
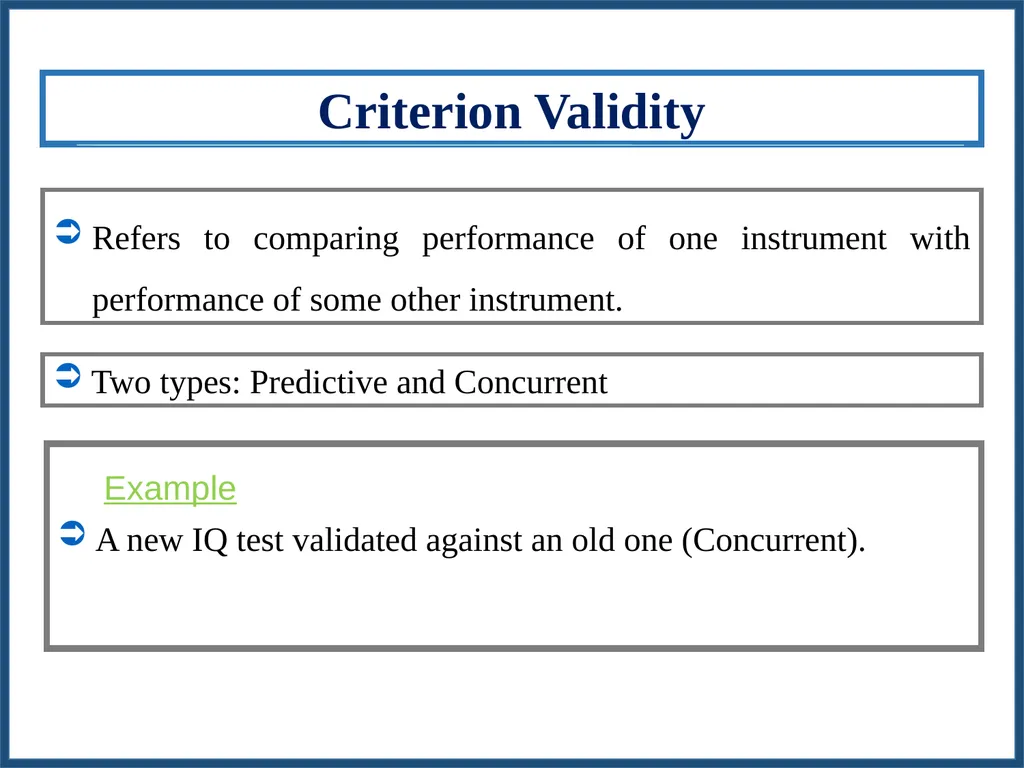
Refers to comparing performance of one instrument with performance of some other instrument. Criterion Validity Example A new IQ test validated against an old one (Concurrent). Two types: Predictive and Concurrent<br>
19
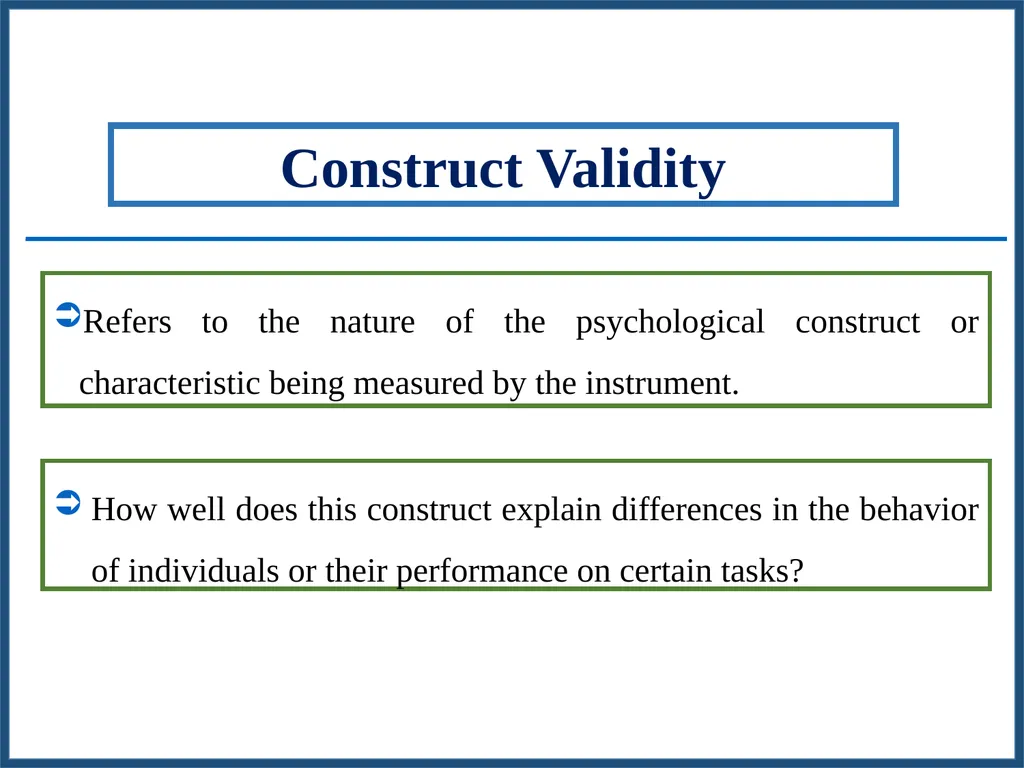
How well does this construct explain differences in the behavior of individuals or their performance on certain tasks? Refers to the nature of the psychological construct or characteristic being measured by the instrument. Construct Validity<br>
20
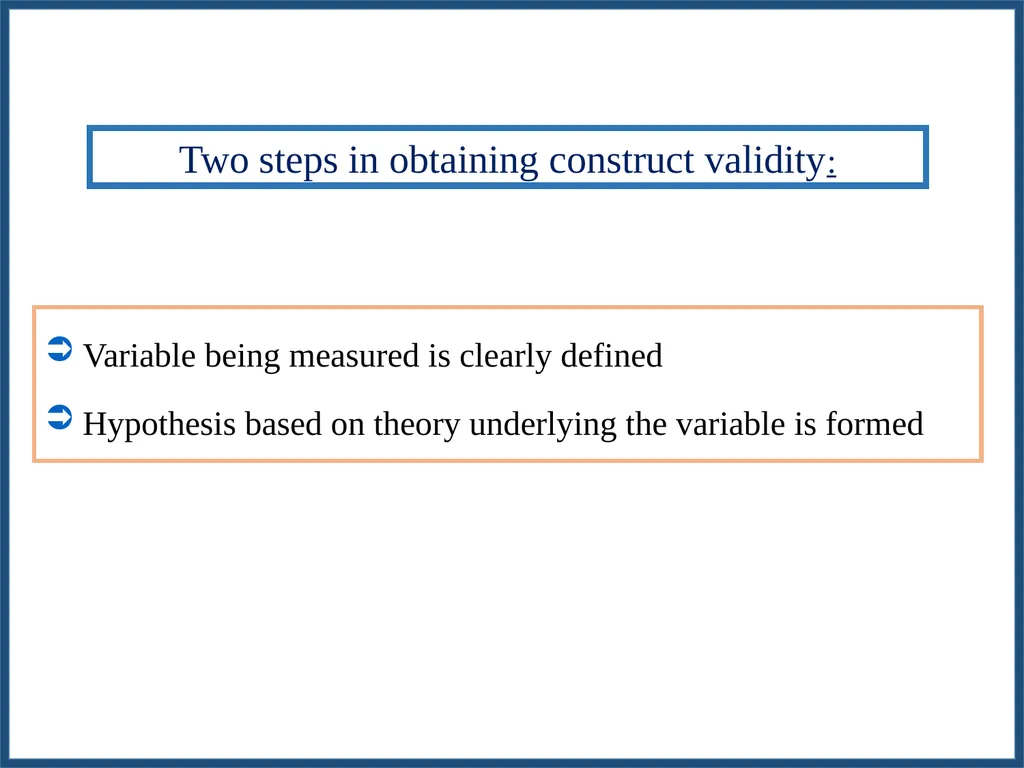
Two steps in obtaining construct validity: Variable being measured is clearly defined
Hypothesis based on theory underlying the variable is formed<br>
Hypothesis based on theory underlying the variable is formed<br>
21
Are the questions look like a test? Face validity is established using a panel of experts (6-10) Refers to the format and appearance of the instrument Face Validity<br>
22
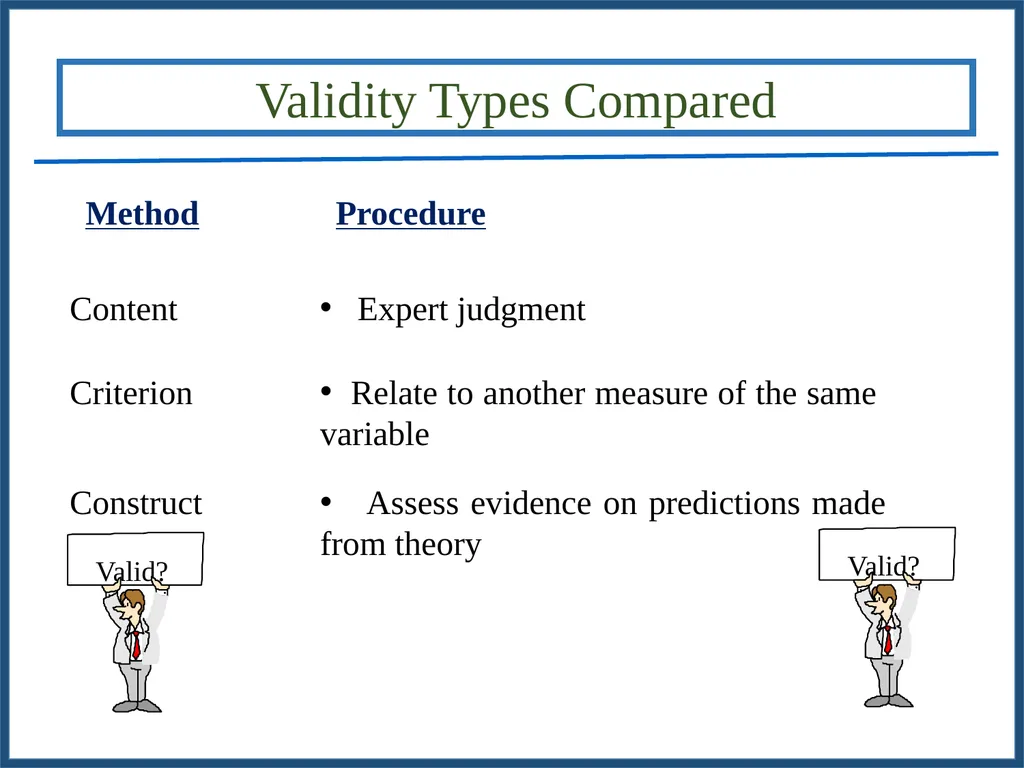
Validity Types Compared<br>
23
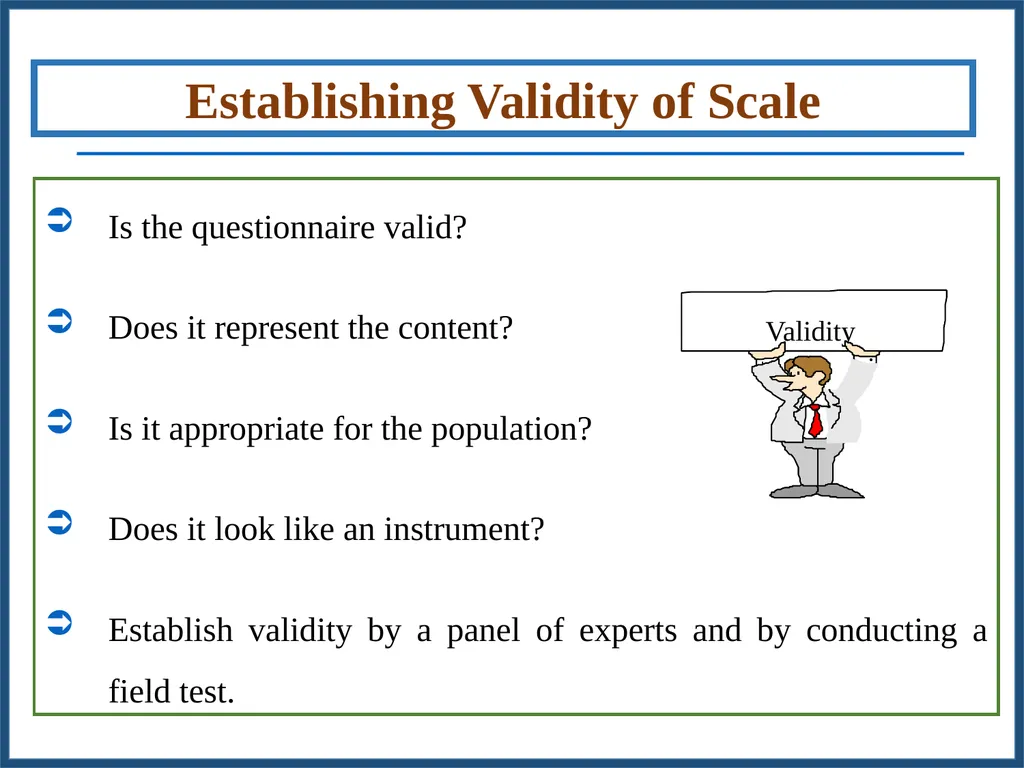
Is the questionnaire valid?
Does it represent the content?
Is it appropriate for the population?
Does it look like an instrument?
Establish validity by a panel of experts and by conducting a field test. Establishing Validity of Scale<br>
Does it represent the content?
Is it appropriate for the population?
Does it look like an instrument?
Establish validity by a panel of experts and by conducting a field test. Establishing Validity of Scale<br>
24
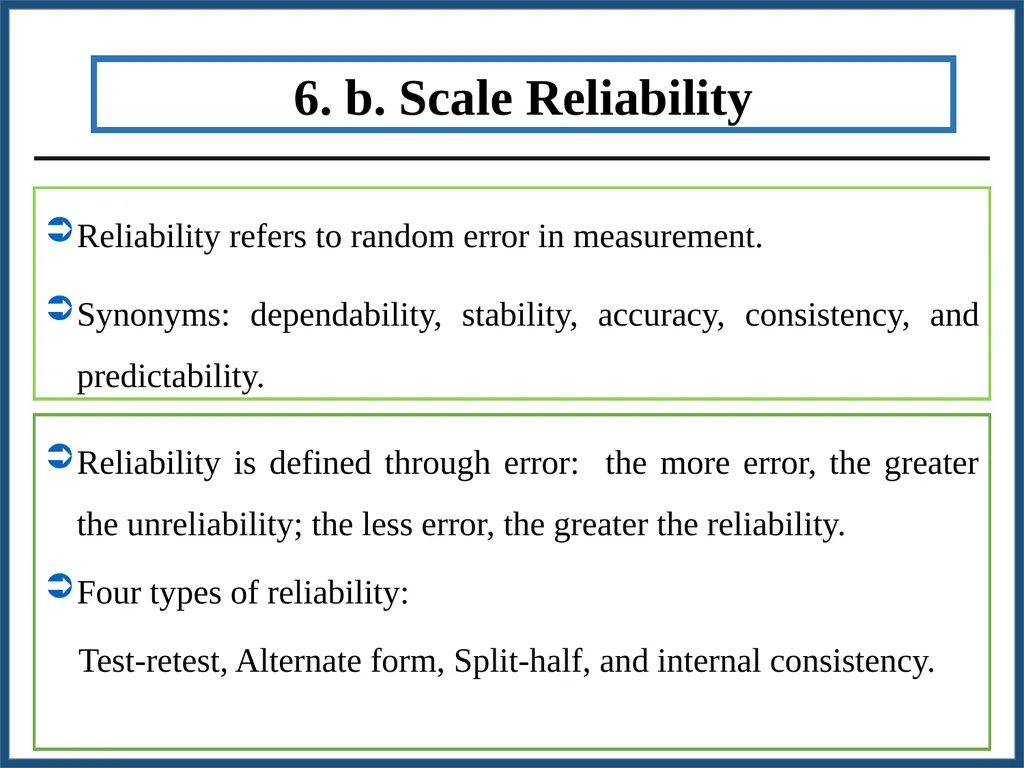
Reliability is defined through error: the more error, the greater the unreliability; the less error, the greater the reliability.
Four types of reliability:
Test-retest, Alternate form, Split-half, and internal consistency. Reliability refers to random error in measurement.
Synonyms: dependability, stability, accuracy, consistency, and predictability. 6. b. Scale Reliability<br>
Four types of reliability:
Test-retest, Alternate form, Split-half, and internal consistency. Reliability refers to random error in measurement.
Synonyms: dependability, stability, accuracy, consistency, and predictability. 6. b. Scale Reliability<br>
25
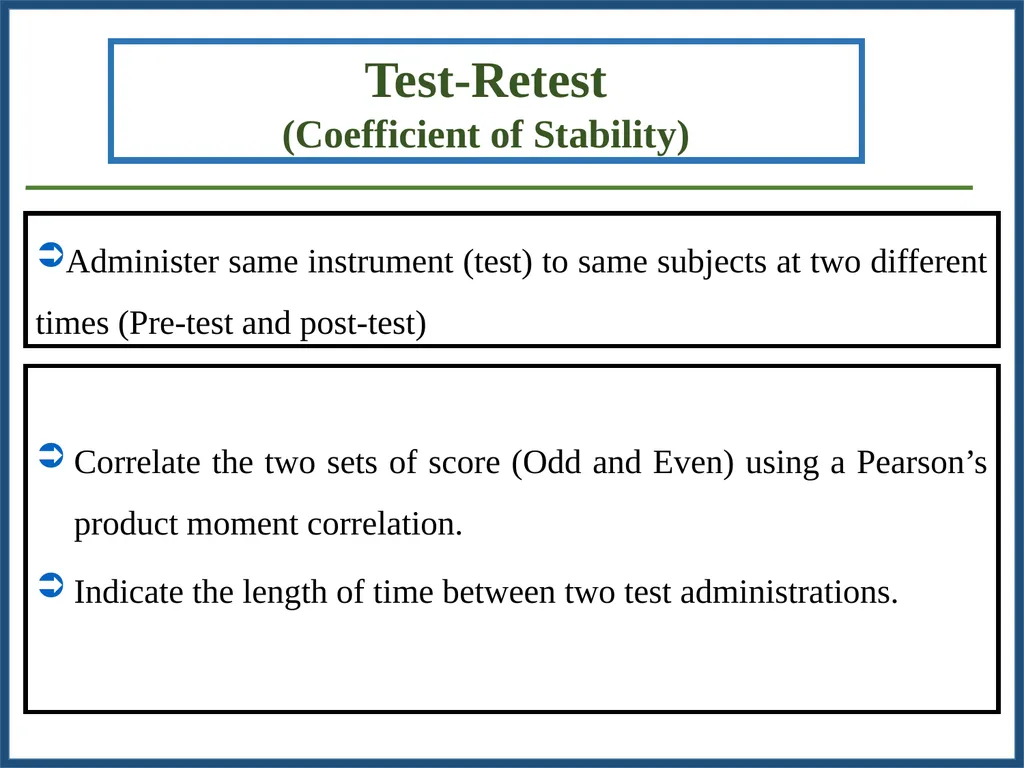
Correlate the two sets of score (Odd and Even) using a Pearson’s product moment correlation.
Indicate the length of time between two test administrations. Administer same instrument (test) to same subjects at two different times (Pre-test and post-test) Test-Retest
(Coefficient of Stability)<br>
Indicate the length of time between two test administrations. Administer same instrument (test) to same subjects at two different times (Pre-test and post-test) Test-Retest
(Coefficient of Stability)<br>
26
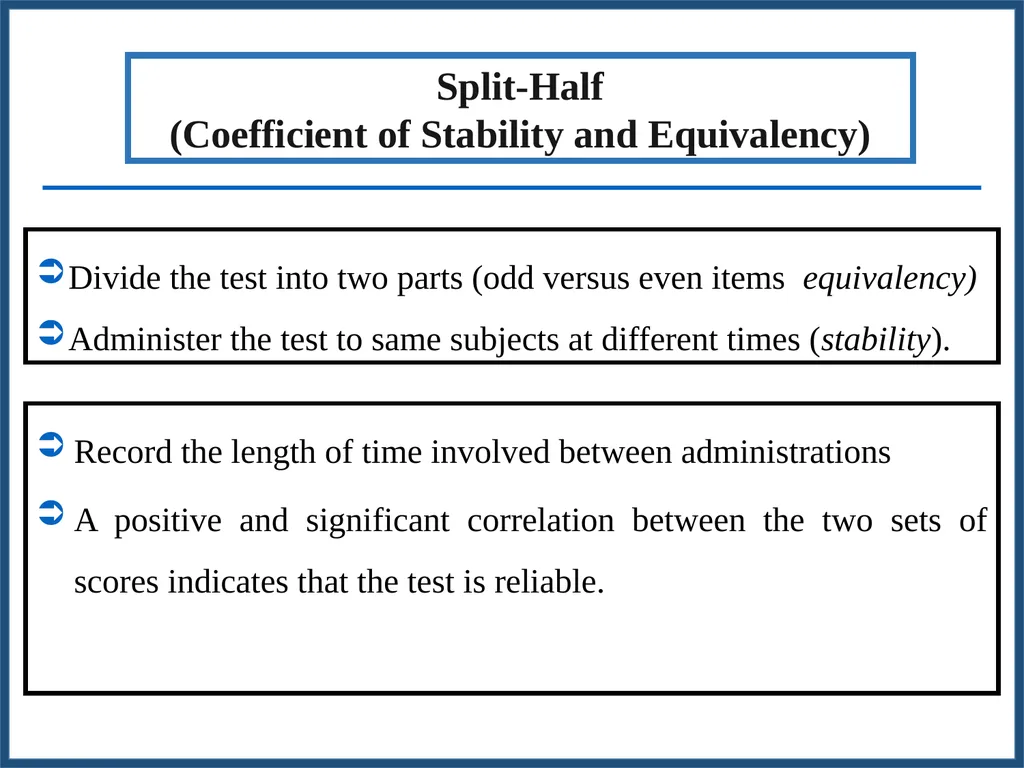
Record the length of time involved between administrations
A positive and significant correlation between the two sets of scores indicates that the test is reliable. Divide the test into two parts (odd versus even items equivalency)
Administer the test to same subjects at different times (stability). Split-Half
(Coefficient of Stability and Equivalency)<br>
A positive and significant correlation between the two sets of scores indicates that the test is reliable. Divide the test into two parts (odd versus even items equivalency)
Administer the test to same subjects at different times (stability). Split-Half
(Coefficient of Stability and Equivalency)<br>
27
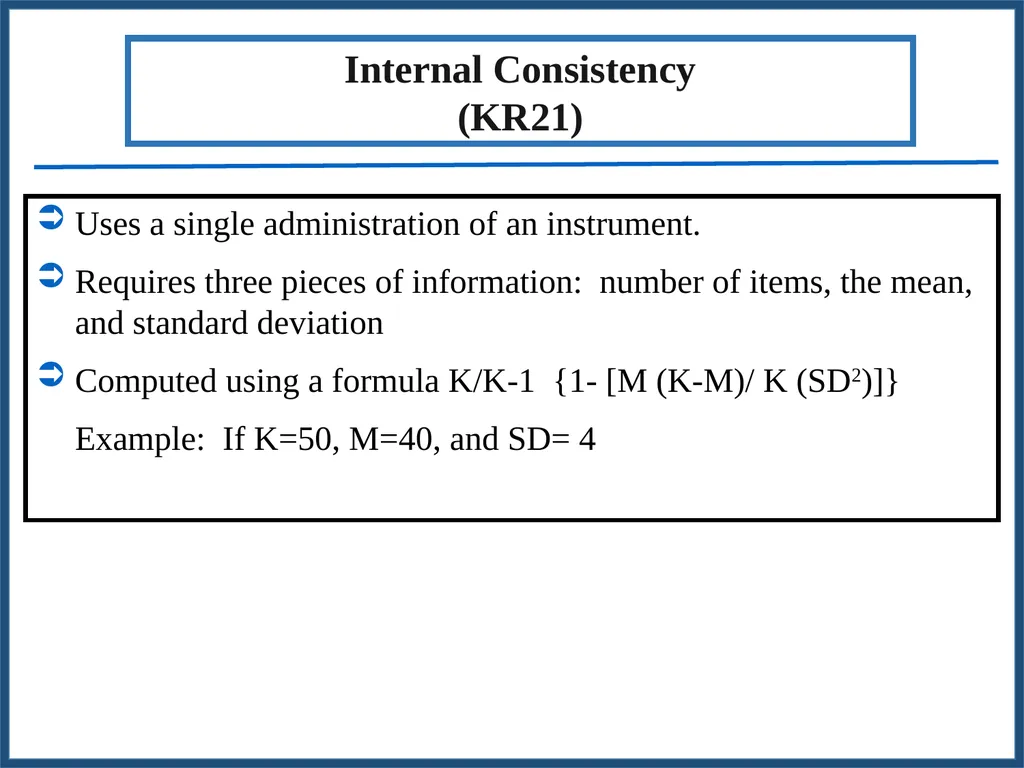
Uses a single administration of an instrument.
Requires three pieces of information: number of items, the mean, and standard deviation
Computed using a formula K/K-1 {1- [M (K-M)/ K (SD2)]}
Example: If K=50, M=40, and SD= 4 Internal Consistency
(KR21)<br>
Requires three pieces of information: number of items, the mean, and standard deviation
Computed using a formula K/K-1 {1- [M (K-M)/ K (SD2)]}
Example: If K=50, M=40, and SD= 4 Internal Consistency
(KR21)<br>
28
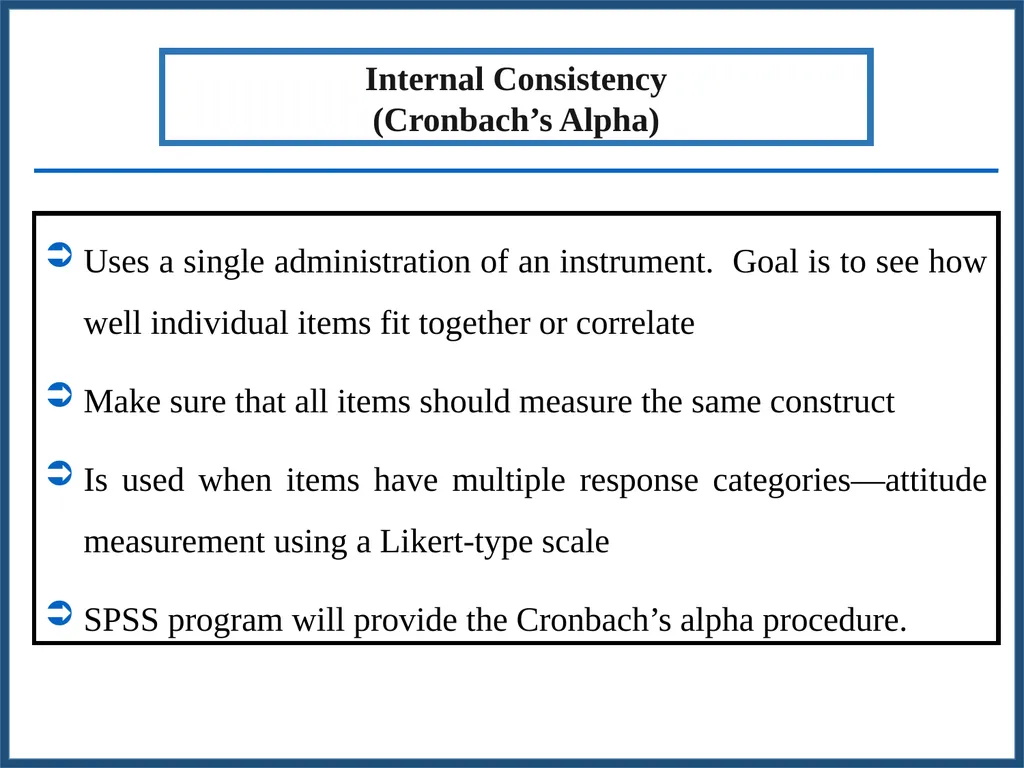
Uses a single administration of an instrument. Goal is to see how well individual items fit together or correlate
Make sure that all items should measure the same construct
Is used when items have multiple response categories—attitude measurement using a Likert-type scale
SPSS program will provide the Cronbach’s alpha procedure. Internal Consistency
(Cronbach’s Alpha)<br>
Make sure that all items should measure the same construct
Is used when items have multiple response categories—attitude measurement using a Likert-type scale
SPSS program will provide the Cronbach’s alpha procedure. Internal Consistency
(Cronbach’s Alpha)<br>
29
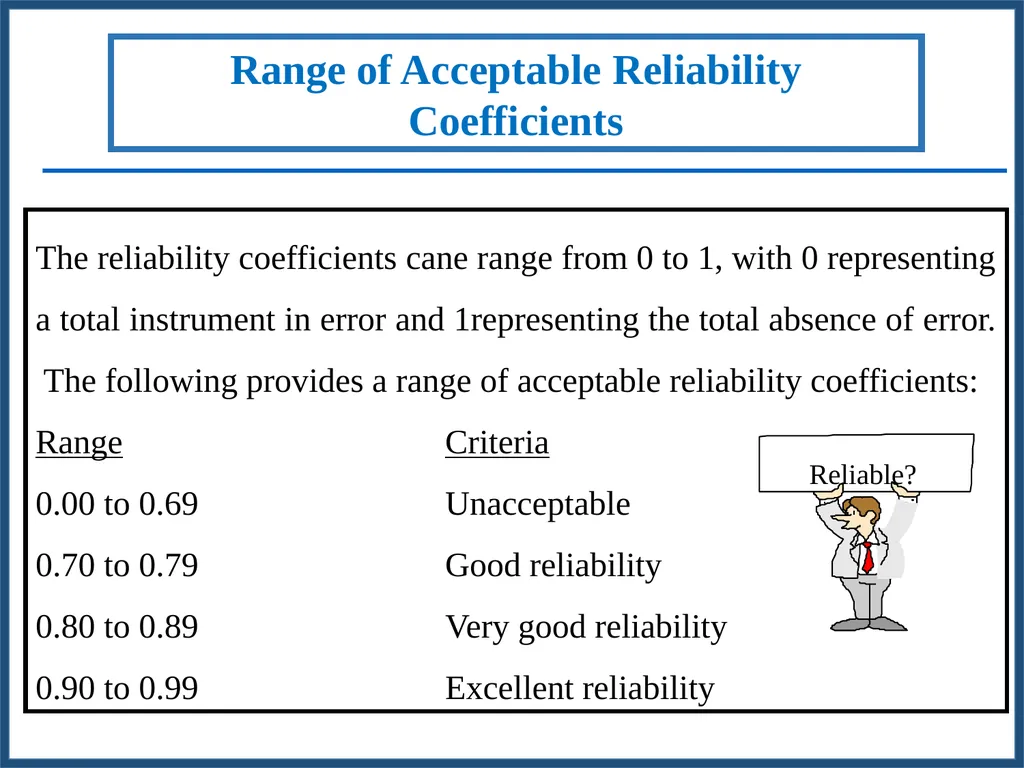
The reliability coefficients cane range from 0 to 1, with 0 representing a total instrument in error and 1representing the total absence of error. The following provides a range of acceptable reliability coefficients:
Range Criteria
0.00 to 0.69 Unacceptable
0.70 to 0.79 Good reliability
0.80 to 0.89 Very good reliability
0.90 to 0.99 Excellent reliability Range of Acceptable Reliability Coefficients<br>
Range Criteria
0.00 to 0.69 Unacceptable
0.70 to 0.79 Good reliability
0.80 to 0.89 Very good reliability
0.90 to 0.99 Excellent reliability Range of Acceptable Reliability Coefficients<br>
30
Length of the test
The cultural date of the test
Open ended v/s fixed response question
Mechanical factors
Clarity of instructions
Coding procedure
Human memory Factors Influencing Scale Reliability and Validity<br>
The cultural date of the test
Open ended v/s fixed response question
Mechanical factors
Clarity of instructions
Coding procedure
Human memory Factors Influencing Scale Reliability and Validity<br>
31
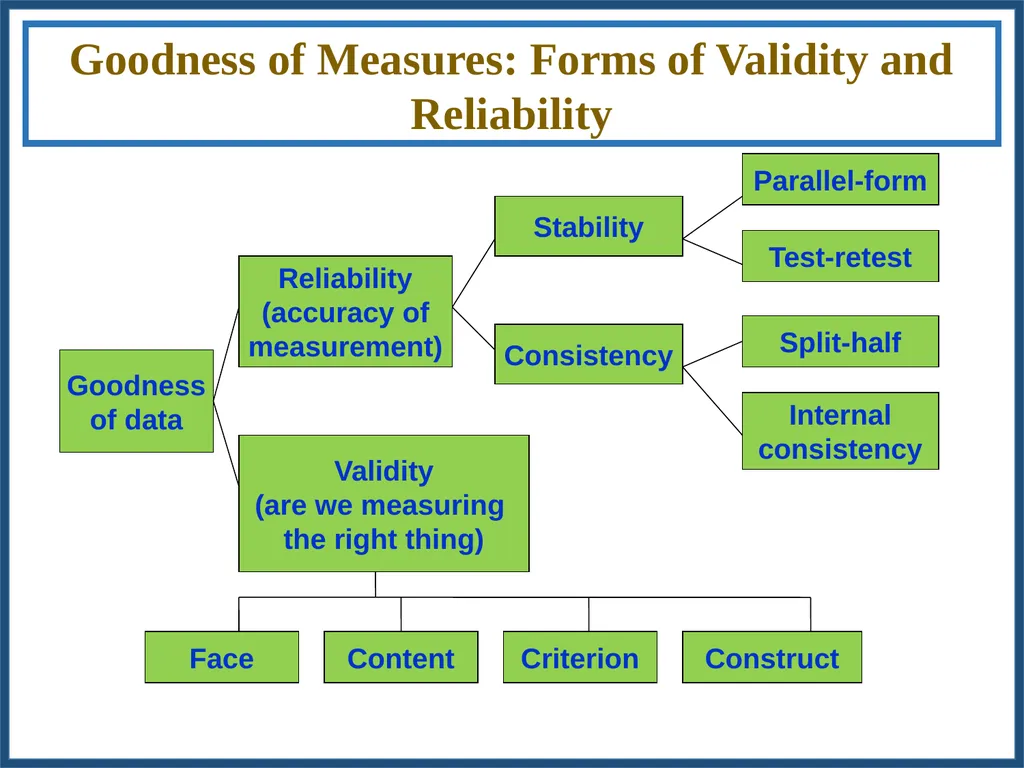
Goodness
of data Validity
(are we measuring
the right thing) Reliability
(accuracy of
measurement) Consistency Stability Test-retest Construct Criterion Content Face Parallel-form Split-half Internal
consistency Goodness of Measures: Forms of Validity and Reliability<br>
of data Validity
(are we measuring
the right thing) Reliability
(accuracy of
measurement) Consistency Stability Test-retest Construct Criterion Content Face Parallel-form Split-half Internal
consistency Goodness of Measures: Forms of Validity and Reliability<br>
32
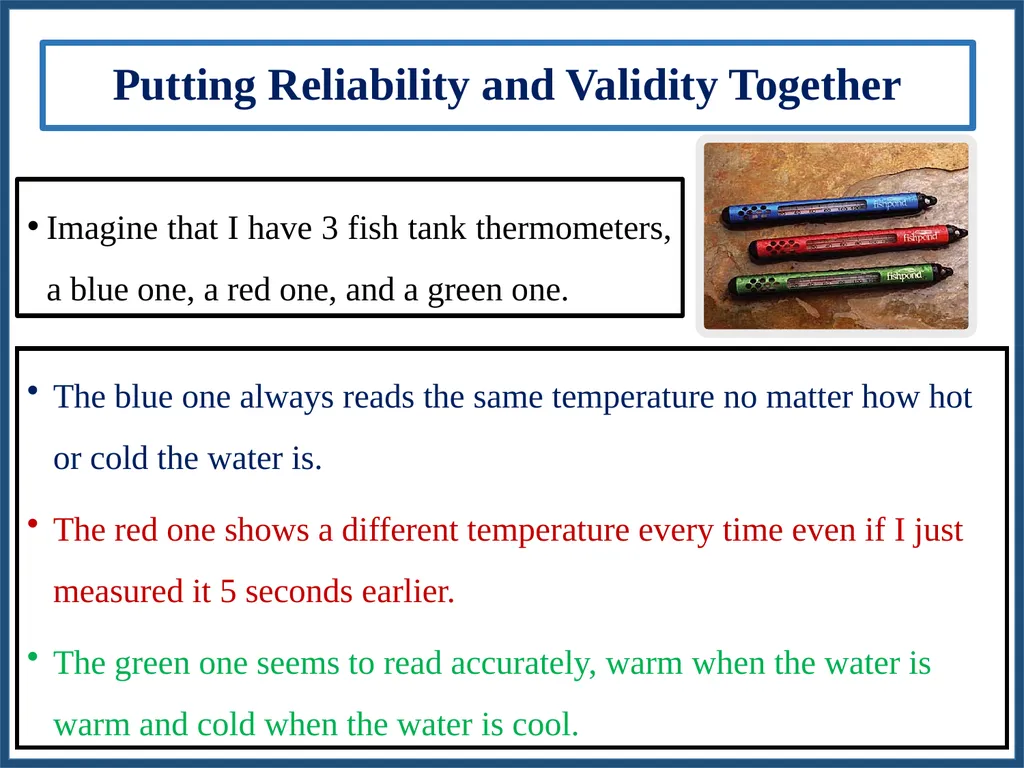
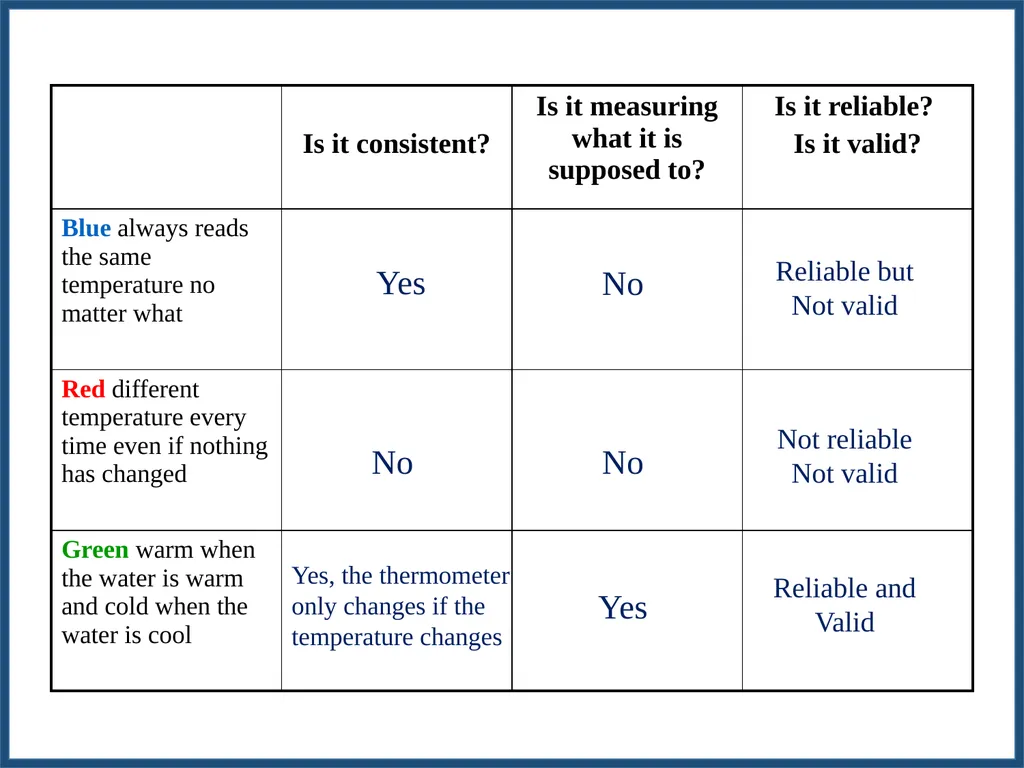
Putting Reliability and Validity Together Imagine that I have 3 fish tank thermometers, a blue one, a red one, and a green one. The blue one always reads the same temperature no matter how hot or cold the water is.
The red one shows a different temperature every time even if I just measured it 5 seconds earlier.
The green one seems to read accurately, warm when the water is warm and cold when the water is cool.<br>
The red one shows a different temperature every time even if I just measured it 5 seconds earlier.
The green one seems to read accurately, warm when the water is warm and cold when the water is cool.<br>
33
Yes No Yes, the thermometer only changes if the temperature changes No No Yes Reliable but Not valid Not reliable Not valid Reliable and Valid<br>
34
7. Administering the Scale Administering the scale developed to the respondents for the data collection<br>
35
To understand the steps involved in finding out scale value<br>
36
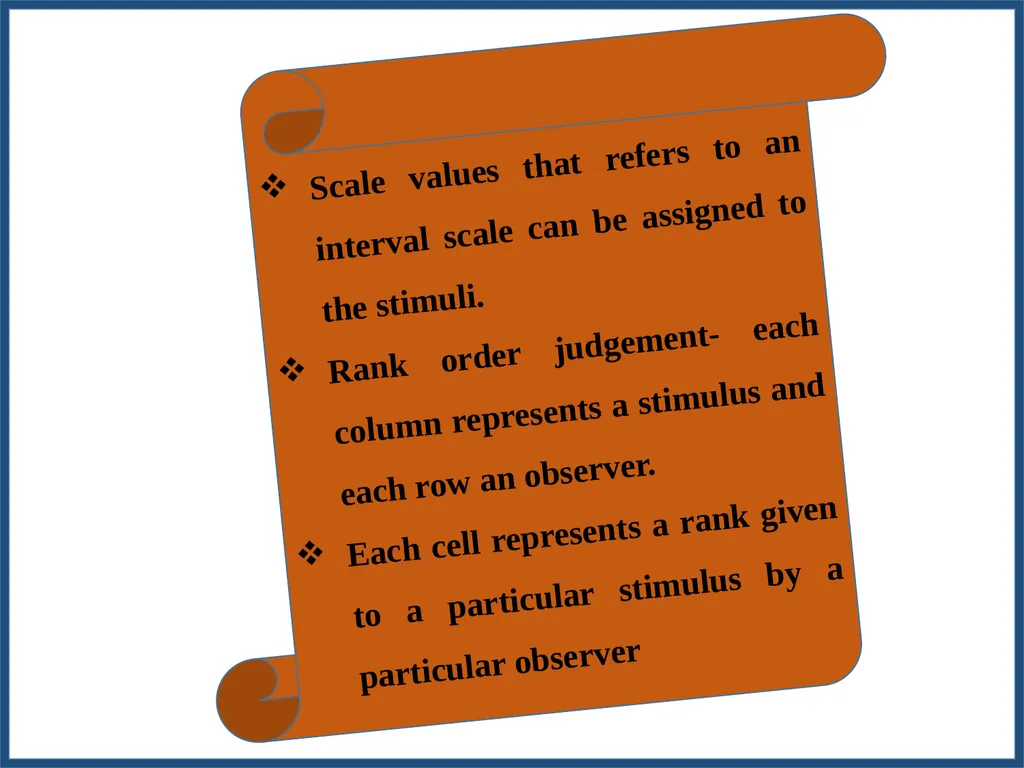
Scale values that refers to an interval scale can be assigned to the stimuli.
Rank order judgement- each column represents a stimulus and each row an observer.
Each cell represents a rank given to a particular stimulus by a particular observer<br>
Rank order judgement- each column represents a stimulus and each row an observer.
Each cell represents a rank given to a particular stimulus by a particular observer<br>
37
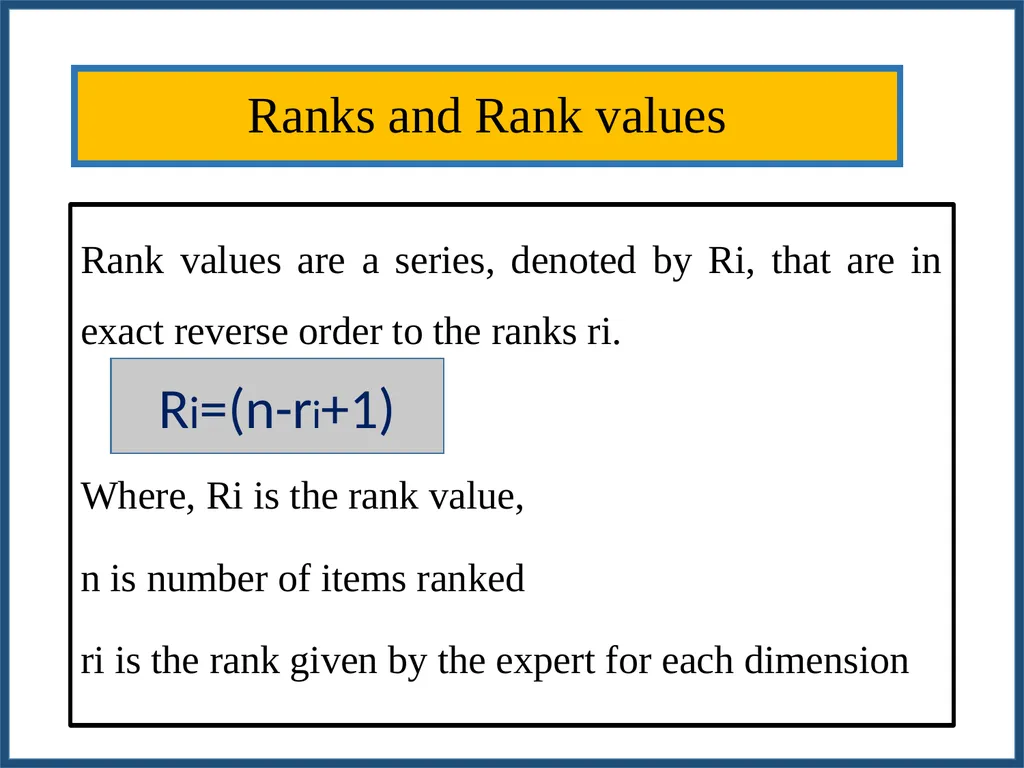
Ranks and Rank values Rank values are a series, denoted by Ri, that are in exact reverse order to the ranks ri.
Where, Ri is the rank value,
n is number of items ranked
ri is the rank given by the expert for each dimension Ri=(n-ri+1)<br>
Where, Ri is the rank value,
n is number of items ranked
ri is the rank given by the expert for each dimension Ri=(n-ri+1)<br>
38
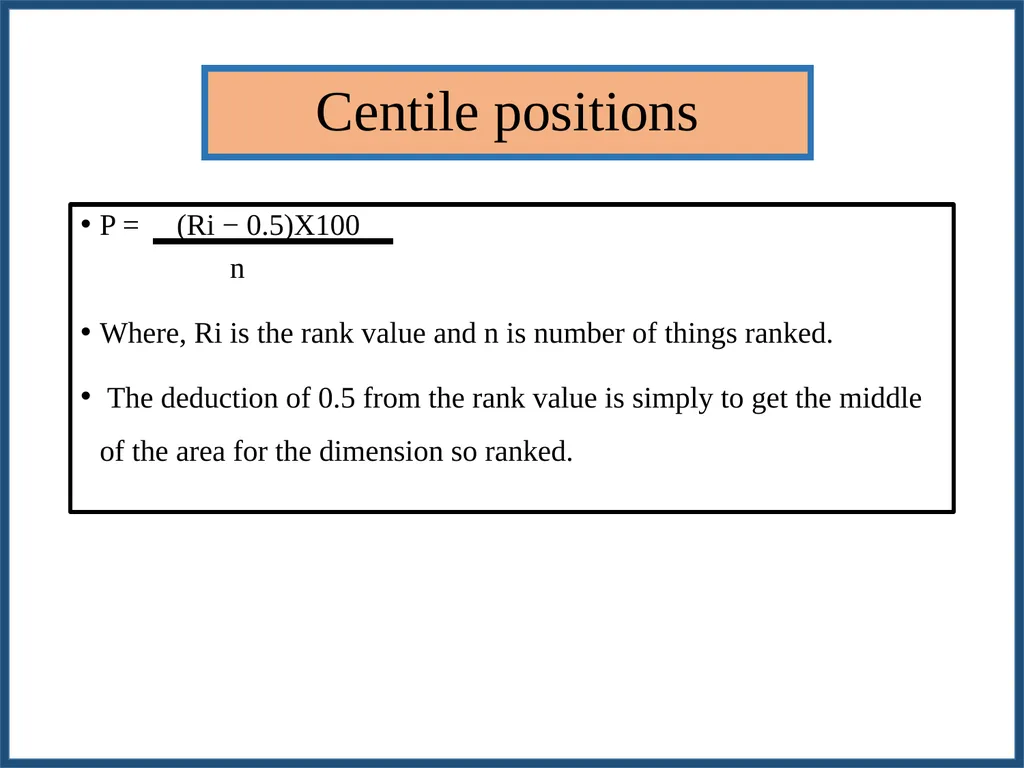
Centile positions P = (Ri − 0.5)X100
n
Where, Ri is the rank value and n is number of things ranked.
The deduction of 0.5 from the rank value is simply to get the middle of the area for the dimension so ranked.<br>
n
Where, Ri is the rank value and n is number of things ranked.
The deduction of 0.5 from the rank value is simply to get the middle of the area for the dimension so ranked.<br>
39
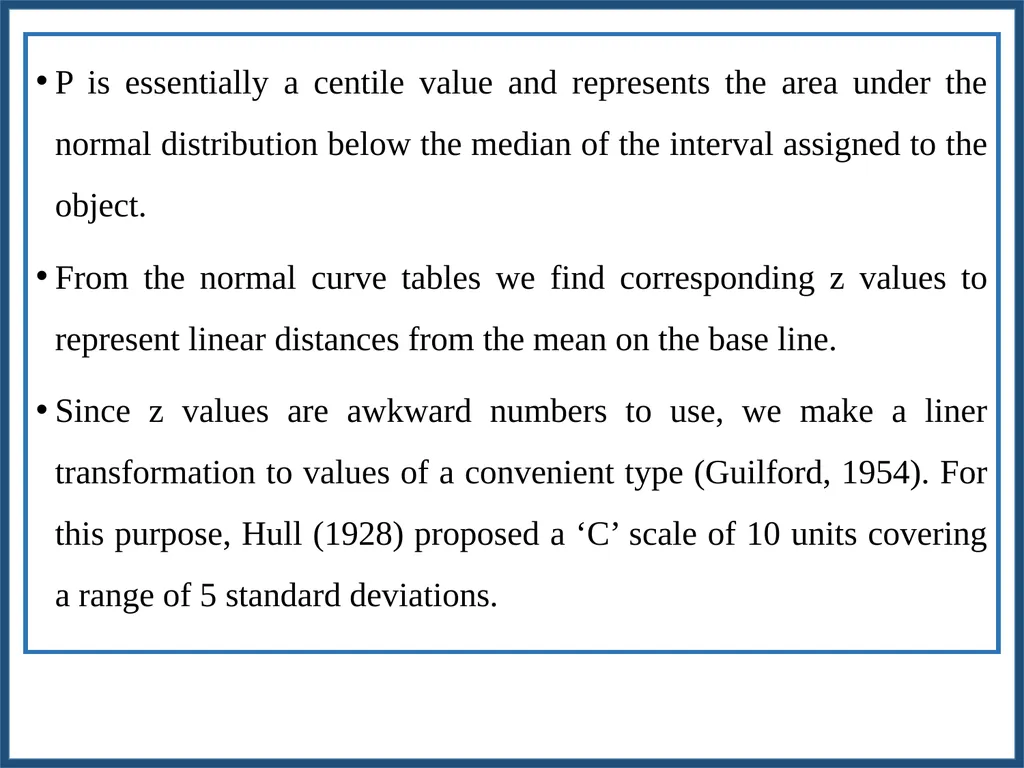
P is essentially a centile value and represents the area under the normal distribution below the median of the interval assigned to the object.
From the normal curve tables we find corresponding z values to represent linear distances from the mean on the base line.
Since z values are awkward numbers to use, we make a liner transformation to values of a convenient type (Guilford, 1954). For this purpose, Hull (1928) proposed a ‘C’ scale of 10 units covering a range of 5 standard deviations.<br>
From the normal curve tables we find corresponding z values to represent linear distances from the mean on the base line.
Since z values are awkward numbers to use, we make a liner transformation to values of a convenient type (Guilford, 1954). For this purpose, Hull (1928) proposed a ‘C’ scale of 10 units covering a range of 5 standard deviations.<br>
40
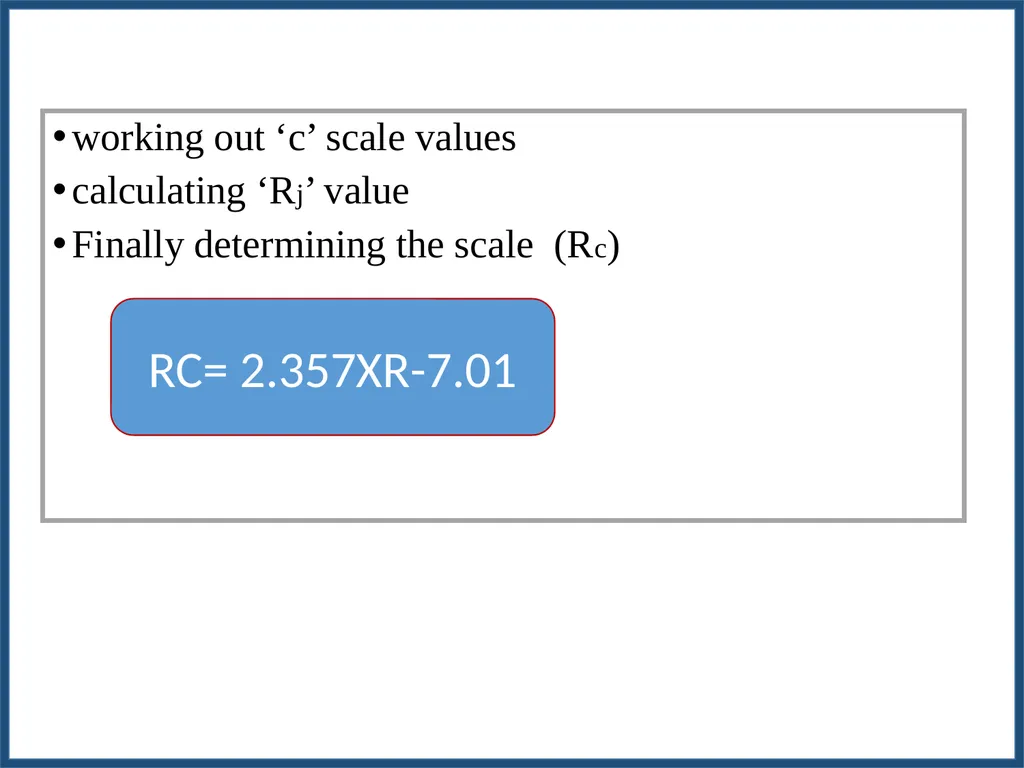
working out ‘c’ scale values
calculating ‘Rj’ value
Finally determining the scale (Rc) RC= 2.357XR-7.01<br>
calculating ‘Rj’ value
Finally determining the scale (Rc) RC= 2.357XR-7.01<br>
41
Scales developed in Social Science Research<br>
42
Narayana Gowda
(1992) 1. Consequences of watershed Development Programme: An Analysis of Chitravati Watershed Project in Karnataka<br>
(1992) 1. Consequences of watershed Development Programme: An Analysis of Chitravati Watershed Project in Karnataka<br>
43
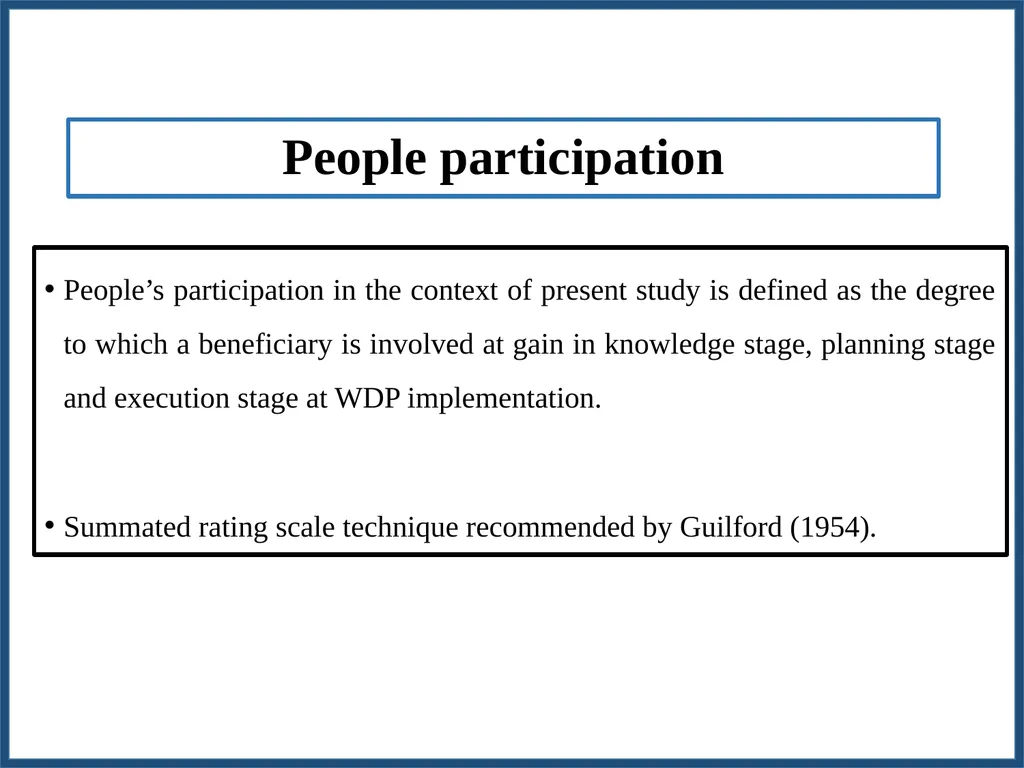
People participation People’s participation in the context of present study is defined as the degree to which a beneficiary is involved at gain in knowledge stage, planning stage and execution stage at WDP implementation.
Summated rating scale technique recommended by Guilford (1954).<br>
Summated rating scale technique recommended by Guilford (1954).<br>
44
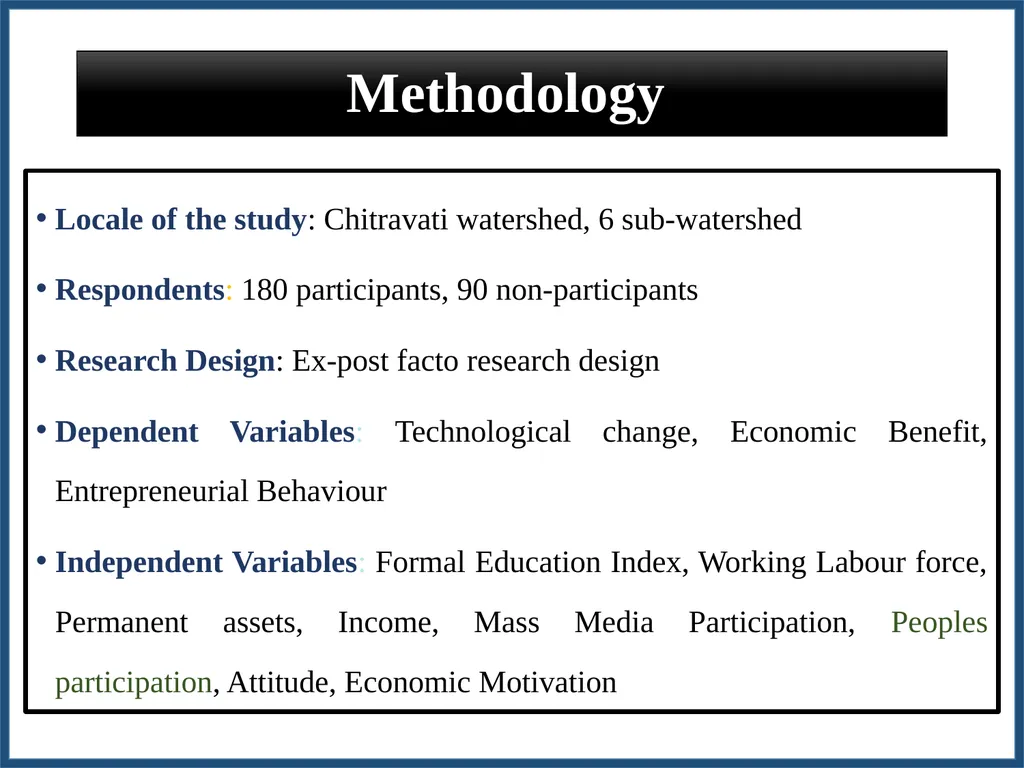
Methodology Locale of the study: Chitravati watershed, 6 sub-watershed
Respondents: 180 participants, 90 non-participants
Research Design: Ex-post facto research design
Dependent Variables: Technological change, Economic Benefit, Entrepreneurial Behaviour
Independent Variables: Formal Education Index, Working Labour force, Permanent assets, Income, Mass Media Participation, Peoples participation, Attitude, Economic Motivation<br>
Respondents: 180 participants, 90 non-participants
Research Design: Ex-post facto research design
Dependent Variables: Technological change, Economic Benefit, Entrepreneurial Behaviour
Independent Variables: Formal Education Index, Working Labour force, Permanent assets, Income, Mass Media Participation, Peoples participation, Attitude, Economic Motivation<br>
45
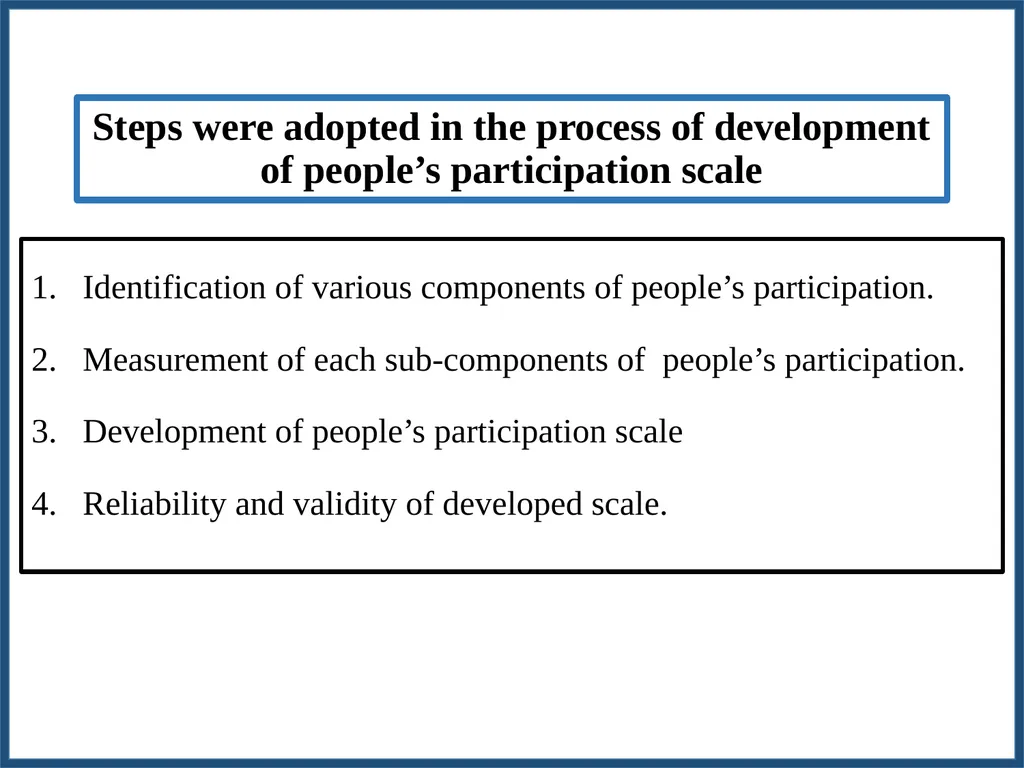
Steps were adopted in the process of development of people’s participation scale Identification of various components of people’s participation.
Measurement of each sub-components of people’s participation.
Development of people’s participation scale
Reliability and validity of developed scale.<br>
Measurement of each sub-components of people’s participation.
Development of people’s participation scale
Reliability and validity of developed scale.<br>
46
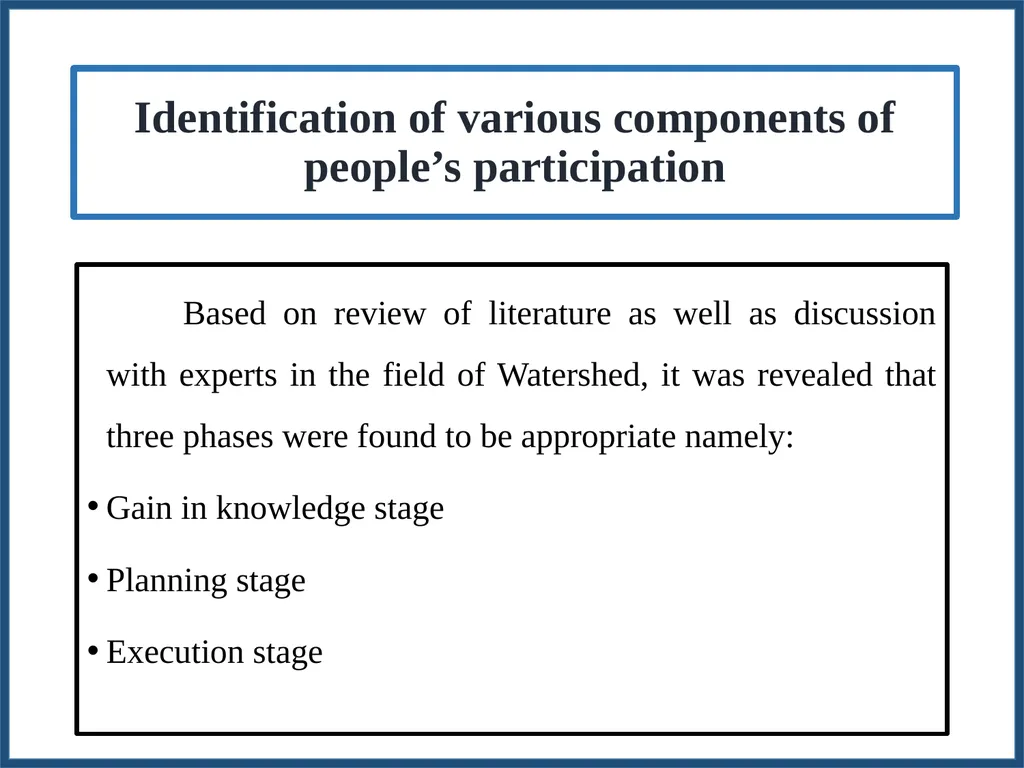
Identification of various components of people’s participation Based on review of literature as well as discussion with experts in the field of Watershed, it was revealed that three phases were found to be appropriate namely:
Gain in knowledge stage
Planning stage
Execution stage<br>
Gain in knowledge stage
Planning stage
Execution stage<br>
47
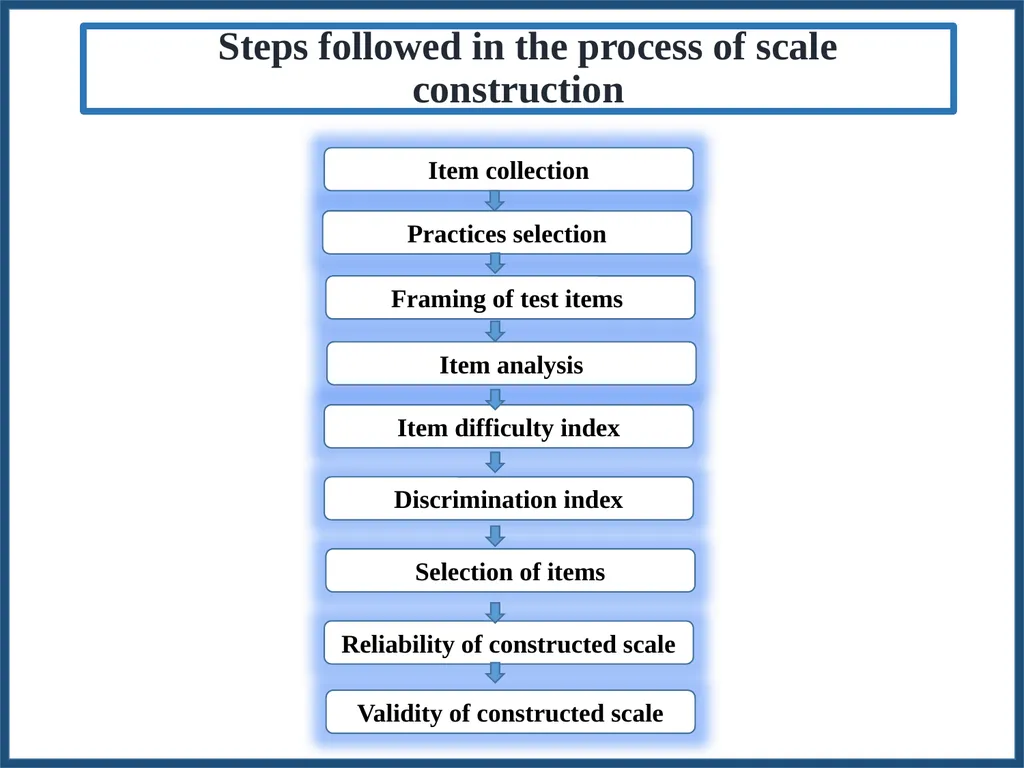
Steps followed in the process of scale construction Item collection Practices selection Framing of test items Item analysis Item difficulty index Discrimination index Selection of items Reliability of constructed scale Validity of constructed scale<br>
48
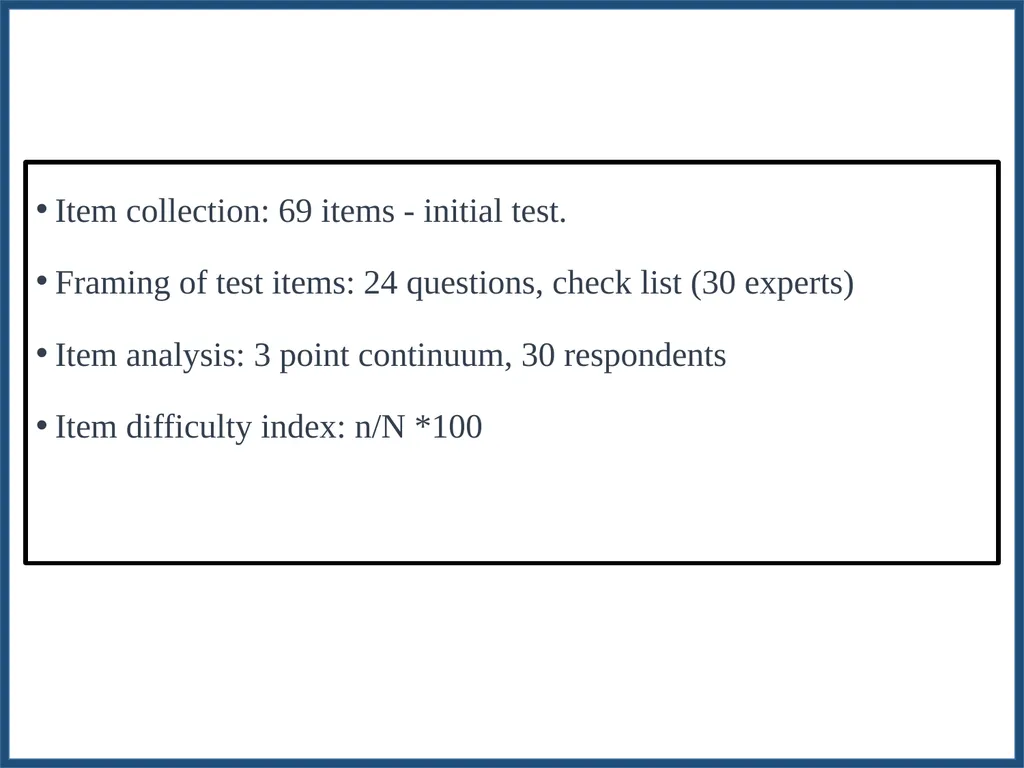
Item collection: 69 items - initial test.
Framing of test items: 24 questions, check list (30 experts)
Item analysis: 3 point continuum, 30 respondents
Item difficulty index: n/N *100<br>
Framing of test items: 24 questions, check list (30 experts)
Item analysis: 3 point continuum, 30 respondents
Item difficulty index: n/N *100<br>
49
2. A Study on Mushroom Entrepreneurship and Consumer Behaviour in Karnataka Mahantesh Shirur
(2015)<br>
(2015)<br>
50
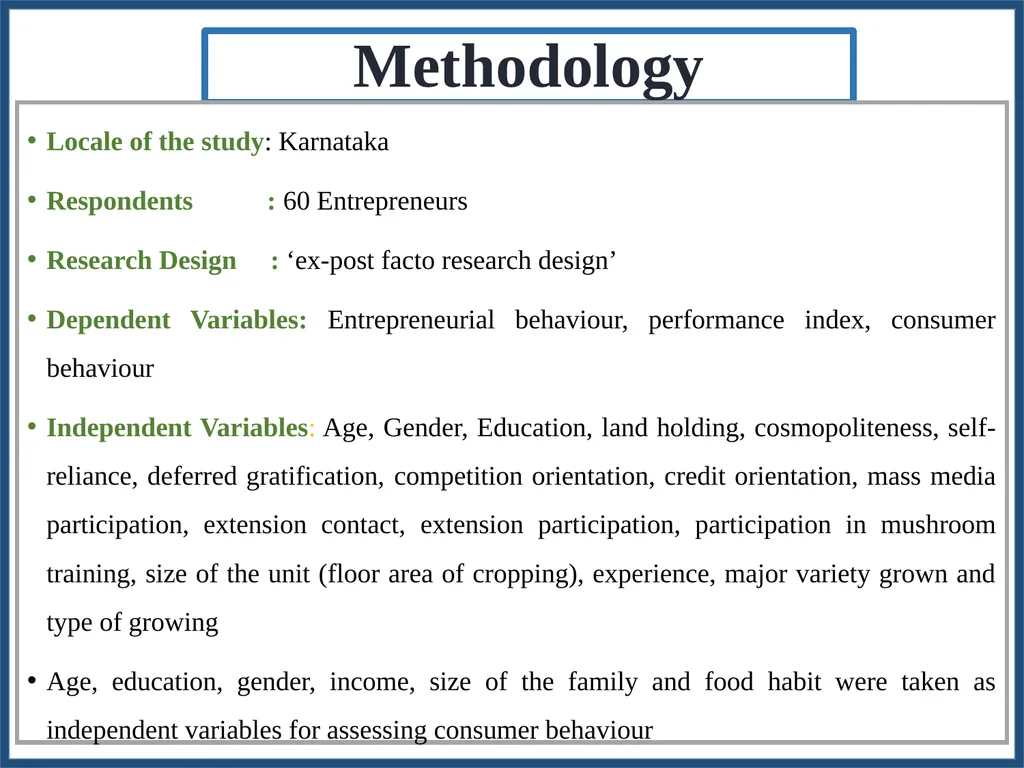
Methodology Locale of the study: Karnataka
Respondents : 60 Entrepreneurs
Research Design : ‘ex-post facto research design’
Dependent Variables: Entrepreneurial behaviour, performance index, consumer behaviour
Independent Variables: Age, Gender, Education, land holding, cosmopoliteness, self-reliance, deferred gratification, competition orientation, credit orientation, mass media participation, extension contact, extension participation, participation in mushroom training, size of the unit (floor area of cropping), experience, major variety grown and type of growing
Age, education, gender, income, size of the family and food habit were taken as independent variables for assessing consumer behaviour<br>
Respondents : 60 Entrepreneurs
Research Design : ‘ex-post facto research design’
Dependent Variables: Entrepreneurial behaviour, performance index, consumer behaviour
Independent Variables: Age, Gender, Education, land holding, cosmopoliteness, self-reliance, deferred gratification, competition orientation, credit orientation, mass media participation, extension contact, extension participation, participation in mushroom training, size of the unit (floor area of cropping), experience, major variety grown and type of growing
Age, education, gender, income, size of the family and food habit were taken as independent variables for assessing consumer behaviour<br>
51
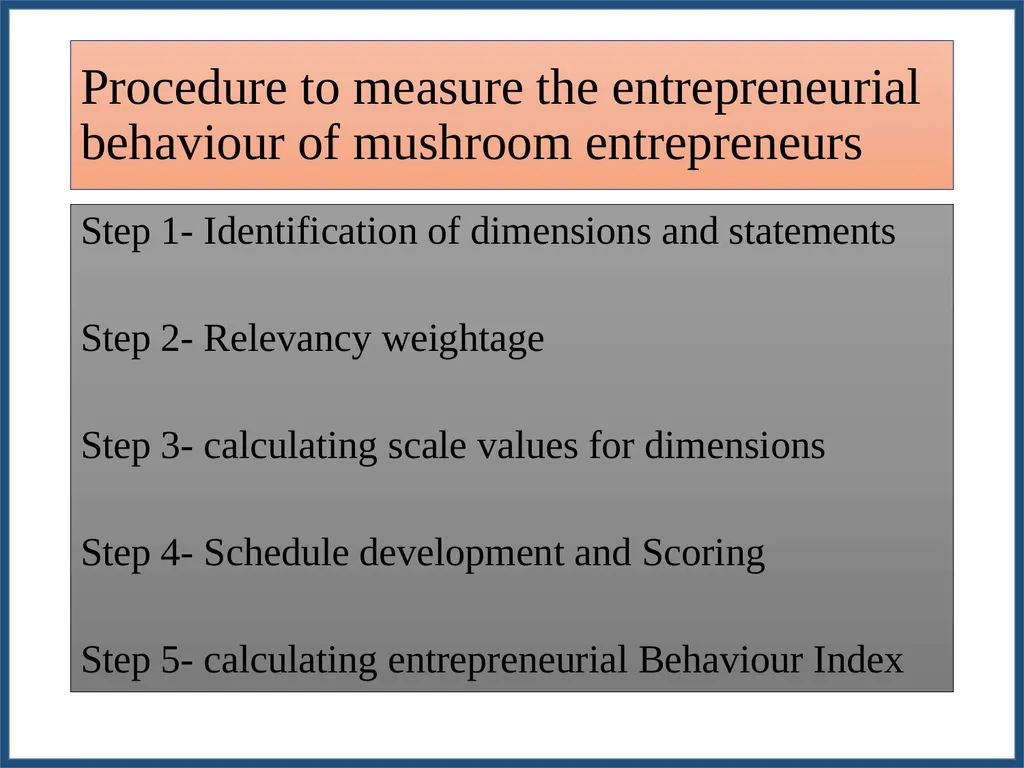
Procedure to measure the entrepreneurial behaviour of mushroom entrepreneurs Step 1- Identification of dimensions and statements
Step 2- Relevancy weightage
Step 3- calculating scale values for dimensions
Step 4- Schedule development and Scoring
Step 5- calculating entrepreneurial Behaviour Index<br>
Step 2- Relevancy weightage
Step 3- calculating scale values for dimensions
Step 4- Schedule development and Scoring
Step 5- calculating entrepreneurial Behaviour Index<br>
52
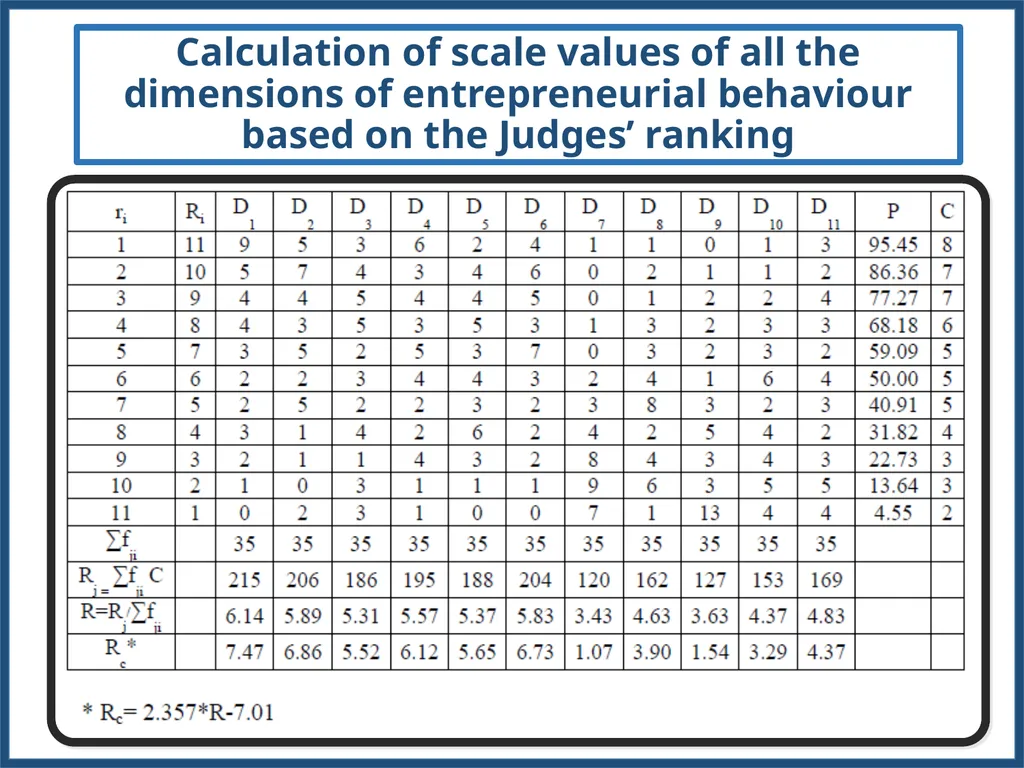
Calculation of scale values of all the dimensions of entrepreneurial behaviour based on the Judges’ ranking<br>
53
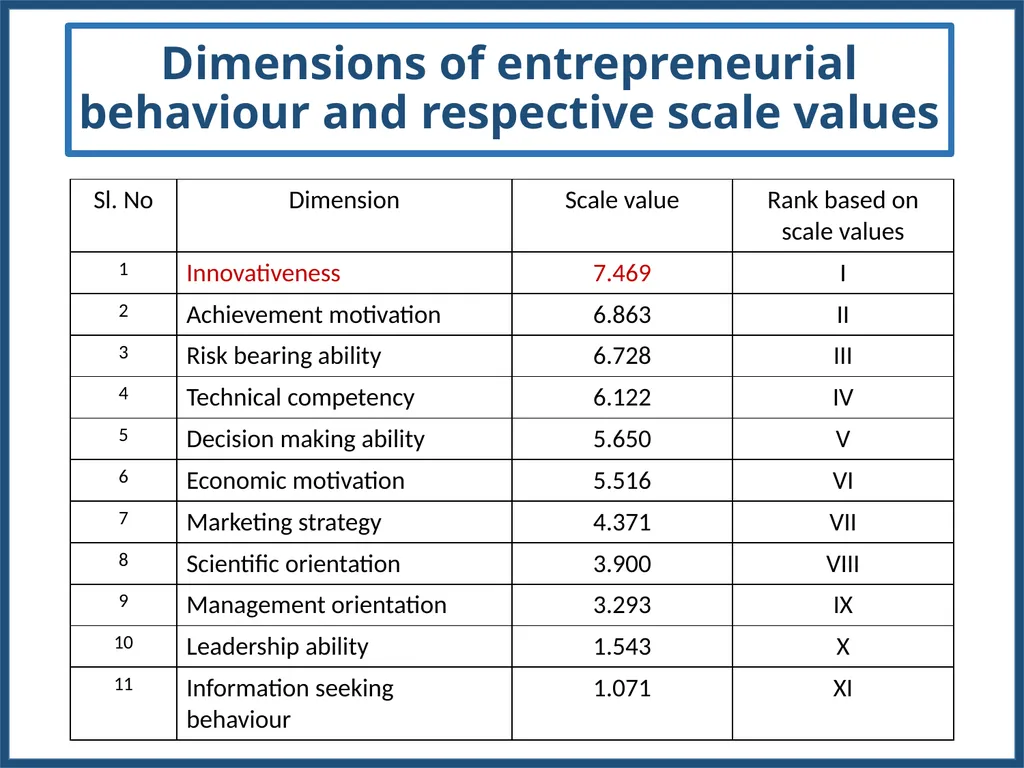
Dimensions of entrepreneurial behaviour and respective scale values<br>
54
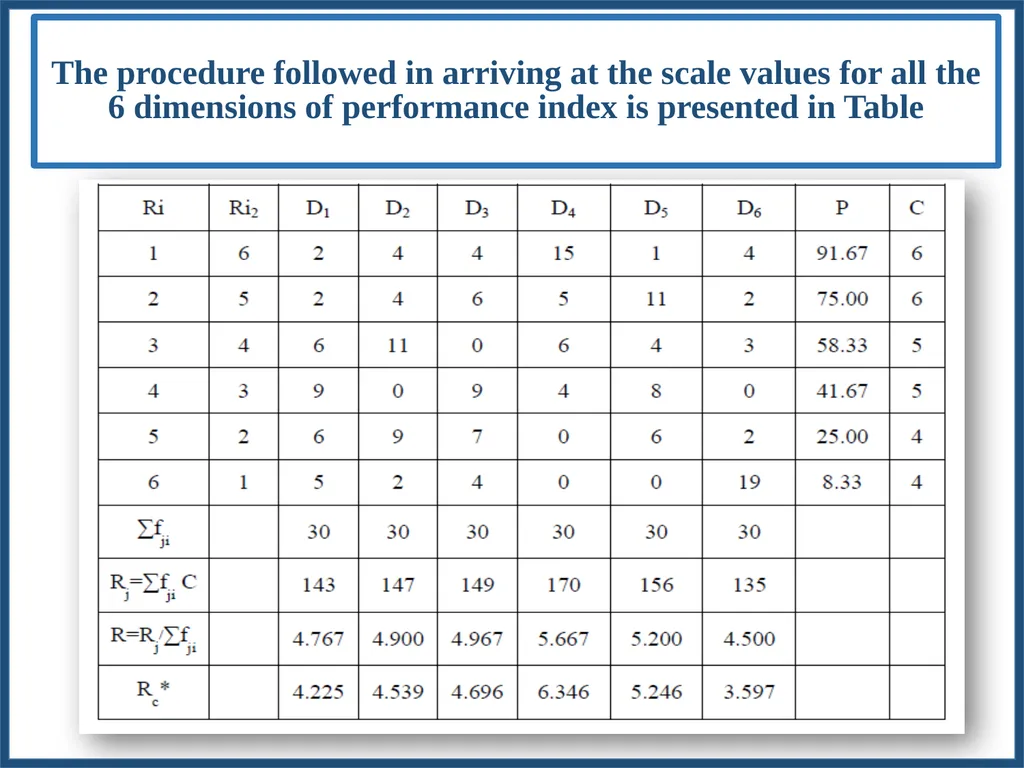
The procedure followed in arriving at the scale values for all the 6 dimensions of performance index is presented in Table<br>
55
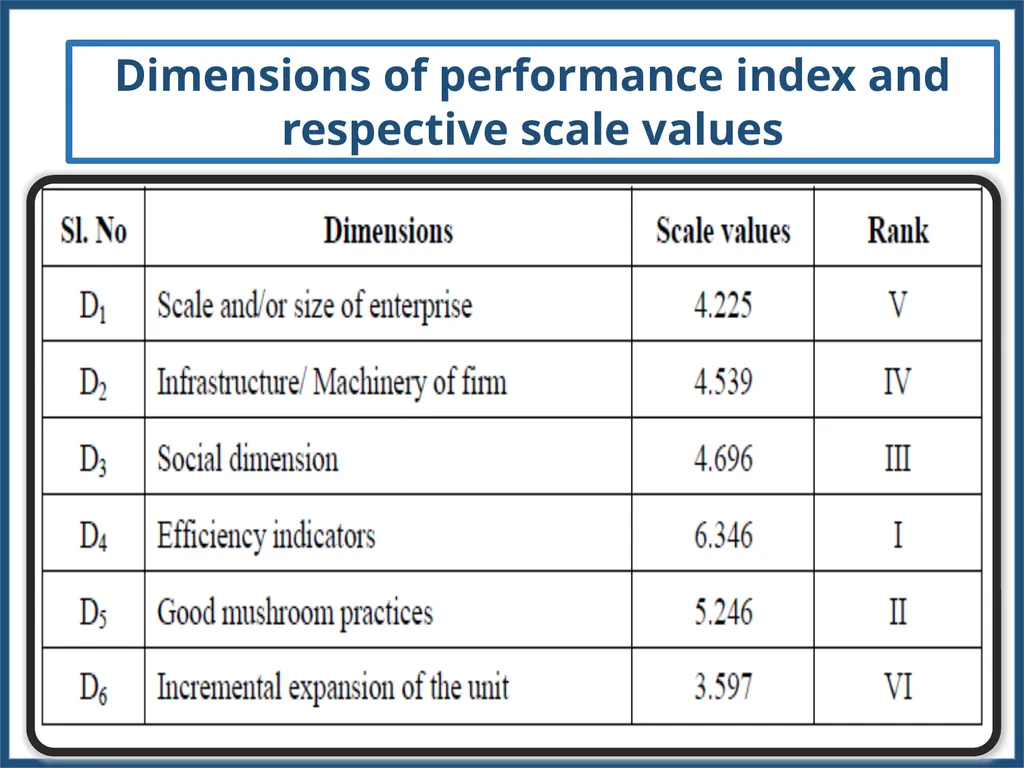
Dimensions of performance index and respective scale values<br>
56
Conclusion<br>