
Module 16: Price Index Session V 2 Contents –
Description: Module 16: Price Index Session V 2 Contents Session V Construction of Price Index Part II General Procedure of Index Aggregation Choice of base period General Procedure of Index Aggregation Computation of price relatives Computation of
Related Topics
Download Presentation
"Module 16: Price Index Session V 2 Contents –" is the property of its rightful owner. Permission is granted to download and print the materials on this website for personal, non-commercial use only, and to display it on your personal computer provided you do not modify the materials and that you retain all copyright notices contained in the materials. By downloading content from our website, you accept the terms of this agreement.
Presentation Transcript
slide1. Module 16: Price Index Session V<br>
slide2. 2 Contents – Session V Construction of Price Index – Part II
General Procedure of Index Aggregation
Choice of base period<br>
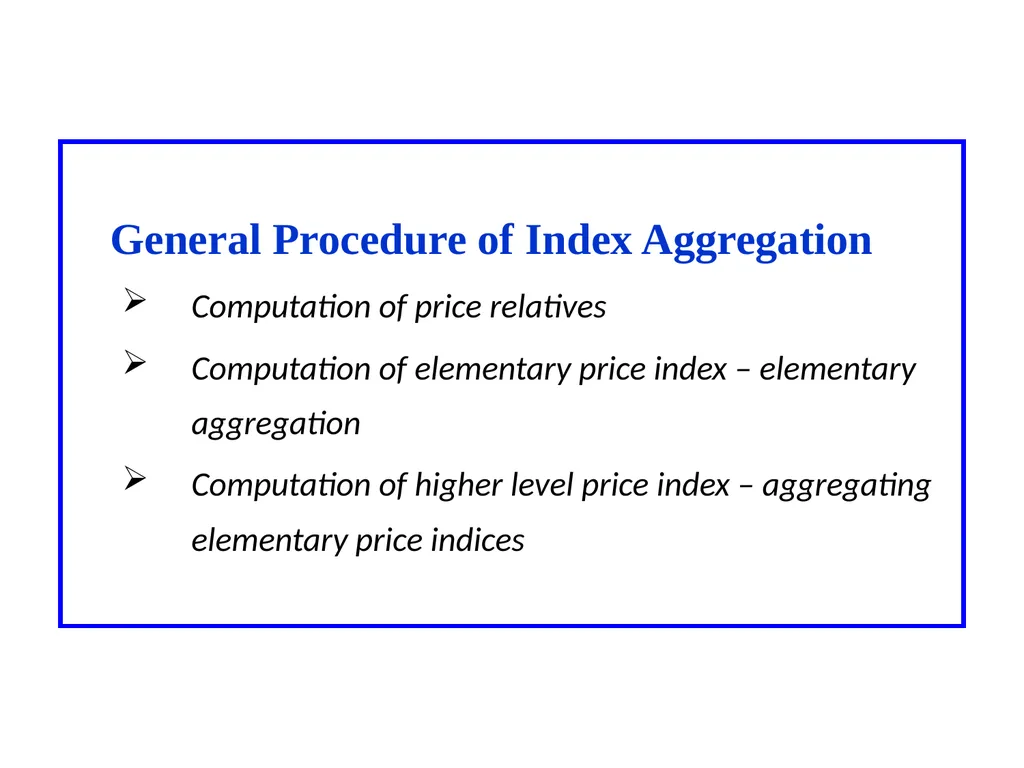
slide3. General Procedure of Index Aggregation
Computation of price relatives
Computation of elementary price index – elementary aggregation
Computation of higher level price index – aggregating elementary price indices<br>
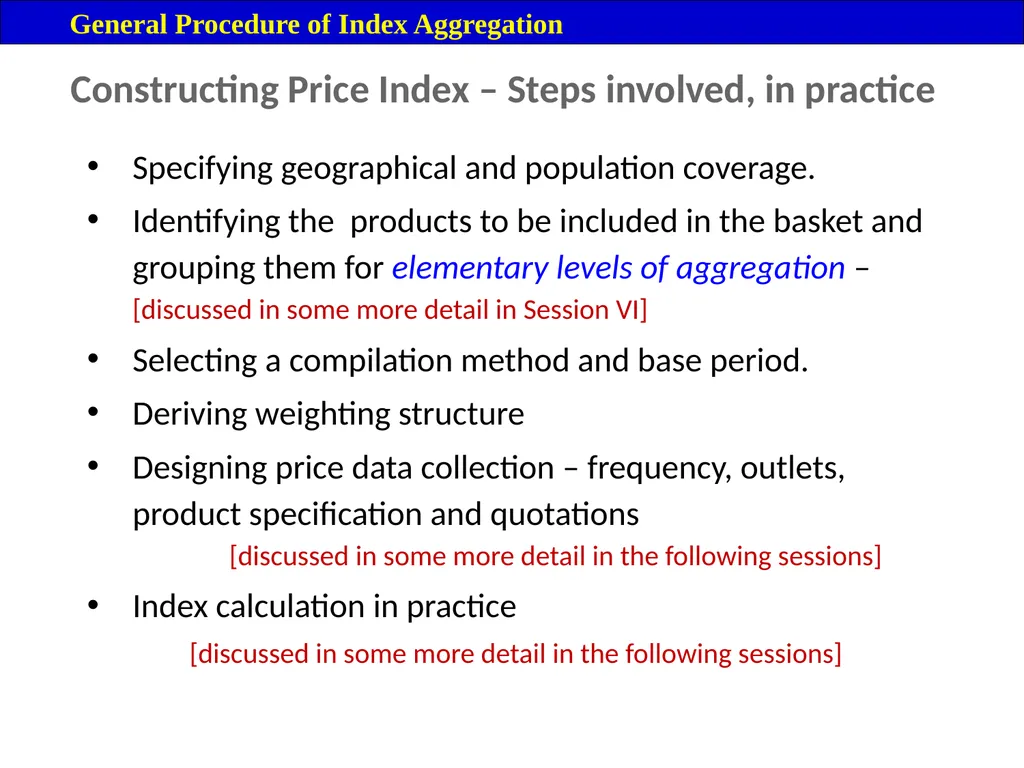
slide4. Constructing Price Index – Steps involved, in practice Specifying geographical and population coverage.
Identifying the products to be included in the basket and grouping them for elementary levels of aggregation – [discussed in some more detail in Session VI]
Selecting a compilation method and base period.
Deriving weighting structure
Designing price data collection – frequency, outlets, product specification and quotations
[discussed in some more detail in the following sessions]
Index calculation in practice
[discussed in some more detail in the following sessions] General Procedure of Index Aggregation<br>
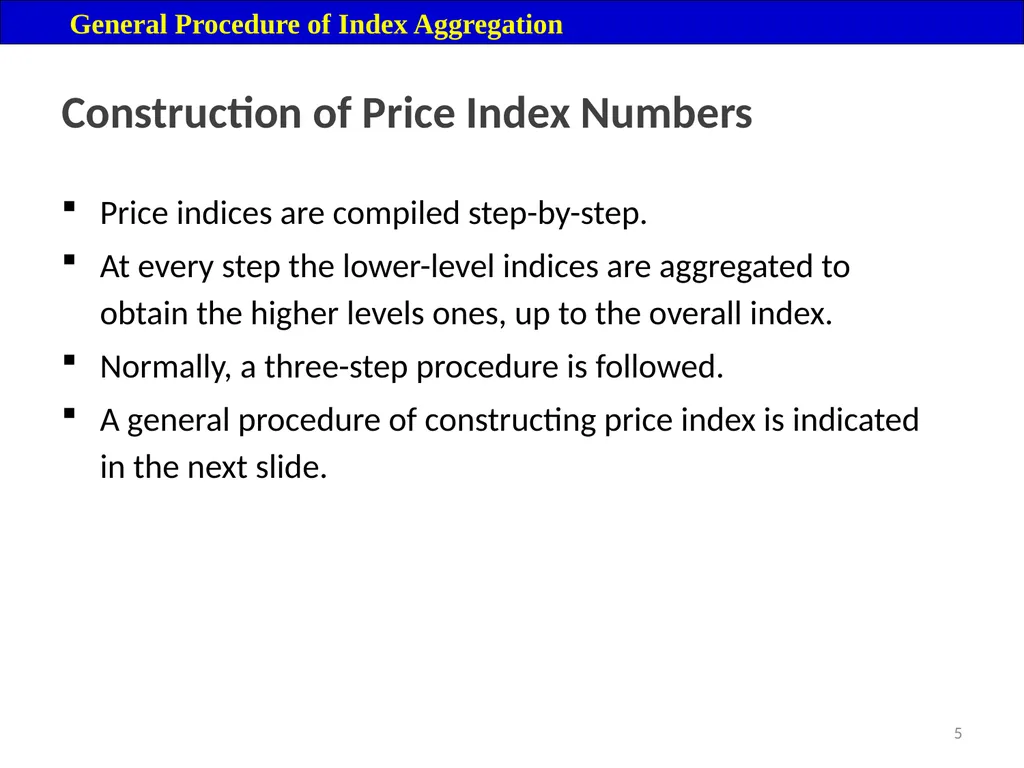
slide5. 5 Construction of Price Index Numbers Price indices are compiled step-by-step.
At every step the lower-level indices are aggregated to obtain the higher levels ones, up to the overall index.
Normally, a three-step procedure is followed.
A general procedure of constructing price index is indicated in the next slide. General Procedure of Index Aggregation<br>
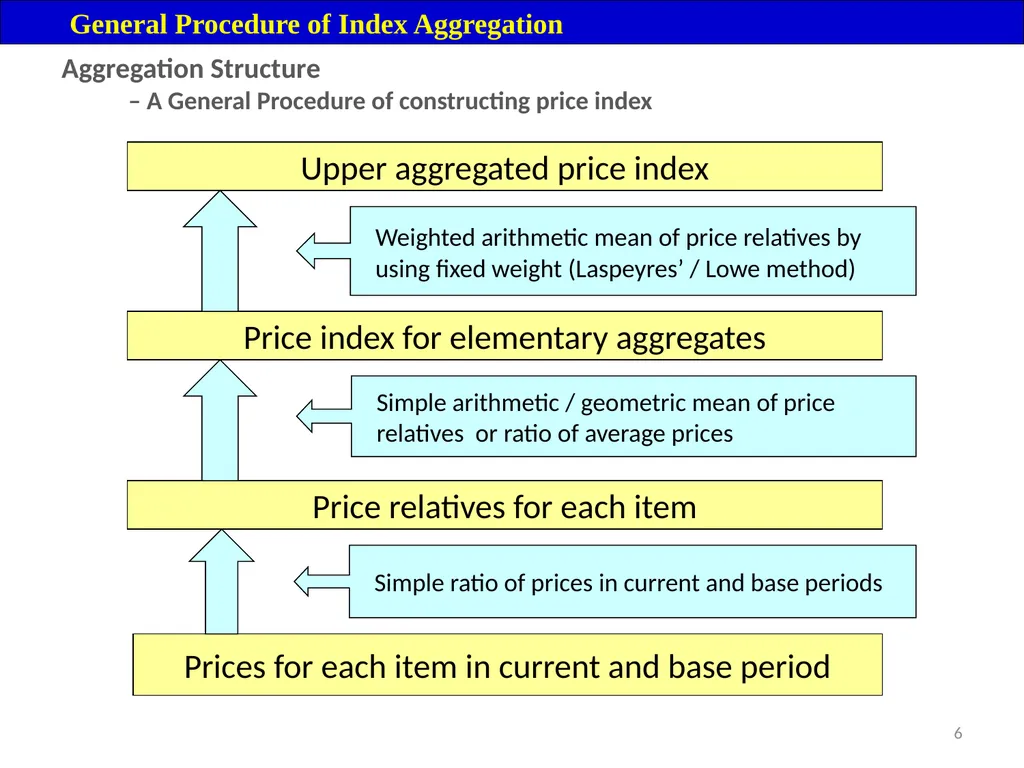
slide6. 6 Aggregation Structure – A General Procedure of constructing price index Price relatives for each item Price index for elementary aggregates Upper aggregated price index Simple arithmetic / geometric mean of price relatives or ratio of average prices Weighted arithmetic mean of price relatives by using fixed weight (Laspeyres’ / Lowe method) Prices for each item in current and base period Simple ratio of prices in current and base periods General Procedure of Index Aggregation<br>
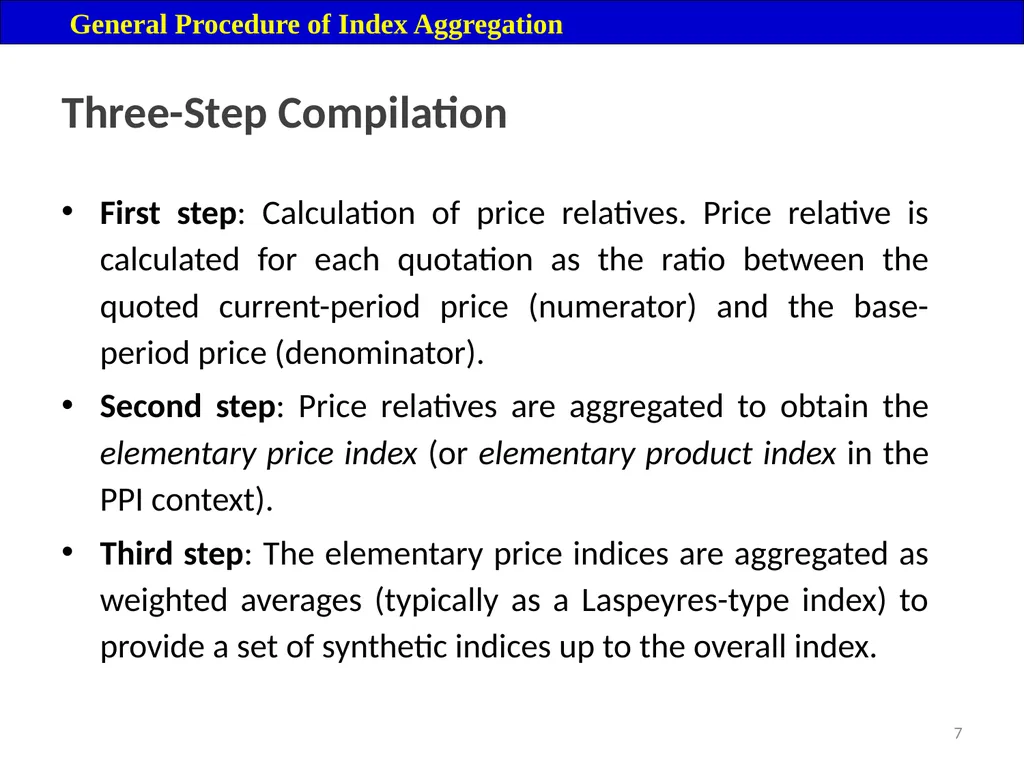
slide7. 7 Three-Step Compilation First step: Calculation of price relatives. Price relative is calculated for each quotation as the ratio between the quoted current-period price (numerator) and the base-period price (denominator).
Second step: Price relatives are aggregated to obtain the elementary price index (or elementary product index in the PPI context).
Third step: The elementary price indices are aggregated as weighted averages (typically as a Laspeyres-type index) to provide a set of synthetic indices up to the overall index. General Procedure of Index Aggregation<br>
slide8. 8 First Step – computation of price relatives Price quotations are first converted to ratios or price relatives, by dividing each current price by index-base price.
For each period a fixed number of price quotations for a group of specified products (according to product specification) constituting an elementary aggregate are collected.
The price relatives are calculated for each specified product as the ratio between the current period’s price and the base-period price. General Procedure of Index Aggregation<br>
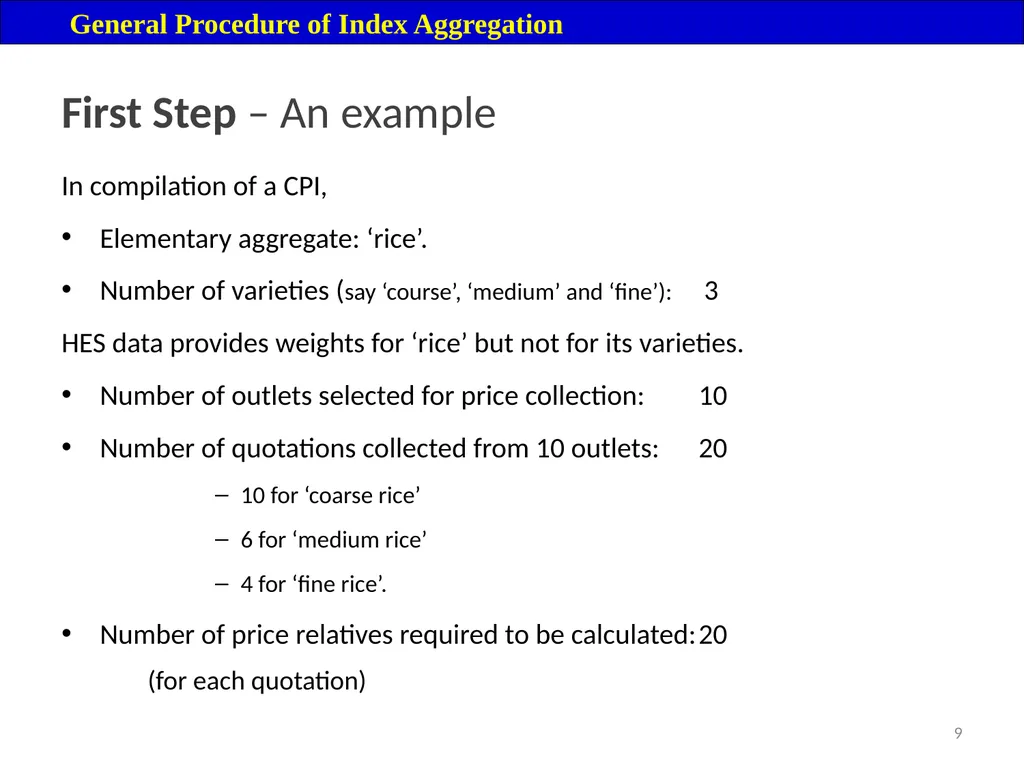
slide9. 9 First Step – An example In compilation of a CPI,
Elementary aggregate: ‘rice’.
Number of varieties (say ‘course’, ‘medium’ and ‘fine’): 3
HES data provides weights for ‘rice’ but not for its varieties.
Number of outlets selected for price collection: 10
Number of quotations collected from 10 outlets: 20
10 for ‘coarse rice’
6 for ‘medium rice’
4 for ‘fine rice’.
Number of price relatives required to be calculated: 20
(for each quotation) General Procedure of Index Aggregation<br>
slide10. 10 Second Step – computation of elementary index (1) The price relatives for each specified group of products – elementary aggregate (for CPI) and product index (for PPI) – are then aggregated to obtain the elementary price index.
The price index for an elementary aggregate is called an elementary price index.
Recall that an elementary aggregate is the lowest level of aggregation for which value data are available.
In our example of ‘rice’ in CPI compilation, all the price relatives for quotations collected for rice are combined, or aggregated, to obtain the elementary price index for ‘rice’. General Procedure of Index Aggregation<br>
slide11. 11 Second Step – computation of elementary index (2) Likewise, for PPI, prices for different types of transactions for a product are collected from an establishment.
The derived price relatives are combined to produce the product index for the establishment.
Again, weights for individual transactions are usually not available.
Thus, the establishment’s product index is computed as an unweighted average of the price relatives for different transactions. General Procedure of Index Aggregation<br>
slide12. 12 Second Step – computation of elementary index (3) The elementary price index or an establishment’s product index are compiled in several ways.
Mainly, two methods can be distinguished:
the weighted mean of price relatives.
the unweighted mean of price relatives.
We will discuss only the applications of formulas that do not use explicit weights, i.e. Dutot’s, Carli’s and Jevon’s. General Procedure of Index Aggregation<br>
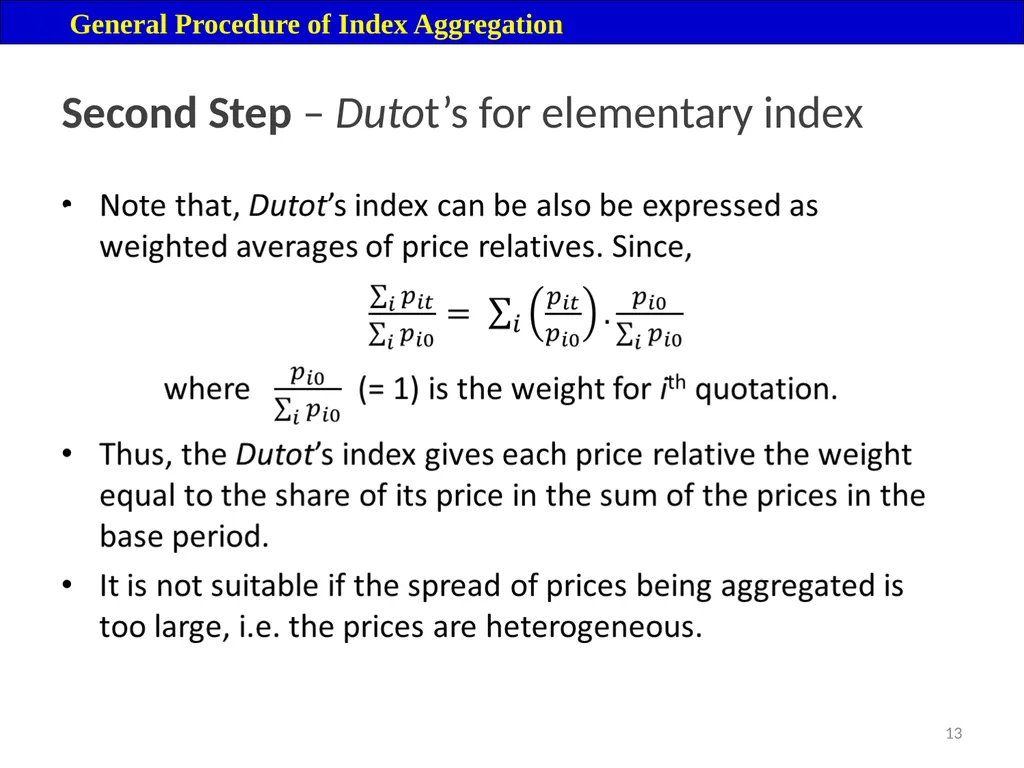
slide13. 13 Second Step – Dutot’s for elementary index General Procedure of Index Aggregation<br>
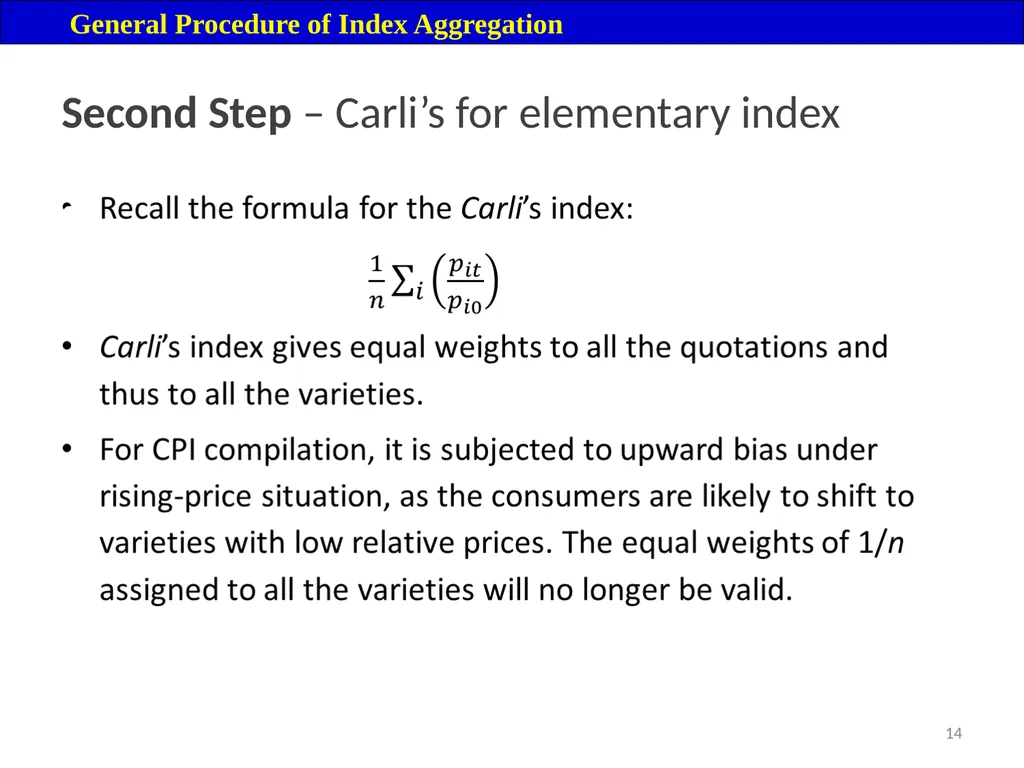
slide14. 14 Second Step – Carli’s for elementary index General Procedure of Index Aggregation<br>
slide15. 15 Second Step – Jevon’s for elementary index Jevon’s index is the geometric average of the price relatives – both calculations will yield the same results.
It is being introduced by more and more countries for calculation of elementary index.
The Jevon’s index gives each price relative the same (multiplicative) weights. General Procedure of Index Aggregation<br>
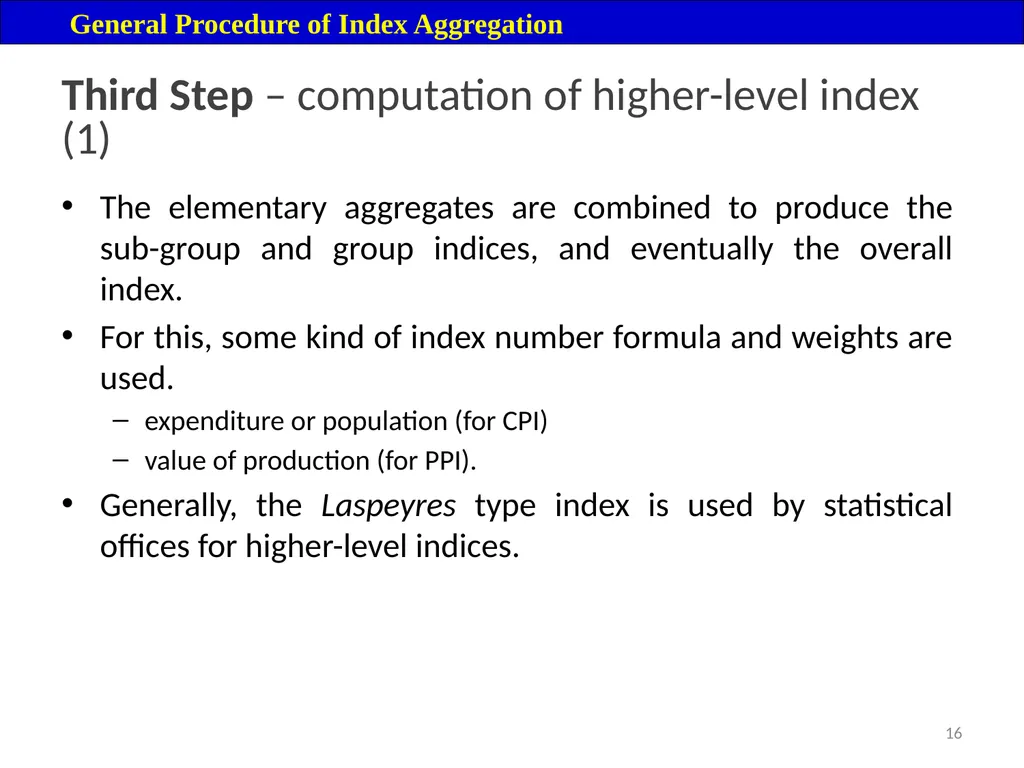
slide16. 16 Third Step – computation of higher-level index (1) The elementary aggregates are combined to produce the sub-group and group indices, and eventually the overall index.
For this, some kind of index number formula and weights are used.
expenditure or population (for CPI)
value of production (for PPI).
Generally, the Laspeyres type index is used by statistical offices for higher-level indices. General Procedure of Index Aggregation<br>
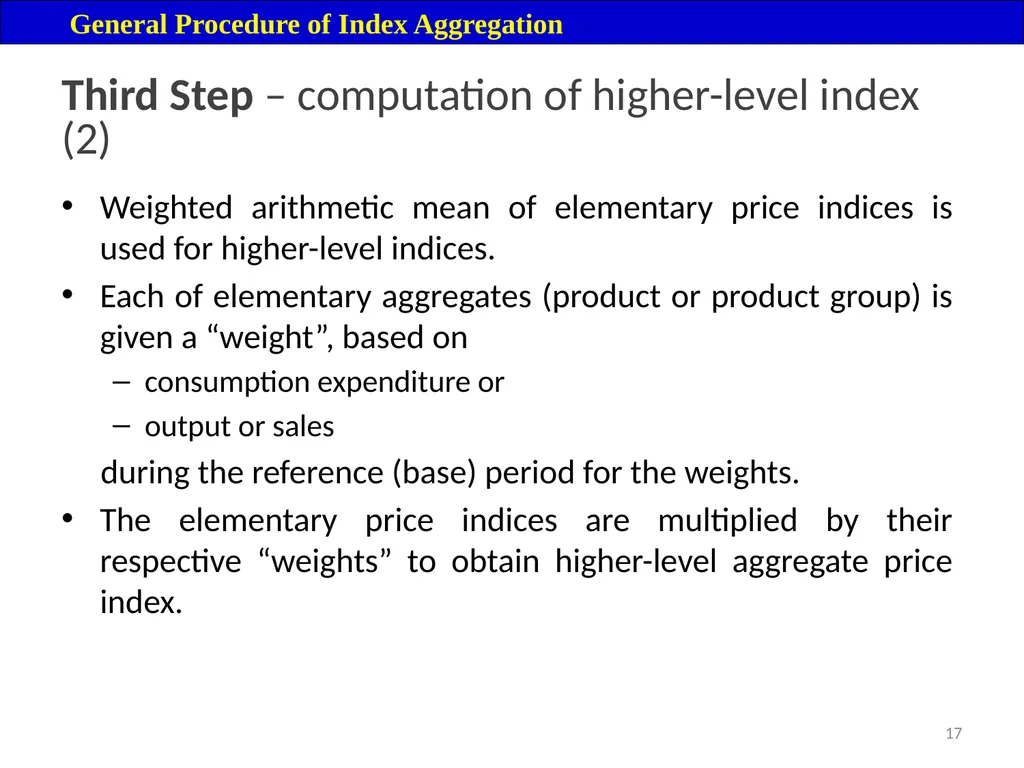
slide17. 17 Third Step – computation of higher-level index (2) Weighted arithmetic mean of elementary price indices is used for higher-level indices.
Each of elementary aggregates (product or product group) is given a “weight”, based on
consumption expenditure or
output or sales
during the reference (base) period for the weights.
The elementary price indices are multiplied by their respective “weights” to obtain higher-level aggregate price index. General Procedure of Index Aggregation<br>
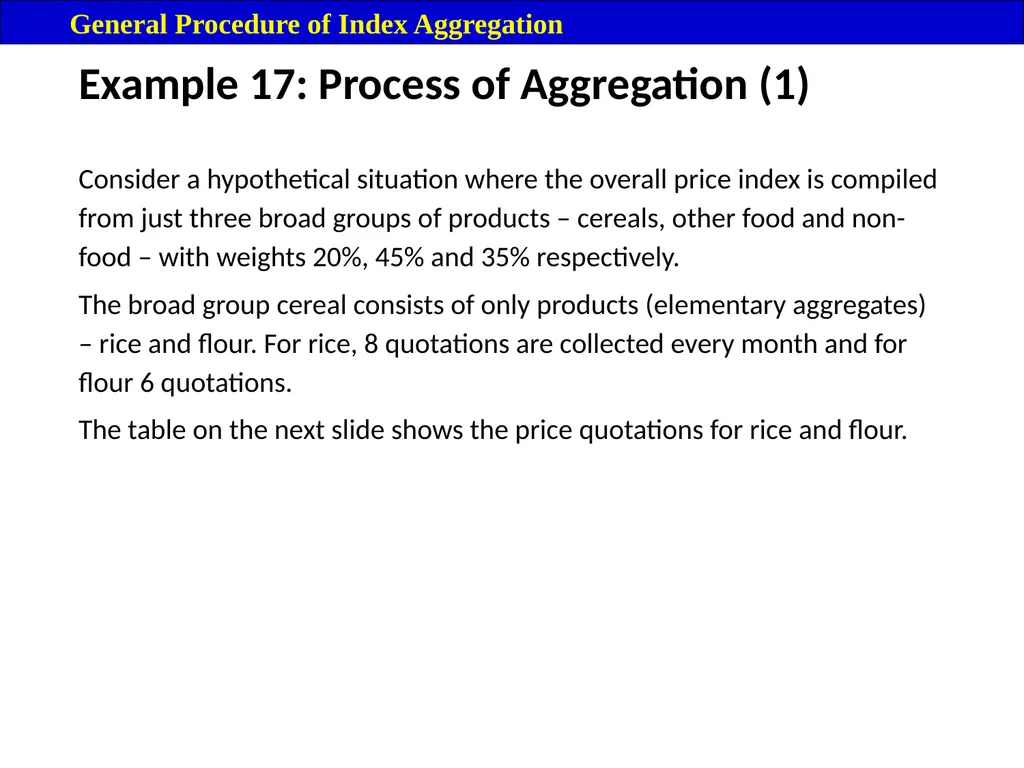
slide18. Example 17: Process of Aggregation (1) General Procedure of Index Aggregation Consider a hypothetical situation where the overall price index is compiled from just three broad groups of products – cereals, other food and non-food – with weights 20%, 45% and 35% respectively.
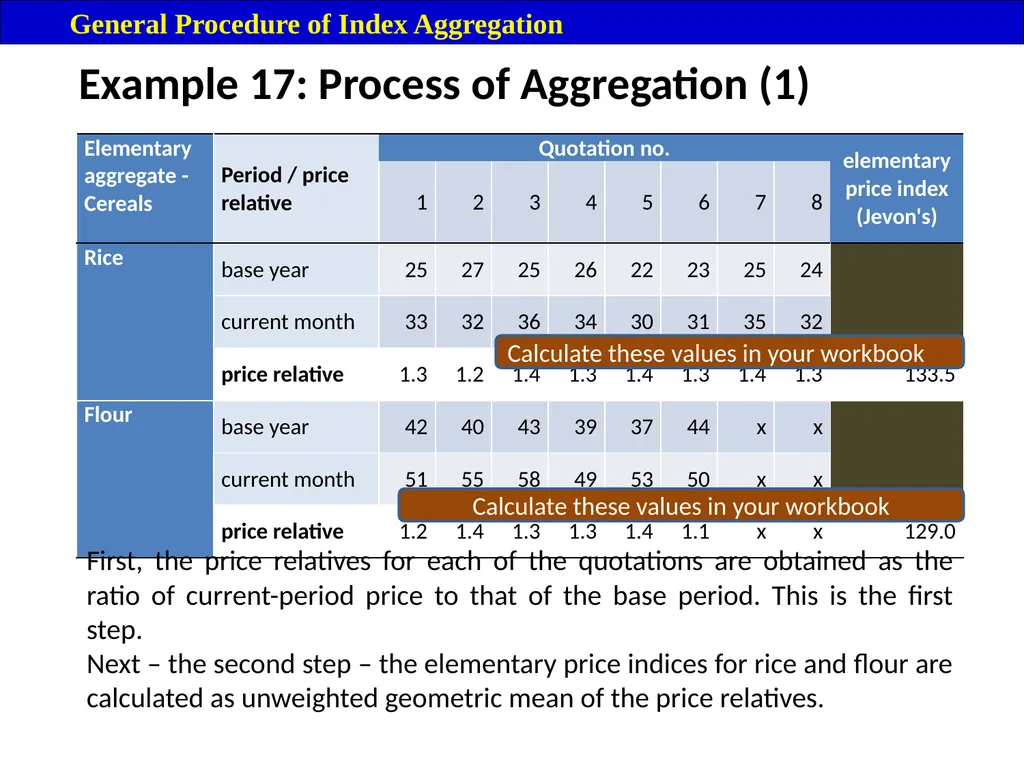
The broad group cereal consists of only products (elementary aggregates) – rice and flour. For rice, 8 quotations are collected every month and for flour 6 quotations.
The table on the next slide shows the price quotations for rice and flour.<br>
slide19. Example 17: Process of Aggregation (1) General Procedure of Index Aggregation Calculate these values in your workbook Calculate these values in your workbook First, the price relatives for each of the quotations are obtained as the ratio of current-period price to that of the base period. This is the first step.
Next – the second step – the elementary price indices for rice and flour are calculated as unweighted geometric mean of the price relatives.<br>
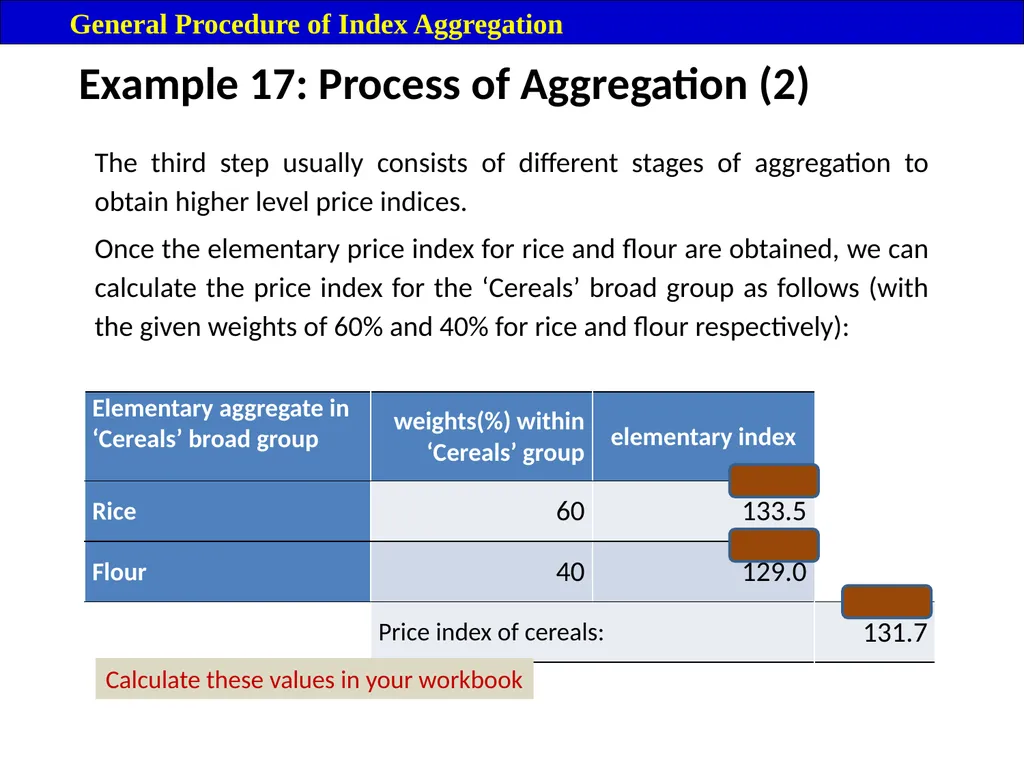
slide20. Example 17: Process of Aggregation (2) General Procedure of Index Aggregation The third step usually consists of different stages of aggregation to obtain higher level price indices.
Once the elementary price index for rice and flour are obtained, we can calculate the price index for the ‘Cereals’ broad group as follows (with the given weights of 60% and 40% for rice and flour respectively): Calculate these values in your workbook<br>
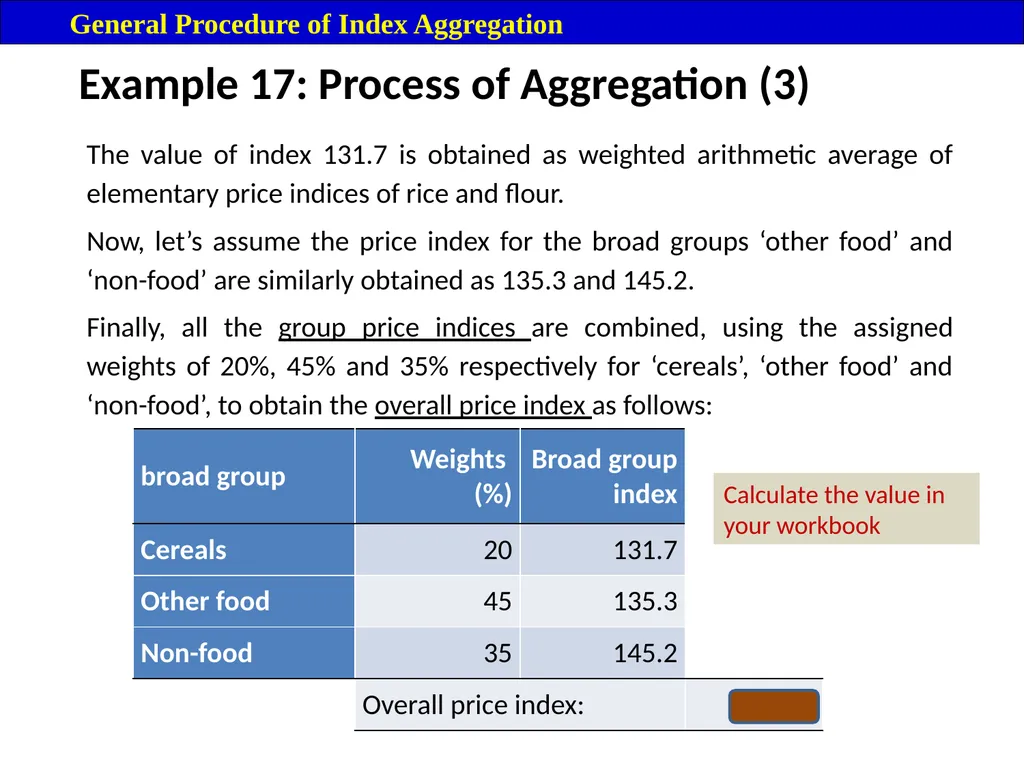
slide21. Example 17: Process of Aggregation (3) General Procedure of Index Aggregation The value of index 131.7 is obtained as weighted arithmetic average of elementary price indices of rice and flour.
Now, let’s assume the price index for the broad groups ‘other food’ and ‘non-food’ are similarly obtained as 135.3 and 145.2.
Finally, all the group price indices are combined, using the assigned weights of 20%, 45% and 35% respectively for ‘cereals’, ‘other food’ and ‘non-food’, to obtain the overall price index as follows: Calculate the value in your workbook<br>
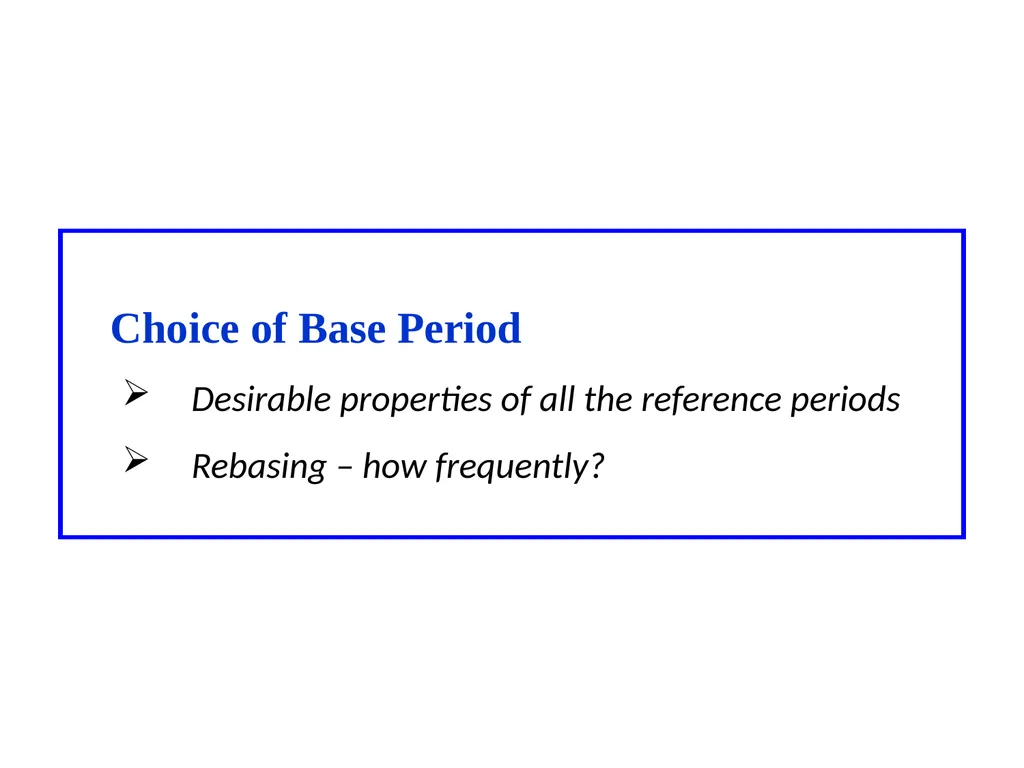
slide22. Choice of Base Period
Desirable properties of all the reference periods
Rebasing – how frequently?<br>
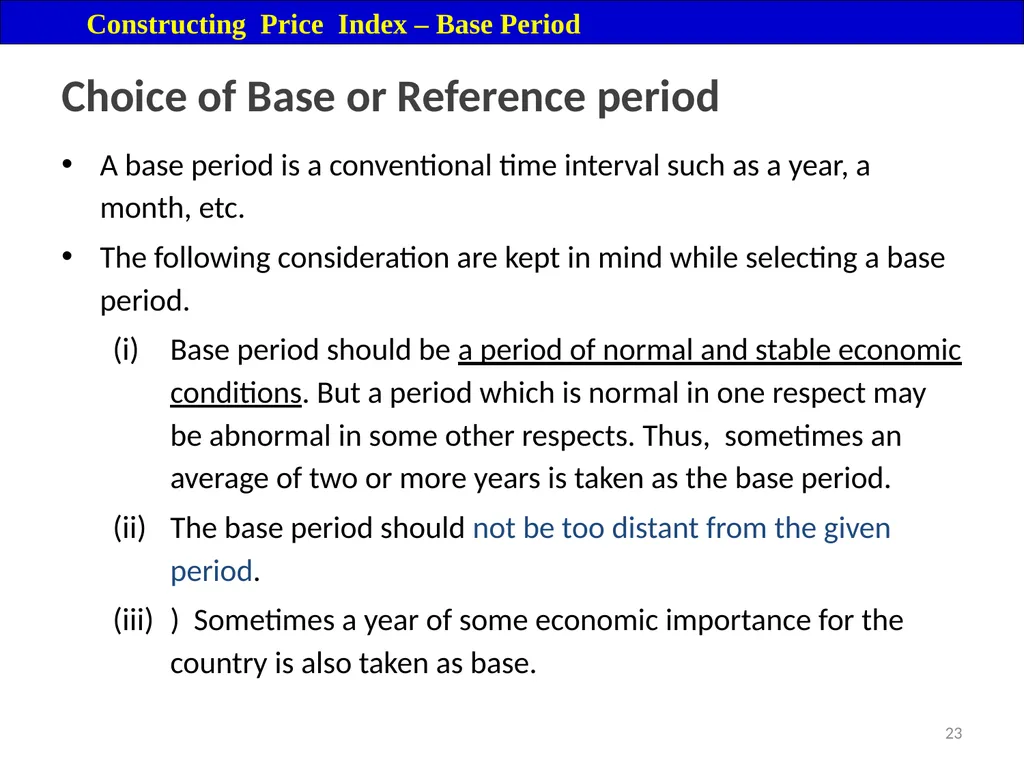
slide23. 23 Choice of Base or Reference period A base period is a conventional time interval such as a year, a month, etc.
The following consideration are kept in mind while selecting a base period.
Base period should be a period of normal and stable economic conditions. But a period which is normal in one respect may be abnormal in some other respects. Thus, sometimes an average of two or more years is taken as the base period.
The base period should not be too distant from the given period.
) Sometimes a year of some economic importance for the country is also taken as base. Constructing Price Index – Base Period<br>
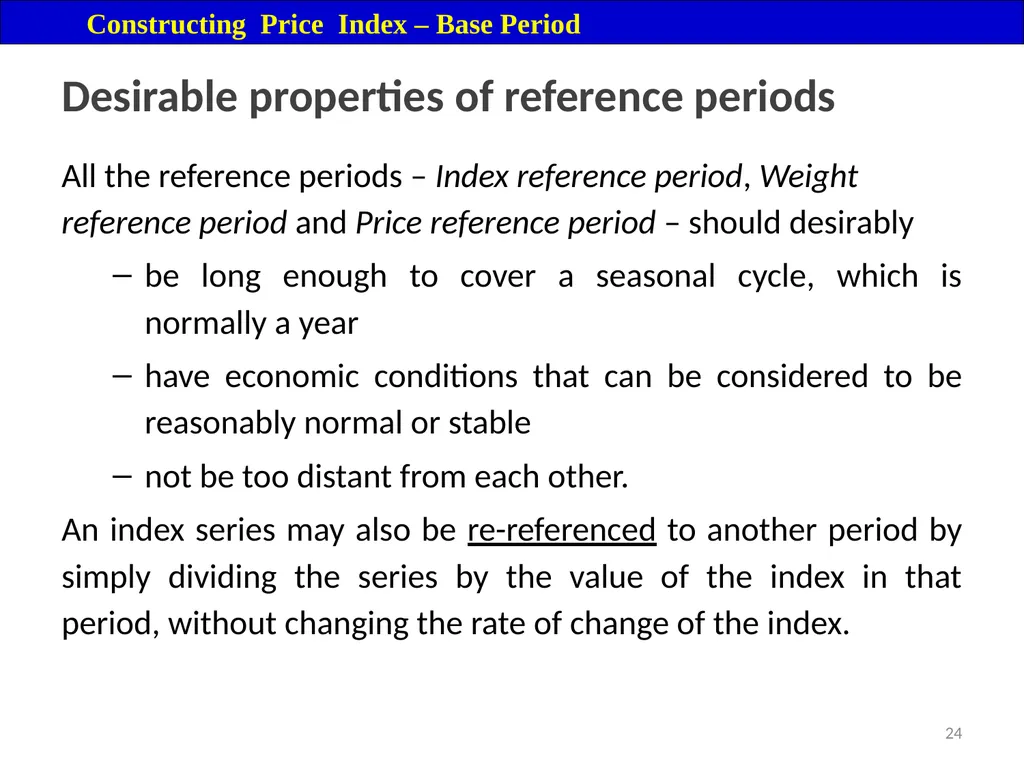
slide24. 24 Desirable properties of reference periods All the reference periods – Index reference period, Weight reference period and Price reference period – should desirably
be long enough to cover a seasonal cycle, which is normally a year
have economic conditions that can be considered to be reasonably normal or stable
not be too distant from each other.
An index series may also be re-referenced to another period by simply dividing the series by the value of the index in that period, without changing the rate of change of the index. Constructing Price Index – Base Period<br>
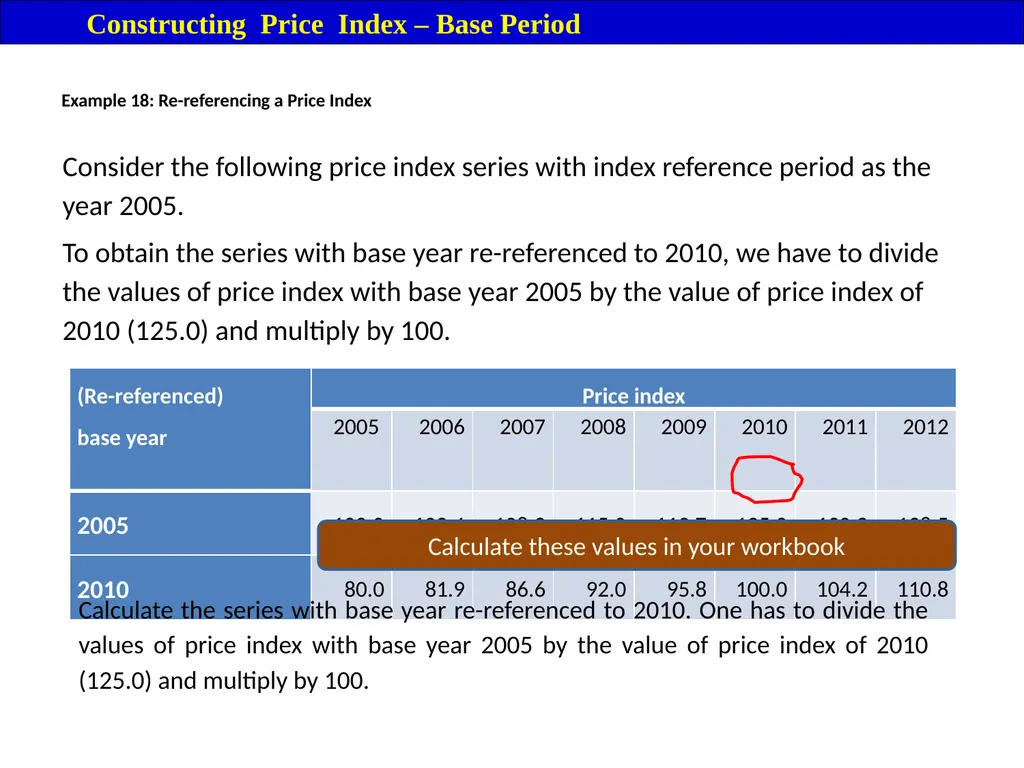
slide25. Example 18: Re-referencing a Price Index Constructing Price Index – Base Period Consider the following price index series with index reference period as the year 2005.
To obtain the series with base year re-referenced to 2010, we have to divide the values of price index with base year 2005 by the value of price index of 2010 (125.0) and multiply by 100. Calculate the series with base year re-referenced to 2010. One has to divide the values of price index with base year 2005 by the value of price index of 2010 (125.0) and multiply by 100. Calculate these values in your workbook<br>
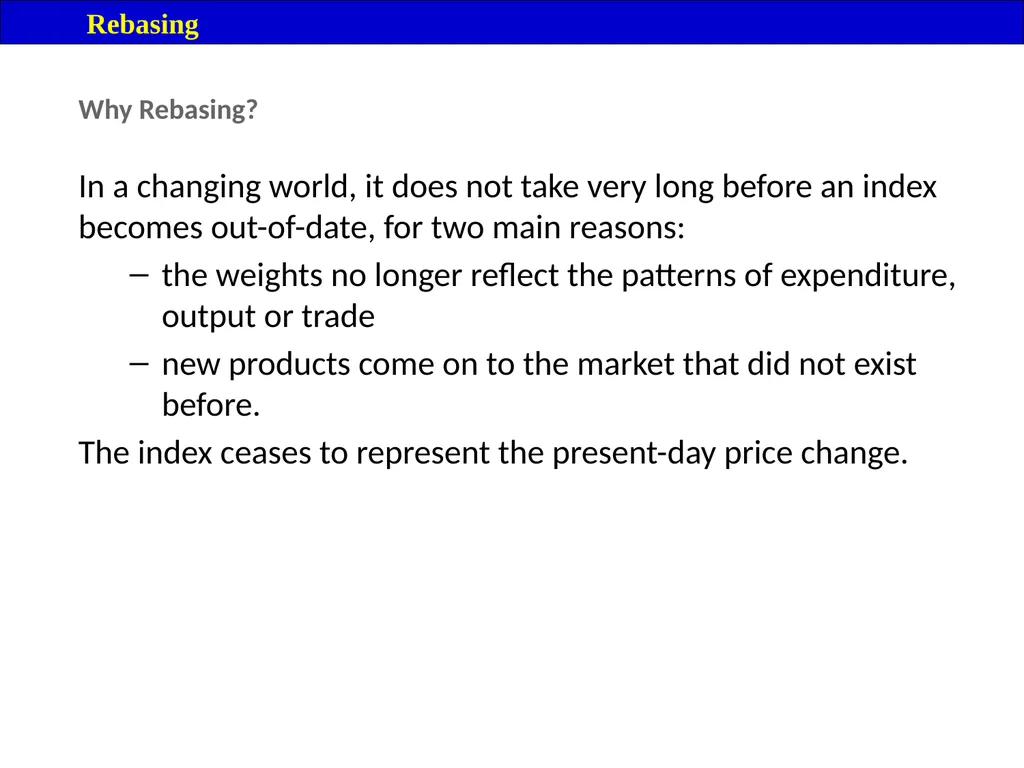
slide26. Why Rebasing? In a changing world, it does not take very long before an index becomes out-of-date, for two main reasons:
the weights no longer reflect the patterns of expenditure, output or trade
new products come on to the market that did not exist before.
The index ceases to represent the present-day price change. Rebasing<br>
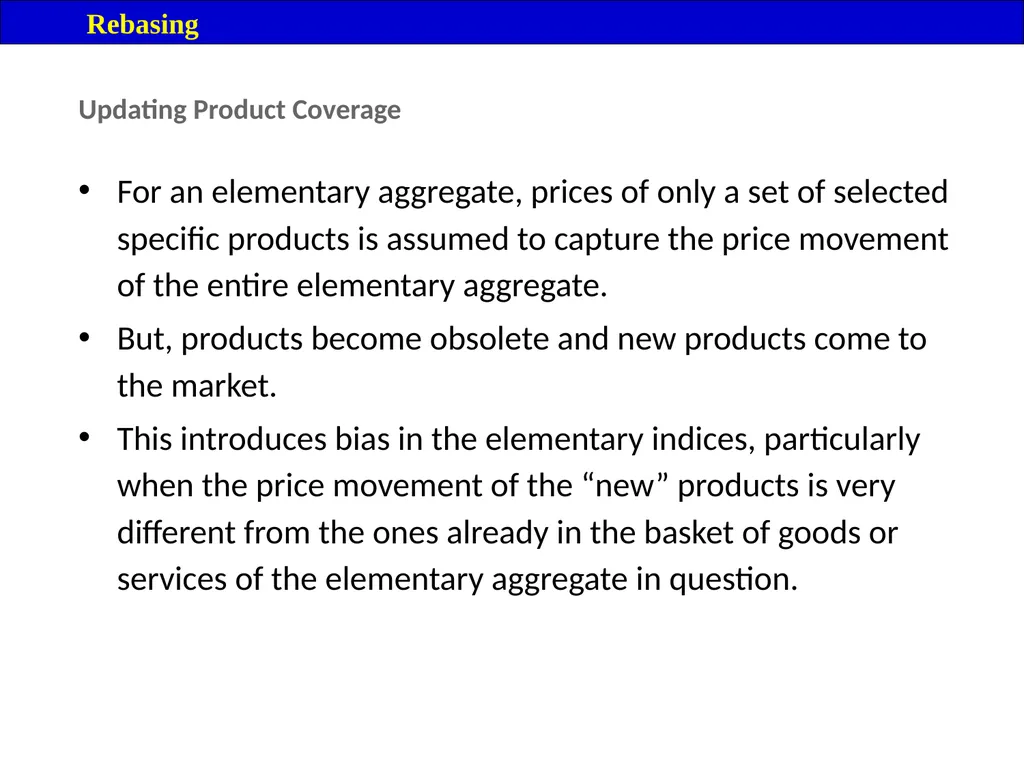
slide27. Updating Product Coverage For an elementary aggregate, prices of only a set of selected specific products is assumed to capture the price movement of the entire elementary aggregate.
But, products become obsolete and new products come to the market.
This introduces bias in the elementary indices, particularly when the price movement of the “new” products is very different from the ones already in the basket of goods or services of the elementary aggregate in question. Rebasing<br>
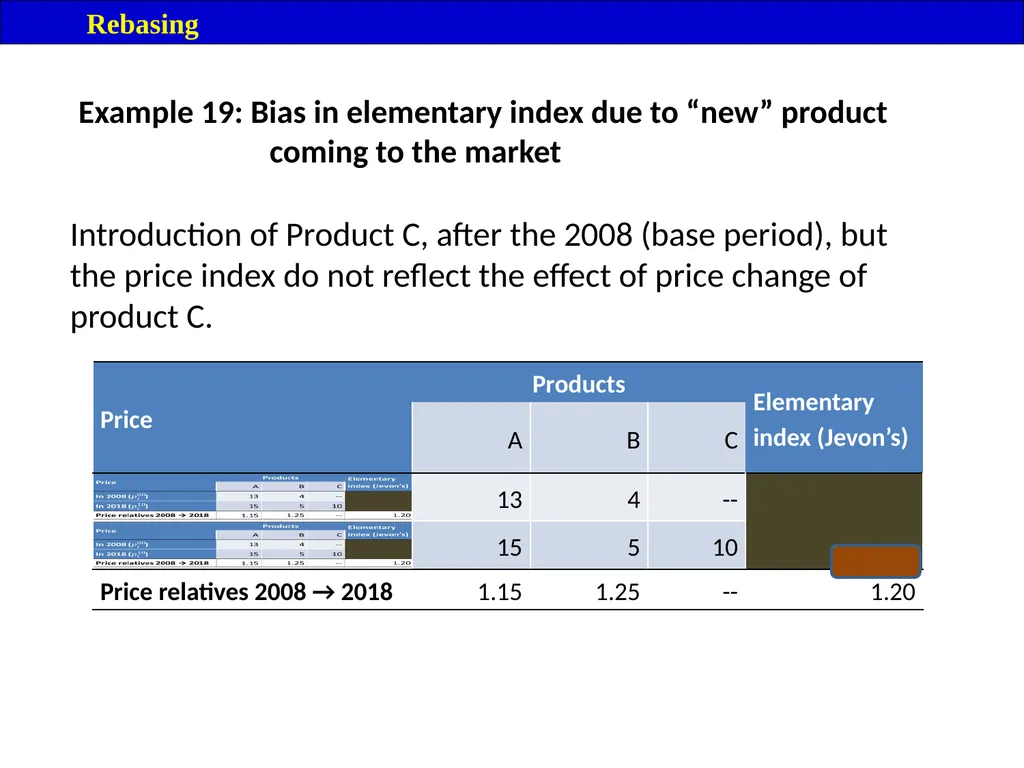
slide28. Example 19: Bias in elementary index due to “new” product coming to the market Introduction of Product C, after the 2008 (base period), but the price index do not reflect the effect of price change of product C. Rebasing<br>
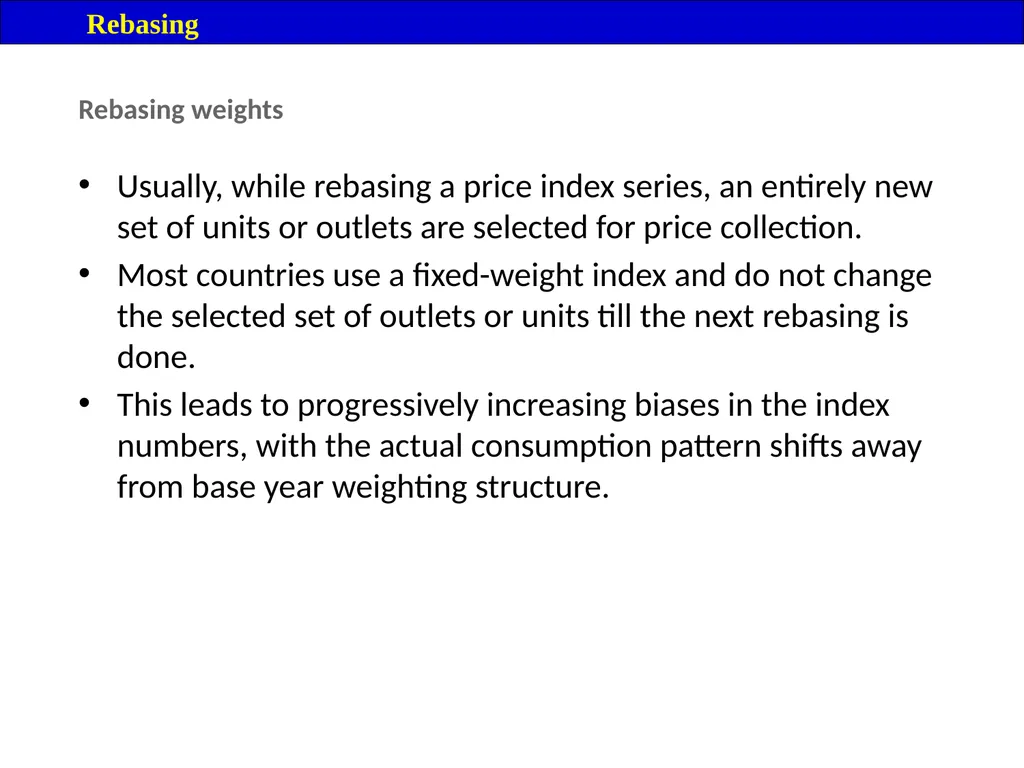
slide29. Rebasing weights Usually, while rebasing a price index series, an entirely new set of units or outlets are selected for price collection.
Most countries use a fixed-weight index and do not change the selected set of outlets or units till the next rebasing is done.
This leads to progressively increasing biases in the index numbers, with the actual consumption pattern shifts away from base year weighting structure. Rebasing<br>
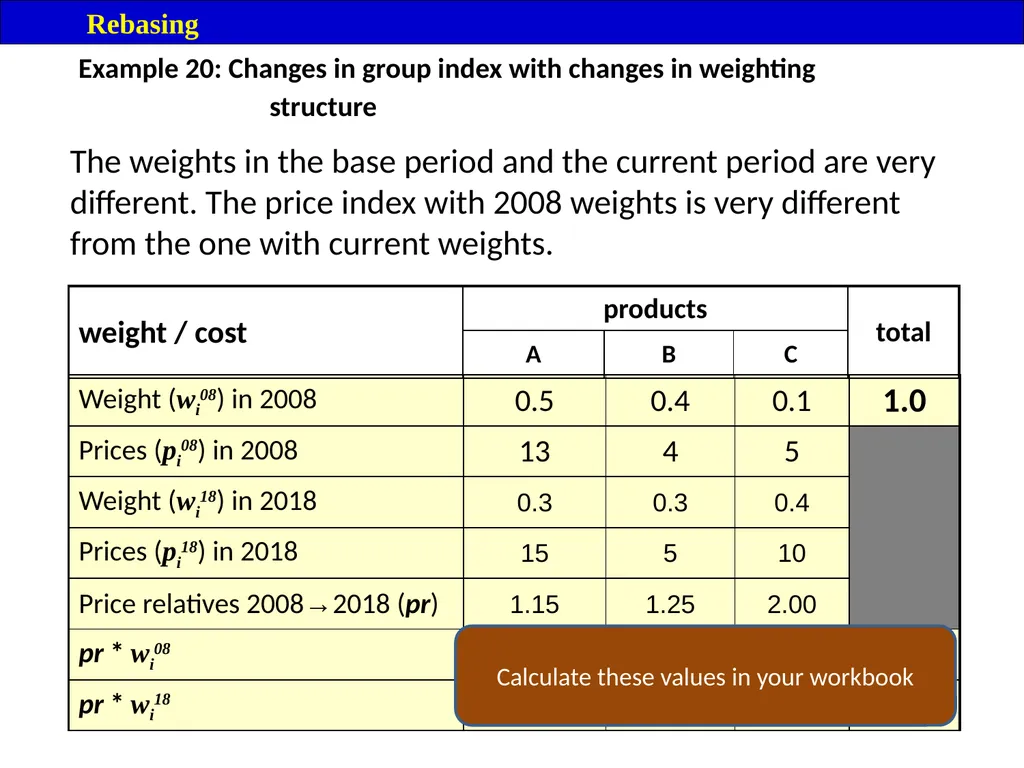
slide30. Example 20: Changes in group index with changes in weighting structure The weights in the base period and the current period are very different. The price index with 2008 weights is very different from the one with current weights. Rebasing Calculate these values in your workbook<br>
slide31. End of Session V<br>
slide2. 2 Contents – Session V Construction of Price Index – Part II
General Procedure of Index Aggregation
Choice of base period<br>
slide3. General Procedure of Index Aggregation
Computation of price relatives
Computation of elementary price index – elementary aggregation
Computation of higher level price index – aggregating elementary price indices<br>
slide4. Constructing Price Index – Steps involved, in practice Specifying geographical and population coverage.
Identifying the products to be included in the basket and grouping them for elementary levels of aggregation – [discussed in some more detail in Session VI]
Selecting a compilation method and base period.
Deriving weighting structure
Designing price data collection – frequency, outlets, product specification and quotations
[discussed in some more detail in the following sessions]
Index calculation in practice
[discussed in some more detail in the following sessions] General Procedure of Index Aggregation<br>
slide5. 5 Construction of Price Index Numbers Price indices are compiled step-by-step.
At every step the lower-level indices are aggregated to obtain the higher levels ones, up to the overall index.
Normally, a three-step procedure is followed.
A general procedure of constructing price index is indicated in the next slide. General Procedure of Index Aggregation<br>
slide6. 6 Aggregation Structure – A General Procedure of constructing price index Price relatives for each item Price index for elementary aggregates Upper aggregated price index Simple arithmetic / geometric mean of price relatives or ratio of average prices Weighted arithmetic mean of price relatives by using fixed weight (Laspeyres’ / Lowe method) Prices for each item in current and base period Simple ratio of prices in current and base periods General Procedure of Index Aggregation<br>
slide7. 7 Three-Step Compilation First step: Calculation of price relatives. Price relative is calculated for each quotation as the ratio between the quoted current-period price (numerator) and the base-period price (denominator).
Second step: Price relatives are aggregated to obtain the elementary price index (or elementary product index in the PPI context).
Third step: The elementary price indices are aggregated as weighted averages (typically as a Laspeyres-type index) to provide a set of synthetic indices up to the overall index. General Procedure of Index Aggregation<br>
slide8. 8 First Step – computation of price relatives Price quotations are first converted to ratios or price relatives, by dividing each current price by index-base price.
For each period a fixed number of price quotations for a group of specified products (according to product specification) constituting an elementary aggregate are collected.
The price relatives are calculated for each specified product as the ratio between the current period’s price and the base-period price. General Procedure of Index Aggregation<br>
slide9. 9 First Step – An example In compilation of a CPI,
Elementary aggregate: ‘rice’.
Number of varieties (say ‘course’, ‘medium’ and ‘fine’): 3
HES data provides weights for ‘rice’ but not for its varieties.
Number of outlets selected for price collection: 10
Number of quotations collected from 10 outlets: 20
10 for ‘coarse rice’
6 for ‘medium rice’
4 for ‘fine rice’.
Number of price relatives required to be calculated: 20
(for each quotation) General Procedure of Index Aggregation<br>
slide10. 10 Second Step – computation of elementary index (1) The price relatives for each specified group of products – elementary aggregate (for CPI) and product index (for PPI) – are then aggregated to obtain the elementary price index.
The price index for an elementary aggregate is called an elementary price index.
Recall that an elementary aggregate is the lowest level of aggregation for which value data are available.
In our example of ‘rice’ in CPI compilation, all the price relatives for quotations collected for rice are combined, or aggregated, to obtain the elementary price index for ‘rice’. General Procedure of Index Aggregation<br>
slide11. 11 Second Step – computation of elementary index (2) Likewise, for PPI, prices for different types of transactions for a product are collected from an establishment.
The derived price relatives are combined to produce the product index for the establishment.
Again, weights for individual transactions are usually not available.
Thus, the establishment’s product index is computed as an unweighted average of the price relatives for different transactions. General Procedure of Index Aggregation<br>
slide12. 12 Second Step – computation of elementary index (3) The elementary price index or an establishment’s product index are compiled in several ways.
Mainly, two methods can be distinguished:
the weighted mean of price relatives.
the unweighted mean of price relatives.
We will discuss only the applications of formulas that do not use explicit weights, i.e. Dutot’s, Carli’s and Jevon’s. General Procedure of Index Aggregation<br>
slide13. 13 Second Step – Dutot’s for elementary index General Procedure of Index Aggregation<br>
slide14. 14 Second Step – Carli’s for elementary index General Procedure of Index Aggregation<br>
slide15. 15 Second Step – Jevon’s for elementary index Jevon’s index is the geometric average of the price relatives – both calculations will yield the same results.
It is being introduced by more and more countries for calculation of elementary index.
The Jevon’s index gives each price relative the same (multiplicative) weights. General Procedure of Index Aggregation<br>
slide16. 16 Third Step – computation of higher-level index (1) The elementary aggregates are combined to produce the sub-group and group indices, and eventually the overall index.
For this, some kind of index number formula and weights are used.
expenditure or population (for CPI)
value of production (for PPI).
Generally, the Laspeyres type index is used by statistical offices for higher-level indices. General Procedure of Index Aggregation<br>
slide17. 17 Third Step – computation of higher-level index (2) Weighted arithmetic mean of elementary price indices is used for higher-level indices.
Each of elementary aggregates (product or product group) is given a “weight”, based on
consumption expenditure or
output or sales
during the reference (base) period for the weights.
The elementary price indices are multiplied by their respective “weights” to obtain higher-level aggregate price index. General Procedure of Index Aggregation<br>
slide18. Example 17: Process of Aggregation (1) General Procedure of Index Aggregation Consider a hypothetical situation where the overall price index is compiled from just three broad groups of products – cereals, other food and non-food – with weights 20%, 45% and 35% respectively.
The broad group cereal consists of only products (elementary aggregates) – rice and flour. For rice, 8 quotations are collected every month and for flour 6 quotations.
The table on the next slide shows the price quotations for rice and flour.<br>
slide19. Example 17: Process of Aggregation (1) General Procedure of Index Aggregation Calculate these values in your workbook Calculate these values in your workbook First, the price relatives for each of the quotations are obtained as the ratio of current-period price to that of the base period. This is the first step.
Next – the second step – the elementary price indices for rice and flour are calculated as unweighted geometric mean of the price relatives.<br>
slide20. Example 17: Process of Aggregation (2) General Procedure of Index Aggregation The third step usually consists of different stages of aggregation to obtain higher level price indices.
Once the elementary price index for rice and flour are obtained, we can calculate the price index for the ‘Cereals’ broad group as follows (with the given weights of 60% and 40% for rice and flour respectively): Calculate these values in your workbook<br>
slide21. Example 17: Process of Aggregation (3) General Procedure of Index Aggregation The value of index 131.7 is obtained as weighted arithmetic average of elementary price indices of rice and flour.
Now, let’s assume the price index for the broad groups ‘other food’ and ‘non-food’ are similarly obtained as 135.3 and 145.2.
Finally, all the group price indices are combined, using the assigned weights of 20%, 45% and 35% respectively for ‘cereals’, ‘other food’ and ‘non-food’, to obtain the overall price index as follows: Calculate the value in your workbook<br>
slide22. Choice of Base Period
Desirable properties of all the reference periods
Rebasing – how frequently?<br>
slide23. 23 Choice of Base or Reference period A base period is a conventional time interval such as a year, a month, etc.
The following consideration are kept in mind while selecting a base period.
Base period should be a period of normal and stable economic conditions. But a period which is normal in one respect may be abnormal in some other respects. Thus, sometimes an average of two or more years is taken as the base period.
The base period should not be too distant from the given period.
) Sometimes a year of some economic importance for the country is also taken as base. Constructing Price Index – Base Period<br>
slide24. 24 Desirable properties of reference periods All the reference periods – Index reference period, Weight reference period and Price reference period – should desirably
be long enough to cover a seasonal cycle, which is normally a year
have economic conditions that can be considered to be reasonably normal or stable
not be too distant from each other.
An index series may also be re-referenced to another period by simply dividing the series by the value of the index in that period, without changing the rate of change of the index. Constructing Price Index – Base Period<br>
slide25. Example 18: Re-referencing a Price Index Constructing Price Index – Base Period Consider the following price index series with index reference period as the year 2005.
To obtain the series with base year re-referenced to 2010, we have to divide the values of price index with base year 2005 by the value of price index of 2010 (125.0) and multiply by 100. Calculate the series with base year re-referenced to 2010. One has to divide the values of price index with base year 2005 by the value of price index of 2010 (125.0) and multiply by 100. Calculate these values in your workbook<br>
slide26. Why Rebasing? In a changing world, it does not take very long before an index becomes out-of-date, for two main reasons:
the weights no longer reflect the patterns of expenditure, output or trade
new products come on to the market that did not exist before.
The index ceases to represent the present-day price change. Rebasing<br>
slide27. Updating Product Coverage For an elementary aggregate, prices of only a set of selected specific products is assumed to capture the price movement of the entire elementary aggregate.
But, products become obsolete and new products come to the market.
This introduces bias in the elementary indices, particularly when the price movement of the “new” products is very different from the ones already in the basket of goods or services of the elementary aggregate in question. Rebasing<br>
slide28. Example 19: Bias in elementary index due to “new” product coming to the market Introduction of Product C, after the 2008 (base period), but the price index do not reflect the effect of price change of product C. Rebasing<br>
slide29. Rebasing weights Usually, while rebasing a price index series, an entirely new set of units or outlets are selected for price collection.
Most countries use a fixed-weight index and do not change the selected set of outlets or units till the next rebasing is done.
This leads to progressively increasing biases in the index numbers, with the actual consumption pattern shifts away from base year weighting structure. Rebasing<br>
slide30. Example 20: Changes in group index with changes in weighting structure The weights in the base period and the current period are very different. The price index with 2008 weights is very different from the one with current weights. Rebasing Calculate these values in your workbook<br>
slide31. End of Session V<br>