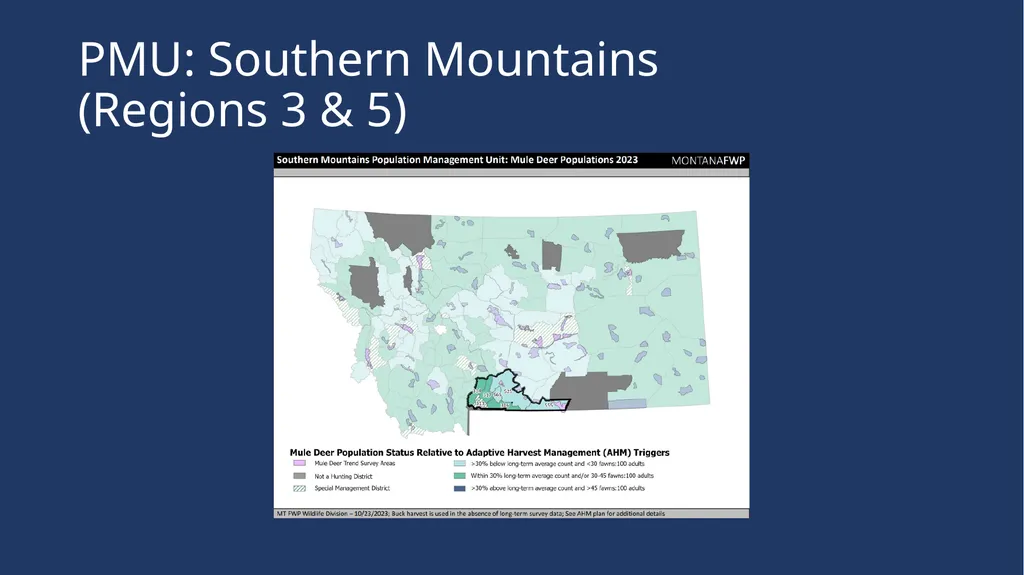
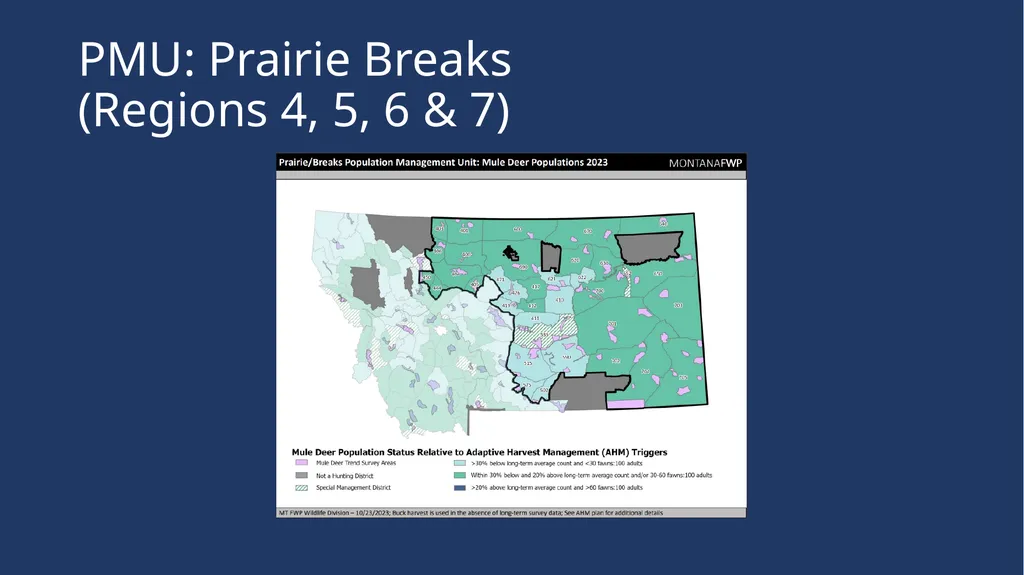
Mule Deer Population Estimates Presented to the Mule Deer Advisory Committee on 6 May 2024 by Alix Godar FWP Population EcologistBiometrician Mule Deer Population Estimates Montana has monitored mule deer populations for decades Mule
"Mule Deer Population Estimates Presented to the" is the property of its rightful owner. Permission is granted to
download and print the materials on this website for personal, non-commercial use only, and to display it
on your personal computer provided you do not modify the materials and that you retain all copyright
notices contained in the materials. By downloading content from our website, you accept the terms of this
agreement.
Share
Embed code
Presentation Transcript
01
Mule Deer Population Estimates Presented to the Mule Deer Advisory Committee on 6 May 2024
by
Alix Godar – FWP Population Ecologist/Biometrician<br>
02
Mule Deer Population Estimates Montana has monitored mule deer populations for decades
Mule deer are challenging to count
We do not have absolute abundance estimates (or a “true count”)
Current population estimate methods were agreed upon in 2015
Minor changes have been made over time to accommodate changes in Hunting Districts and other changes<br>
03
Mule Deer Population Estimates Without an absolute abundance, population indices are a feasible alternative
We cannot compare potential population indices directly to absolute abundance
The state tested two potential population indices by comparing them to each other
If they are both population indices, they should trend together<br>
04
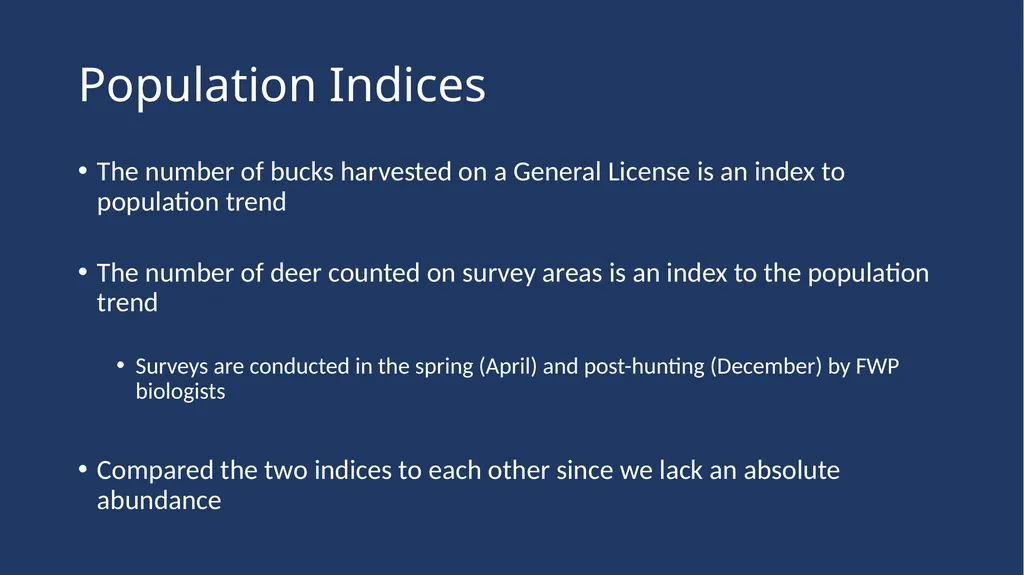
Population Indices The number of bucks harvested on a General License is an index to population trend
The number of deer counted on survey areas is an index to the population trend
Surveys are conducted in the spring (April) and post-hunting (December) by FWP biologists
Compared the two indices to each other since we lack an absolute abundance<br>
05
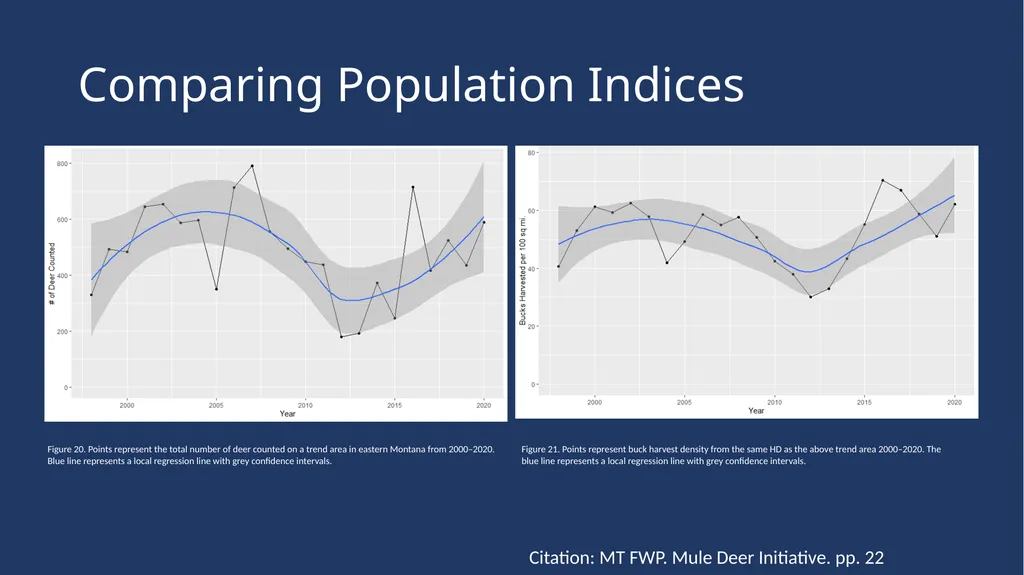
Comparing Population Indices Figure 20. Points represent the total number of deer counted on a trend area in eastern Montana from 2000–2020. Blue line represents a local regression line with grey confidence intervals. Figure 21. Points represent buck harvest density from the same HD as the above trend area 2000–2020. The blue line represents a local regression line with grey confidence intervals. Citation: MT FWP. Mule Deer Initiative. pp. 22<br>
06
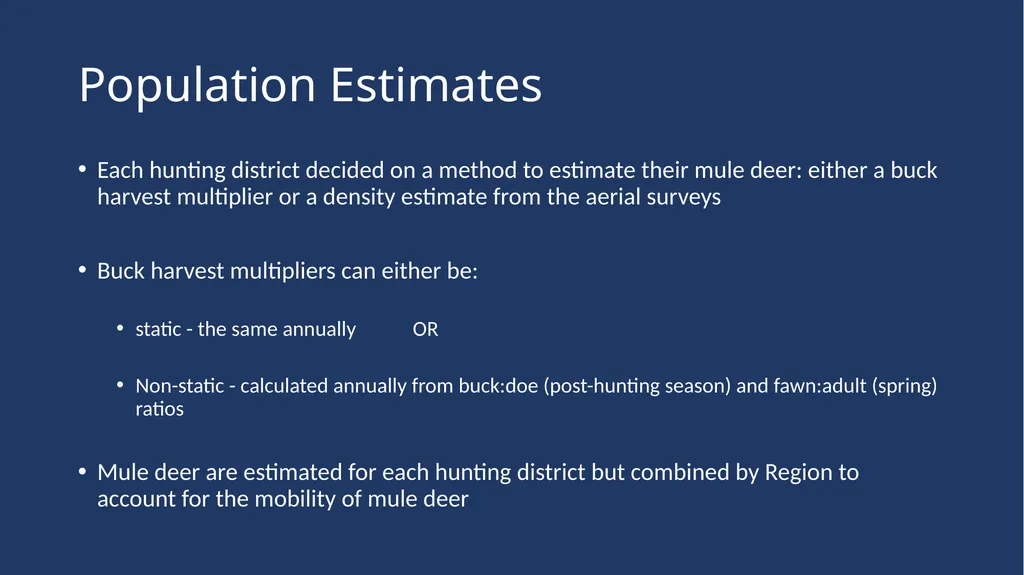
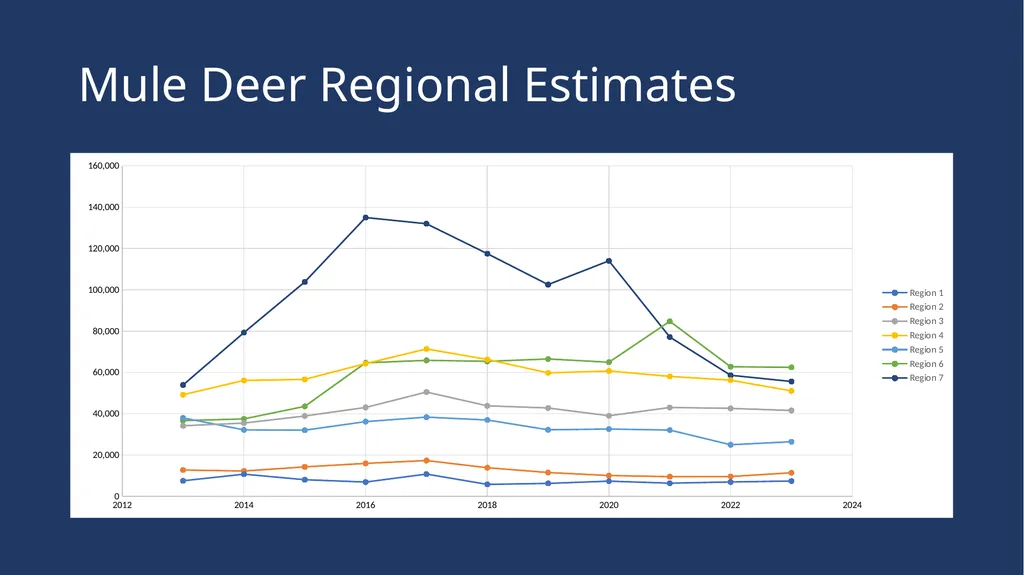
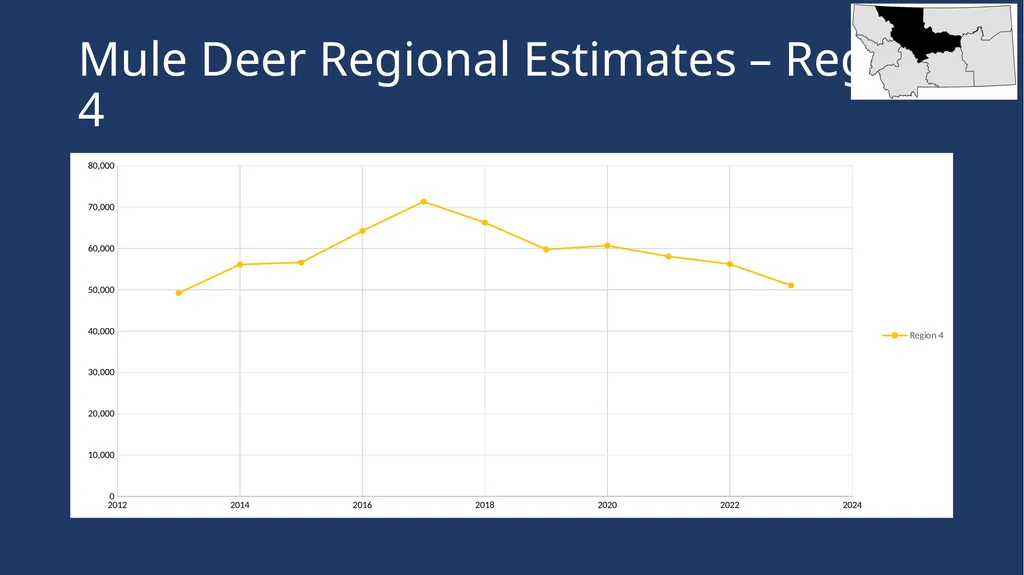
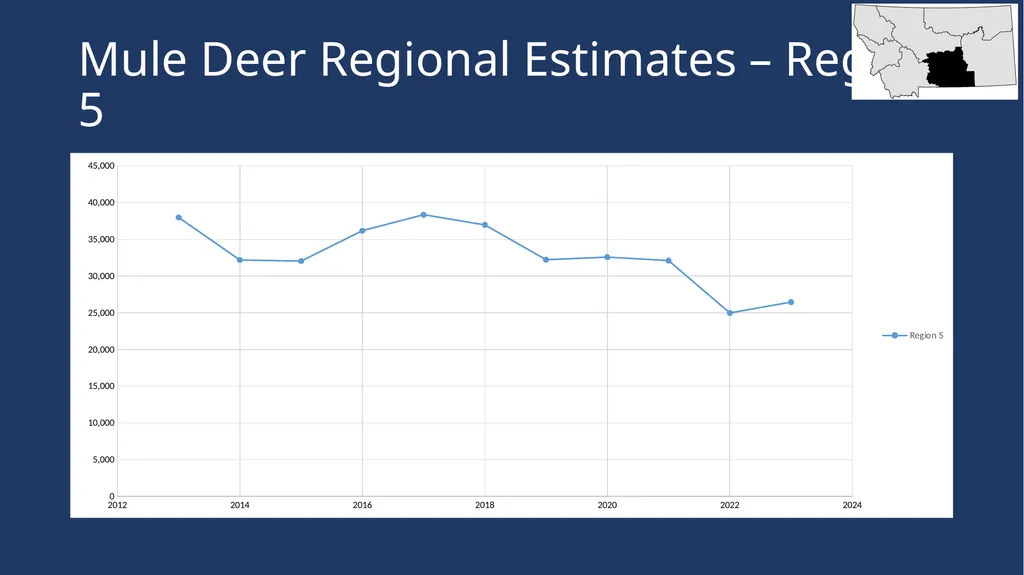
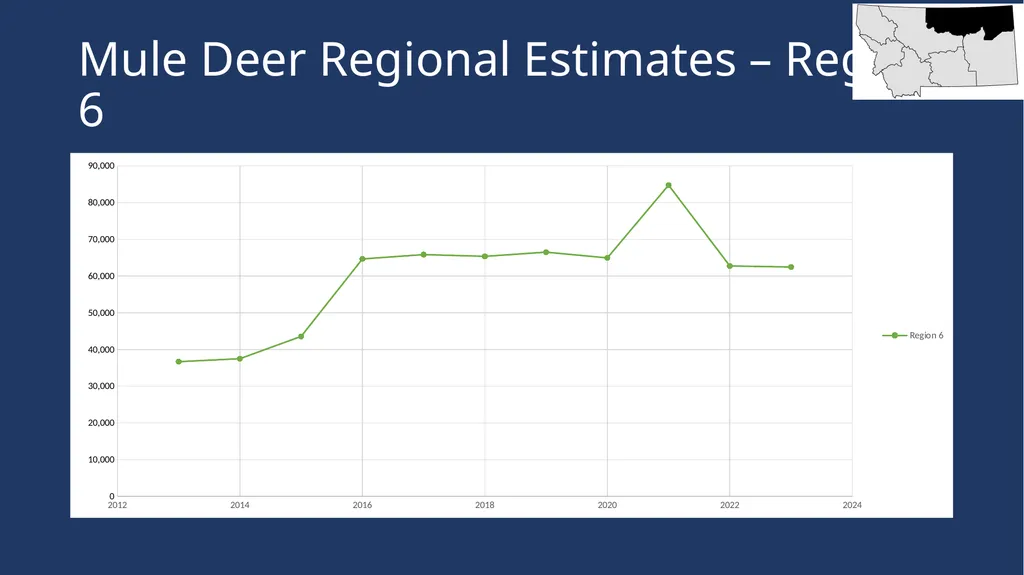
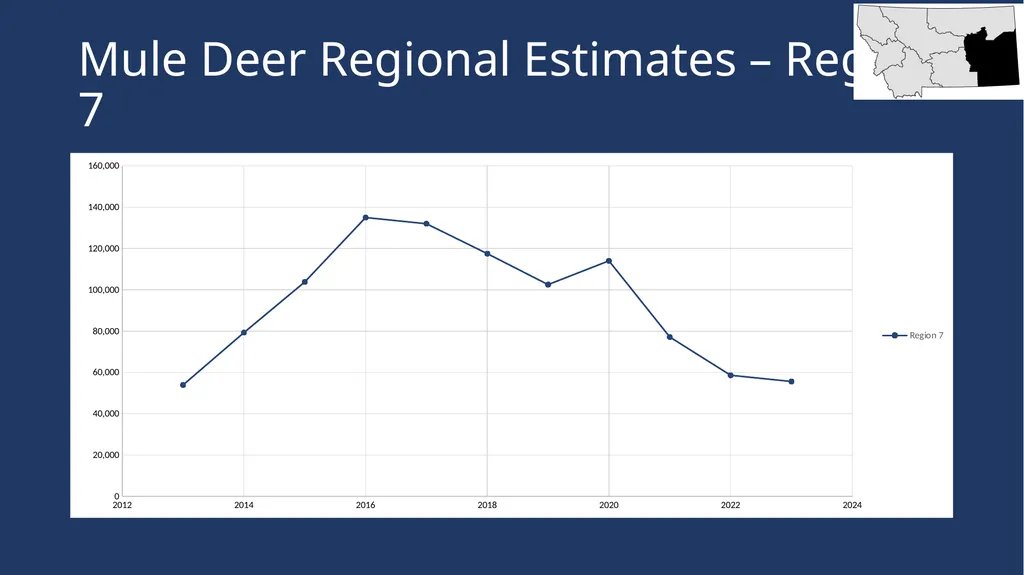
Population Estimates Each hunting district decided on a method to estimate their mule deer: either a buck harvest multiplier or a density estimate from the aerial surveys
Buck harvest multipliers can either be:
static - the same annually OR
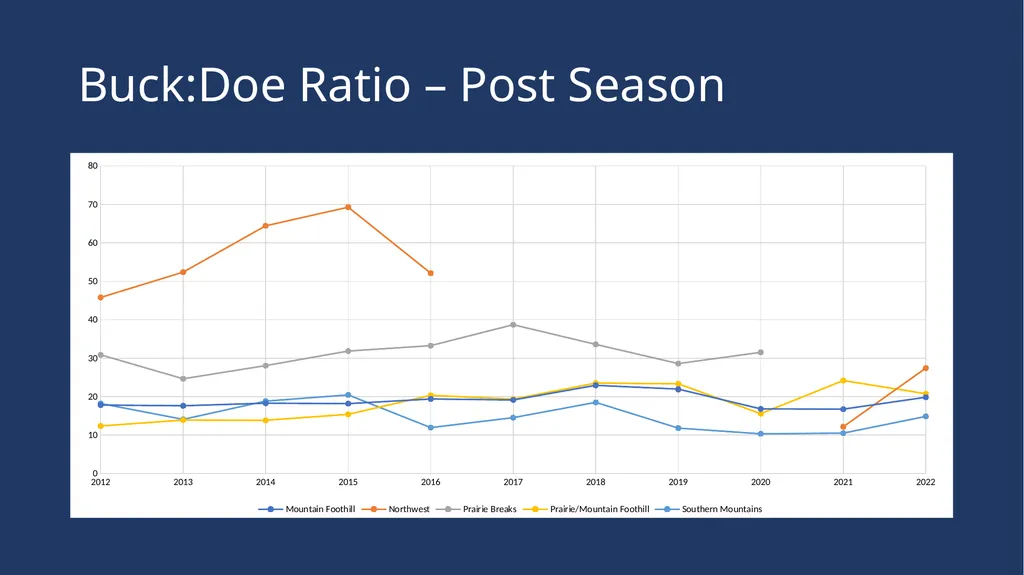
Non-static - calculated annually from buck:doe (post-hunting season) and fawn:adult (spring) ratios
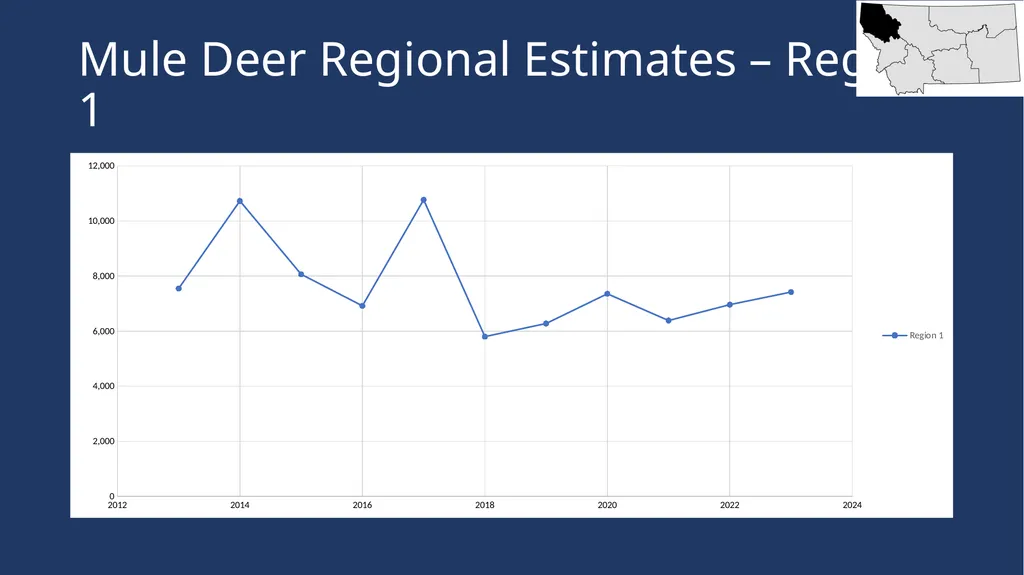
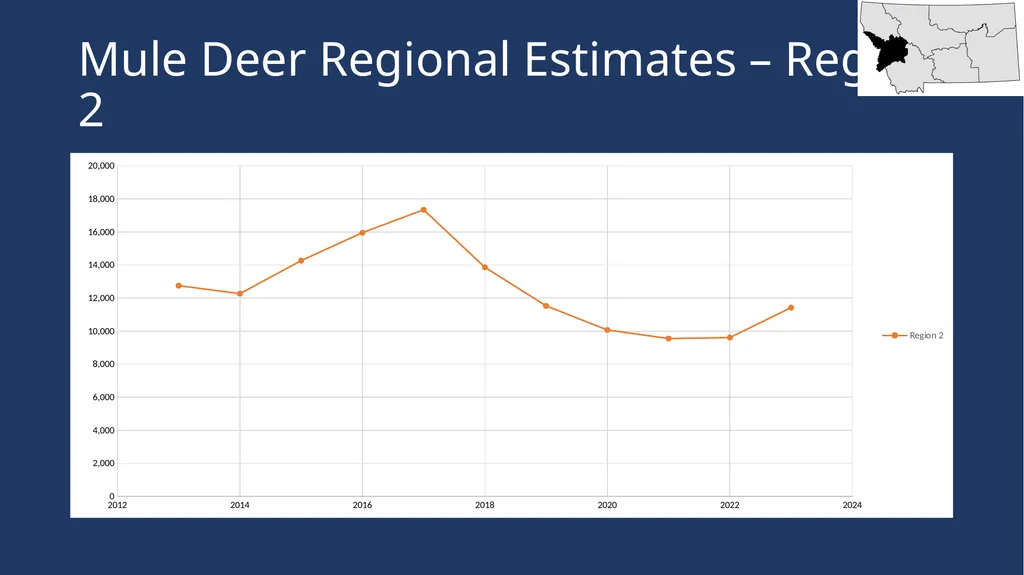
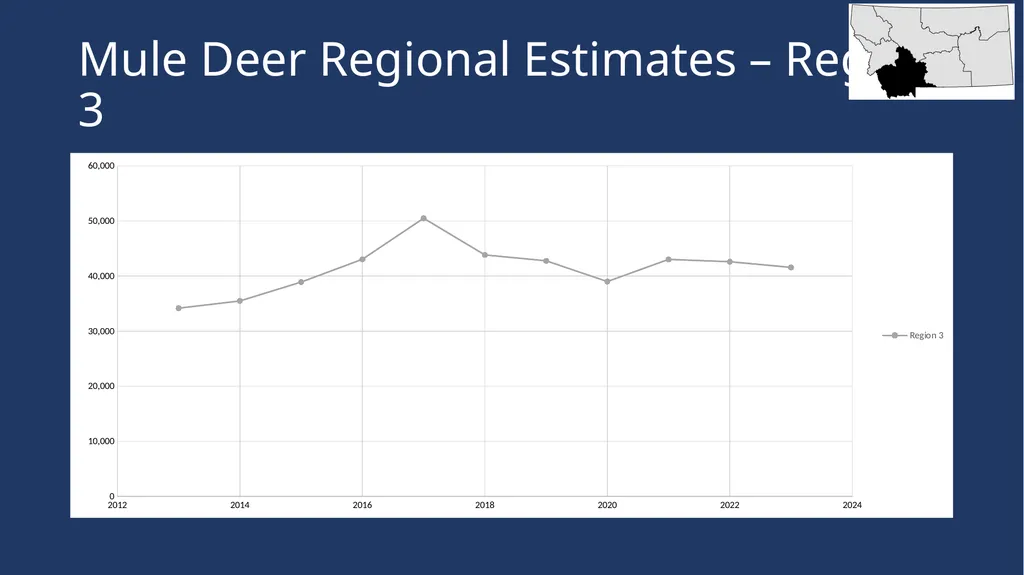
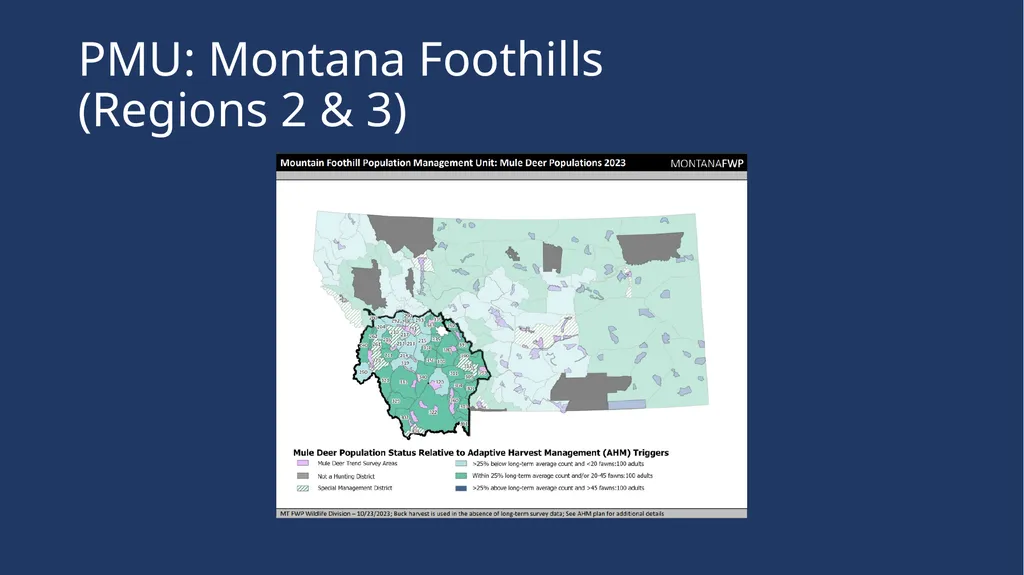
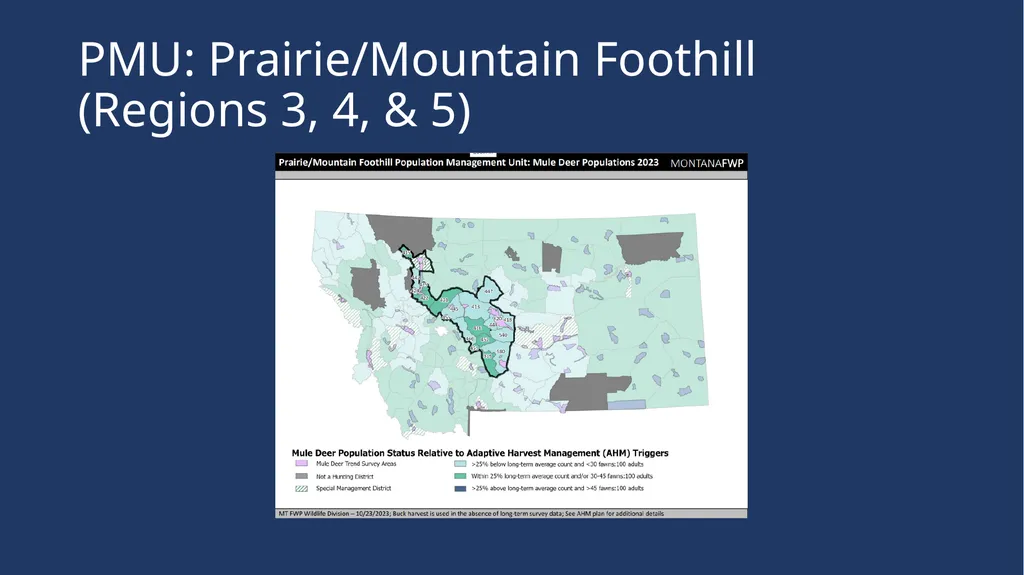
Mule deer are estimated for each hunting district but combined by Region to account for the mobility of mule deer<br>