
Normal Load (Axial load): Load is perpendicular to
NS
Published · 51 slides · 0 views
1 / 1
Description
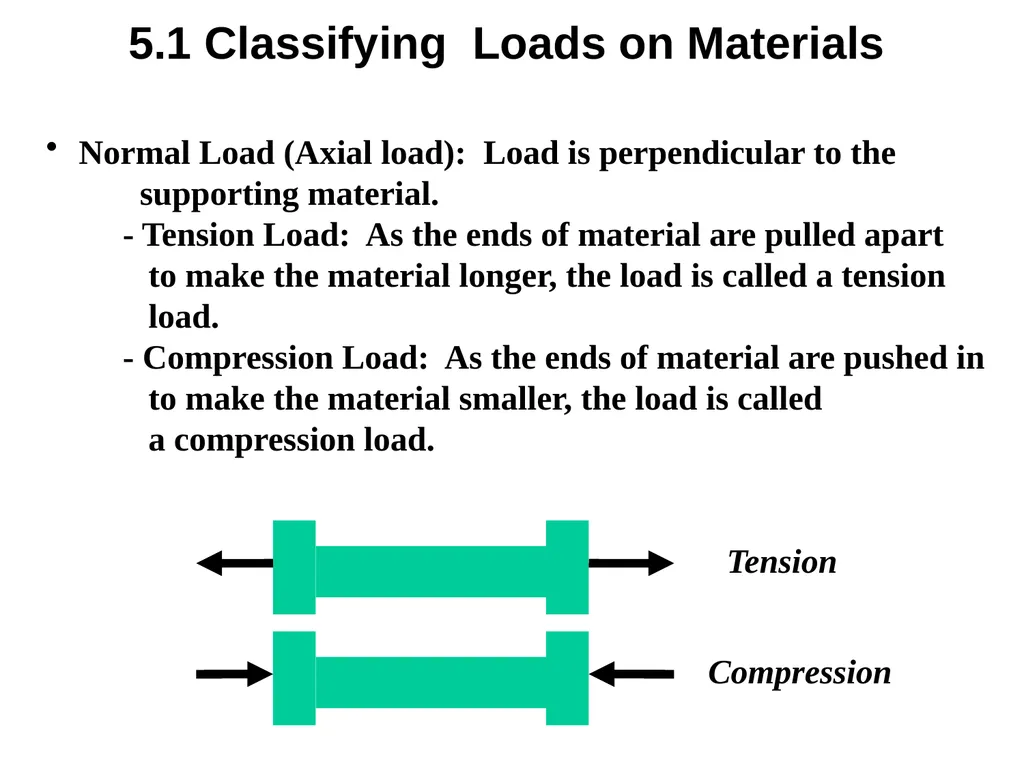
Normal Load (Axial load): Load is perpendicular to the supporting material. - Tension Load: As the ends of material are pulled apart to make the material longer, the load is called a tension load. - Compression Load: As the ends of material
Related Topics
Share
Embed code
Download this presentation From Below
"Normal Load (Axial load): Load is perpendicular to" is the property of its rightful owner. Permission is granted to download and print the materials on this website for personal, non-commercial use only, and to display it on your personal computer provided you do not modify the materials and that you retain all copyright notices contained in the materials. By downloading content from our website, you accept the terms of this agreement.
Presentation Transcript
01
Normal Load (Axial load): Load is perpendicular to the
supporting material.
- Tension Load: As the ends of material are pulled apart
to make the material longer, the load is called a tension
load.
- Compression Load: As the ends of material are pushed in
to make the material smaller, the load is called
a compression load. Tension Compression 5.1 Classifying Loads on Materials<br>
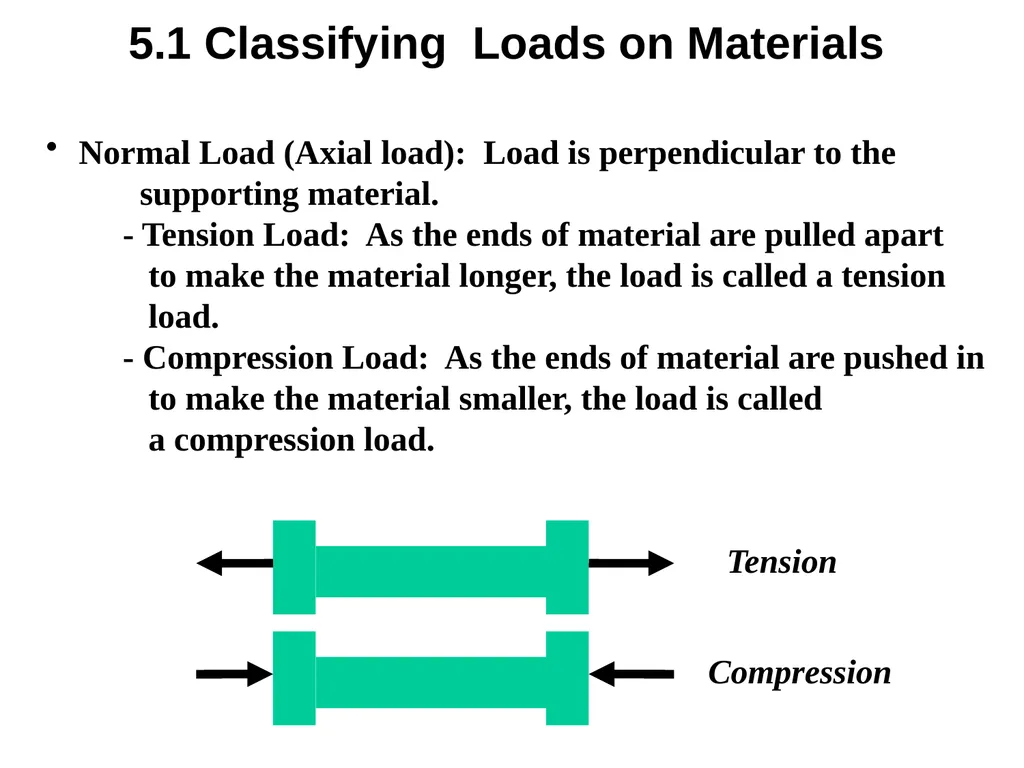
supporting material.
- Tension Load: As the ends of material are pulled apart
to make the material longer, the load is called a tension
load.
- Compression Load: As the ends of material are pushed in
to make the material smaller, the load is called
a compression load. Tension Compression 5.1 Classifying Loads on Materials<br>
02
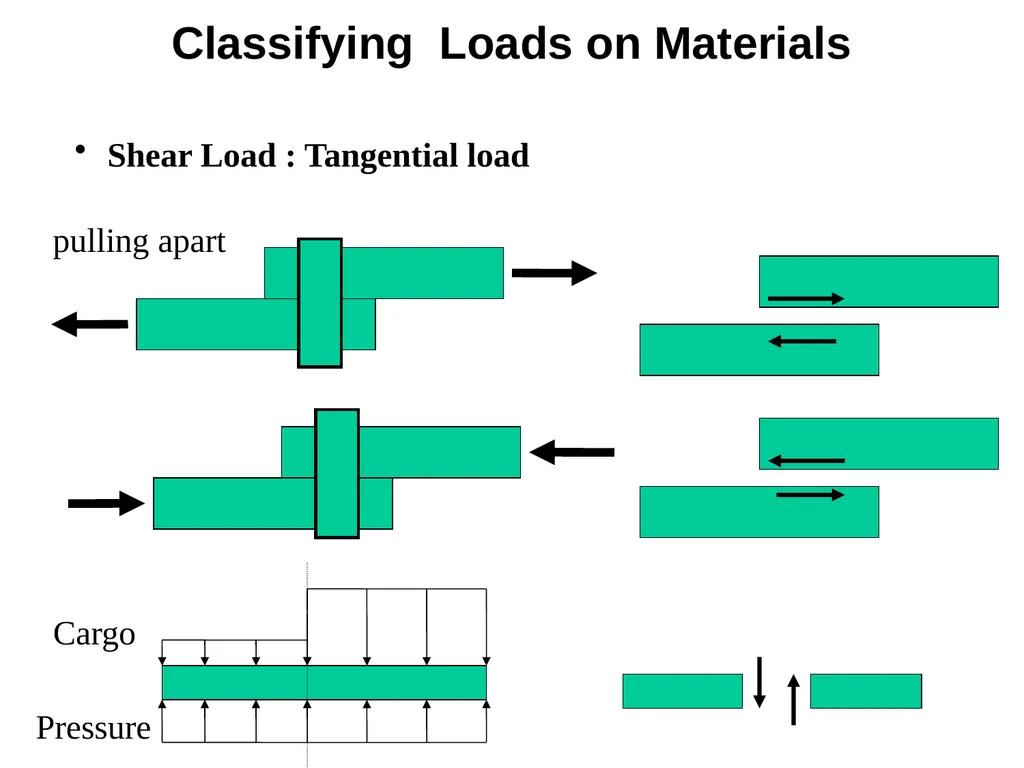
Shear Load : Tangential load pulling apart Pressure Cargo Classifying Loads on Materials<br>
03
Torsion Loads: Angular distortion on a component, such as a
shaft, when a moment is applied. (Twisting)
Thermal Loads: Distortion caused be heating or cooling a
material. A normal load is created when the material is
constrained in any direction in the plane that is constrained. Classifying Loads on Materials<br>
shaft, when a moment is applied. (Twisting)
Thermal Loads: Distortion caused be heating or cooling a
material. A normal load is created when the material is
constrained in any direction in the plane that is constrained. Classifying Loads on Materials<br>
04
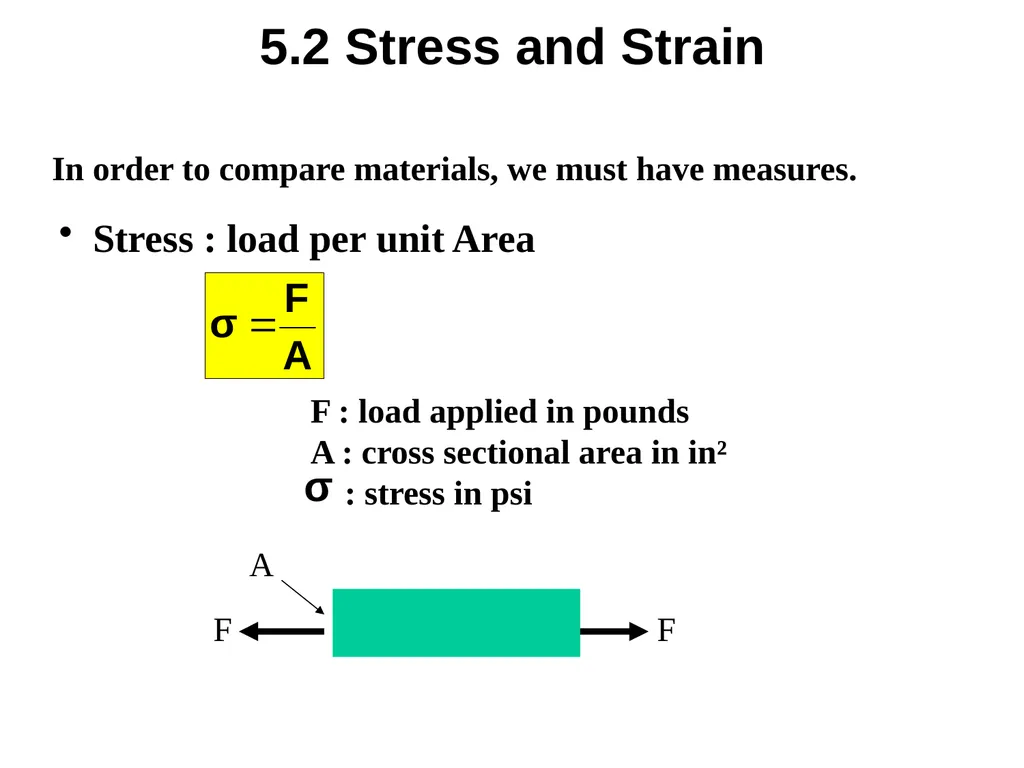
5.2 Stress and Strain In order to compare materials, we must have measures. Stress : load per unit Area F : load applied in pounds
A : cross sectional area in in²
: stress in psi A F F<br>
A : cross sectional area in in²
: stress in psi A F F<br>
05
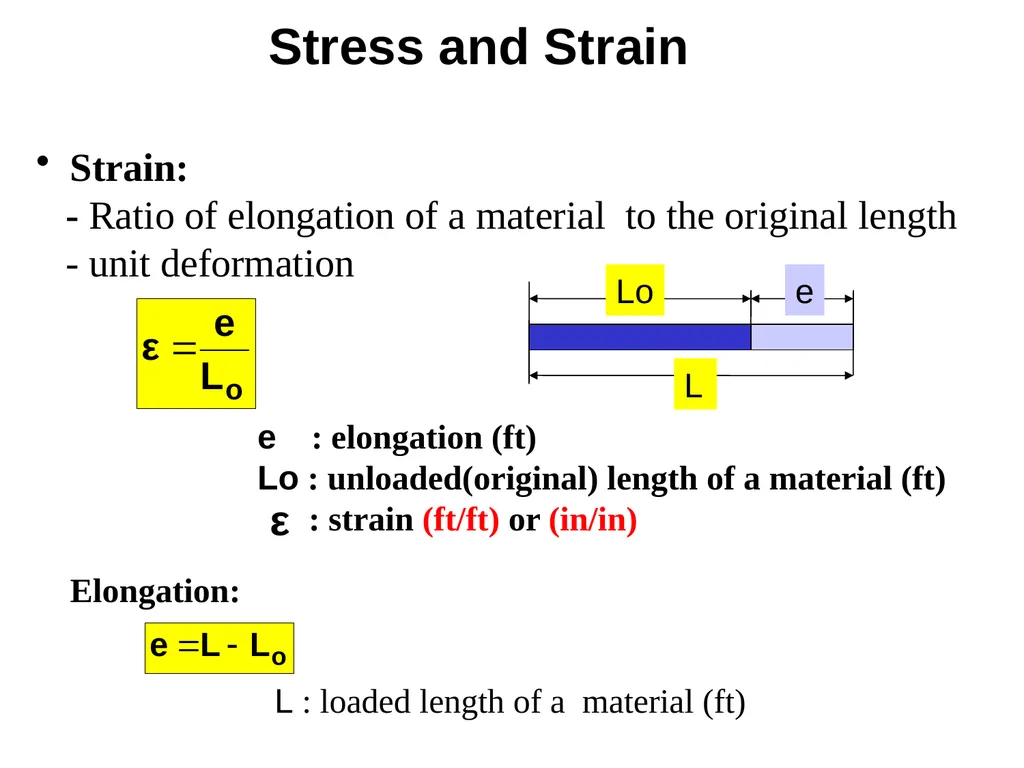
Strain:
- Ratio of elongation of a material to the original length
- unit deformation e : elongation (ft)
Lo : unloaded(original) length of a material (ft)
: strain (ft/ft) or (in/in) Elongation: L : loaded length of a material (ft) Lo e L Stress and Strain<br>
- Ratio of elongation of a material to the original length
- unit deformation e : elongation (ft)
Lo : unloaded(original) length of a material (ft)
: strain (ft/ft) or (in/in) Elongation: L : loaded length of a material (ft) Lo e L Stress and Strain<br>
06
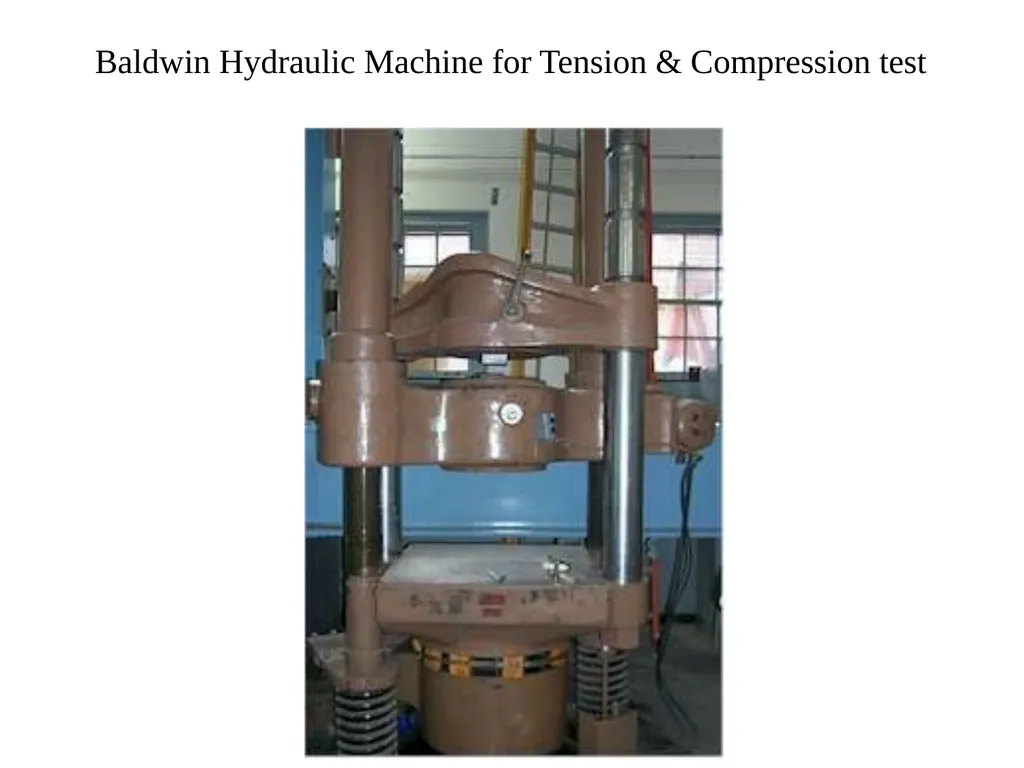
Baldwin Hydraulic Machine for Tension & Compression test<br>
07
5.3 Stress-Strain Diagram A plot of Strain vs. Stress.
The diagram gives us the behavior of the material and
material properties.
Each material produces a different stress-strain
diagram.<br>
The diagram gives us the behavior of the material and
material properties.
Each material produces a different stress-strain
diagram.<br>
08
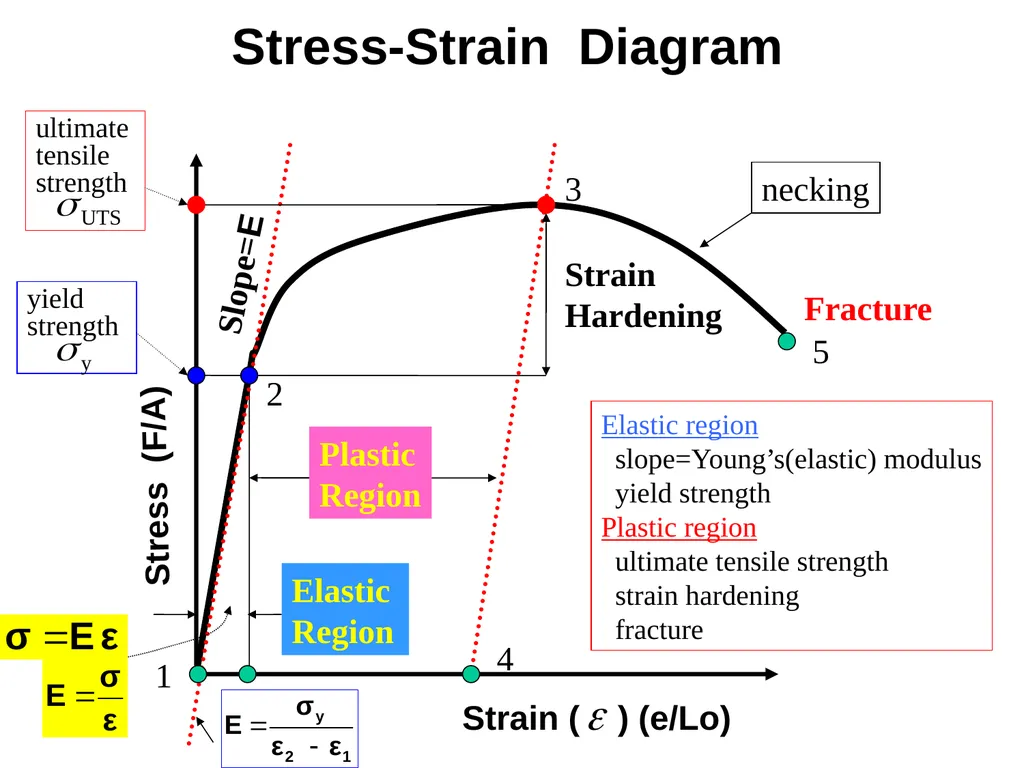
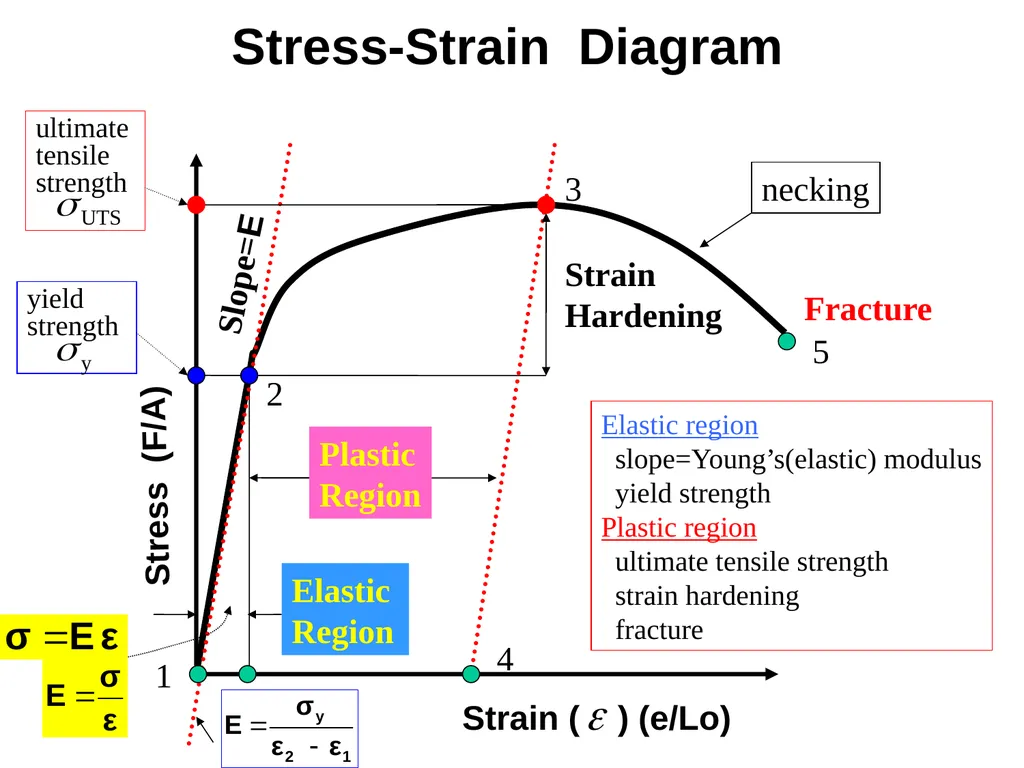
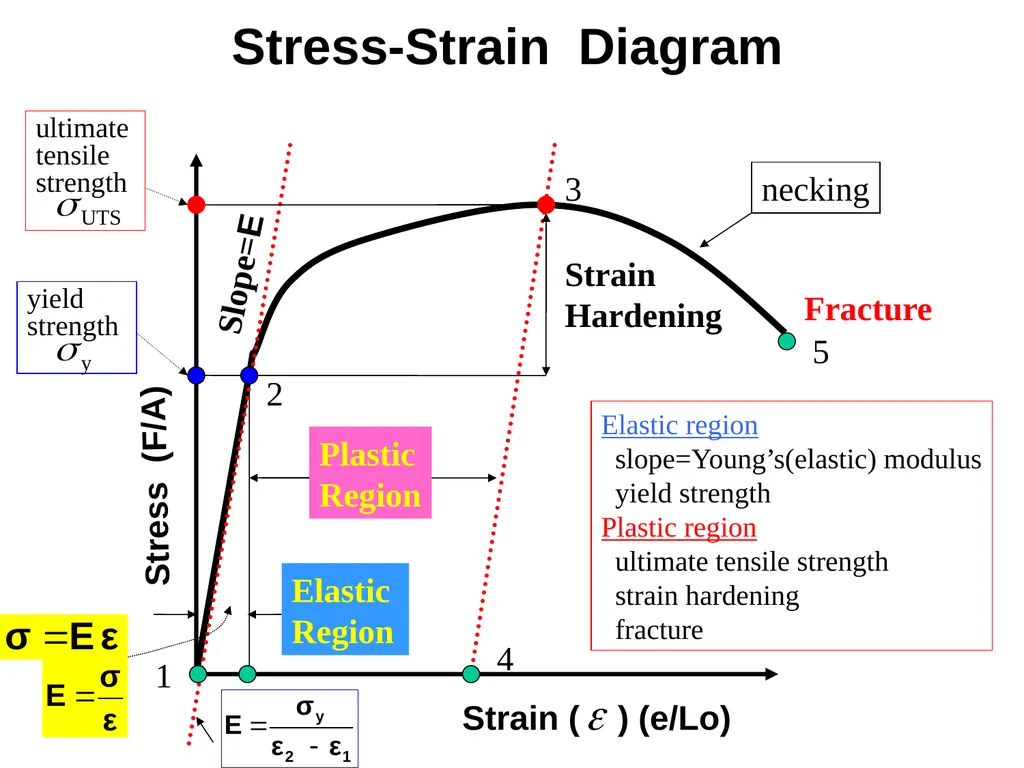
Strain ( ) (e/Lo) 4 1 2 3 5 Stress (F/A) Elastic
Region Plastic
Region Strain
Hardening Fracture ultimate
tensile strength Slope=E Elastic region
slope=Young’s(elastic) modulus
yield strength
Plastic region
ultimate tensile strength
strain hardening
fracture necking yield
strength Stress-Strain Diagram<br>
Region Plastic
Region Strain
Hardening Fracture ultimate
tensile strength Slope=E Elastic region
slope=Young’s(elastic) modulus
yield strength
Plastic region
ultimate tensile strength
strain hardening
fracture necking yield
strength Stress-Strain Diagram<br>
09
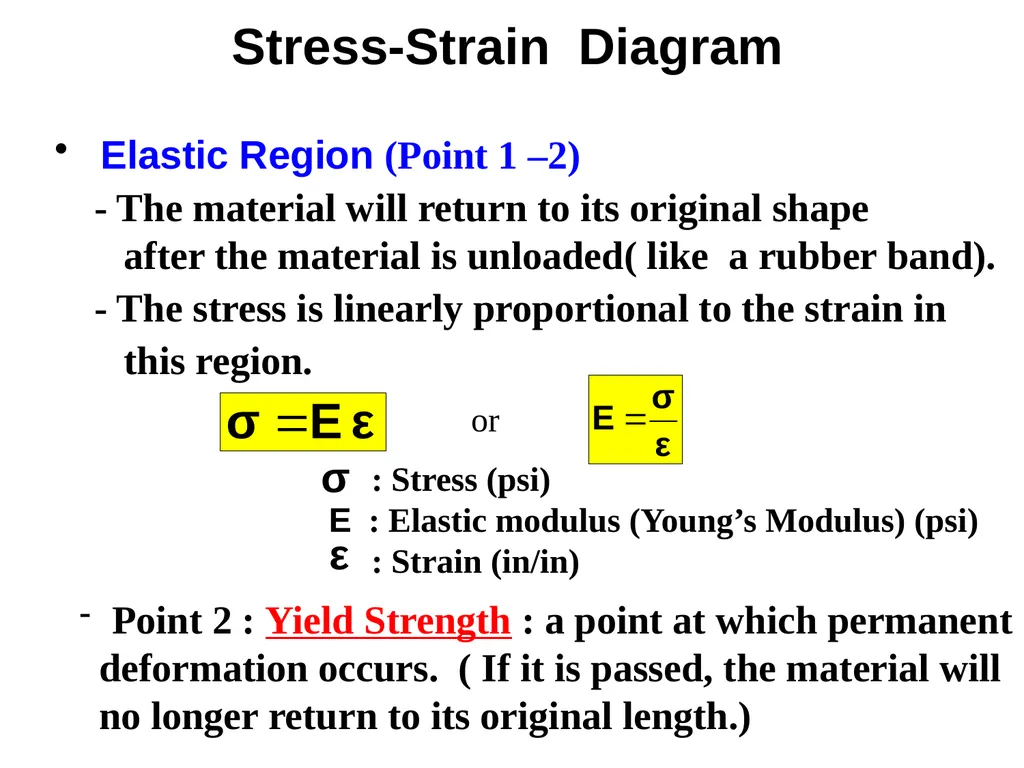
Elastic Region (Point 1 –2)
- The material will return to its original shape
after the material is unloaded( like a rubber band).
- The stress is linearly proportional to the strain in
this region. : Stress (psi)
E : Elastic modulus (Young’s Modulus) (psi)
: Strain (in/in) Point 2 : Yield Strength : a point at which permanent
deformation occurs. ( If it is passed, the material will
no longer return to its original length.) or Stress-Strain Diagram<br>
- The material will return to its original shape
after the material is unloaded( like a rubber band).
- The stress is linearly proportional to the strain in
this region. : Stress (psi)
E : Elastic modulus (Young’s Modulus) (psi)
: Strain (in/in) Point 2 : Yield Strength : a point at which permanent
deformation occurs. ( If it is passed, the material will
no longer return to its original length.) or Stress-Strain Diagram<br>
10
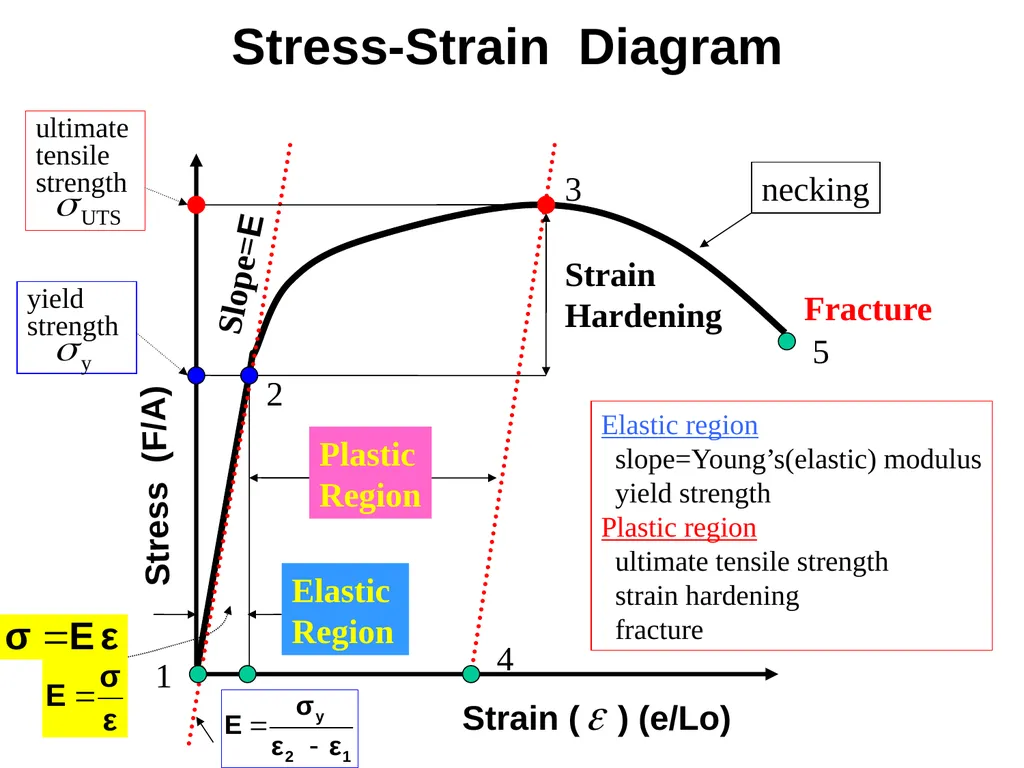
Strain ( ) (e/Lo) 4 1 2 3 5 Stress (F/A) Elastic
Region Plastic
Region Strain
Hardening Fracture ultimate
tensile strength Slope=E Elastic region
slope=Young’s(elastic) modulus
yield strength
Plastic region
ultimate tensile strength
strain hardening
fracture necking yield
strength Stress-Strain Diagram<br>
Region Plastic
Region Strain
Hardening Fracture ultimate
tensile strength Slope=E Elastic region
slope=Young’s(elastic) modulus
yield strength
Plastic region
ultimate tensile strength
strain hardening
fracture necking yield
strength Stress-Strain Diagram<br>
11
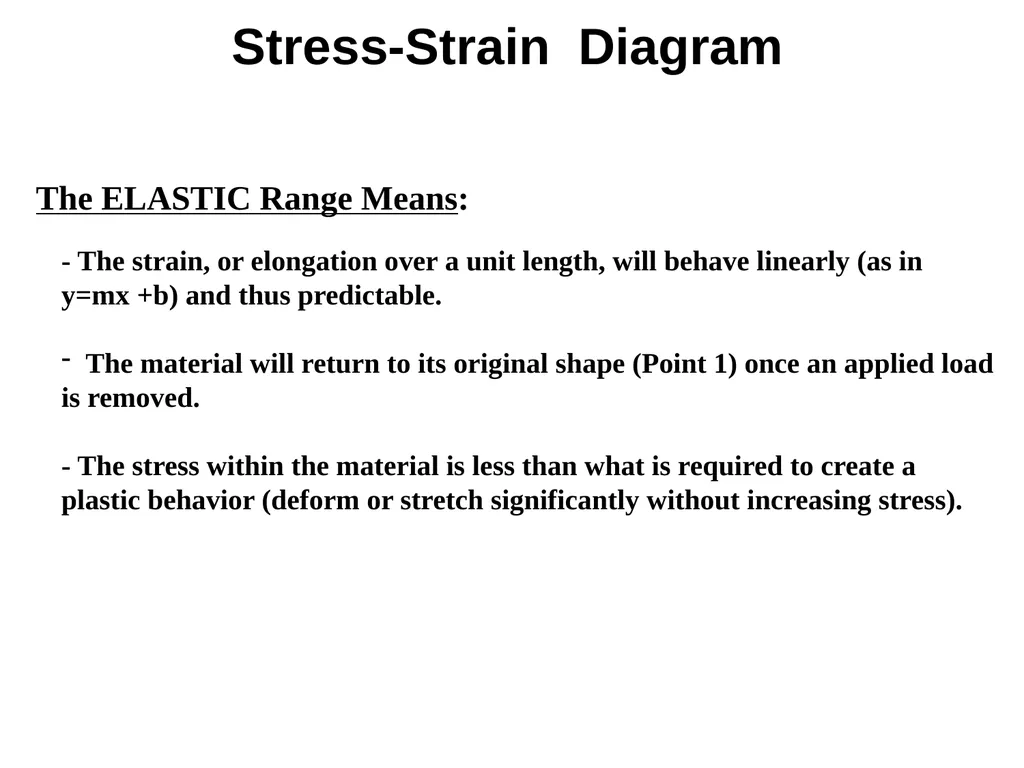
- The strain, or elongation over a unit length, will behave linearly (as in
y=mx +b) and thus predictable.
The material will return to its original shape (Point 1) once an applied load
is removed.
- The stress within the material is less than what is required to create a
plastic behavior (deform or stretch significantly without increasing stress). The ELASTIC Range Means: Stress-Strain Diagram<br>
y=mx +b) and thus predictable.
The material will return to its original shape (Point 1) once an applied load
is removed.
- The stress within the material is less than what is required to create a
plastic behavior (deform or stretch significantly without increasing stress). The ELASTIC Range Means: Stress-Strain Diagram<br>
12
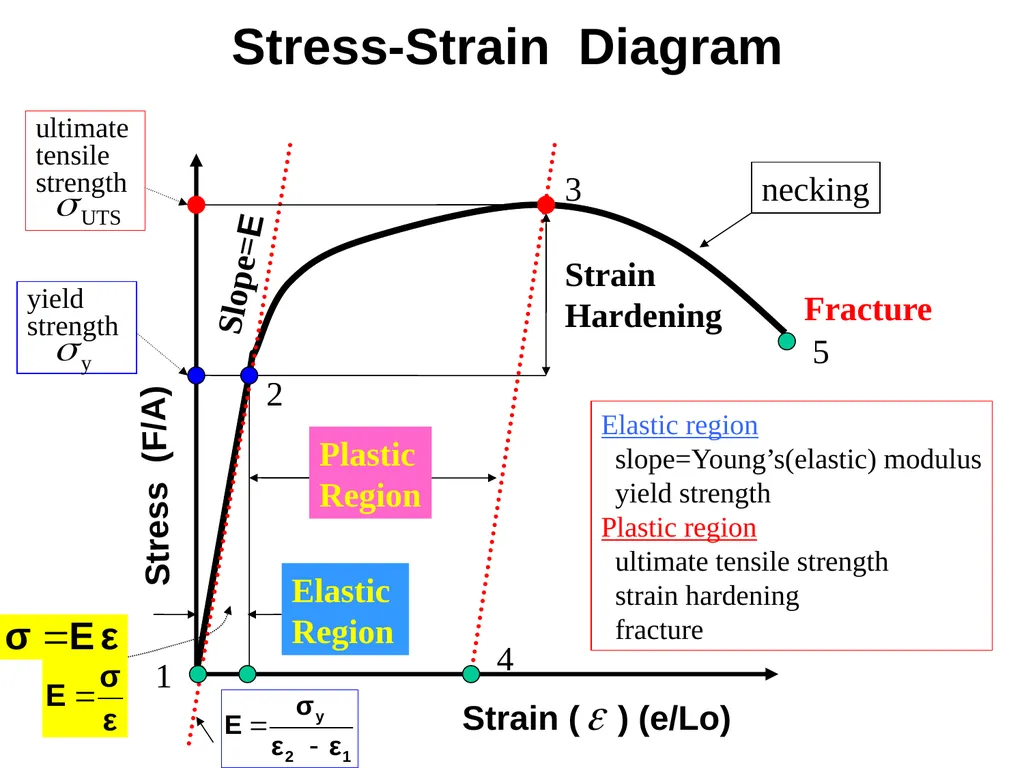
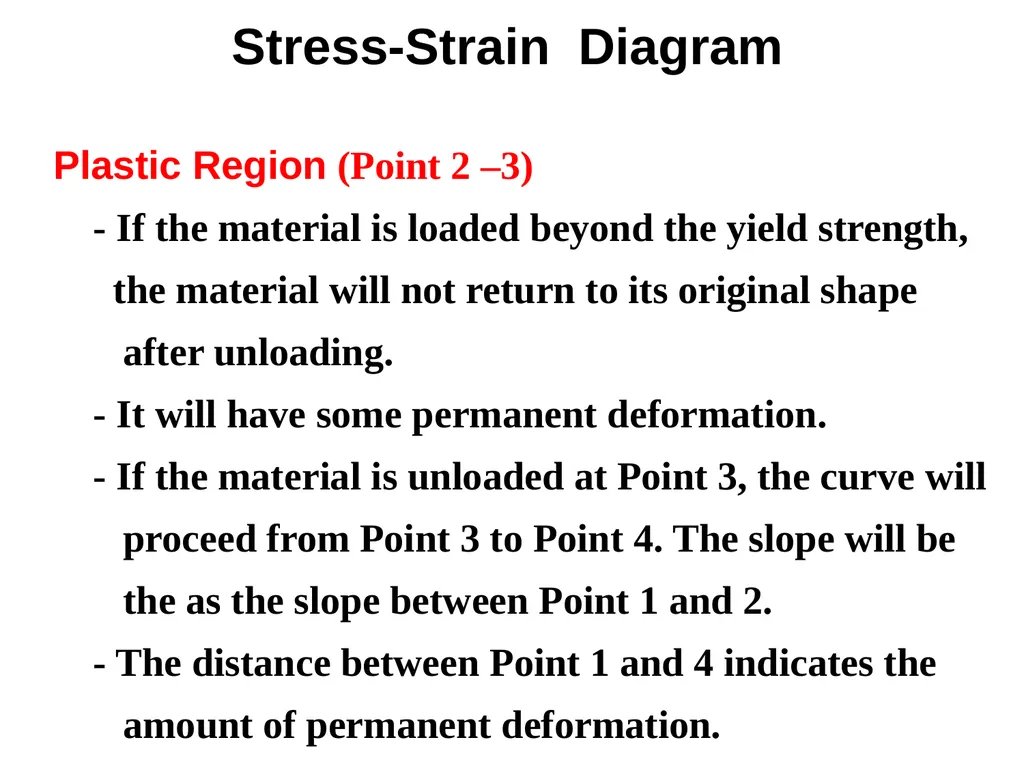
Plastic Region (Point 2 –3)
- If the material is loaded beyond the yield strength,
the material will not return to its original shape
after unloading.
- It will have some permanent deformation.
- If the material is unloaded at Point 3, the curve will
proceed from Point 3 to Point 4. The slope will be
the as the slope between Point 1 and 2.
- The distance between Point 1 and 4 indicates the
amount of permanent deformation. Stress-Strain Diagram<br>
- If the material is loaded beyond the yield strength,
the material will not return to its original shape
after unloading.
- It will have some permanent deformation.
- If the material is unloaded at Point 3, the curve will
proceed from Point 3 to Point 4. The slope will be
the as the slope between Point 1 and 2.
- The distance between Point 1 and 4 indicates the
amount of permanent deformation. Stress-Strain Diagram<br>
13
Strain ( ) (e/Lo) 4 1 2 3 5 Stress (F/A) Elastic
Region Plastic
Region Strain
Hardening Fracture ultimate
tensile strength Slope=E Elastic region
slope=Young’s(elastic) modulus
yield strength
Plastic region
ultimate tensile strength
strain hardening
fracture necking yield
strength Stress-Strain Diagram<br>
Region Plastic
Region Strain
Hardening Fracture ultimate
tensile strength Slope=E Elastic region
slope=Young’s(elastic) modulus
yield strength
Plastic region
ultimate tensile strength
strain hardening
fracture necking yield
strength Stress-Strain Diagram<br>
14
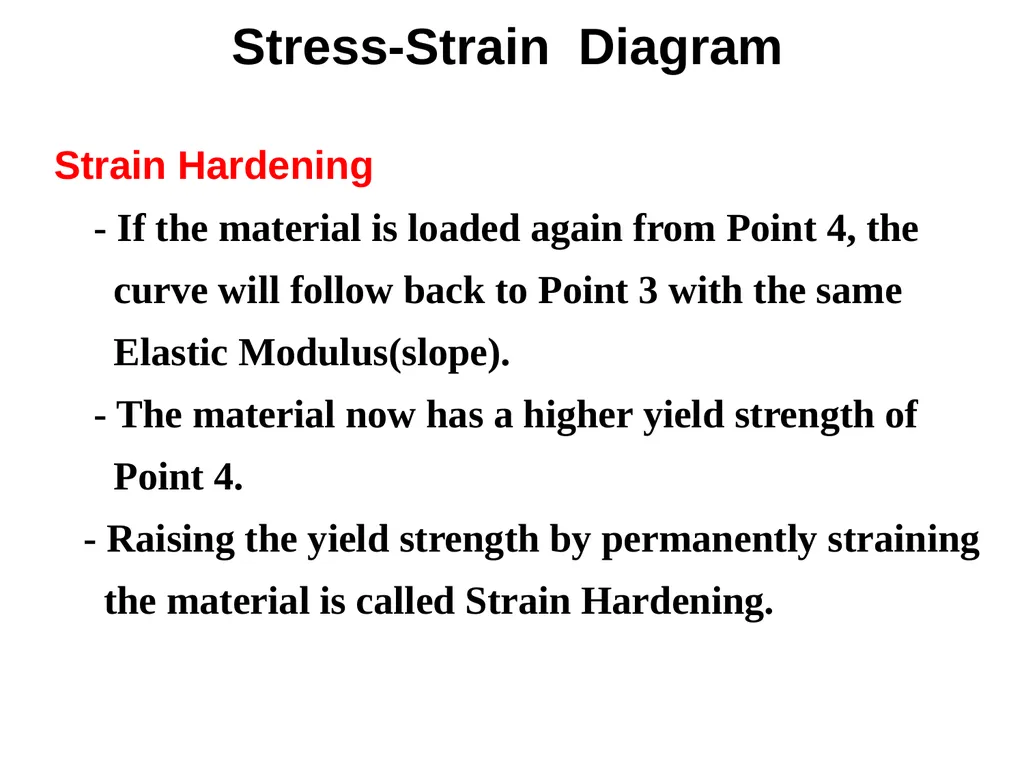
Strain Hardening
- If the material is loaded again from Point 4, the
curve will follow back to Point 3 with the same
Elastic Modulus(slope).
- The material now has a higher yield strength of
Point 4.
- Raising the yield strength by permanently straining
the material is called Strain Hardening. Stress-Strain Diagram<br>
- If the material is loaded again from Point 4, the
curve will follow back to Point 3 with the same
Elastic Modulus(slope).
- The material now has a higher yield strength of
Point 4.
- Raising the yield strength by permanently straining
the material is called Strain Hardening. Stress-Strain Diagram<br>
15
Strain ( ) (e/Lo) 4 1 2 3 5 Stress (F/A) Elastic
Region Plastic
Region Strain
Hardening Fracture ultimate
tensile strength Slope=E Elastic region
slope=Young’s(elastic) modulus
yield strength
Plastic region
ultimate tensile strength
strain hardening
fracture necking yield
strength Stress-Strain Diagram<br>
Region Plastic
Region Strain
Hardening Fracture ultimate
tensile strength Slope=E Elastic region
slope=Young’s(elastic) modulus
yield strength
Plastic region
ultimate tensile strength
strain hardening
fracture necking yield
strength Stress-Strain Diagram<br>
16
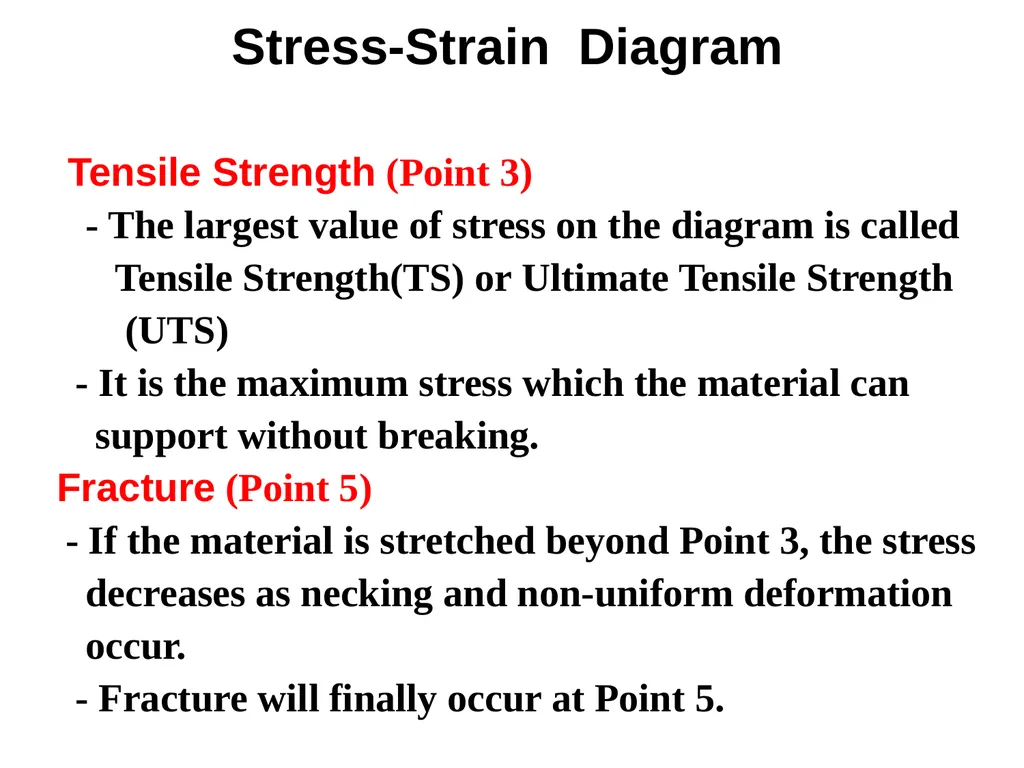
Tensile Strength (Point 3)
- The largest value of stress on the diagram is called
Tensile Strength(TS) or Ultimate Tensile Strength
(UTS)
- It is the maximum stress which the material can
support without breaking.
Fracture (Point 5)
- If the material is stretched beyond Point 3, the stress
decreases as necking and non-uniform deformation
occur.
- Fracture will finally occur at Point 5. Stress-Strain Diagram<br>
- The largest value of stress on the diagram is called
Tensile Strength(TS) or Ultimate Tensile Strength
(UTS)
- It is the maximum stress which the material can
support without breaking.
Fracture (Point 5)
- If the material is stretched beyond Point 3, the stress
decreases as necking and non-uniform deformation
occur.
- Fracture will finally occur at Point 5. Stress-Strain Diagram<br>
17
Strain ( ) (e/Lo) 4 1 2 3 5 Stress (F/A) Elastic
Region Plastic
Region Strain
Hardening Fracture ultimate
tensile strength Slope=E Elastic region
slope=Young’s(elastic) modulus
yield strength
Plastic region
ultimate tensile strength
strain hardening
fracture necking yield
strength Stress-Strain Diagram<br>
Region Plastic
Region Strain
Hardening Fracture ultimate
tensile strength Slope=E Elastic region
slope=Young’s(elastic) modulus
yield strength
Plastic region
ultimate tensile strength
strain hardening
fracture necking yield
strength Stress-Strain Diagram<br>
18
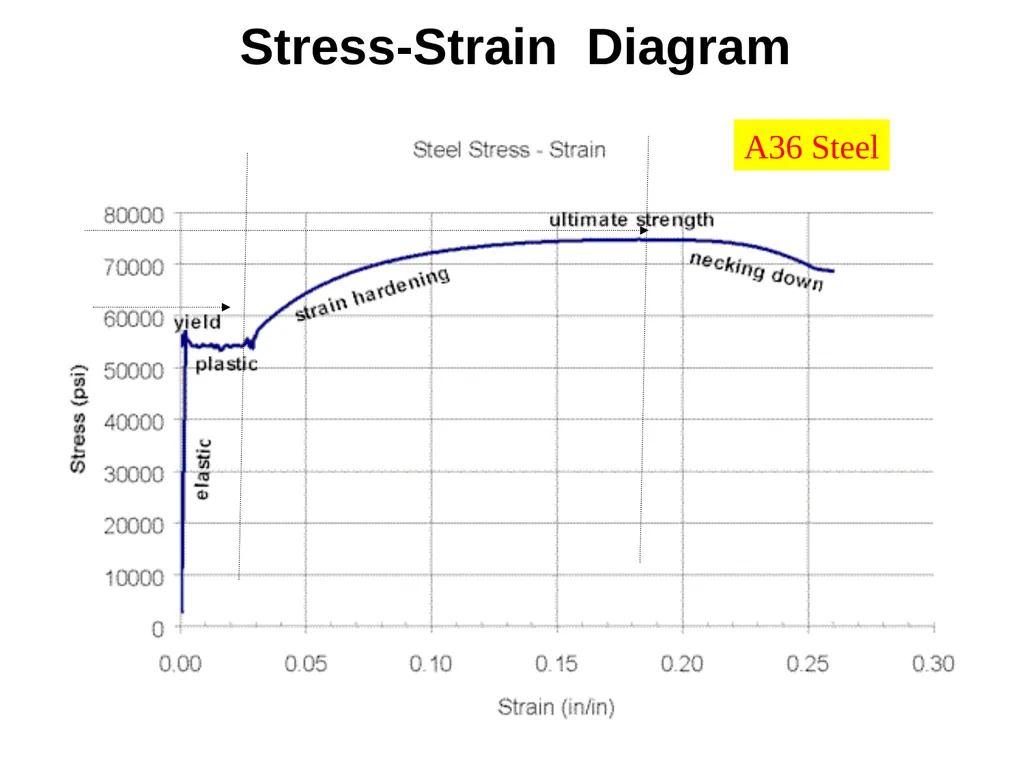
A36 Steel Stress-Strain Diagram<br>
19
5.4 Material Properties Strength
Hardness
Ductility
Brittleness
Toughness Characteristics of Material are described as<br>
Hardness
Ductility
Brittleness
Toughness Characteristics of Material are described as<br>
20
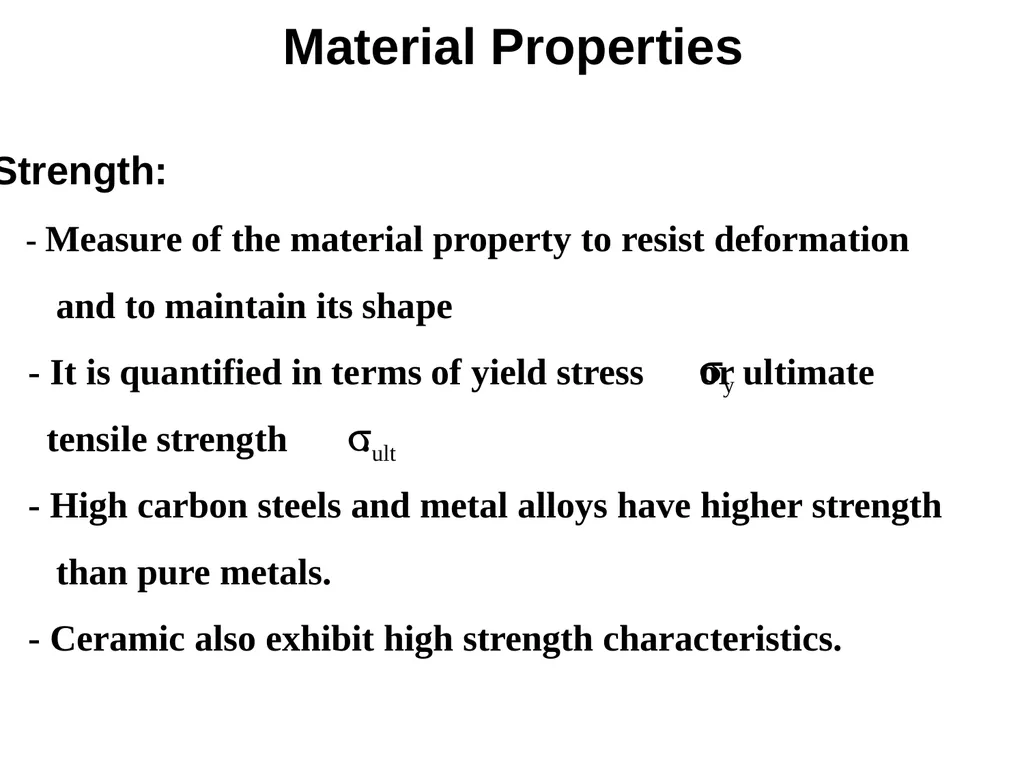
Strength:
- Measure of the material property to resist deformation
and to maintain its shape
- It is quantified in terms of yield stress or ultimate
tensile strength .
- High carbon steels and metal alloys have higher strength
than pure metals.
- Ceramic also exhibit high strength characteristics. Material Properties sult sy<br>
- Measure of the material property to resist deformation
and to maintain its shape
- It is quantified in terms of yield stress or ultimate
tensile strength .
- High carbon steels and metal alloys have higher strength
than pure metals.
- Ceramic also exhibit high strength characteristics. Material Properties sult sy<br>
21
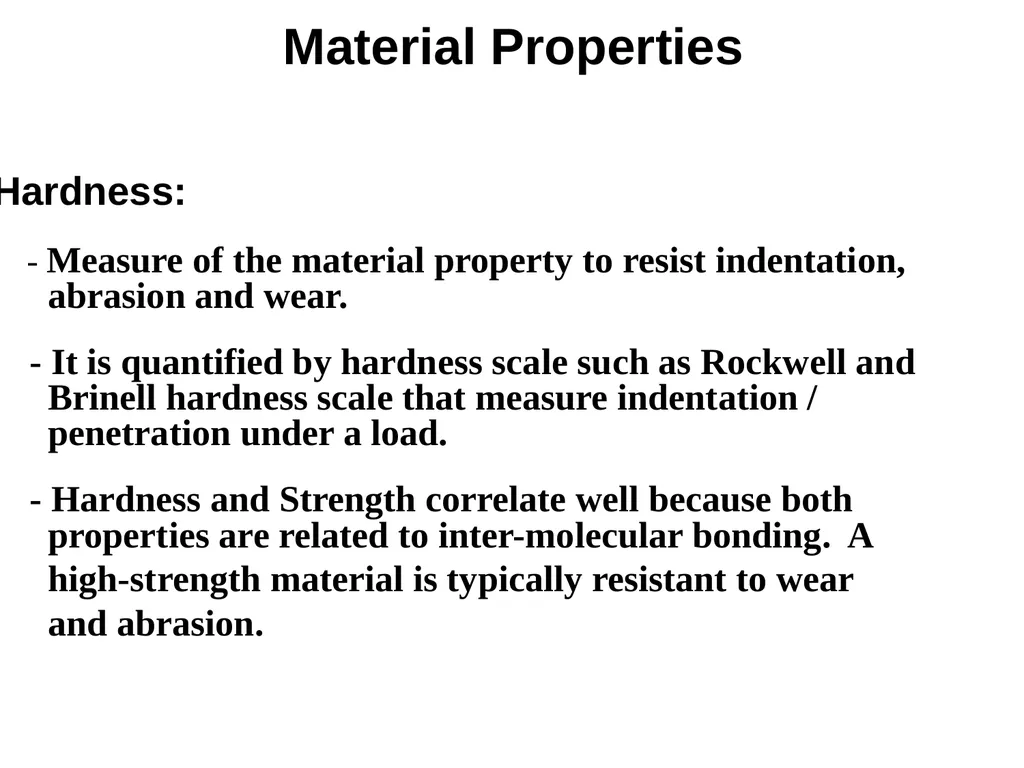
Hardness:
- Measure of the material property to resist indentation,
abrasion and wear.
- It is quantified by hardness scale such as Rockwell and
Brinell hardness scale that measure indentation /
penetration under a load.
- Hardness and Strength correlate well because both
properties are related to inter-molecular bonding. A
high-strength material is typically resistant to wear
and abrasion. Material Properties<br>
- Measure of the material property to resist indentation,
abrasion and wear.
- It is quantified by hardness scale such as Rockwell and
Brinell hardness scale that measure indentation /
penetration under a load.
- Hardness and Strength correlate well because both
properties are related to inter-molecular bonding. A
high-strength material is typically resistant to wear
and abrasion. Material Properties<br>
22
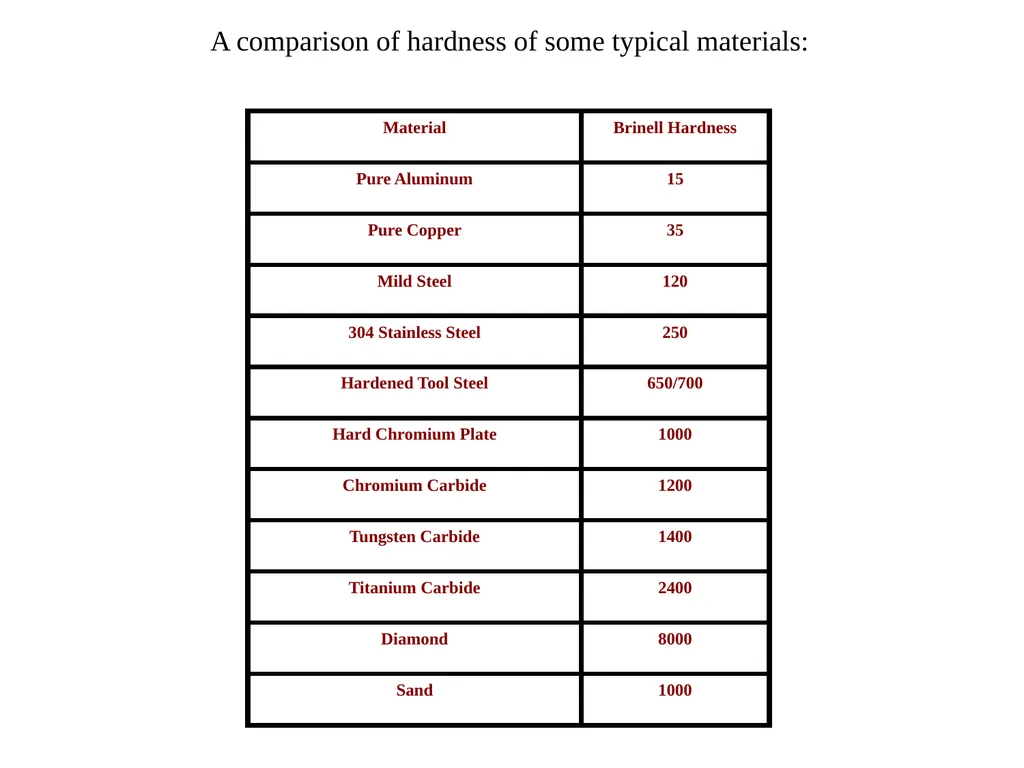
A comparison of hardness of some typical materials:<br>
23
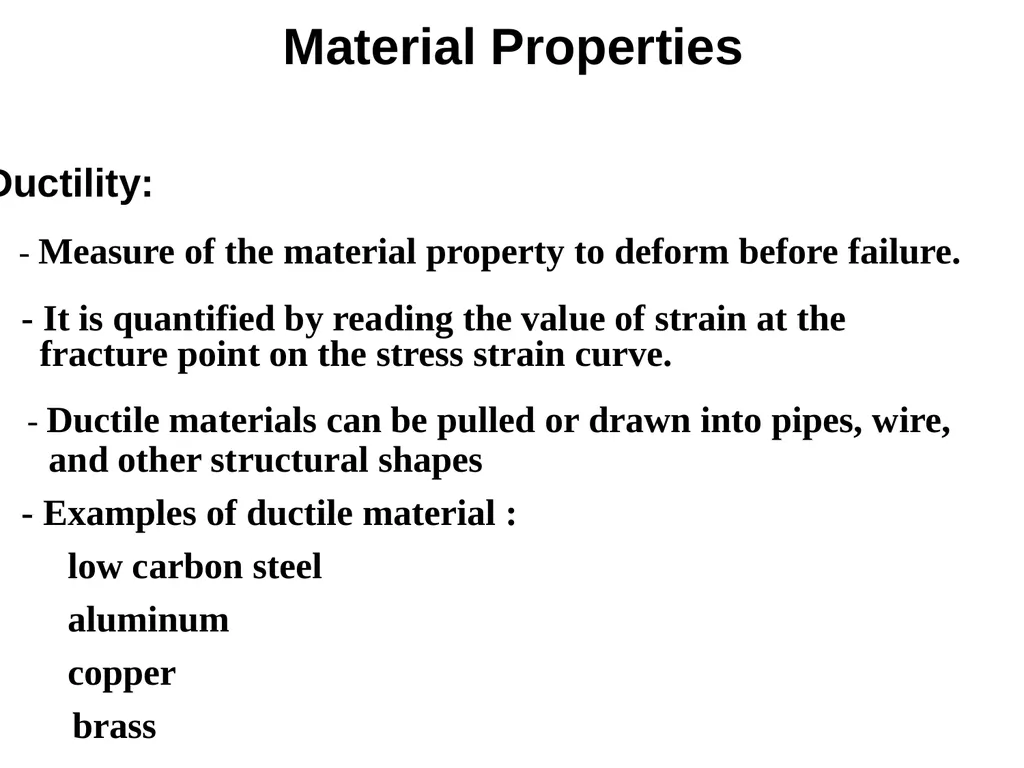
Ductility:
- Measure of the material property to deform before failure.
- It is quantified by reading the value of strain at the
fracture point on the stress strain curve.
- Ductile materials can be pulled or drawn into pipes, wire,
and other structural shapes
- Examples of ductile material :
low carbon steel
aluminum
copper
brass Material Properties<br>
- Measure of the material property to deform before failure.
- It is quantified by reading the value of strain at the
fracture point on the stress strain curve.
- Ductile materials can be pulled or drawn into pipes, wire,
and other structural shapes
- Examples of ductile material :
low carbon steel
aluminum
copper
brass Material Properties<br>
24
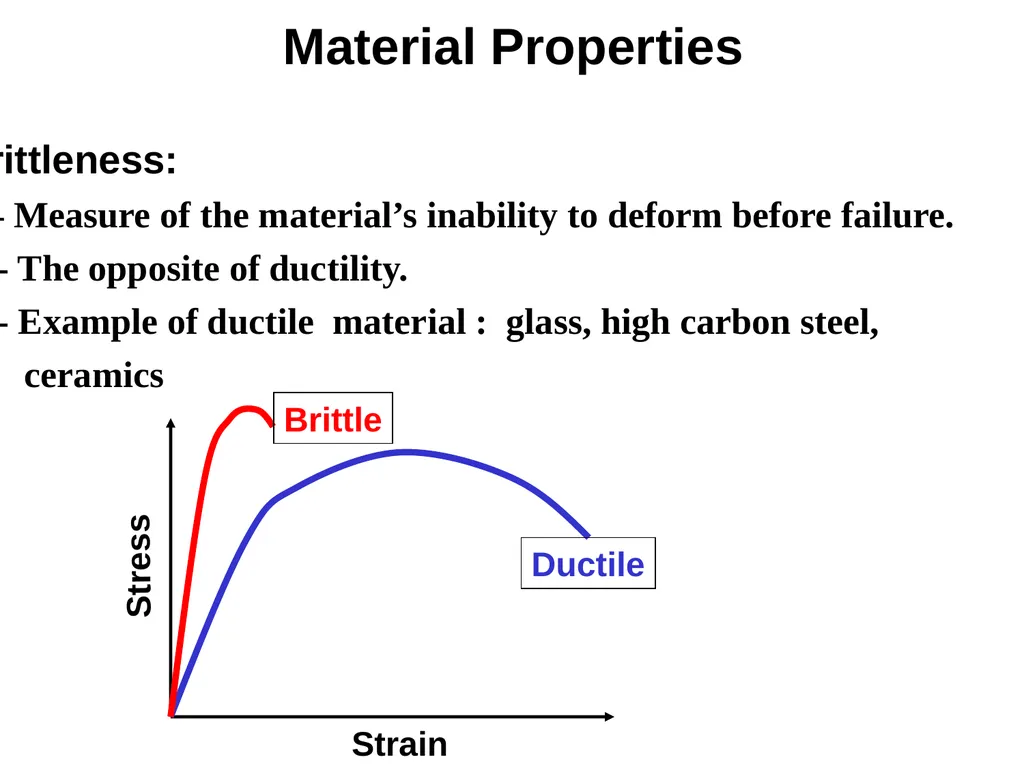
Brittleness:
- Measure of the material’s inability to deform before failure.
- The opposite of ductility.
- Example of ductile material : glass, high carbon steel,
ceramics Ductile Brittle Stress Strain Material Properties<br>
- Measure of the material’s inability to deform before failure.
- The opposite of ductility.
- Example of ductile material : glass, high carbon steel,
ceramics Ductile Brittle Stress Strain Material Properties<br>
25
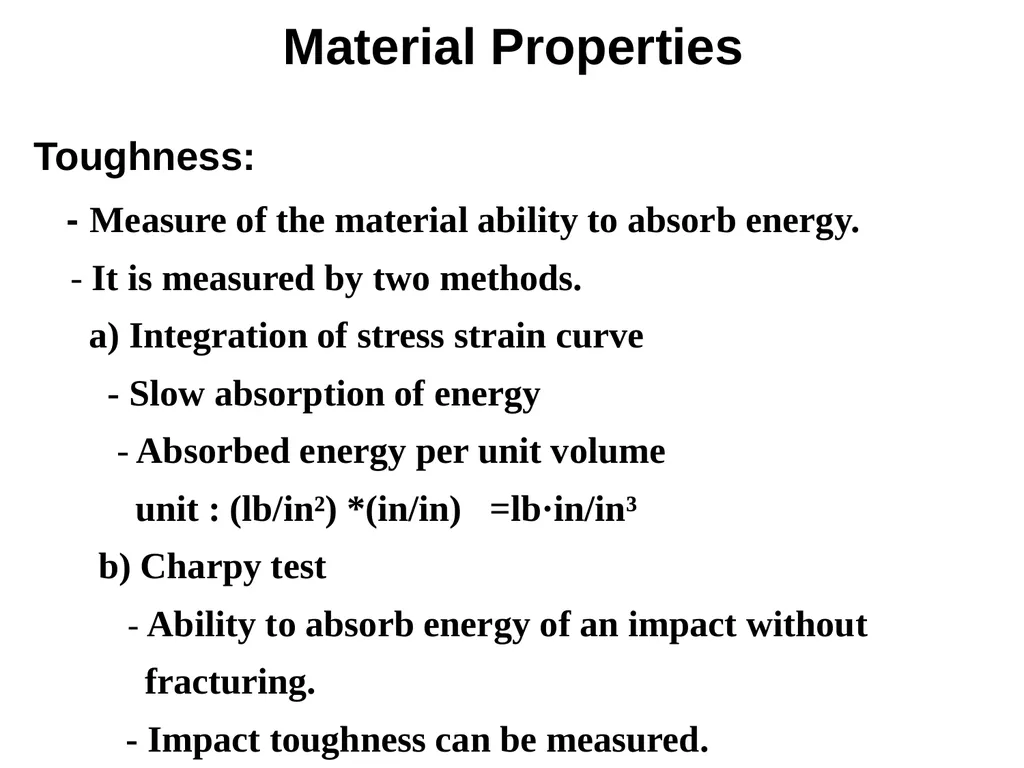
Toughness:
- Measure of the material ability to absorb energy.
- It is measured by two methods.
a) Integration of stress strain curve
- Slow absorption of energy
- Absorbed energy per unit volume
unit : (lb/in²) *(in/in) =lb·in/in³
b) Charpy test
- Ability to absorb energy of an impact without
fracturing.
- Impact toughness can be measured. Material Properties<br>
- Measure of the material ability to absorb energy.
- It is measured by two methods.
a) Integration of stress strain curve
- Slow absorption of energy
- Absorbed energy per unit volume
unit : (lb/in²) *(in/in) =lb·in/in³
b) Charpy test
- Ability to absorb energy of an impact without
fracturing.
- Impact toughness can be measured. Material Properties<br>
26
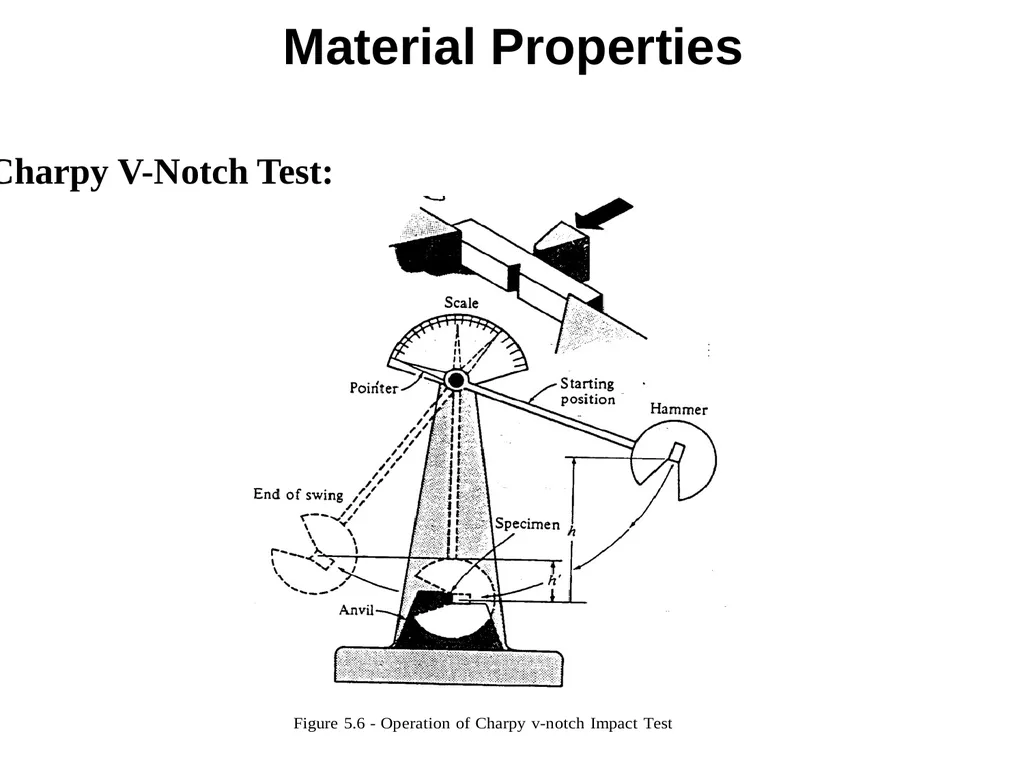
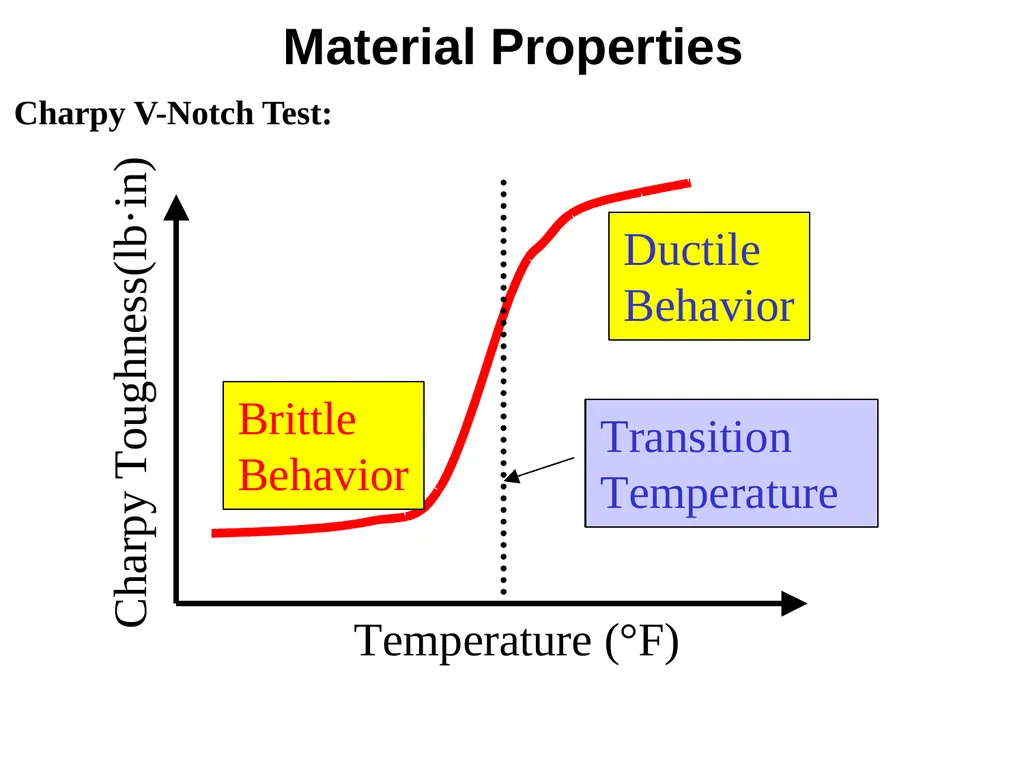
Charpy V-Notch Test: Material Properties<br>
27
Charpy V-Notch Test:
- Charpy test is an impact toughness measurement test
because the energy is absorbed by the specimen very
rapidly.
- The potential energy of the pendulum before and after
impact can be calculated form the initial and final
location of the pendulum.
- The potential energy difference is the energy it took to
break the material absorbed during the impact.
- Purpose is to evaluate the impact toughness as a
function of temperature Material Properties<br>
- Charpy test is an impact toughness measurement test
because the energy is absorbed by the specimen very
rapidly.
- The potential energy of the pendulum before and after
impact can be calculated form the initial and final
location of the pendulum.
- The potential energy difference is the energy it took to
break the material absorbed during the impact.
- Purpose is to evaluate the impact toughness as a
function of temperature Material Properties<br>
28
Material Properties Charpy V-Notch Test:<br>
29
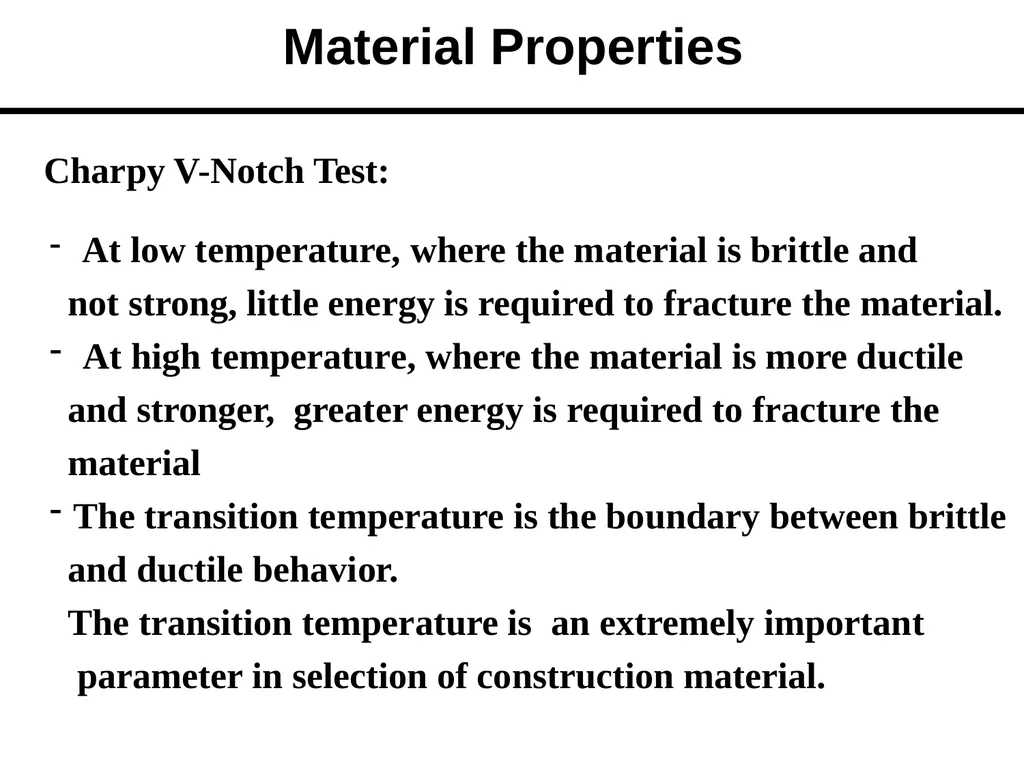
Charpy V-Notch Test: At low temperature, where the material is brittle and
not strong, little energy is required to fracture the material.
At high temperature, where the material is more ductile
and stronger, greater energy is required to fracture the
material
The transition temperature is the boundary between brittle
and ductile behavior.
The transition temperature is an extremely important
parameter in selection of construction material. Material Properties<br>
not strong, little energy is required to fracture the material.
At high temperature, where the material is more ductile
and stronger, greater energy is required to fracture the
material
The transition temperature is the boundary between brittle
and ductile behavior.
The transition temperature is an extremely important
parameter in selection of construction material. Material Properties<br>
30
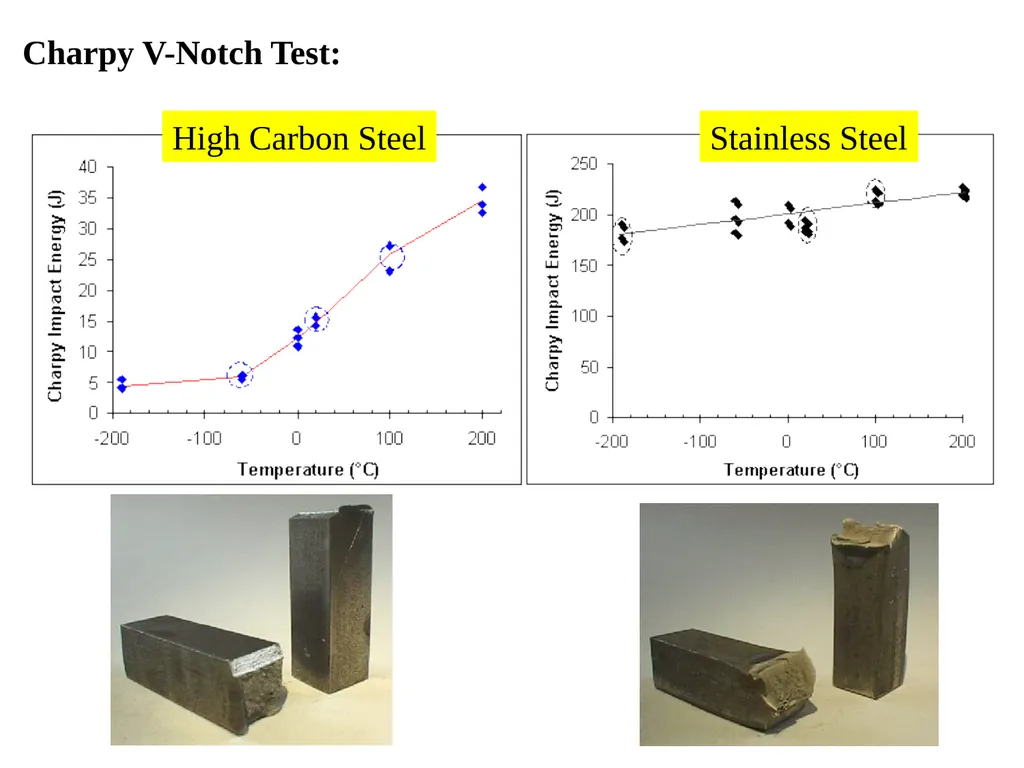
High Carbon Steel Stainless Steel Charpy V-Notch Test:<br>
31
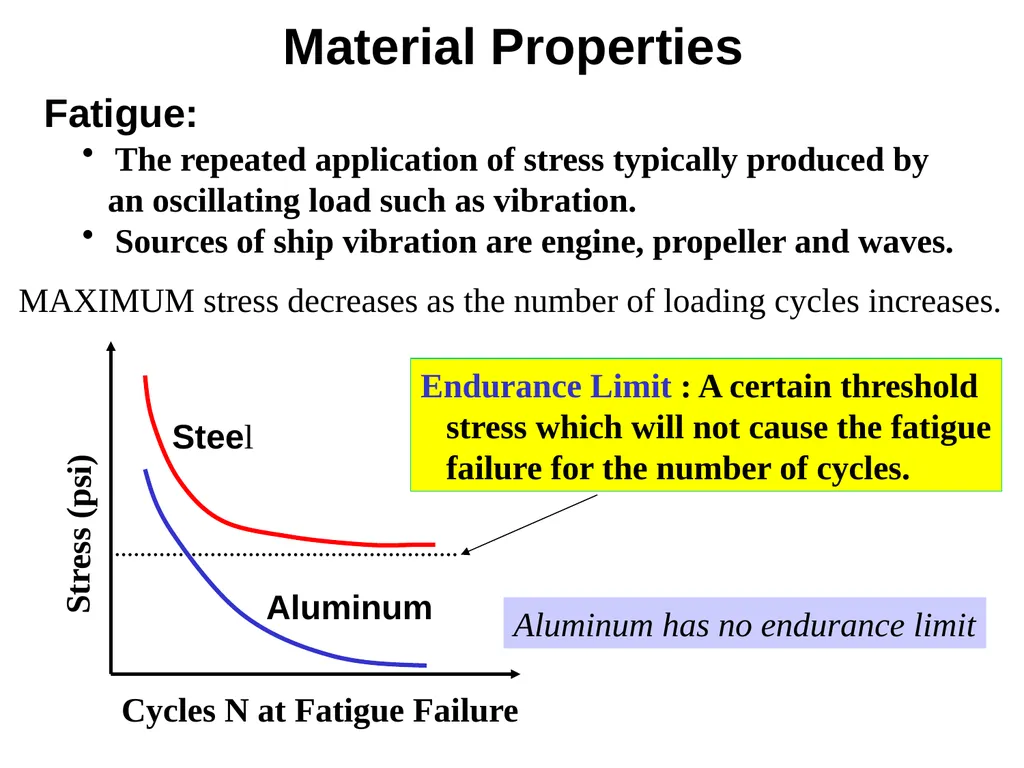
Fatigue: The repeated application of stress typically produced by
an oscillating load such as vibration.
Sources of ship vibration are engine, propeller and waves. Cycles N at Fatigue Failure Stress (psi) Steel Aluminum Endurance Limit : A certain threshold
stress which will not cause the fatigue
failure for the number of cycles. Aluminum has no endurance limit Material Properties MAXIMUM stress decreases as the number of loading cycles increases.<br>
an oscillating load such as vibration.
Sources of ship vibration are engine, propeller and waves. Cycles N at Fatigue Failure Stress (psi) Steel Aluminum Endurance Limit : A certain threshold
stress which will not cause the fatigue
failure for the number of cycles. Aluminum has no endurance limit Material Properties MAXIMUM stress decreases as the number of loading cycles increases.<br>
32
Factors effecting Material Properties Temperature :
Increasing temperature will:
- Decrease Modulus of Elasticity
(As Long as Structure Does Not Change)
- Decrease Yield Strength
- Decrease Ultimate Tensile Strength
- Decrease Hardness
- Increase Ductility
- Decrease Brittleness
Environment:
- Sulfites, Chlorine, Oxygen in water,
Radiation, Pressure<br>
Increasing temperature will:
- Decrease Modulus of Elasticity
(As Long as Structure Does Not Change)
- Decrease Yield Strength
- Decrease Ultimate Tensile Strength
- Decrease Hardness
- Increase Ductility
- Decrease Brittleness
Environment:
- Sulfites, Chlorine, Oxygen in water,
Radiation, Pressure<br>
33
Thermal Treatments (Application of heat over varying time): Hardening:
- Heating higher than its critical temperature then
cooling rapidly.
- Improves hardness.
- Increases internal stresses, may cause cracking. Annealing:
- Heating higher than its critical temperature then
cooling slowly.
- Improves hardness, strength, and ductility.
- Ship’s hulls are annealed. Ways to Effect / Alter Material Properties Alloying (Adding other elements to alter the molecular properties): - Steel: Carbon, chromium, molybdenum, nickel, tungsten, manganese
- Aluminum: Copper, manganese, silicon, zinc, magnesium<br>
- Heating higher than its critical temperature then
cooling rapidly.
- Improves hardness.
- Increases internal stresses, may cause cracking. Annealing:
- Heating higher than its critical temperature then
cooling slowly.
- Improves hardness, strength, and ductility.
- Ship’s hulls are annealed. Ways to Effect / Alter Material Properties Alloying (Adding other elements to alter the molecular properties): - Steel: Carbon, chromium, molybdenum, nickel, tungsten, manganese
- Aluminum: Copper, manganese, silicon, zinc, magnesium<br>
34
Ways to Effect / Alter Material Properties Thermal Treatments: Hot-Working:
- Forming of shapes while material is hot.
- Less internal stresses due to annealing (change in
the molecular structure). Cold-Working:
- Forming shapes while material is cold.
- Causes internal stresses, resulting in a stronger shape. Tempering:
- Steel is heated below the critical temperature and
cooled slowly.
- Used with hardening to reduce the internal stresses.<br>
- Forming of shapes while material is hot.
- Less internal stresses due to annealing (change in
the molecular structure). Cold-Working:
- Forming shapes while material is cold.
- Causes internal stresses, resulting in a stronger shape. Tempering:
- Steel is heated below the critical temperature and
cooled slowly.
- Used with hardening to reduce the internal stresses.<br>
35
Corrosion & Corrosion Protection Corrosion is the destruction of metals due to oxidation or
other chemical reactions. - Cathodic Protection
- Charging the metal to slow/ stop reaction
with other elements
- Providing a sacrificial metal to give up ions
instead of the structure giving up ions (and
corroding) Corrosion Protection:
- Design to eliminate conditions favorable to corrosion
- You, a wire brush, and paint<br>
other chemical reactions. - Cathodic Protection
- Charging the metal to slow/ stop reaction
with other elements
- Providing a sacrificial metal to give up ions
instead of the structure giving up ions (and
corroding) Corrosion Protection:
- Design to eliminate conditions favorable to corrosion
- You, a wire brush, and paint<br>
36
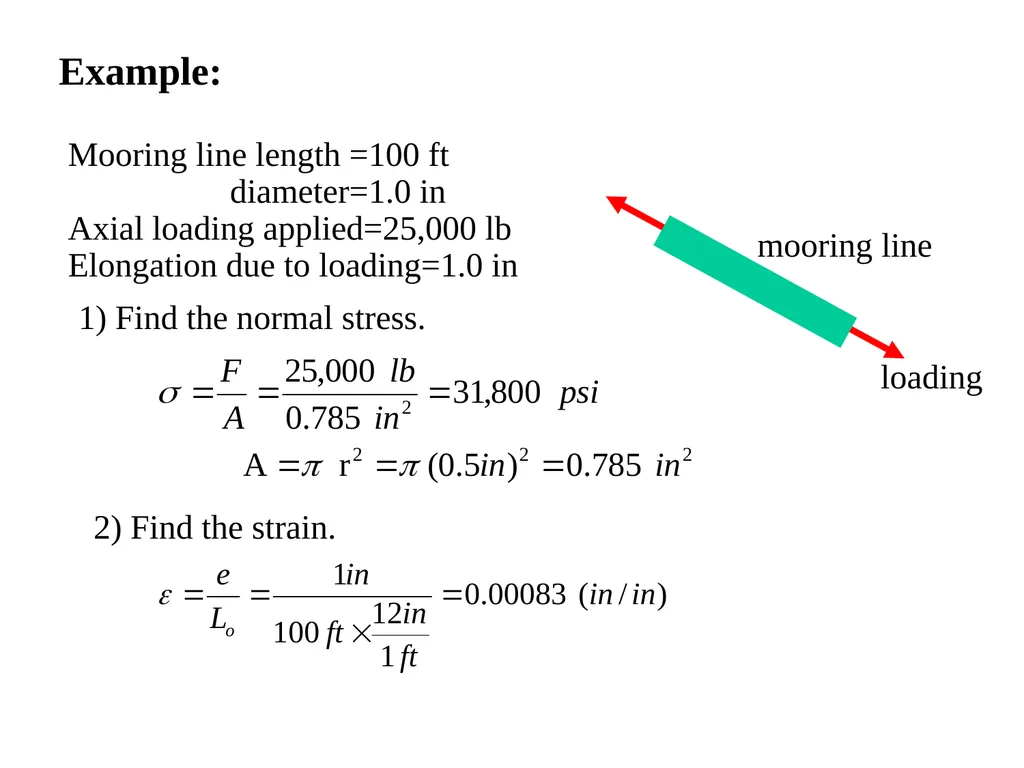
Example:
Mooring line length =100 ft
diameter=1.0 in
Axial loading applied=25,000 lb
Elongation due to loading=1.0 in mooring line loading 1) Find the normal stress. 2) Find the strain.<br>
Mooring line length =100 ft
diameter=1.0 in
Axial loading applied=25,000 lb
Elongation due to loading=1.0 in mooring line loading 1) Find the normal stress. 2) Find the strain.<br>
37
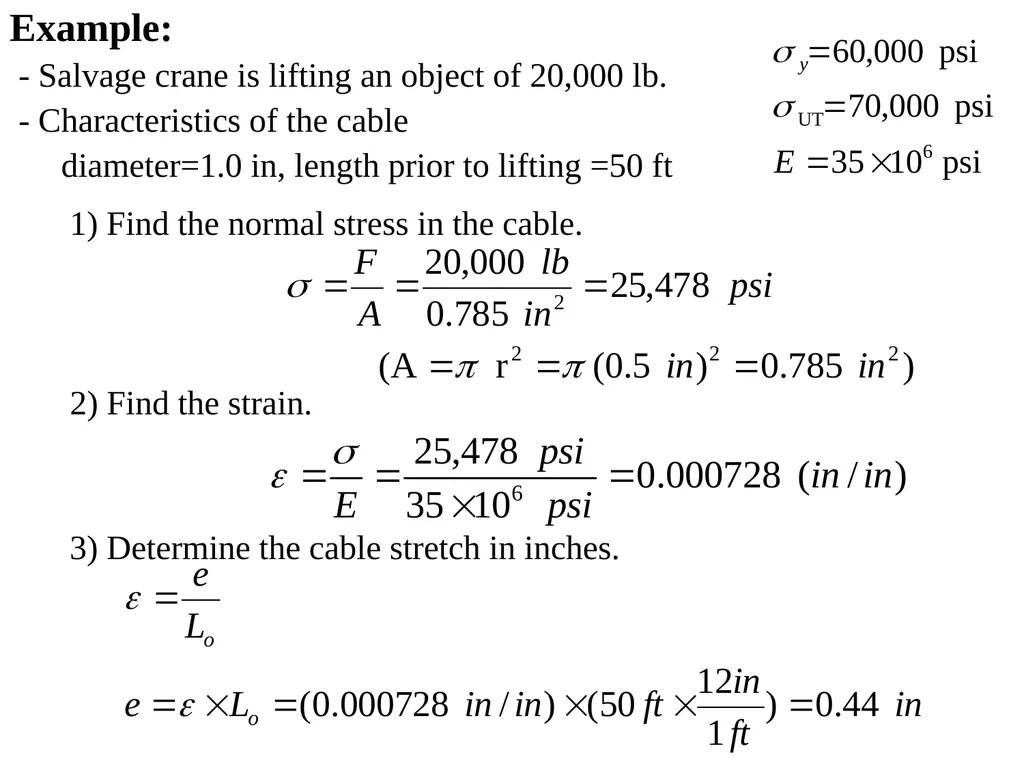
Example:
- Salvage crane is lifting an object of 20,000 lb.
- Characteristics of the cable
diameter=1.0 in, length prior to lifting =50 ft 1) Find the normal stress in the cable. 2) Find the strain. 3) Determine the cable stretch in inches.<br>
- Salvage crane is lifting an object of 20,000 lb.
- Characteristics of the cable
diameter=1.0 in, length prior to lifting =50 ft 1) Find the normal stress in the cable. 2) Find the strain. 3) Determine the cable stretch in inches.<br>
38
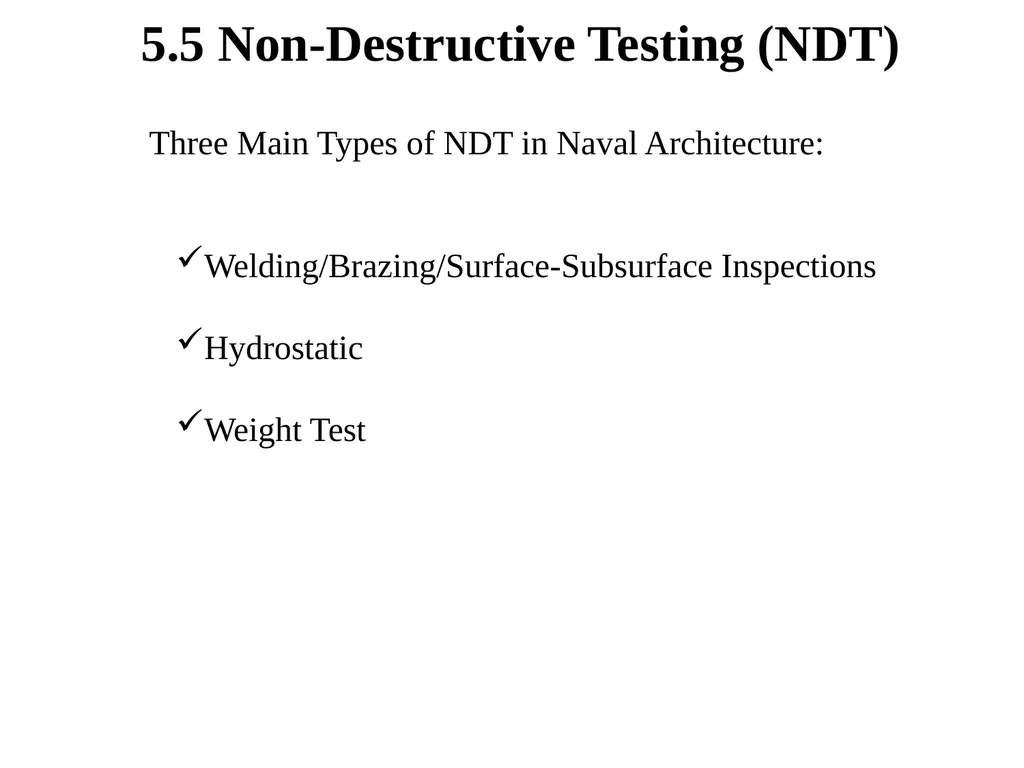
5.5 Non-Destructive Testing (NDT) Three Main Types of NDT in Naval Architecture:
Welding/Brazing/Surface-Subsurface Inspections
Hydrostatic
Weight Test<br>
Welding/Brazing/Surface-Subsurface Inspections
Hydrostatic
Weight Test<br>
39
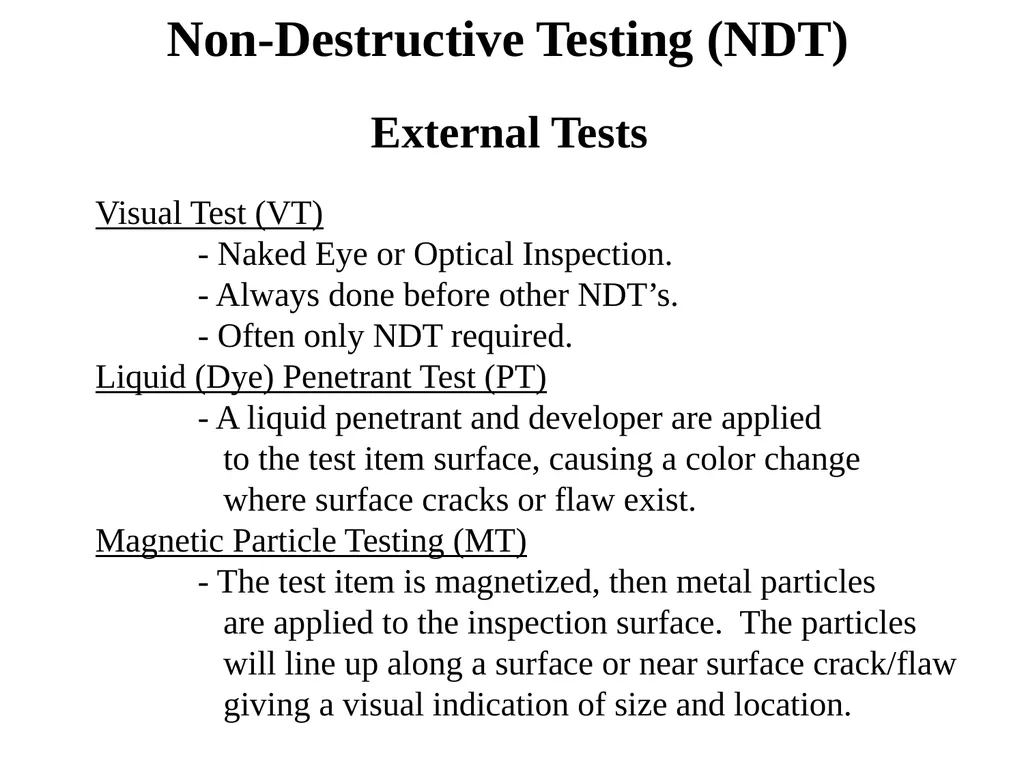
Visual Test (VT)
- Naked Eye or Optical Inspection.
- Always done before other NDT’s.
- Often only NDT required.
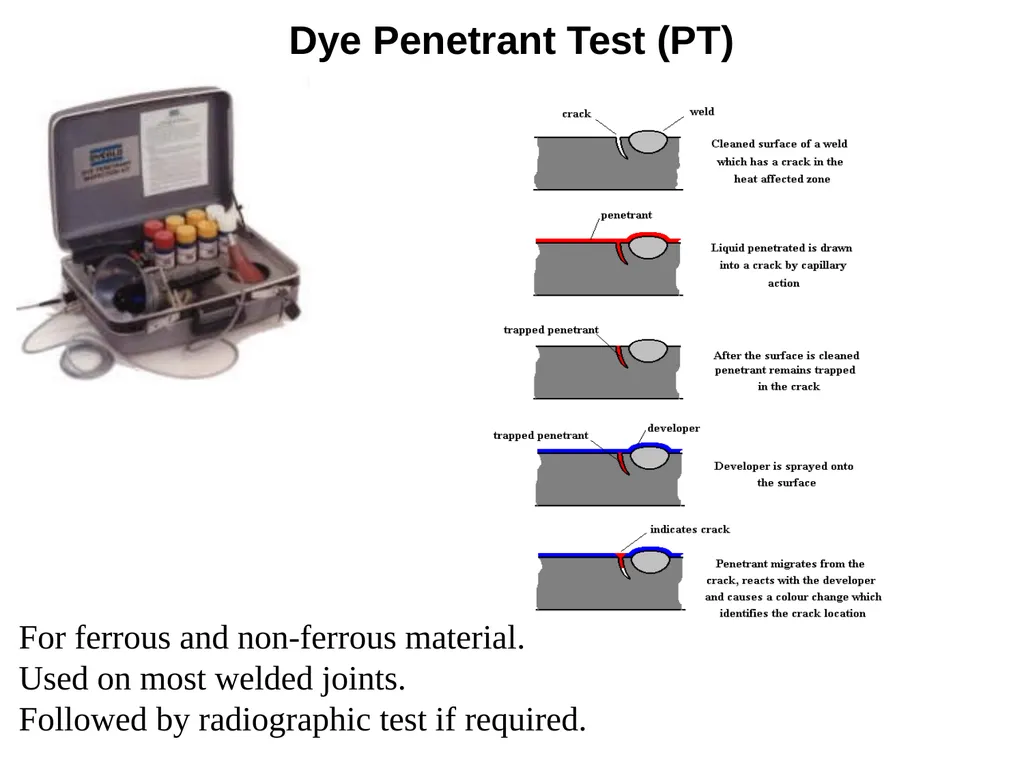
Liquid (Dye) Penetrant Test (PT)
- A liquid penetrant and developer are applied
to the test item surface, causing a color change
where surface cracks or flaw exist.
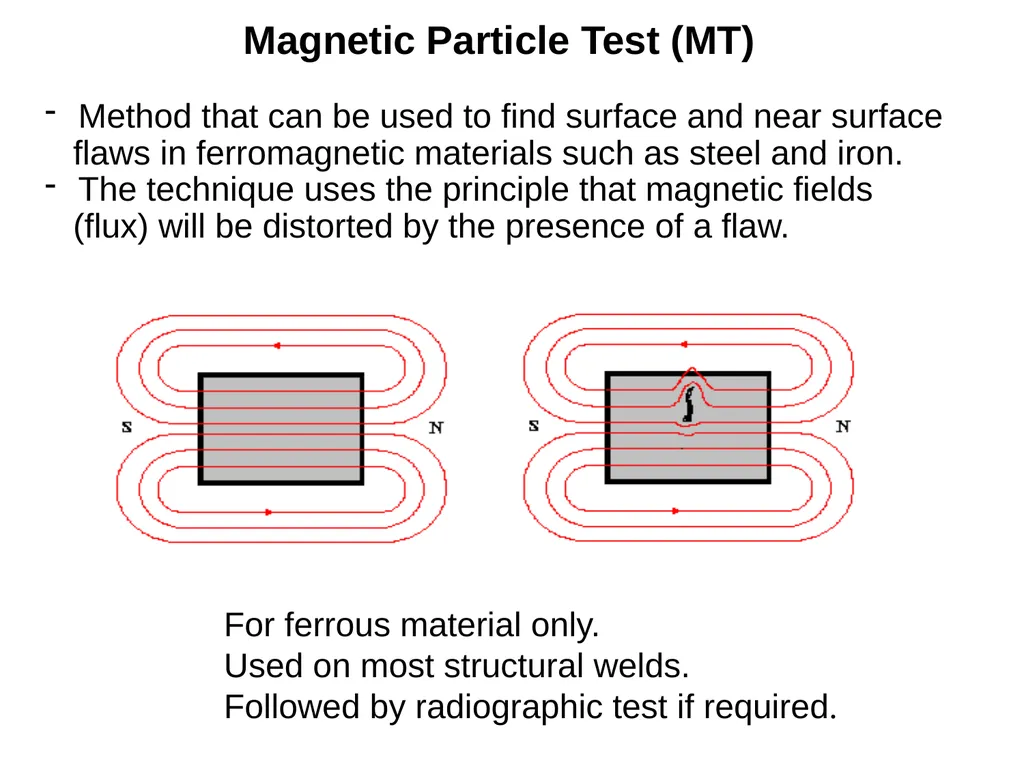
Magnetic Particle Testing (MT)
- The test item is magnetized, then metal particles
are applied to the inspection surface. The particles
will line up along a surface or near surface crack/flaw
giving a visual indication of size and location. External Tests Non-Destructive Testing (NDT)<br>
- Naked Eye or Optical Inspection.
- Always done before other NDT’s.
- Often only NDT required.
Liquid (Dye) Penetrant Test (PT)
- A liquid penetrant and developer are applied
to the test item surface, causing a color change
where surface cracks or flaw exist.
Magnetic Particle Testing (MT)
- The test item is magnetized, then metal particles
are applied to the inspection surface. The particles
will line up along a surface or near surface crack/flaw
giving a visual indication of size and location. External Tests Non-Destructive Testing (NDT)<br>
40
Dye Penetrant Test (PT) For ferrous and non-ferrous material.
Used on most welded joints.
Followed by radiographic test if required.<br>
Used on most welded joints.
Followed by radiographic test if required.<br>
41
Magnetic Particle Test (MT) Method that can be used to find surface and near surface
flaws in ferromagnetic materials such as steel and iron.
The technique uses the principle that magnetic fields
(flux) will be distorted by the presence of a flaw. For ferrous material only.
Used on most structural welds.
Followed by radiographic test if required.<br>
flaws in ferromagnetic materials such as steel and iron.
The technique uses the principle that magnetic fields
(flux) will be distorted by the presence of a flaw. For ferrous material only.
Used on most structural welds.
Followed by radiographic test if required.<br>
42
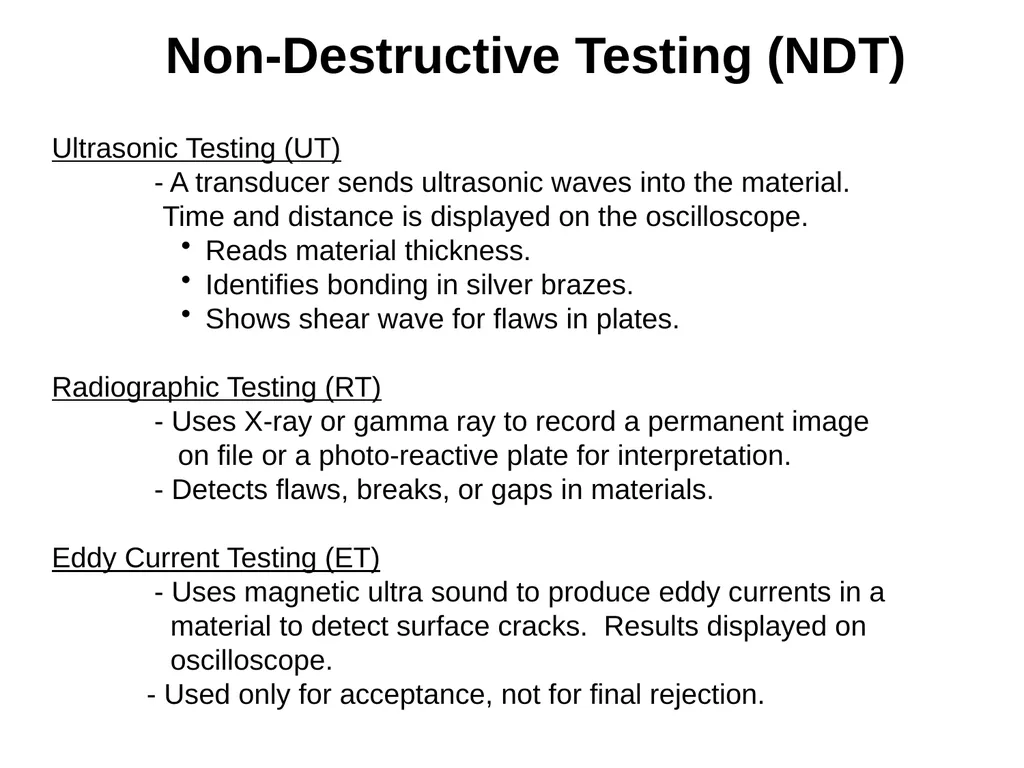
Non-Destructive Testing (NDT) Ultrasonic Testing (UT)
- A transducer sends ultrasonic waves into the material.
Time and distance is displayed on the oscilloscope.
Reads material thickness.
Identifies bonding in silver brazes.
Shows shear wave for flaws in plates.
Radiographic Testing (RT)
- Uses X-ray or gamma ray to record a permanent image
on file or a photo-reactive plate for interpretation.
- Detects flaws, breaks, or gaps in materials.
Eddy Current Testing (ET)
- Uses magnetic ultra sound to produce eddy currents in a
material to detect surface cracks. Results displayed on
oscilloscope.
- Used only for acceptance, not for final rejection.<br>
- A transducer sends ultrasonic waves into the material.
Time and distance is displayed on the oscilloscope.
Reads material thickness.
Identifies bonding in silver brazes.
Shows shear wave for flaws in plates.
Radiographic Testing (RT)
- Uses X-ray or gamma ray to record a permanent image
on file or a photo-reactive plate for interpretation.
- Detects flaws, breaks, or gaps in materials.
Eddy Current Testing (ET)
- Uses magnetic ultra sound to produce eddy currents in a
material to detect surface cracks. Results displayed on
oscilloscope.
- Used only for acceptance, not for final rejection.<br>
43
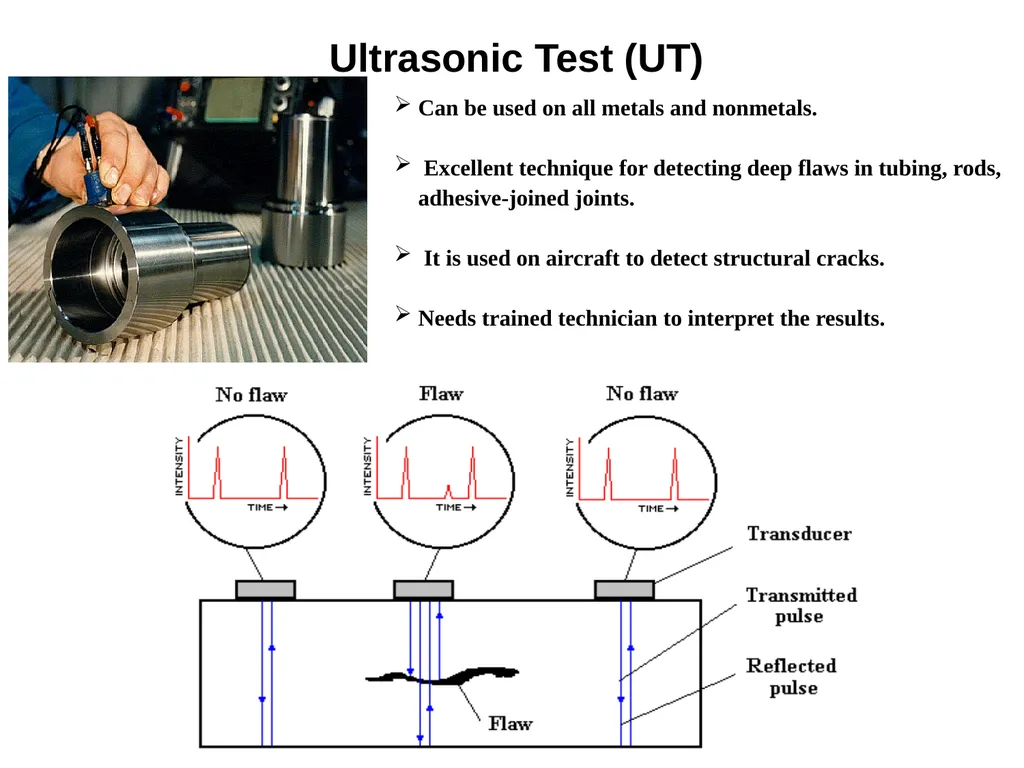
Ultrasonic Test (UT) Can be used on all metals and nonmetals.
Excellent technique for detecting deep flaws in tubing, rods, adhesive-joined joints.
It is used on aircraft to detect structural cracks.
Needs trained technician to interpret the results.<br>
Excellent technique for detecting deep flaws in tubing, rods, adhesive-joined joints.
It is used on aircraft to detect structural cracks.
Needs trained technician to interpret the results.<br>
44
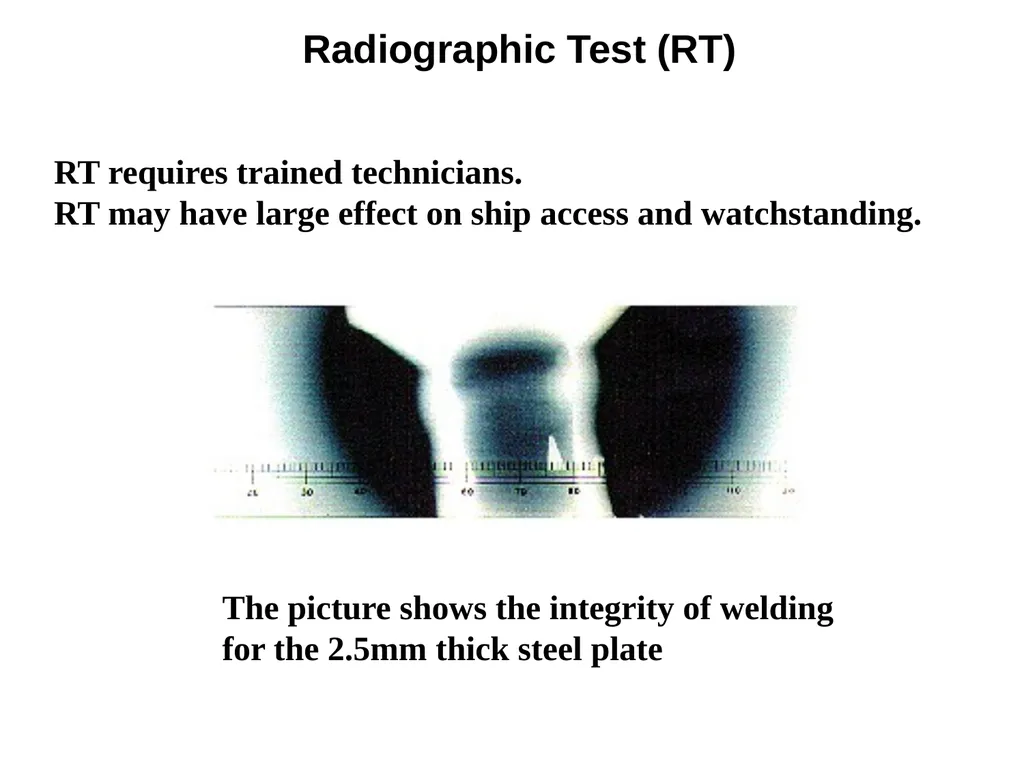
Radiographic Test (RT) RT requires trained technicians.
RT may have large effect on ship access and watchstanding. The picture shows the integrity of welding
for the 2.5mm thick steel plate<br>
RT may have large effect on ship access and watchstanding. The picture shows the integrity of welding
for the 2.5mm thick steel plate<br>
45
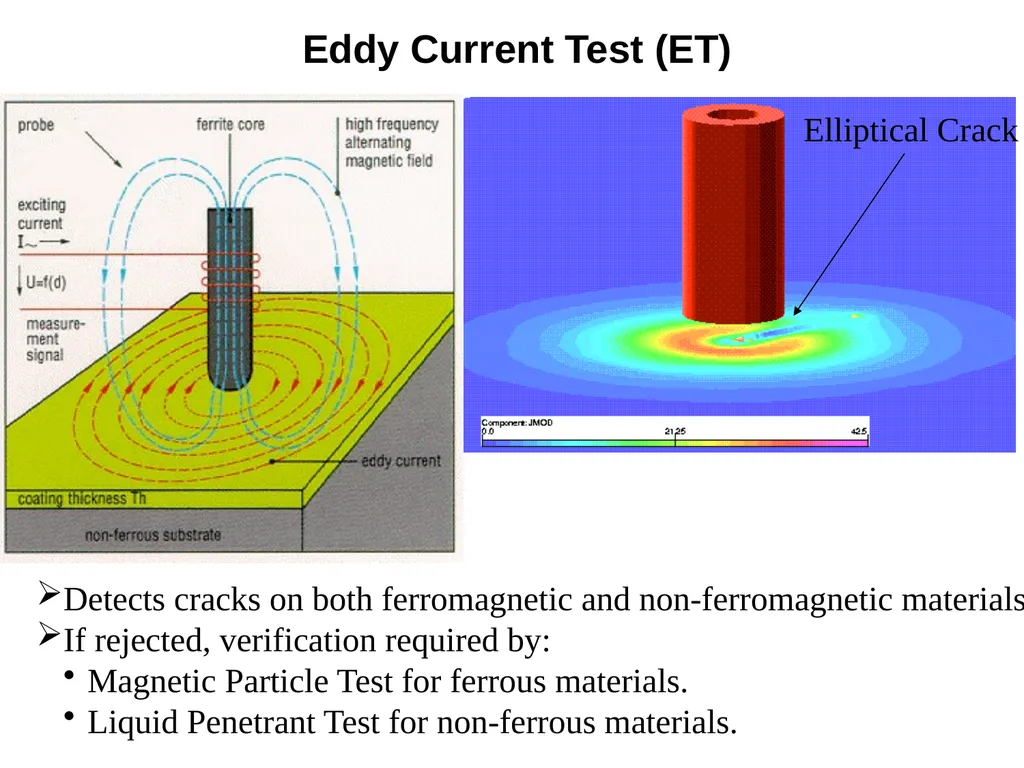
Eddy Current Test (ET) Elliptical Crack Detects cracks on both ferromagnetic and non-ferromagnetic materials.
If rejected, verification required by:
Magnetic Particle Test for ferrous materials.
Liquid Penetrant Test for non-ferrous materials.<br>
If rejected, verification required by:
Magnetic Particle Test for ferrous materials.
Liquid Penetrant Test for non-ferrous materials.<br>
46
Some Systems Subjected to Hydrostatic Testing:
Drainage Systems
Firemain/Flush/Seawater Circulations Systems
Steam Systems
Compressed Air Systems
Fuel Systems
Hydraulic Systems
Feed/Condensate Systems
Fresh Water Systems
Sewage Systems
Subjected to Hydrostatic Testing:
Valves
Piping
Heat Exchangers
Pumps
Mechanical Connections
Flasks Hydrostatic Tests<br>
Drainage Systems
Firemain/Flush/Seawater Circulations Systems
Steam Systems
Compressed Air Systems
Fuel Systems
Hydraulic Systems
Feed/Condensate Systems
Fresh Water Systems
Sewage Systems
Subjected to Hydrostatic Testing:
Valves
Piping
Heat Exchangers
Pumps
Mechanical Connections
Flasks Hydrostatic Tests<br>
47
Fluid systems are hydrostatically tested during initial construction, and subsequent to repairs, modifications, and component replacement; to verify the leak tightness of the system.
Operational pressure tests are performed periodically to determine leak tightness of system mechanical joints.
Operational pressure tests are also performed instead of hydrostatic tests, when the criteria for the Operating Pressure Test Option are met.
The basic purpose of all such tests is to ascertain that the system can perform its intended function safely and reliably. Hydrostatic Tests<br>
Operational pressure tests are performed periodically to determine leak tightness of system mechanical joints.
Operational pressure tests are also performed instead of hydrostatic tests, when the criteria for the Operating Pressure Test Option are met.
The basic purpose of all such tests is to ascertain that the system can perform its intended function safely and reliably. Hydrostatic Tests<br>
48
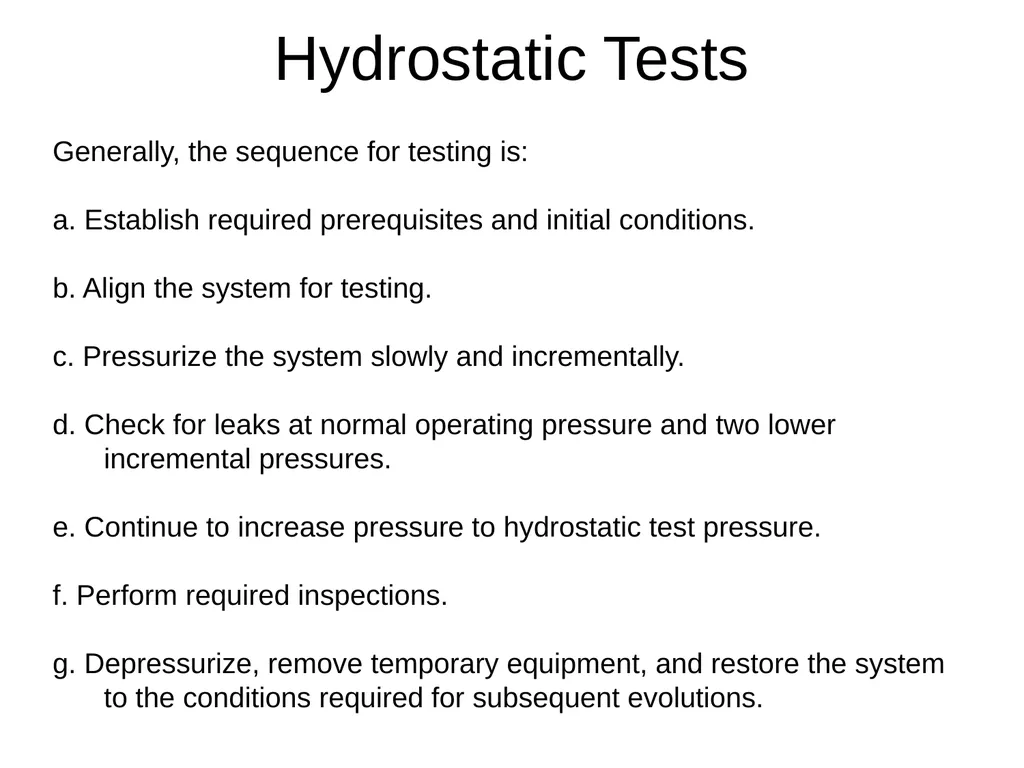
Hydrostatic Tests Generally, the sequence for testing is:
a. Establish required prerequisites and initial conditions.
b. Align the system for testing.
c. Pressurize the system slowly and incrementally.
d. Check for leaks at normal operating pressure and two lower incremental pressures.
e. Continue to increase pressure to hydrostatic test pressure.
f. Perform required inspections.
g. Depressurize, remove temporary equipment, and restore the system to the conditions required for subsequent evolutions.<br>
a. Establish required prerequisites and initial conditions.
b. Align the system for testing.
c. Pressurize the system slowly and incrementally.
d. Check for leaks at normal operating pressure and two lower incremental pressures.
e. Continue to increase pressure to hydrostatic test pressure.
f. Perform required inspections.
g. Depressurize, remove temporary equipment, and restore the system to the conditions required for subsequent evolutions.<br>
49
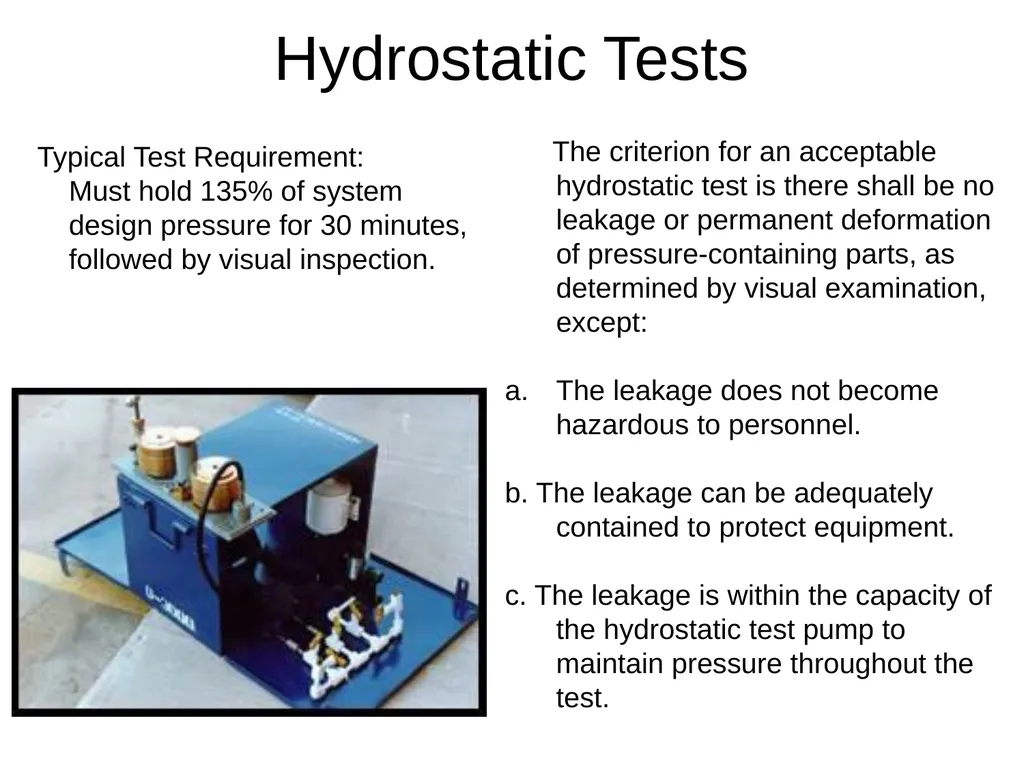
Hydrostatic Tests The criterion for an acceptable hydrostatic test is there shall be no leakage or permanent deformation of pressure-containing parts, as determined by visual examination, except:
The leakage does not become hazardous to personnel.
b. The leakage can be adequately contained to protect equipment.
c. The leakage is within the capacity of the hydrostatic test pump to maintain pressure throughout the test. Typical Test Requirement:
Must hold 135% of system
design pressure for 30 minutes,
followed by visual inspection.<br>
The leakage does not become hazardous to personnel.
b. The leakage can be adequately contained to protect equipment.
c. The leakage is within the capacity of the hydrostatic test pump to maintain pressure throughout the test. Typical Test Requirement:
Must hold 135% of system
design pressure for 30 minutes,
followed by visual inspection.<br>
50
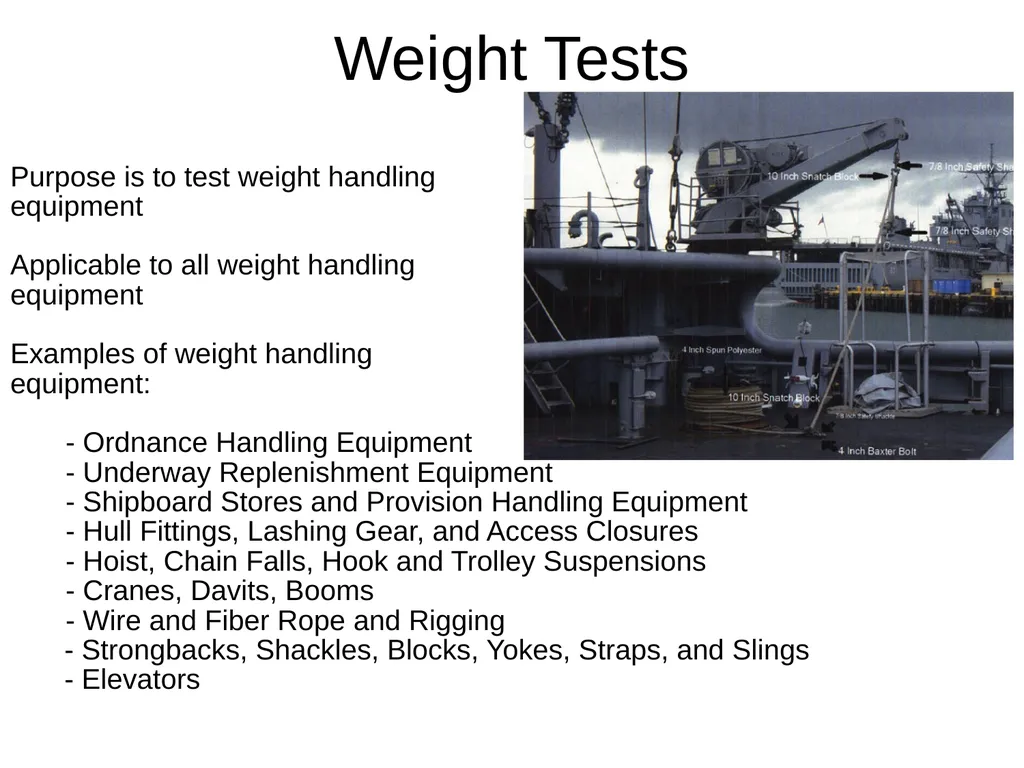
Weight Tests Purpose is to test weight handling
equipment
Applicable to all weight handling
equipment
Examples of weight handling
equipment:
- Ordnance Handling Equipment
- Underway Replenishment Equipment
- Shipboard Stores and Provision Handling Equipment
- Hull Fittings, Lashing Gear, and Access Closures
- Hoist, Chain Falls, Hook and Trolley Suspensions
- Cranes, Davits, Booms
- Wire and Fiber Rope and Rigging
- Strongbacks, Shackles, Blocks, Yokes, Straps, and Slings
- Elevators<br>
equipment
Applicable to all weight handling
equipment
Examples of weight handling
equipment:
- Ordnance Handling Equipment
- Underway Replenishment Equipment
- Shipboard Stores and Provision Handling Equipment
- Hull Fittings, Lashing Gear, and Access Closures
- Hoist, Chain Falls, Hook and Trolley Suspensions
- Cranes, Davits, Booms
- Wire and Fiber Rope and Rigging
- Strongbacks, Shackles, Blocks, Yokes, Straps, and Slings
- Elevators<br>
51
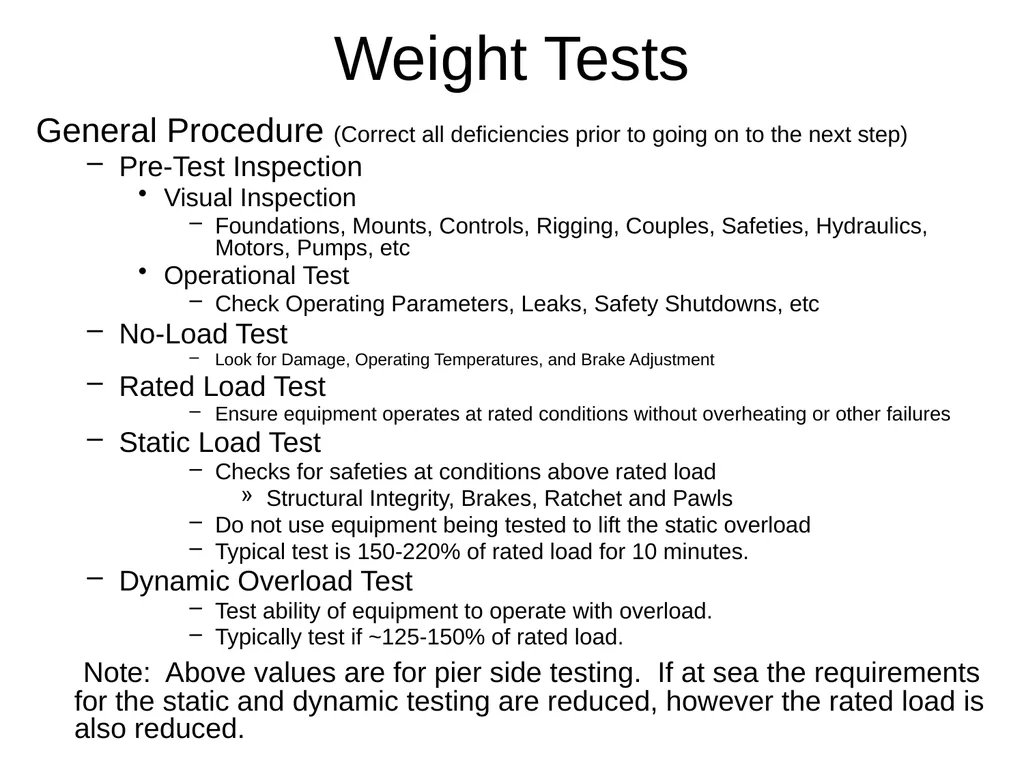
Weight Tests General Procedure (Correct all deficiencies prior to going on to the next step)
Pre-Test Inspection
Visual Inspection
Foundations, Mounts, Controls, Rigging, Couples, Safeties, Hydraulics, Motors, Pumps, etc
Operational Test
Check Operating Parameters, Leaks, Safety Shutdowns, etc
No-Load Test
Look for Damage, Operating Temperatures, and Brake Adjustment
Rated Load Test
Ensure equipment operates at rated conditions without overheating or other failures
Static Load Test
Checks for safeties at conditions above rated load
Structural Integrity, Brakes, Ratchet and Pawls
Do not use equipment being tested to lift the static overload
Typical test is 150-220% of rated load for 10 minutes.
Dynamic Overload Test
Test ability of equipment to operate with overload.
Typically test if ~125-150% of rated load.
Note: Above values are for pier side testing. If at sea the requirements for the static and dynamic testing are reduced, however the rated load is also reduced.<br>
Pre-Test Inspection
Visual Inspection
Foundations, Mounts, Controls, Rigging, Couples, Safeties, Hydraulics, Motors, Pumps, etc
Operational Test
Check Operating Parameters, Leaks, Safety Shutdowns, etc
No-Load Test
Look for Damage, Operating Temperatures, and Brake Adjustment
Rated Load Test
Ensure equipment operates at rated conditions without overheating or other failures
Static Load Test
Checks for safeties at conditions above rated load
Structural Integrity, Brakes, Ratchet and Pawls
Do not use equipment being tested to lift the static overload
Typical test is 150-220% of rated load for 10 minutes.
Dynamic Overload Test
Test ability of equipment to operate with overload.
Typically test if ~125-150% of rated load.
Note: Above values are for pier side testing. If at sea the requirements for the static and dynamic testing are reduced, however the rated load is also reduced.<br>