Numeracy and Data Analysis Forecasting Forecasting What is Forecasting Forecasting is a tool used for predicting future demand based on past demand information. Why Forecasting is important? Demand for products and services is usually
"Numeracy and Data Analysis Forecasting Forecasting" is the property of its rightful owner. Permission is granted to
download and print the materials on this website for personal, non-commercial use only, and to display it
on your personal computer provided you do not modify the materials and that you retain all copyright
notices contained in the materials. By downloading content from our website, you accept the terms of this
agreement.
Presentation Transcript
01
Numeracy and Data Analysis Forecasting<br>
02
Forecasting<br>
03
What is Forecasting Forecasting is a tool used for predicting
future demand based on
past demand information.<br>
04
Why Forecasting is important? Demand for products and services is usually uncertain
Forecasting can be used for…
Strategic planning (long range planning)
Finance and accounting (budgets and cost controls)
Marketing (future sales, new products)
Production and operations<br>
05
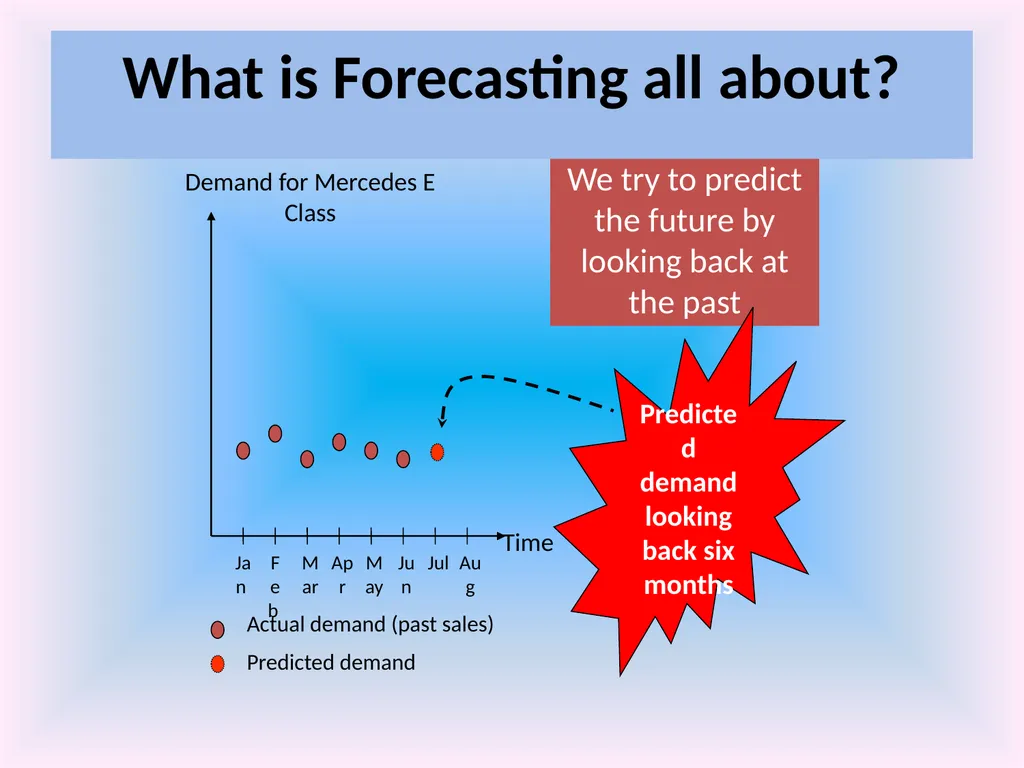
Actual demand (past sales)
Predicted demand We try to predict the future by looking back at the past What is Forecasting all about?<br>
06
Some General Characteristics of Forecasts Forecasts are always wrong
Forecasts are more accurate for groups or families of items
Forecasts are more accurate for shorter time periods
Every forecast should include an error estimate
Forecasts are no substitute for calculated demand.<br>
07
Key Issues in Forecasting A forecast is only as good as the information included in the forecast (past data)
History is not a perfect predictor of the future (i.e.: there is no such thing as a perfect forecast) REMEMBER: Forecasting is based on the assumption that the past predicts the future! When forecasting, think carefully whether or not the past is strongly related to what you expect to see in the future…<br>
08
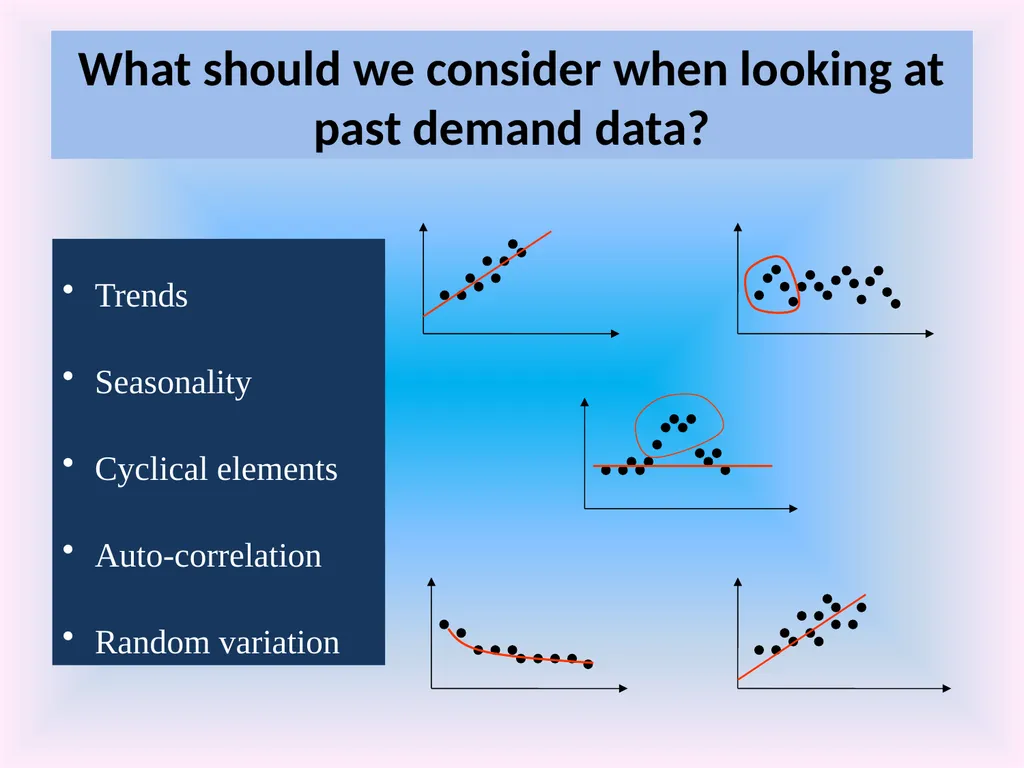
What should we consider when looking at past demand data? Trends
Seasonality
Cyclical elements
Auto-correlation
Random variation<br>
09
Linear Forecasting Model Although there are number of forecasting models, only linear forecasting model or linear regression model will be introduced and discussed. This model is based on
Fitting a straight line to data
Explaining the change in one variable through changes in other variables.<br>
10
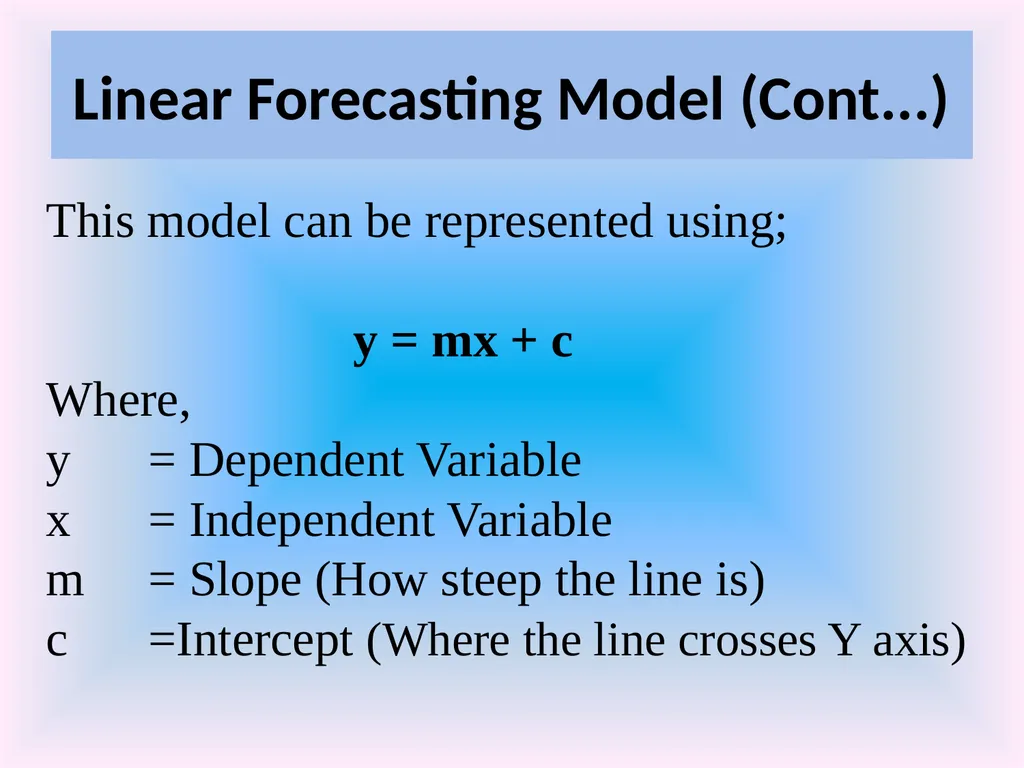
Linear Forecasting Model (Cont...) This model can be represented using;
y = mx + c
Where,
y = Dependent Variable
x = Independent Variable
m = Slope (How steep the line is)
c =Intercept (Where the line crosses Y axis)<br>
11
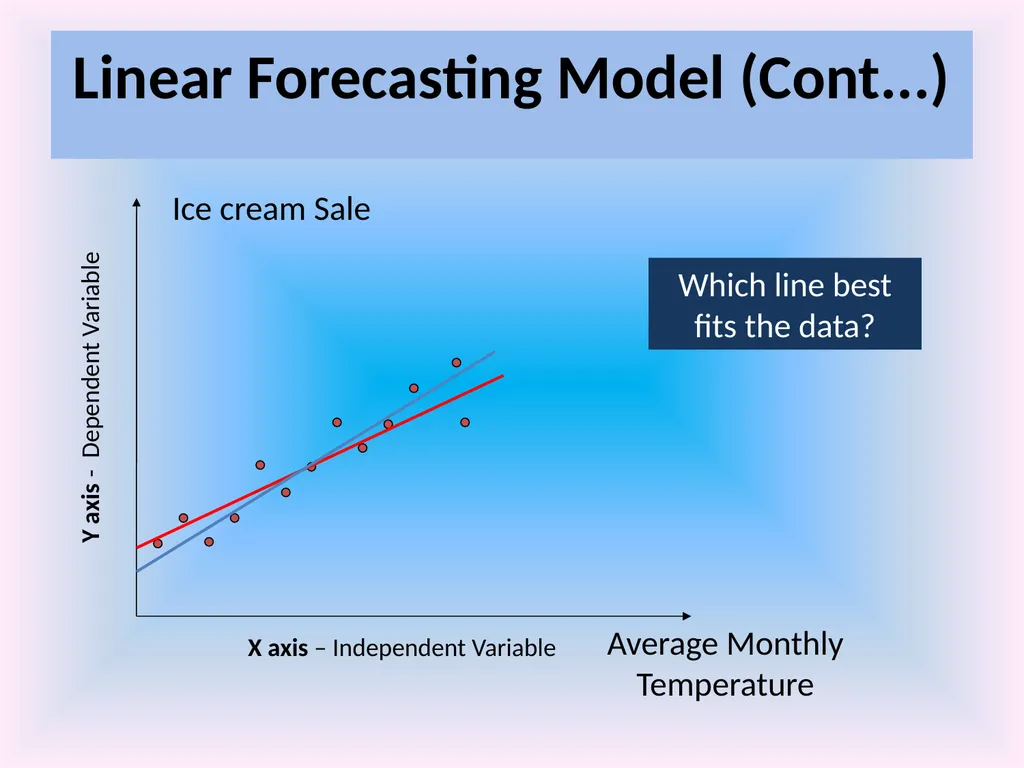
Ice cream Sale Average Monthly Temperature Which line best fits the data? Linear Forecasting Model (Cont...) Y axis - Dependent Variable X axis – Independent Variable<br>
12
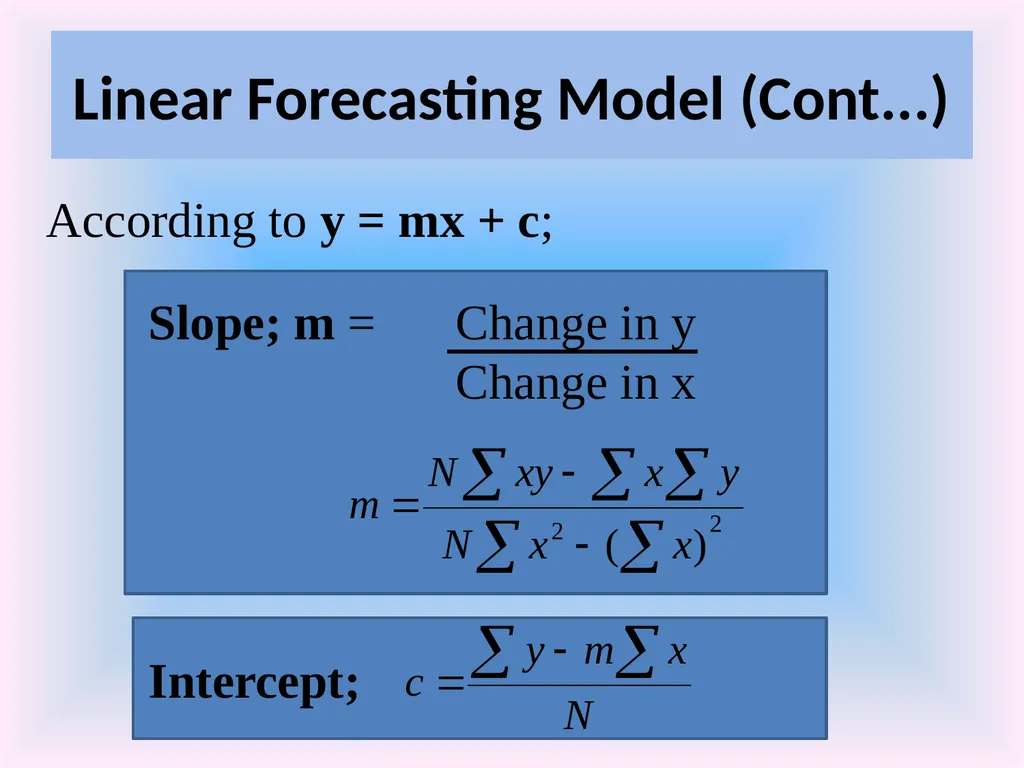
Linear Forecasting Model (Cont...) According to y = mx + c;
Slope; m = Change in y
Change in x
Intercept;<br>
13
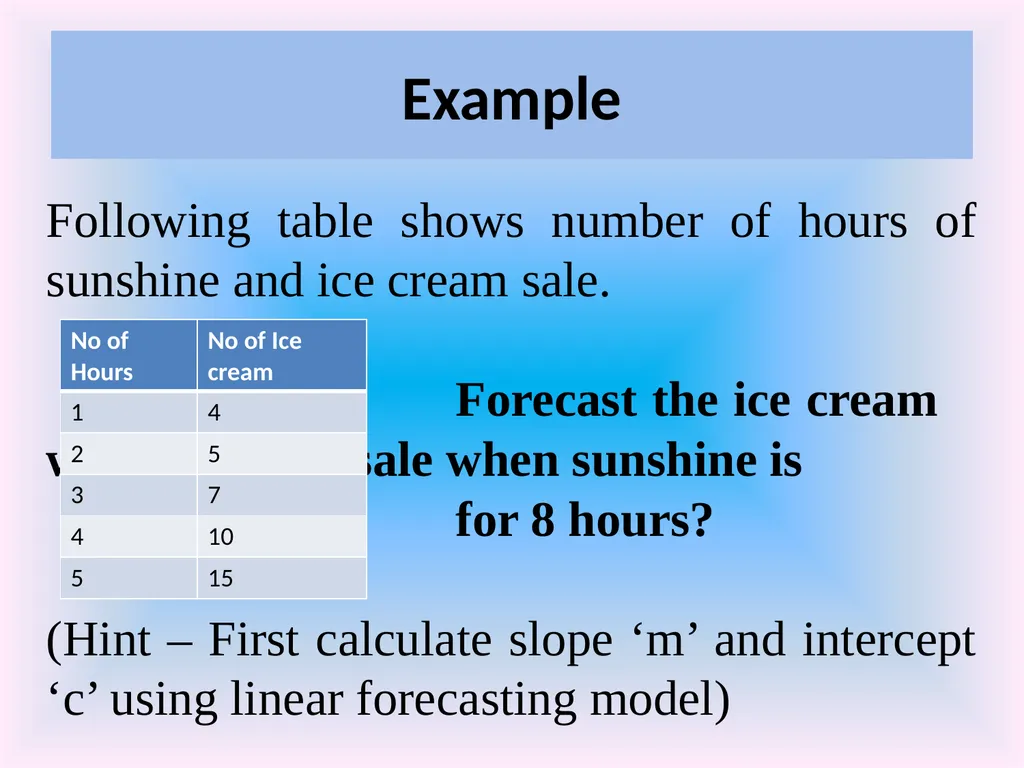
Example Following table shows number of hours of sunshine and ice cream sale.
Forecast the ice cream when sale when sunshine is
for 8 hours?
(Hint – First calculate slope ‘m’ and intercept ‘c’ using linear forecasting model)<br>
14
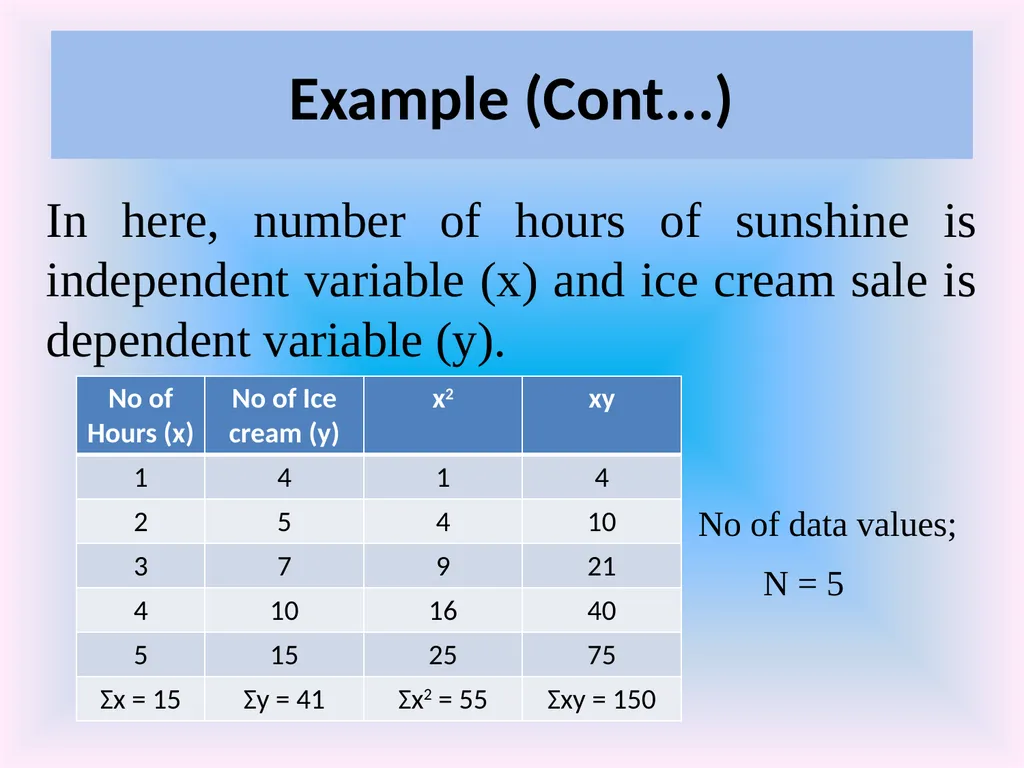
Example (Cont...) In here, number of hours of sunshine is independent variable (x) and ice cream sale is dependent variable (y).
No of data values;
N = 5<br>
15
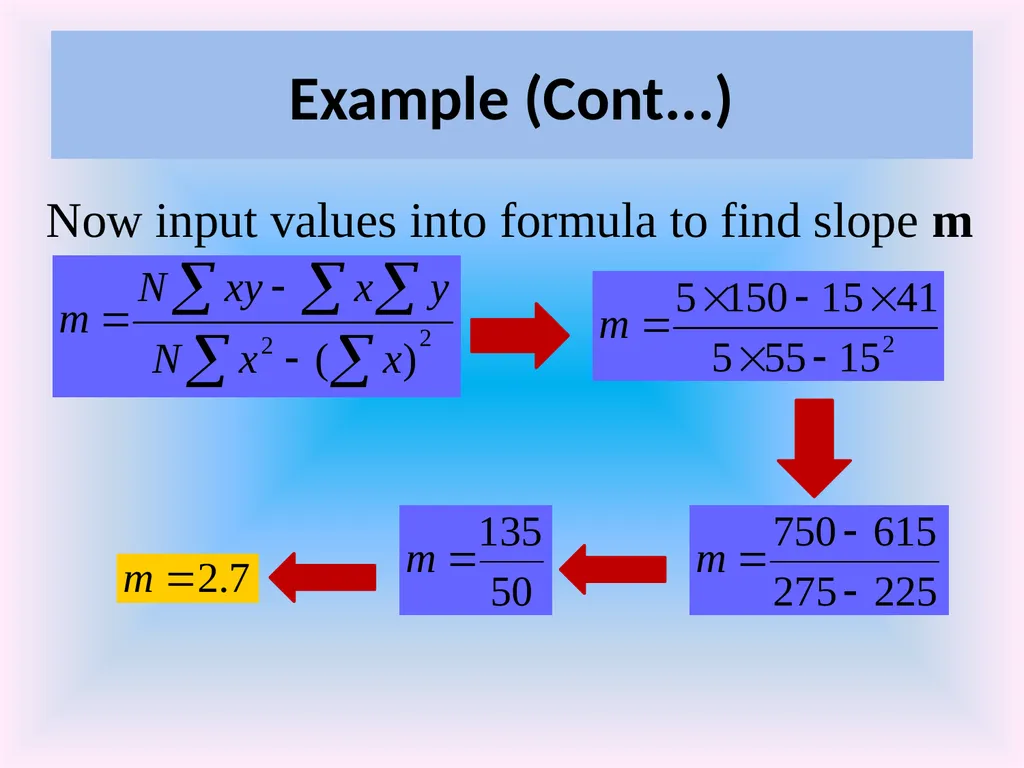
Example (Cont...) Now input values into formula to find slope m<br>
16
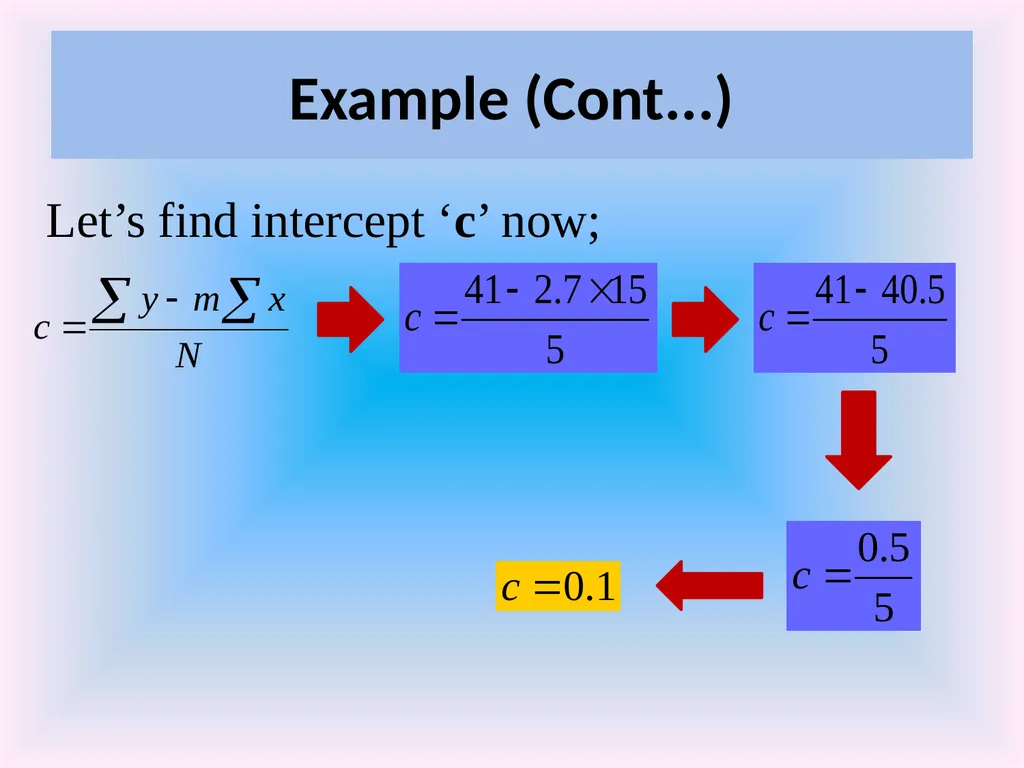
Example (Cont...) Let’s find intercept ‘c’ now;<br>
17
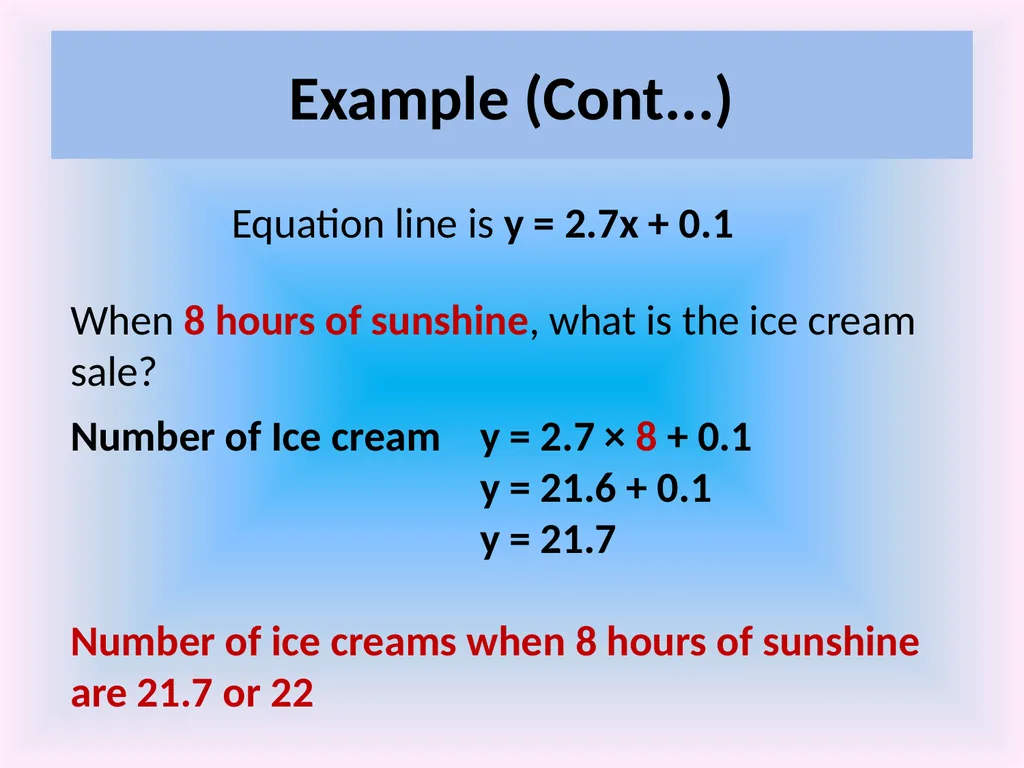
Example (Cont...) Equation line is y = 2.7x + 0.1 When 8 hours of sunshine, what is the ice cream sale?
Number of Ice cream y = 2.7 × 8 + 0.1
y = 21.6 + 0.1
y = 21.7
Number of ice creams when 8 hours of sunshine are 21.7 or 22<br>
18
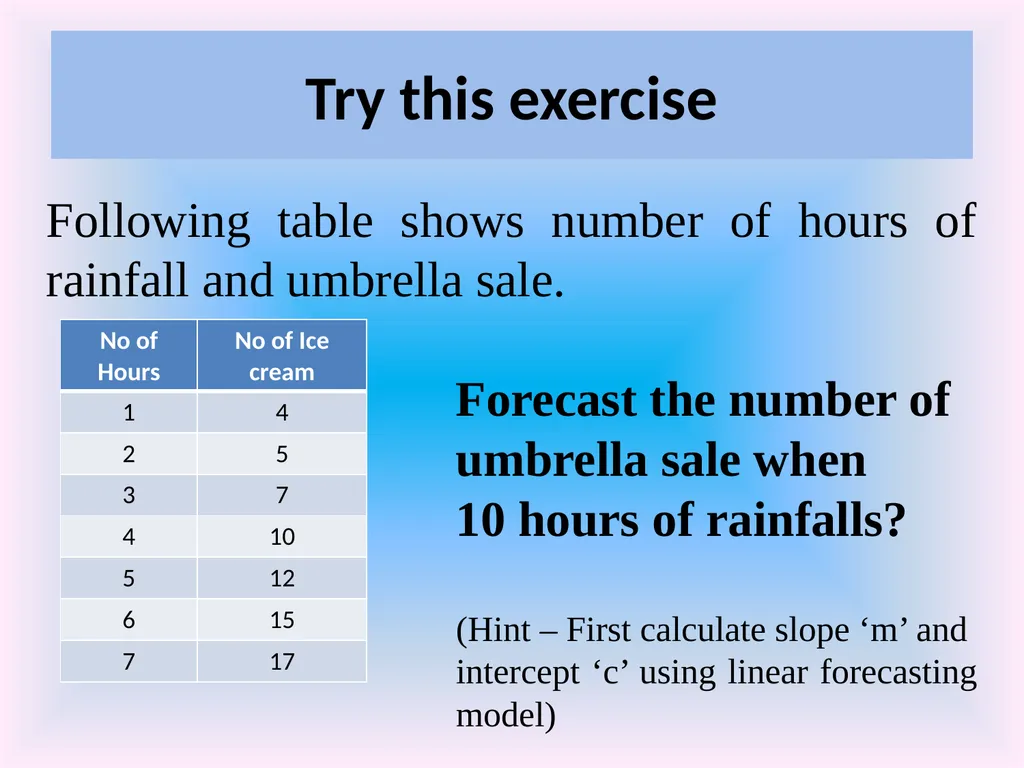
Try this exercise Following table shows number of hours of rainfall and umbrella sale.
Forecast the number of
umbrella sale when
10 hours of rainfalls?
(Hint – First calculate slope ‘m’ and
intercept ‘c’ using linear forecasting model)<br>
19
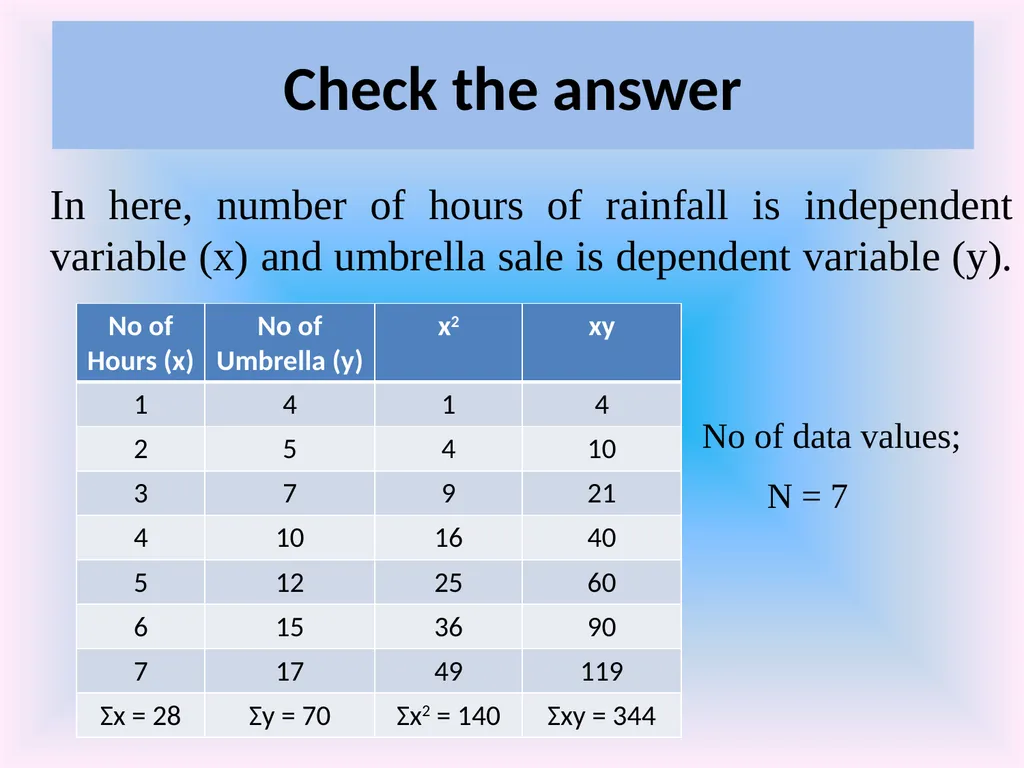
Check the answer In here, number of hours of rainfall is independent variable (x) and umbrella sale is dependent variable (y).
No of data values;
N = 7<br>
20
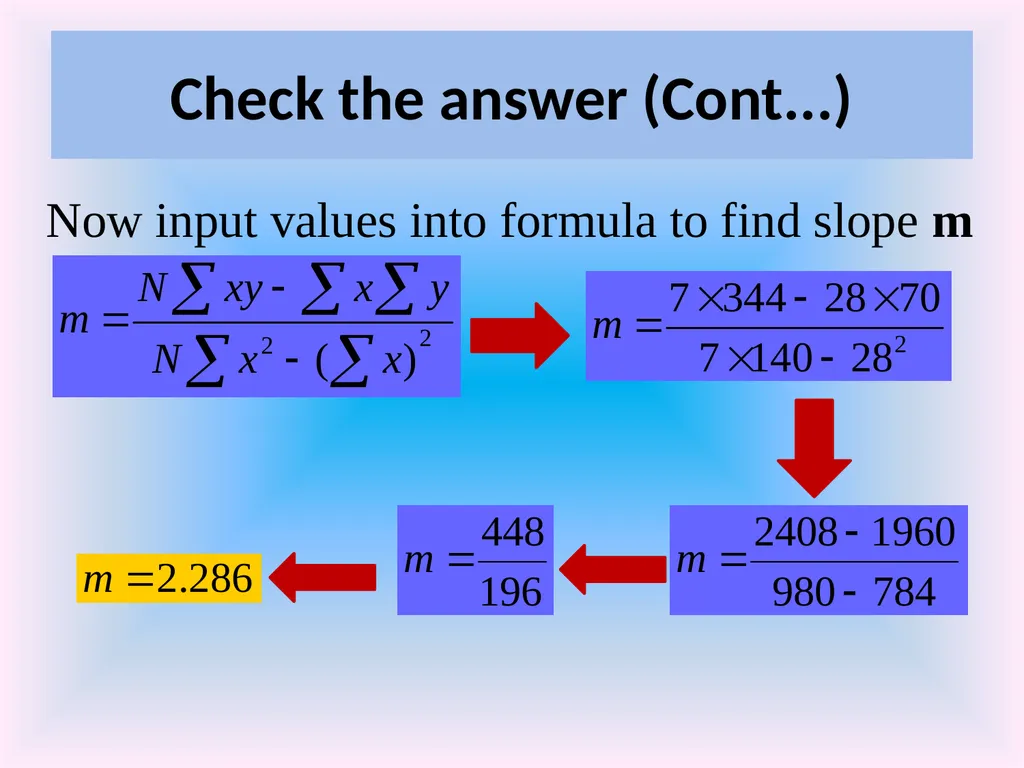
Check the answer (Cont...) Now input values into formula to find slope m<br>
21
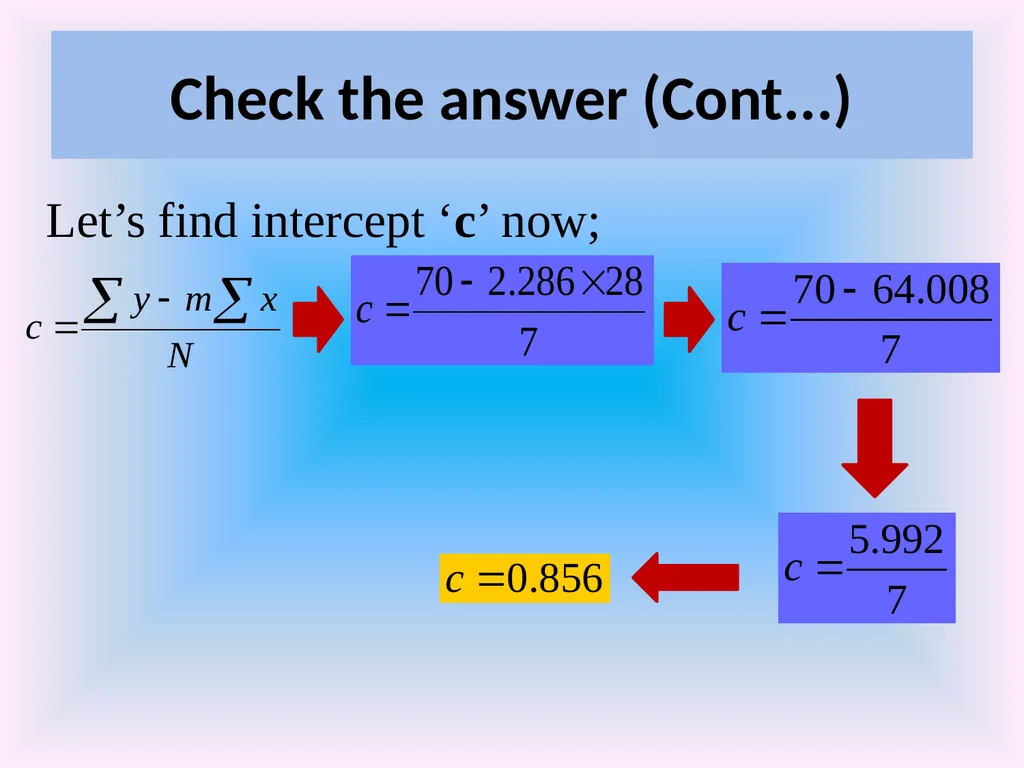
Check the answer (Cont...) Let’s find intercept ‘c’ now;<br>
22
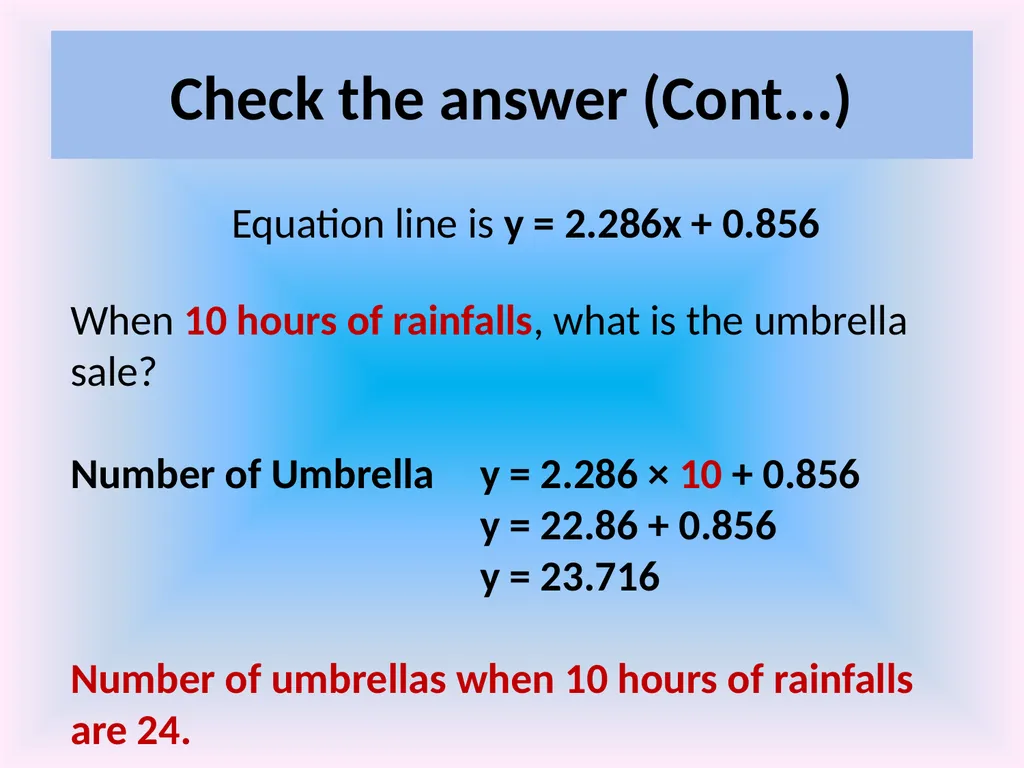
Check the answer (Cont...) Equation line is y = 2.286x + 0.856 When 10 hours of rainfalls, what is the umbrella sale?
Number of Umbrella y = 2.286 × 10 + 0.856
y = 22.86 + 0.856
y = 23.716
Number of umbrellas when 10 hours of rainfalls are 24.<br>