
OCI Architecture Diagram Toolkit Style guide for

















Description: OCI Architecture Diagram Toolkit Style guide for topologies diagrams v24.1 - January 2024 Assets Standards Logical Physical Icons Compute Storage Networking Database Analytics and AI Developer Services Identity Security Observability
Related Topics
Download Presentation
"OCI Architecture Diagram Toolkit Style guide for" is the property of its rightful owner. Permission is granted to download and print the materials on this website for personal, non-commercial use only, and to display it on your personal computer provided you do not modify the materials and that you retain all copyright notices contained in the materials. By downloading content from our website, you accept the terms of this agreement.
Presentation Transcript
slide1. OCI Architecture Diagram Toolkit Style guide for topologies & diagrams v24.1 - January 2024 Assets & Standards<br>
slide2. Logical
Physical
Icons
Compute
Storage
Networking
Database
Analytics and AI
Developer Services
Identity & Security Observability & Management
Hybrid
Migration
Governance & Administration
Marketplace
Applications
Other Table of Contents 4/26/2024 Copyright © 2022, Oracle and/or its affiliates | 2<br>
slide3. 4/26/2024 Copyright © 2022, Oracle and/or its affiliates | 3 Added Oracle service and service-related icons.
Added additional grouping boxes for physical diagrams.
A tip has been added to the left of some slides. You will have to zoom out (reduce to about 90%) in order to see the tip. Changelog<br>
slide4. 4/26/2024 Copyright © 2022, Oracle and/or its affiliates | 4 Use this guide to create diagrams that have a unified visual language for topology diagrams using Oracle’s Cloud products and services. The symbols, graphics, and connecting lines on the following pages will help you accurately communicate complex offerings, systems, and ideas into an Oracle-branded diagram.
Note: Additional direction is shown in pink using the Courier New Font. DO NOT use pink or Courier New in your diagrams.
This icon set is available in the following formats: • SVG • PNG • PPT • Draw.io • Visio Introduction<br>
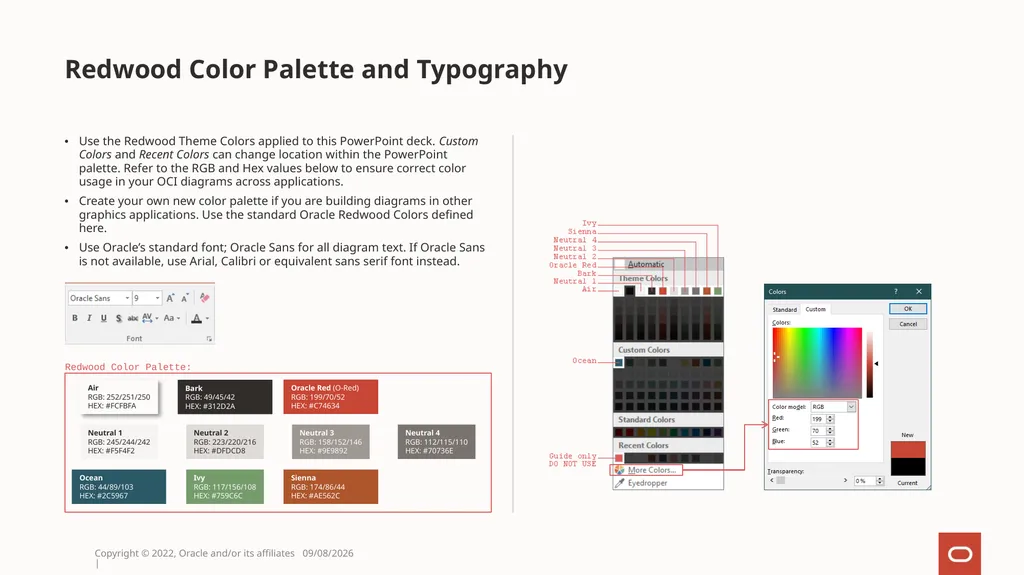
slide5. Use the Redwood Theme Colors applied to this PowerPoint deck. Custom Colors and Recent Colors can change location within the PowerPoint palette. Refer to the RGB and Hex values below to ensure correct color usage in your OCI diagrams across applications.
Create your own new color palette if you are building diagrams in other graphics applications. Use the standard Oracle Redwood Colors defined here.
Use Oracle’s standard font; Oracle Sans for all diagram text. If Oracle Sans is not available, use Arial, Calibri or equivalent sans serif font instead. Redwood Color Palette and Typography 4/26/2024 Copyright © 2022, Oracle and/or its affiliates |<br>
slide6. Logical 4/26/2024 Copyright © 2022, Oracle and/or its affiliates | 6 A logical architecture diagram shows how a solution works by depicting logical components or capabilities. It gives an easier to understand, high-level abstraction of the solution.
A logical architecture diagram groups technical complexity into one “box” named with a single capability, often with user interactions. It does not depict a product or technology.<br>
slide7. There are two types of Grouping Boxes Location Groups
The Location Grouping format shows the physical location of the Components placed inside.
Location Grouping boxes are arranged in a specific way, shown on the Location Canvas slide. Format Other Groups
The Other Grouping format is a generic grouping notation for any additional grouping needs.
Other Grouping format is used for any kind of logical, technical, or product-specific grouping needed within a logical architecture.
Other Grouping format is used to define the borders of environments, states, high availability, clusters, etc. Format Groupings 4/26/2024 Copyright © 2022, Oracle and/or its affiliates | 7 Oracle Cloud On-Premises Internet 3rd Party Cloud Align: Top/Centre
Font: 9pt, Bold
Color: Bark
Line: 1pt
Color: Neutral 3
Fill: 100%
Color: Neutral 1 Other Group Align: Top/Centre
Font: 9pt, Bold
Color: Bark
Line: 1pt/Dashed
Color: Bark
Fill: 100%
Color: Air Color:<br>
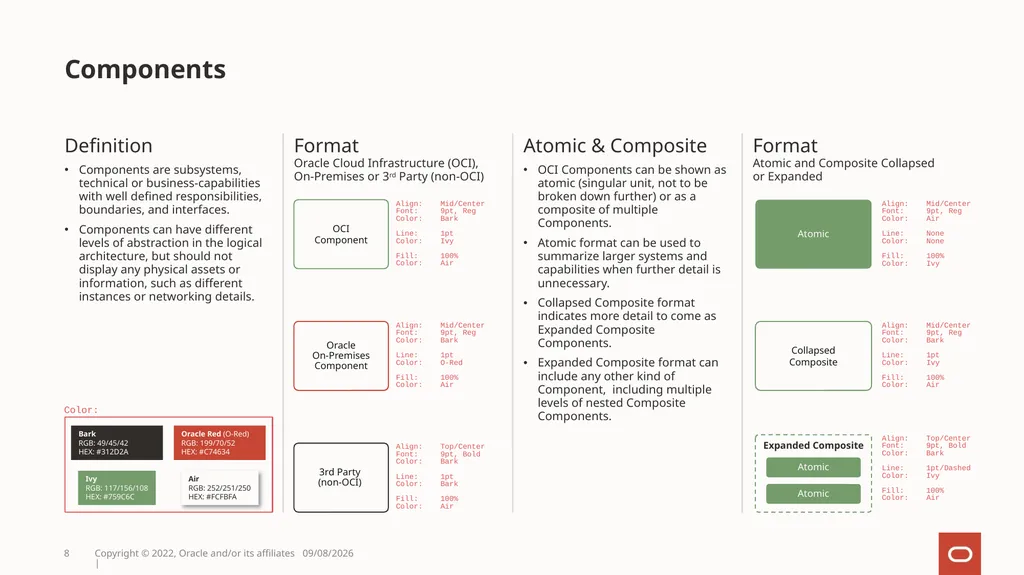
slide8. Definition
Components are subsystems, technical or business-capabilities with well defined responsibilities, boundaries, and interfaces.
Components can have different levels of abstraction in the logical architecture, but should not display any physical assets or information, such as different instances or networking details. Format Oracle Cloud Infrastructure (OCI), On-Premises or 3rd Party (non-OCI) Atomic & Composite
OCI Components can be shown as atomic (singular unit, not to be broken down further) or as a composite of multiple Components.
Atomic format can be used to summarize larger systems and capabilities when further detail is unnecessary.
Collapsed Composite format indicates more detail to come as Expanded Composite Components.
Expanded Composite format can include any other kind of Component, including multiple levels of nested Composite Components. Format Atomic and Composite Collapsed or Expanded Components 4/26/2024 Copyright © 2022, Oracle and/or its affiliates | 8 Oracle On-Premises
Component 3rd Party
(non-OCI) Align: Mid/Center
Font: 9pt, Reg
Color: Bark
Line: 1pt
Color: O-Red
Fill: 100%
Color: Air Align: Top/Center
Font: 9pt, Bold
Color: Bark
Line: 1pt
Color: Bark
Fill: 100%
Color: Air Atomic Collapsed Composite Expanded Composite Atomic Align: Mid/Center
Font: 9pt, Reg
Color: Air
Line: None
Color: None
Fill: 100%
Color: Ivy Align: Mid/Center
Font: 9pt, Reg
Color: Bark
Line: 1pt
Color: Ivy
Fill: 100%
Color: Air Align: Top/Center
Font: 9pt, Bold
Color: Bark
Line: 1pt/Dashed
Color: Ivy
Fill: 100%
Color: Air OCI
Component Align: Mid/Center
Font: 9pt, Reg
Color: Bark
Line: 1pt
Color: Ivy
Fill: 100%
Color: Air Atomic<br>
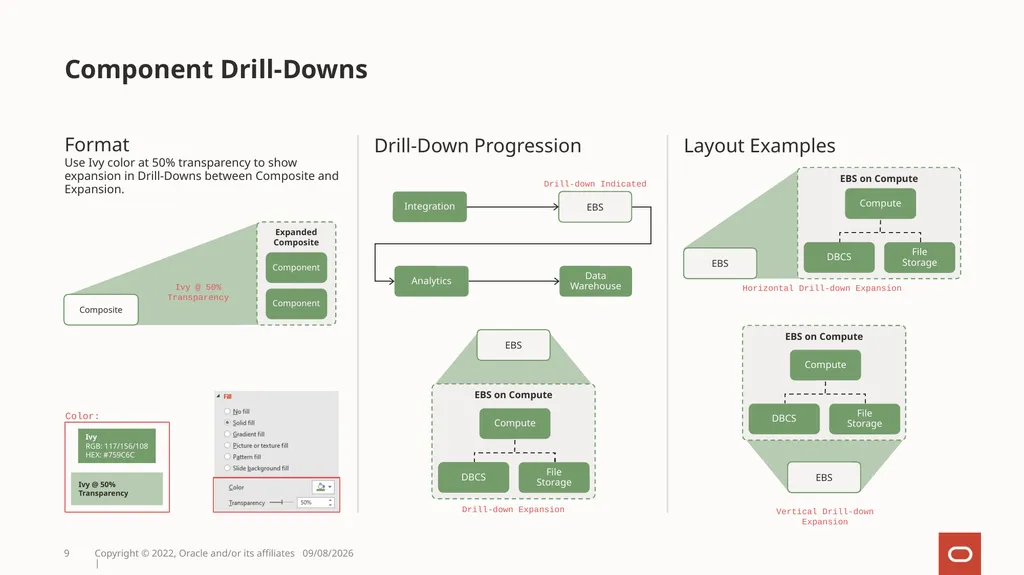
slide9. Drill-Down Progression Layout Examples Component Drill-Downs 4/26/2024 Copyright © 2022, Oracle and/or its affiliates | 9 Composite Expanded Composite Component Component EBS on Compute DBCS Compute File Storage EBS Horizontal Drill-down Expansion Format Use Ivy color at 50% transparency to show expansion in Drill-Downs between Composite and Expansion. Ivy @ 50%
Transparency Drill-down Indicated Vertical Drill-down Expansion<br>
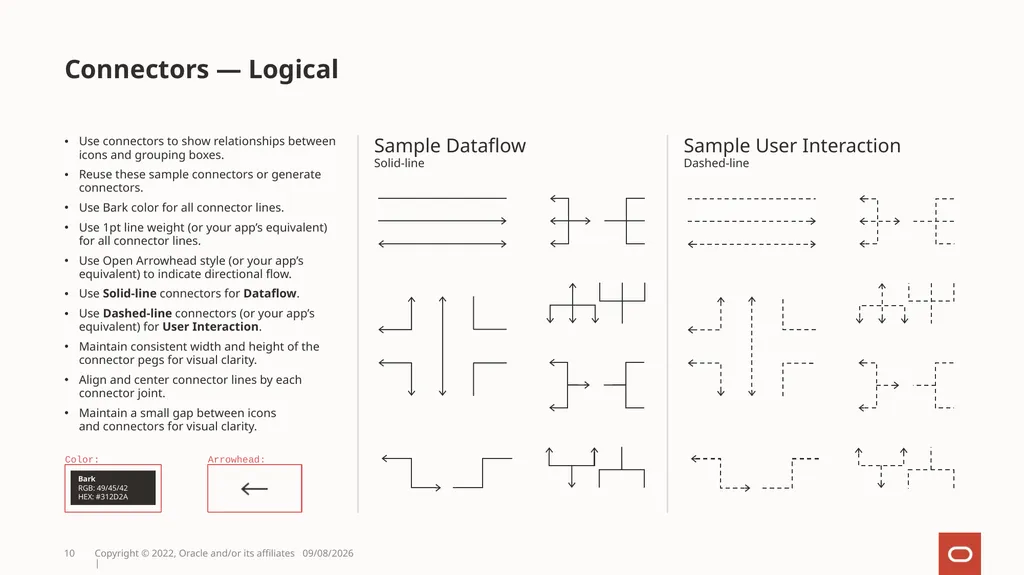
slide10. Use connectors to show relationships between icons and grouping boxes.
Reuse these sample connectors or generate connectors.
Use Bark color for all connector lines.
Use 1pt line weight (or your app’s equivalent) for all connector lines.
Use Open Arrowhead style (or your app’s equivalent) to indicate directional flow.
Use Solid-line connectors for Dataflow.
Use Dashed-line connectors (or your app’s equivalent) for User Interaction.
Maintain consistent width and height of the connector pegs for visual clarity.
Align and center connector lines by each connector joint.
Maintain a small gap between icons and connectors for visual clarity. Sample Dataflow Solid-line Sample User Interaction Dashed-line Connectors — Logical 4/26/2024 Copyright © 2022, Oracle and/or its affiliates | 10<br>
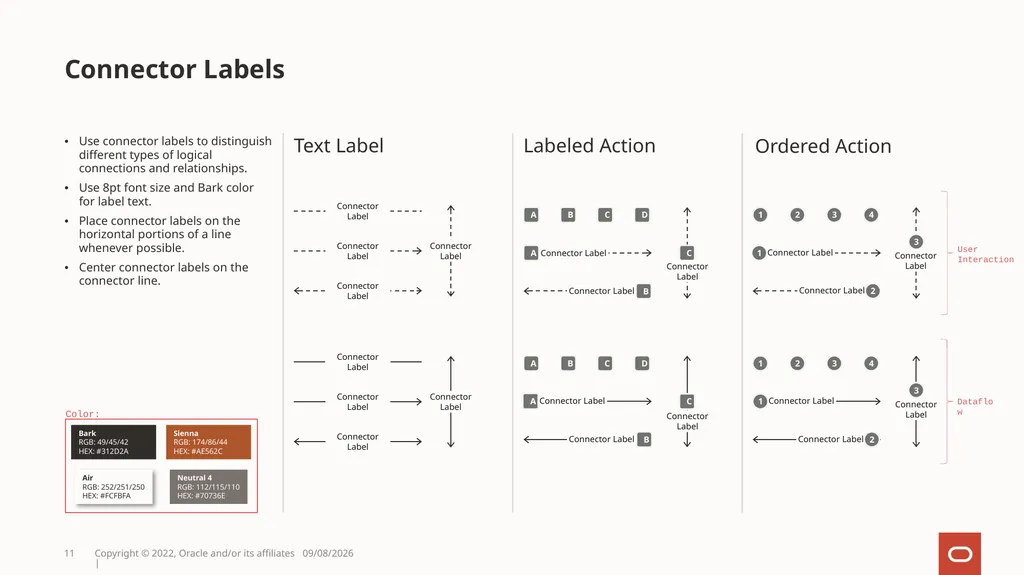
slide11. Use connector labels to distinguish different types of logical connections and relationships.
Use 8pt font size and Bark color for label text.
Place connector labels on the horizontal portions of a line whenever possible.
Center connector labels on the connector line. Text Label Labeled Action Ordered Action Connector Labels 4/26/2024 Copyright © 2022, Oracle and/or its affiliates | 11 A B C D A B C A B C D 1 2 3 4 1 2 3 4 Connector Label 1 Connector Label 2 Connector Label 1 Connector Label 2 3 Connector
Label 3 Connector
Label Connector Label Connector Label Connector
Label C Connector
Label A Connector Label B Connector Label<br>
slide12. Move or delete location canvas regions as needed Location Canvas 4/26/2024 Copyright © 2022, Oracle and/or its affiliates | 12<br>
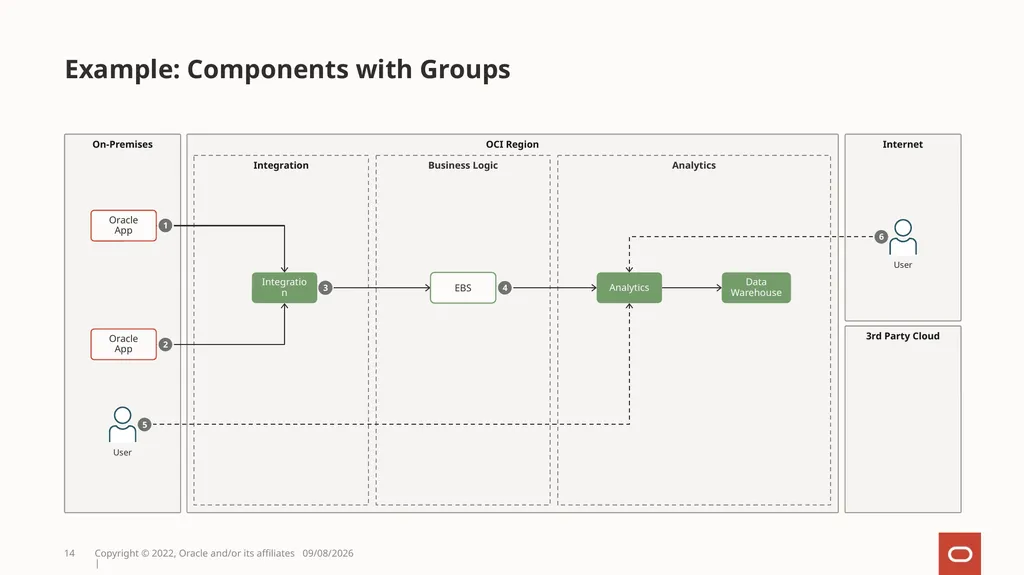
slide13. 4/26/2024 Copyright © 2022, Oracle and/or its affiliates | 13 Logical architecture diagram examples The following slides show examples of the architecture notation. Its purpose is to show how the different elements and icons are placed together, but these examples are not always complete or technically correct.
For verified example solution architectures please visit https://docs.oracle.com/solutions/<br>
slide14. 4/26/2024 Copyright © 2022, Oracle and/or its affiliates | 14 Example: Components with Groups OCI Region On-Premises Internet 3rd Party Cloud Business Logic Integration Analytics Analytics Integration Data Warehouse EBS 5 4 3 6 Oracle
App Oracle
App 1 2<br>
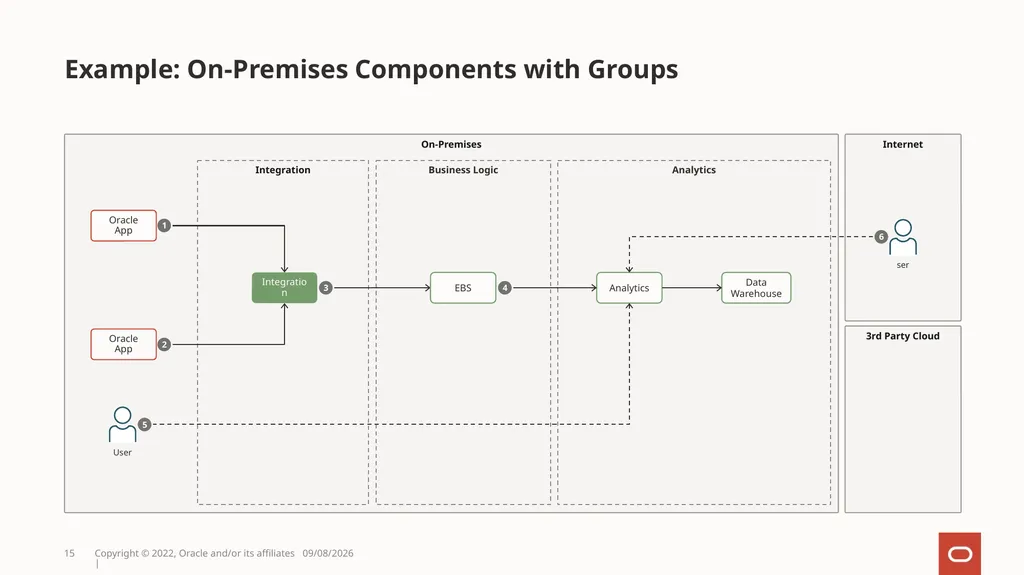
slide15. 4/26/2024 Copyright © 2022, Oracle and/or its affiliates | 15 Example: On-Premises Components with Groups On-Premises Internet 3rd Party Cloud Business Logic Integration Analytics Analytics Integration Data Warehouse EBS 5 1 2 3 4 6 Oracle
App Oracle
App<br>
slide16. Example: Components with Groups Notes:
Last Updated: DD-MMM-YYYY
Us Lorem ipsum dolor sit amet, consectetur adipiscing elit. Vestibulum ac congue metus, in semper risus.
Us Lorem ipsum dolor sit amet, consectetur adipiscing elit. Vestibulum ac congue metus, in semper risus.
Us Lorem ipsum dolor sit amet, consectetur adipiscing elit. Vestibulum ac congue metus, in semper risus.
Us Lorem ipsum dolor sit amet, consectetur adipiscing elit. Vestibulum ac congue metus, in semper risus.
Us Lorem ipsum dolor sit amet, consectetur adipiscing elit. Vestibulum ac congue metus, in semper risus.
Us Lorem ipsum dolor sit amet, consectetur adipiscing elit. Vestibulum ac congue metus, in semper risus. Numbered Explanations 4/26/2024 Copyright © 2022, Oracle and/or its affiliates | 16 Using Numbered explanations makes your diagrams easier to scan quickly, and offloads text blocks to a document's body.<br>
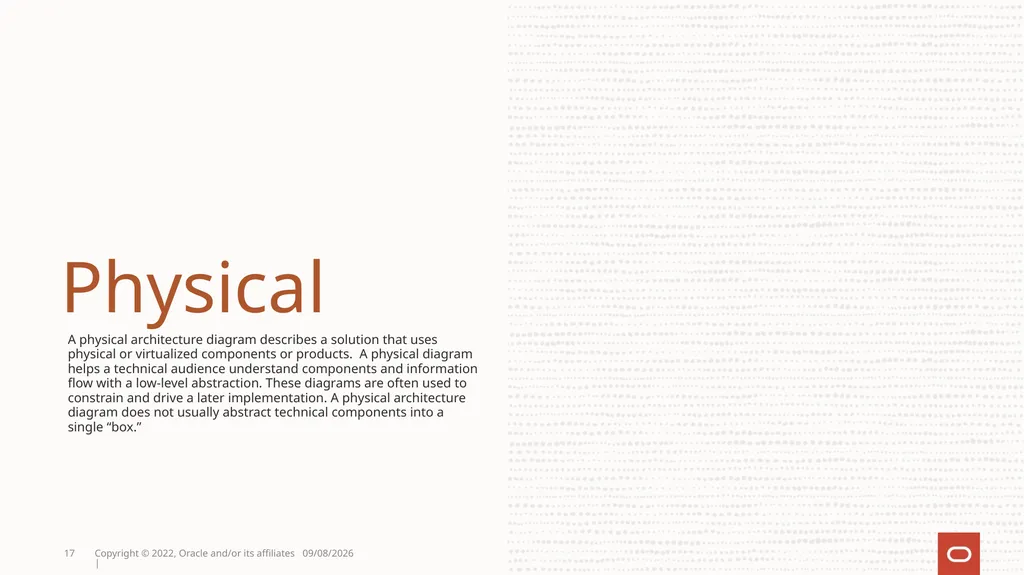
slide17. Physical 4/26/2024 Copyright © 2022, Oracle and/or its affiliates | 17 A physical architecture diagram describes a solution that uses physical or virtualized components or products. A physical diagram helps a technical audience understand components and information flow with a low-level abstraction. These diagrams are often used to constrain and drive a later implementation. A physical architecture diagram does not usually abstract technical components into a single “box.”<br>
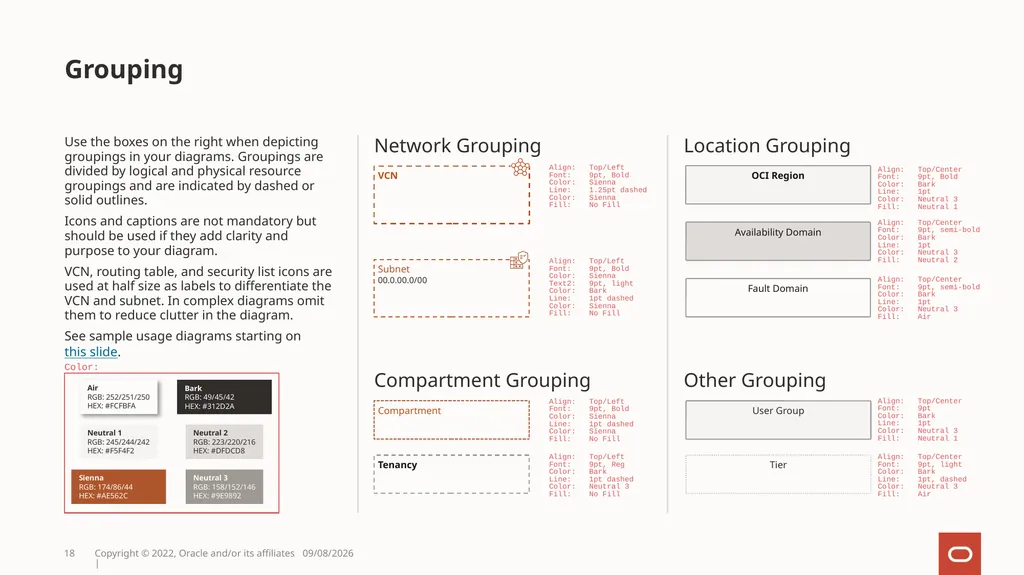
slide18. Use the boxes on the right when depicting groupings in your diagrams. Groupings are divided by logical and physical resource groupings and are indicated by dashed or solid outlines.
Icons and captions are not mandatory but should be used if they add clarity and purpose to your diagram.
VCN, routing table, and security list icons are used at half size as labels to differentiate the VCN and subnet. In complex diagrams omit them to reduce clutter in the diagram.
See sample usage diagrams starting on this slide. Network Grouping Location Grouping Grouping 4/26/2024 Copyright © 2022, Oracle and/or its affiliates | 18 Compartment Grouping Other Grouping OCI Region Availability Domain Fault Domain User Group Tier Tenancy Compartment Align: Top/Left
Font: 9pt, Bold
Color: Sienna
Line: 1.25pt dashed
Color: Sienna
Fill: No Fill Align: Top/Left
Font: 9pt, Bold
Color: Sienna
Text2: 9pt, light
Color: Bark
Line: 1pt dashed
Color: Sienna
Fill: No Fill Align: Top/Left
Font: 9pt, Bold
Color: Sienna
Line: 1pt dashed
Color: Sienna
Fill: No Fill Align: Top/Left
Font: 9pt, Reg
Color: Bark
Line: 1pt dashed
Color: Neutral 3
Fill: No Fill Align: Top/Center
Font: 9pt, Bold
Color: Bark
Line: 1pt
Color: Neutral 3
Fill: Neutral 1 Align: Top/Center
Font: 9pt, semi-bold
Color: Bark
Line: 1pt
Color: Neutral 3
Fill: Neutral 2 Align: Top/Center
Font: 9pt, semi-bold
Color: Bark
Line: 1pt
Color: Neutral 3
Fill: Air Align: Top/Center
Font: 9pt
Color: Bark
Line: 1pt
Color: Neutral 3
Fill: Neutral 1 Align: Top/Center
Font: 9pt, light
Color: Bark
Line: 1pt, dashed
Color: Neutral 3
Fill: Air Subnet
00.0.00.0/00<br>
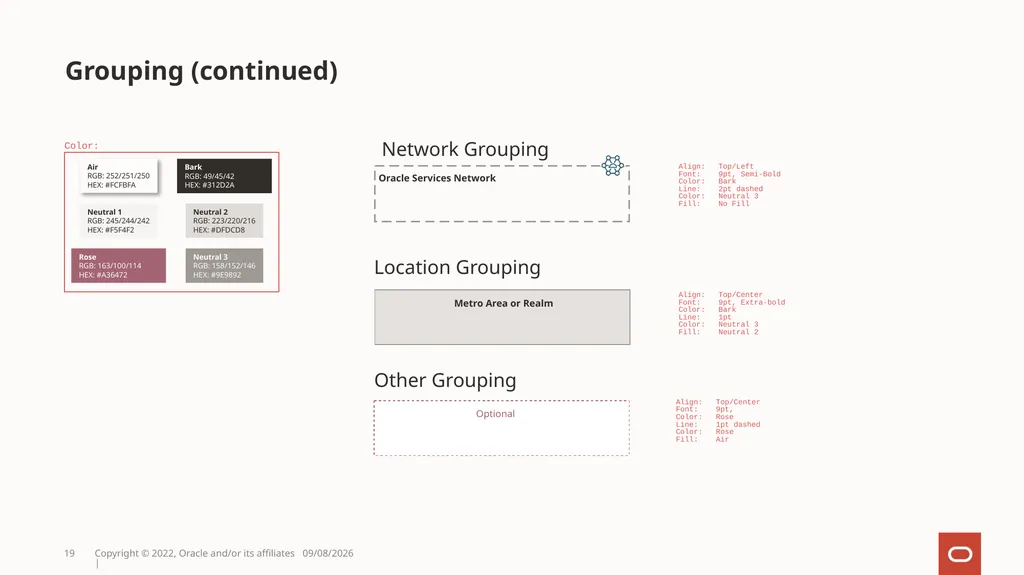
slide19. 4/26/2024 Copyright © 2022, Oracle and/or its affiliates | 19 Network Grouping Other Grouping Neutral 1
RGB: 245/244/242
HEX: #F5F4F2 Neutral 2
RGB: 223/220/216
HEX: #DFDCD8 Neutral 3
RGB: 158/152/146
HEX: #9E9892 Rose
RGB: 163/100/114
HEX: #A36472 Air
RGB: 252/251/250
HEX: #FCFBFA Bark
RGB: 49/45/42
HEX: #312D2A Color: Align: Top/Left
Font: 9pt, Semi-Bold
Color: Bark
Line: 2pt dashed
Color: Neutral 3
Fill: No Fill Metro Area or Realm Location Grouping Align: Top/Center
Font: 9pt, Extra-bold
Color: Bark
Line: 1pt
Color: Neutral 3
Fill: Neutral 2 Align: Top/Center
Font: 9pt,
Color: Rose
Line: 1pt dashed
Color: Rose
Fill: Air Grouping (continued)<br>
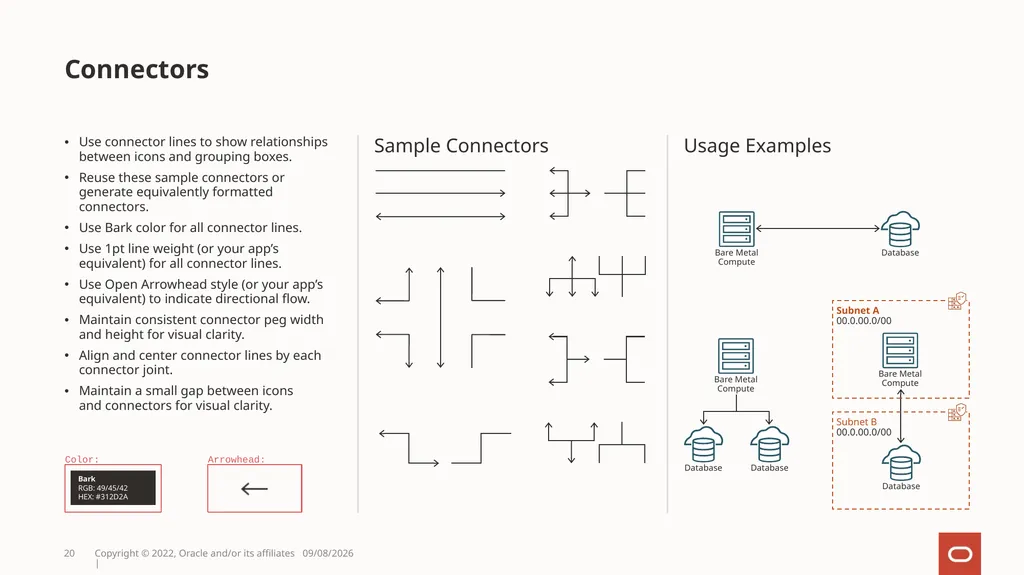
slide20. Use connector lines to show relationships between icons and grouping boxes.
Reuse these sample connectors or generate equivalently formatted connectors.
Use Bark color for all connector lines.
Use 1pt line weight (or your app’s equivalent) for all connector lines.
Use Open Arrowhead style (or your app’s equivalent) to indicate directional flow.
Maintain consistent connector peg width and height for visual clarity.
Align and center connector lines by each connector joint.
Maintain a small gap between icons and connectors for visual clarity. Sample Connectors Usage Examples Connectors 4/26/2024 Copyright © 2022, Oracle and/or its affiliates | 20 Subnet A
00.0.00.0/00 Subnet B
00.0.00.0/00<br>
slide21. Icons and Labels The following special connections have specific labeling considerations:
Connector specific icons, lines and text are shown in Bark color.
Connector specific icons are scaled down to ½ size and centered over the connection line.
Use the background fill color of the label textbox to mask the line behind the text and ensure legibility. Samples Note: Label text and icon are always placed over the connection line being labeled. Special Connectors 4/26/2024 Copyright © 2022, Oracle and/or its affiliates | 21 Local Peering label text is placed over the connection line without an icon. Remote Peering label text is placed over the connection line and grouped with the Remote Peering icon. Site-to-Site VPN label text is placed over the connection line and grouped with the VPN icon. FastConnect label text is placed over the connection line and grouped with the FastConnect icon. Site-to-Site VPN or FastConnect label text is placed over the connection line without an icon.<br>
slide22. Usage Examples The following special connections have specific usage considerations:
Remote Peering always occurs between DRGs in different regions.
Local Peering always occurs between Local Peering Gateways in the same region. This is always a 1:1 connection.
Site-to-Site VPN connections always connect a DRG to a CPE device.
FastConnect always connects a DRG to an on-premises network, usually to a CPE device.
In cases where connectivity between cloud and on-premises needs to be shown but the connection method is not important to the diagram, use Site-to-Site VPN or FastConnect as shown. Special Connections 4/26/2024 Copyright © 2022, Oracle and/or its affiliates | 22 LPG icons at both endpoints and Local Peering text label at center with no icon. Region VCN Region VCN DRG icons at both endpoints and
Remote Peering icon and text label at center. VCN On-Premises CPE and DRG icons at endpoints and
VPN icon and text label at center. CPE and DRG icons at endpoints and
FastConnect icon and text label at center. CPE and DRG icons at either endpoint and
Site-to-Site VPN or FastConnect text label at center with no icon. VCN FastConnect On-Premises Region VCN Local Peering VCN On-Premises VCN<br>
slide23. Icon Scaling, Color and Labeling 4/26/2024 Copyright © 2022, Oracle and/or its affiliates | 23 Maintain Aspect Ratio
Never alter icon proportions (aspect ratio). To resize, hold the shift key in most software programs to maintain the proportions while scaling up or down. Color
To ensure brand consistency and clarity in your diagrams, limit color usage to Oracle Ocean and Oracle Sienna.
Never use colors that are not in the Oracle corporate palette. Never use more than one color on a single icon.
Copy and paste icons in approved colors located in the Icons section. Labeling
Always include identification labels provided with Icons.
Use Icons as indicated by labels included in the Icons section. Maintain Shape
To ensure accurate and consistent use, never alter, rotate or embellish the icons. Do not use effects such as drop-shadow or 3d effects on icons.<br>
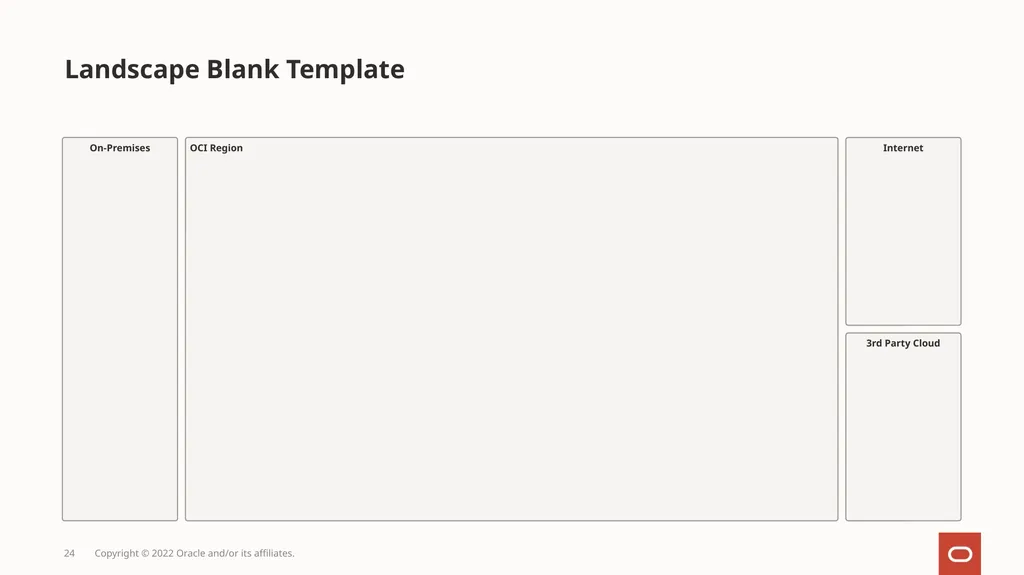
slide24. Landscape Blank Template Copyright © 2022 Oracle and/or its affiliates. 24<br>
slide25. Portrait Blank Template Copyright © 2022 Oracle and/or its affiliates.<br>
slide26. 4/26/2024 Copyright © 2022, Oracle and/or its affiliates | 26 Physical architecture diagram examples The following slides show examples of the architecture notation. Its purpose is to show how the different elements and icons are placed together, but these examples are not always complete or technically correct.
For verified example solution architectures please visit https://docs.oracle.com/solutions/<br>
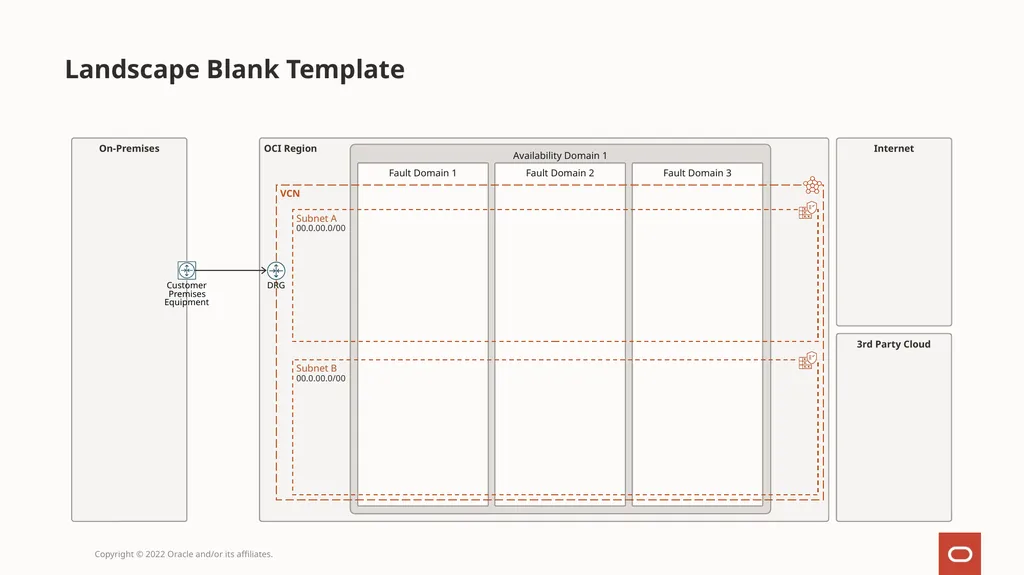
slide27. Landscape Blank Template Copyright © 2022 Oracle and/or its affiliates. OCI Region On-Premises Internet 3rd Party Cloud Availability Domain 1 Fault Domain 1 Fault Domain 2 Fault Domain 3 VCN Subnet A
00.0.00.0/00 Subnet B
00.0.00.0/00<br>
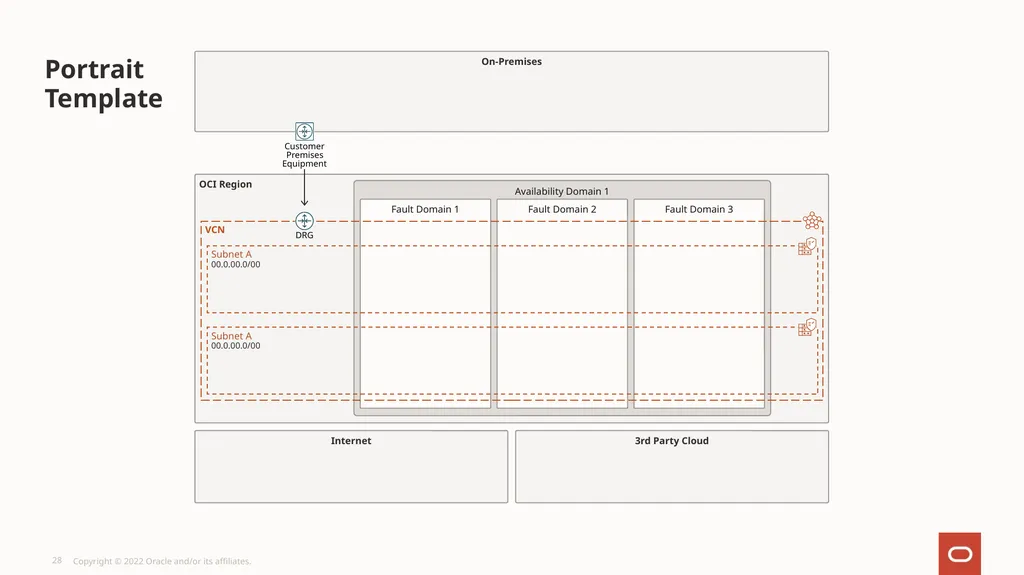
slide28. Copyright © 2022 Oracle and/or its affiliates. OCI Region On-Premises Availability Domain 1 Fault Domain 1 Fault Domain 2 Fault Domain 3 VCN Internet 3rd Party Cloud Portrait Template<br>
slide29. Landscape Sample Copyright © 2022 Oracle and/or its affiliates. On-Premises OCI Region Availability Domain 1 Subnet A
10.0.30.0/24
Bastion
Server Subnet B
10.0.30.0/24
Primary
Database Availability Domain 2 Subnet D
10.0.30.0/24
Standby
Database VCN Subnet C
10.0.30.0/24
Loaded Balanced
Web Servers Oracle
Services
Network<br>
slide30. Portrait Sample Copyright © 2022 Oracle and/or its affiliates. On-Premises OCI Region Availability Domain 1 Subnet A
10.0.30.0/24
Bastion
Server Subnet B
10.0.30.0/24
Primary
Database Availability Domain 2 Subnet D
10.0.30.0/24
Standby
Database VCN Subnet C
10.0.30.0/24
Loaded Balanced
Web Servers Oracle
Services
Network<br>
slide31. Landscape Sample Copyright © 2022 Oracle and/or its affiliates. OCI Region Availability Domain 1 Fault Domain 1 Fault Domain 2 On-Premises Internet 3rd Party Cloud Subnet A
00.0.00.0/00 VCN VCN Compartment A VCN Subnet B
00.0.00.0/00 Subnet C
00.0.00.0/00 Compartment B Internet
Gateway A B C Oracle
Services
Network<br>
slide32. Landscape Sample Copyright © 2022 Oracle and/or its affiliates. OCI Region Availability Domain 1 Availability Domain 2 Availability Domain 3 VCN Edge Tier Subnet A
00.0.00.0/00 Data Tier Subnet C
00.0.00.0/00 App Tier Subnet B
00.0.00.0/00 Container Engine for
Kubernetes Cluster Oracle
Services
Network On-Premises<br>
slide33. Icons 4/26/2024 Copyright © 2022, Oracle and/or its affiliates | 33<br>
slide34. Compute Copyright © 2022 Oracle and/or its affiliates. 34<br>
slide35. Storage Copyright © 2022 Oracle and/or its affiliates. 35<br>
slide36. Networking Copyright © 2022 Oracle and/or its affiliates. 36<br>
slide37. Database Copyright © 2022 Oracle and/or its affiliates. 37<br>
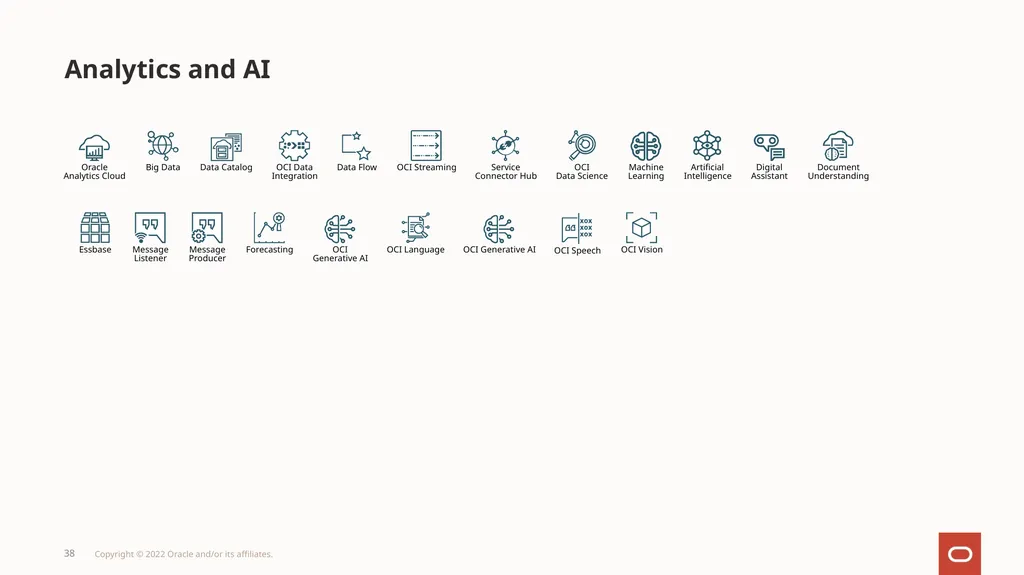
slide38. Analytics and AI Copyright © 2022 Oracle and/or its affiliates. 38<br>
slide39. Developer Services Copyright © 2022 Oracle and/or its affiliates. 39<br>
slide40. Identity & Security Copyright © 2022 Oracle and/or its affiliates. 40<br>
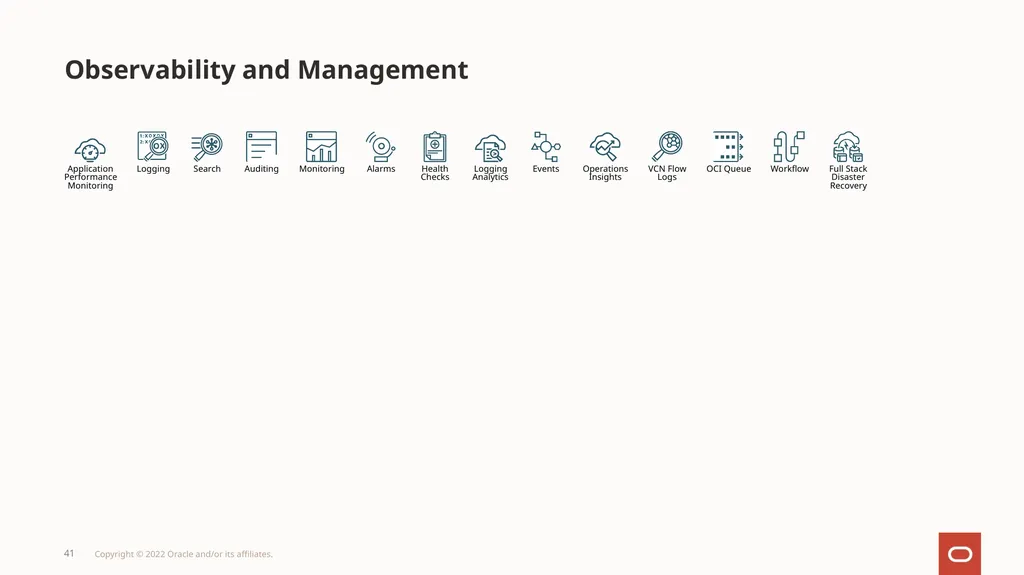
slide41. Observability and Management Copyright © 2022 Oracle and/or its affiliates. 41<br>
slide42. Hybrid Copyright © 2022 Oracle and/or its affiliates. 42<br>
slide43. Migration Copyright © 2022 Oracle and/or its affiliates. 43<br>
slide44. Governance and Administration Copyright © 2022 Oracle and/or its affiliates. 44<br>
slide45. Marketplace Copyright © 2022 Oracle and/or its affiliates. 45<br>
slide46. Applications Copyright © 2022 Oracle and/or its affiliates. 46<br>
slide47. Other Copyright © 2022 Oracle and/or its affiliates. 47<br>
slide48. End<br>
slide2. Logical
Physical
Icons
Compute
Storage
Networking
Database
Analytics and AI
Developer Services
Identity & Security Observability & Management
Hybrid
Migration
Governance & Administration
Marketplace
Applications
Other Table of Contents 4/26/2024 Copyright © 2022, Oracle and/or its affiliates | 2<br>
slide3. 4/26/2024 Copyright © 2022, Oracle and/or its affiliates | 3 Added Oracle service and service-related icons.
Added additional grouping boxes for physical diagrams.
A tip has been added to the left of some slides. You will have to zoom out (reduce to about 90%) in order to see the tip. Changelog<br>
slide4. 4/26/2024 Copyright © 2022, Oracle and/or its affiliates | 4 Use this guide to create diagrams that have a unified visual language for topology diagrams using Oracle’s Cloud products and services. The symbols, graphics, and connecting lines on the following pages will help you accurately communicate complex offerings, systems, and ideas into an Oracle-branded diagram.
Note: Additional direction is shown in pink using the Courier New Font. DO NOT use pink or Courier New in your diagrams.
This icon set is available in the following formats: • SVG • PNG • PPT • Draw.io • Visio Introduction<br>
slide5. Use the Redwood Theme Colors applied to this PowerPoint deck. Custom Colors and Recent Colors can change location within the PowerPoint palette. Refer to the RGB and Hex values below to ensure correct color usage in your OCI diagrams across applications.
Create your own new color palette if you are building diagrams in other graphics applications. Use the standard Oracle Redwood Colors defined here.
Use Oracle’s standard font; Oracle Sans for all diagram text. If Oracle Sans is not available, use Arial, Calibri or equivalent sans serif font instead. Redwood Color Palette and Typography 4/26/2024 Copyright © 2022, Oracle and/or its affiliates |<br>
slide6. Logical 4/26/2024 Copyright © 2022, Oracle and/or its affiliates | 6 A logical architecture diagram shows how a solution works by depicting logical components or capabilities. It gives an easier to understand, high-level abstraction of the solution.
A logical architecture diagram groups technical complexity into one “box” named with a single capability, often with user interactions. It does not depict a product or technology.<br>
slide7. There are two types of Grouping Boxes Location Groups
The Location Grouping format shows the physical location of the Components placed inside.
Location Grouping boxes are arranged in a specific way, shown on the Location Canvas slide. Format Other Groups
The Other Grouping format is a generic grouping notation for any additional grouping needs.
Other Grouping format is used for any kind of logical, technical, or product-specific grouping needed within a logical architecture.
Other Grouping format is used to define the borders of environments, states, high availability, clusters, etc. Format Groupings 4/26/2024 Copyright © 2022, Oracle and/or its affiliates | 7 Oracle Cloud On-Premises Internet 3rd Party Cloud Align: Top/Centre
Font: 9pt, Bold
Color: Bark
Line: 1pt
Color: Neutral 3
Fill: 100%
Color: Neutral 1 Other Group Align: Top/Centre
Font: 9pt, Bold
Color: Bark
Line: 1pt/Dashed
Color: Bark
Fill: 100%
Color: Air Color:<br>
slide8. Definition
Components are subsystems, technical or business-capabilities with well defined responsibilities, boundaries, and interfaces.
Components can have different levels of abstraction in the logical architecture, but should not display any physical assets or information, such as different instances or networking details. Format Oracle Cloud Infrastructure (OCI), On-Premises or 3rd Party (non-OCI) Atomic & Composite
OCI Components can be shown as atomic (singular unit, not to be broken down further) or as a composite of multiple Components.
Atomic format can be used to summarize larger systems and capabilities when further detail is unnecessary.
Collapsed Composite format indicates more detail to come as Expanded Composite Components.
Expanded Composite format can include any other kind of Component, including multiple levels of nested Composite Components. Format Atomic and Composite Collapsed or Expanded Components 4/26/2024 Copyright © 2022, Oracle and/or its affiliates | 8 Oracle On-Premises
Component 3rd Party
(non-OCI) Align: Mid/Center
Font: 9pt, Reg
Color: Bark
Line: 1pt
Color: O-Red
Fill: 100%
Color: Air Align: Top/Center
Font: 9pt, Bold
Color: Bark
Line: 1pt
Color: Bark
Fill: 100%
Color: Air Atomic Collapsed Composite Expanded Composite Atomic Align: Mid/Center
Font: 9pt, Reg
Color: Air
Line: None
Color: None
Fill: 100%
Color: Ivy Align: Mid/Center
Font: 9pt, Reg
Color: Bark
Line: 1pt
Color: Ivy
Fill: 100%
Color: Air Align: Top/Center
Font: 9pt, Bold
Color: Bark
Line: 1pt/Dashed
Color: Ivy
Fill: 100%
Color: Air OCI
Component Align: Mid/Center
Font: 9pt, Reg
Color: Bark
Line: 1pt
Color: Ivy
Fill: 100%
Color: Air Atomic<br>
slide9. Drill-Down Progression Layout Examples Component Drill-Downs 4/26/2024 Copyright © 2022, Oracle and/or its affiliates | 9 Composite Expanded Composite Component Component EBS on Compute DBCS Compute File Storage EBS Horizontal Drill-down Expansion Format Use Ivy color at 50% transparency to show expansion in Drill-Downs between Composite and Expansion. Ivy @ 50%
Transparency Drill-down Indicated Vertical Drill-down Expansion<br>
slide10. Use connectors to show relationships between icons and grouping boxes.
Reuse these sample connectors or generate connectors.
Use Bark color for all connector lines.
Use 1pt line weight (or your app’s equivalent) for all connector lines.
Use Open Arrowhead style (or your app’s equivalent) to indicate directional flow.
Use Solid-line connectors for Dataflow.
Use Dashed-line connectors (or your app’s equivalent) for User Interaction.
Maintain consistent width and height of the connector pegs for visual clarity.
Align and center connector lines by each connector joint.
Maintain a small gap between icons and connectors for visual clarity. Sample Dataflow Solid-line Sample User Interaction Dashed-line Connectors — Logical 4/26/2024 Copyright © 2022, Oracle and/or its affiliates | 10<br>
slide11. Use connector labels to distinguish different types of logical connections and relationships.
Use 8pt font size and Bark color for label text.
Place connector labels on the horizontal portions of a line whenever possible.
Center connector labels on the connector line. Text Label Labeled Action Ordered Action Connector Labels 4/26/2024 Copyright © 2022, Oracle and/or its affiliates | 11 A B C D A B C A B C D 1 2 3 4 1 2 3 4 Connector Label 1 Connector Label 2 Connector Label 1 Connector Label 2 3 Connector
Label 3 Connector
Label Connector Label Connector Label Connector
Label C Connector
Label A Connector Label B Connector Label<br>
slide12. Move or delete location canvas regions as needed Location Canvas 4/26/2024 Copyright © 2022, Oracle and/or its affiliates | 12<br>
slide13. 4/26/2024 Copyright © 2022, Oracle and/or its affiliates | 13 Logical architecture diagram examples The following slides show examples of the architecture notation. Its purpose is to show how the different elements and icons are placed together, but these examples are not always complete or technically correct.
For verified example solution architectures please visit https://docs.oracle.com/solutions/<br>
slide14. 4/26/2024 Copyright © 2022, Oracle and/or its affiliates | 14 Example: Components with Groups OCI Region On-Premises Internet 3rd Party Cloud Business Logic Integration Analytics Analytics Integration Data Warehouse EBS 5 4 3 6 Oracle
App Oracle
App 1 2<br>
slide15. 4/26/2024 Copyright © 2022, Oracle and/or its affiliates | 15 Example: On-Premises Components with Groups On-Premises Internet 3rd Party Cloud Business Logic Integration Analytics Analytics Integration Data Warehouse EBS 5 1 2 3 4 6 Oracle
App Oracle
App<br>
slide16. Example: Components with Groups Notes:
Last Updated: DD-MMM-YYYY
Us Lorem ipsum dolor sit amet, consectetur adipiscing elit. Vestibulum ac congue metus, in semper risus.
Us Lorem ipsum dolor sit amet, consectetur adipiscing elit. Vestibulum ac congue metus, in semper risus.
Us Lorem ipsum dolor sit amet, consectetur adipiscing elit. Vestibulum ac congue metus, in semper risus.
Us Lorem ipsum dolor sit amet, consectetur adipiscing elit. Vestibulum ac congue metus, in semper risus.
Us Lorem ipsum dolor sit amet, consectetur adipiscing elit. Vestibulum ac congue metus, in semper risus.
Us Lorem ipsum dolor sit amet, consectetur adipiscing elit. Vestibulum ac congue metus, in semper risus. Numbered Explanations 4/26/2024 Copyright © 2022, Oracle and/or its affiliates | 16 Using Numbered explanations makes your diagrams easier to scan quickly, and offloads text blocks to a document's body.<br>
slide17. Physical 4/26/2024 Copyright © 2022, Oracle and/or its affiliates | 17 A physical architecture diagram describes a solution that uses physical or virtualized components or products. A physical diagram helps a technical audience understand components and information flow with a low-level abstraction. These diagrams are often used to constrain and drive a later implementation. A physical architecture diagram does not usually abstract technical components into a single “box.”<br>
slide18. Use the boxes on the right when depicting groupings in your diagrams. Groupings are divided by logical and physical resource groupings and are indicated by dashed or solid outlines.
Icons and captions are not mandatory but should be used if they add clarity and purpose to your diagram.
VCN, routing table, and security list icons are used at half size as labels to differentiate the VCN and subnet. In complex diagrams omit them to reduce clutter in the diagram.
See sample usage diagrams starting on this slide. Network Grouping Location Grouping Grouping 4/26/2024 Copyright © 2022, Oracle and/or its affiliates | 18 Compartment Grouping Other Grouping OCI Region Availability Domain Fault Domain User Group Tier Tenancy Compartment Align: Top/Left
Font: 9pt, Bold
Color: Sienna
Line: 1.25pt dashed
Color: Sienna
Fill: No Fill Align: Top/Left
Font: 9pt, Bold
Color: Sienna
Text2: 9pt, light
Color: Bark
Line: 1pt dashed
Color: Sienna
Fill: No Fill Align: Top/Left
Font: 9pt, Bold
Color: Sienna
Line: 1pt dashed
Color: Sienna
Fill: No Fill Align: Top/Left
Font: 9pt, Reg
Color: Bark
Line: 1pt dashed
Color: Neutral 3
Fill: No Fill Align: Top/Center
Font: 9pt, Bold
Color: Bark
Line: 1pt
Color: Neutral 3
Fill: Neutral 1 Align: Top/Center
Font: 9pt, semi-bold
Color: Bark
Line: 1pt
Color: Neutral 3
Fill: Neutral 2 Align: Top/Center
Font: 9pt, semi-bold
Color: Bark
Line: 1pt
Color: Neutral 3
Fill: Air Align: Top/Center
Font: 9pt
Color: Bark
Line: 1pt
Color: Neutral 3
Fill: Neutral 1 Align: Top/Center
Font: 9pt, light
Color: Bark
Line: 1pt, dashed
Color: Neutral 3
Fill: Air Subnet
00.0.00.0/00<br>
slide19. 4/26/2024 Copyright © 2022, Oracle and/or its affiliates | 19 Network Grouping Other Grouping Neutral 1
RGB: 245/244/242
HEX: #F5F4F2 Neutral 2
RGB: 223/220/216
HEX: #DFDCD8 Neutral 3
RGB: 158/152/146
HEX: #9E9892 Rose
RGB: 163/100/114
HEX: #A36472 Air
RGB: 252/251/250
HEX: #FCFBFA Bark
RGB: 49/45/42
HEX: #312D2A Color: Align: Top/Left
Font: 9pt, Semi-Bold
Color: Bark
Line: 2pt dashed
Color: Neutral 3
Fill: No Fill Metro Area or Realm Location Grouping Align: Top/Center
Font: 9pt, Extra-bold
Color: Bark
Line: 1pt
Color: Neutral 3
Fill: Neutral 2 Align: Top/Center
Font: 9pt,
Color: Rose
Line: 1pt dashed
Color: Rose
Fill: Air Grouping (continued)<br>
slide20. Use connector lines to show relationships between icons and grouping boxes.
Reuse these sample connectors or generate equivalently formatted connectors.
Use Bark color for all connector lines.
Use 1pt line weight (or your app’s equivalent) for all connector lines.
Use Open Arrowhead style (or your app’s equivalent) to indicate directional flow.
Maintain consistent connector peg width and height for visual clarity.
Align and center connector lines by each connector joint.
Maintain a small gap between icons and connectors for visual clarity. Sample Connectors Usage Examples Connectors 4/26/2024 Copyright © 2022, Oracle and/or its affiliates | 20 Subnet A
00.0.00.0/00 Subnet B
00.0.00.0/00<br>
slide21. Icons and Labels The following special connections have specific labeling considerations:
Connector specific icons, lines and text are shown in Bark color.
Connector specific icons are scaled down to ½ size and centered over the connection line.
Use the background fill color of the label textbox to mask the line behind the text and ensure legibility. Samples Note: Label text and icon are always placed over the connection line being labeled. Special Connectors 4/26/2024 Copyright © 2022, Oracle and/or its affiliates | 21 Local Peering label text is placed over the connection line without an icon. Remote Peering label text is placed over the connection line and grouped with the Remote Peering icon. Site-to-Site VPN label text is placed over the connection line and grouped with the VPN icon. FastConnect label text is placed over the connection line and grouped with the FastConnect icon. Site-to-Site VPN or FastConnect label text is placed over the connection line without an icon.<br>
slide22. Usage Examples The following special connections have specific usage considerations:
Remote Peering always occurs between DRGs in different regions.
Local Peering always occurs between Local Peering Gateways in the same region. This is always a 1:1 connection.
Site-to-Site VPN connections always connect a DRG to a CPE device.
FastConnect always connects a DRG to an on-premises network, usually to a CPE device.
In cases where connectivity between cloud and on-premises needs to be shown but the connection method is not important to the diagram, use Site-to-Site VPN or FastConnect as shown. Special Connections 4/26/2024 Copyright © 2022, Oracle and/or its affiliates | 22 LPG icons at both endpoints and Local Peering text label at center with no icon. Region VCN Region VCN DRG icons at both endpoints and
Remote Peering icon and text label at center. VCN On-Premises CPE and DRG icons at endpoints and
VPN icon and text label at center. CPE and DRG icons at endpoints and
FastConnect icon and text label at center. CPE and DRG icons at either endpoint and
Site-to-Site VPN or FastConnect text label at center with no icon. VCN FastConnect On-Premises Region VCN Local Peering VCN On-Premises VCN<br>
slide23. Icon Scaling, Color and Labeling 4/26/2024 Copyright © 2022, Oracle and/or its affiliates | 23 Maintain Aspect Ratio
Never alter icon proportions (aspect ratio). To resize, hold the shift key in most software programs to maintain the proportions while scaling up or down. Color
To ensure brand consistency and clarity in your diagrams, limit color usage to Oracle Ocean and Oracle Sienna.
Never use colors that are not in the Oracle corporate palette. Never use more than one color on a single icon.
Copy and paste icons in approved colors located in the Icons section. Labeling
Always include identification labels provided with Icons.
Use Icons as indicated by labels included in the Icons section. Maintain Shape
To ensure accurate and consistent use, never alter, rotate or embellish the icons. Do not use effects such as drop-shadow or 3d effects on icons.<br>
slide24. Landscape Blank Template Copyright © 2022 Oracle and/or its affiliates. 24<br>
slide25. Portrait Blank Template Copyright © 2022 Oracle and/or its affiliates.<br>
slide26. 4/26/2024 Copyright © 2022, Oracle and/or its affiliates | 26 Physical architecture diagram examples The following slides show examples of the architecture notation. Its purpose is to show how the different elements and icons are placed together, but these examples are not always complete or technically correct.
For verified example solution architectures please visit https://docs.oracle.com/solutions/<br>
slide27. Landscape Blank Template Copyright © 2022 Oracle and/or its affiliates. OCI Region On-Premises Internet 3rd Party Cloud Availability Domain 1 Fault Domain 1 Fault Domain 2 Fault Domain 3 VCN Subnet A
00.0.00.0/00 Subnet B
00.0.00.0/00<br>
slide28. Copyright © 2022 Oracle and/or its affiliates. OCI Region On-Premises Availability Domain 1 Fault Domain 1 Fault Domain 2 Fault Domain 3 VCN Internet 3rd Party Cloud Portrait Template<br>
slide29. Landscape Sample Copyright © 2022 Oracle and/or its affiliates. On-Premises OCI Region Availability Domain 1 Subnet A
10.0.30.0/24
Bastion
Server Subnet B
10.0.30.0/24
Primary
Database Availability Domain 2 Subnet D
10.0.30.0/24
Standby
Database VCN Subnet C
10.0.30.0/24
Loaded Balanced
Web Servers Oracle
Services
Network<br>
slide30. Portrait Sample Copyright © 2022 Oracle and/or its affiliates. On-Premises OCI Region Availability Domain 1 Subnet A
10.0.30.0/24
Bastion
Server Subnet B
10.0.30.0/24
Primary
Database Availability Domain 2 Subnet D
10.0.30.0/24
Standby
Database VCN Subnet C
10.0.30.0/24
Loaded Balanced
Web Servers Oracle
Services
Network<br>
slide31. Landscape Sample Copyright © 2022 Oracle and/or its affiliates. OCI Region Availability Domain 1 Fault Domain 1 Fault Domain 2 On-Premises Internet 3rd Party Cloud Subnet A
00.0.00.0/00 VCN VCN Compartment A VCN Subnet B
00.0.00.0/00 Subnet C
00.0.00.0/00 Compartment B Internet
Gateway A B C Oracle
Services
Network<br>
slide32. Landscape Sample Copyright © 2022 Oracle and/or its affiliates. OCI Region Availability Domain 1 Availability Domain 2 Availability Domain 3 VCN Edge Tier Subnet A
00.0.00.0/00 Data Tier Subnet C
00.0.00.0/00 App Tier Subnet B
00.0.00.0/00 Container Engine for
Kubernetes Cluster Oracle
Services
Network On-Premises<br>
slide33. Icons 4/26/2024 Copyright © 2022, Oracle and/or its affiliates | 33<br>
slide34. Compute Copyright © 2022 Oracle and/or its affiliates. 34<br>
slide35. Storage Copyright © 2022 Oracle and/or its affiliates. 35<br>
slide36. Networking Copyright © 2022 Oracle and/or its affiliates. 36<br>
slide37. Database Copyright © 2022 Oracle and/or its affiliates. 37<br>
slide38. Analytics and AI Copyright © 2022 Oracle and/or its affiliates. 38<br>
slide39. Developer Services Copyright © 2022 Oracle and/or its affiliates. 39<br>
slide40. Identity & Security Copyright © 2022 Oracle and/or its affiliates. 40<br>
slide41. Observability and Management Copyright © 2022 Oracle and/or its affiliates. 41<br>
slide42. Hybrid Copyright © 2022 Oracle and/or its affiliates. 42<br>
slide43. Migration Copyright © 2022 Oracle and/or its affiliates. 43<br>
slide44. Governance and Administration Copyright © 2022 Oracle and/or its affiliates. 44<br>
slide45. Marketplace Copyright © 2022 Oracle and/or its affiliates. 45<br>
slide46. Applications Copyright © 2022 Oracle and/or its affiliates. 46<br>
slide47. Other Copyright © 2022 Oracle and/or its affiliates. 47<br>
slide48. End<br>