Outsourced R&D and GDP Growth Anne Marie Knott

Published  . 0 views
↓ Download
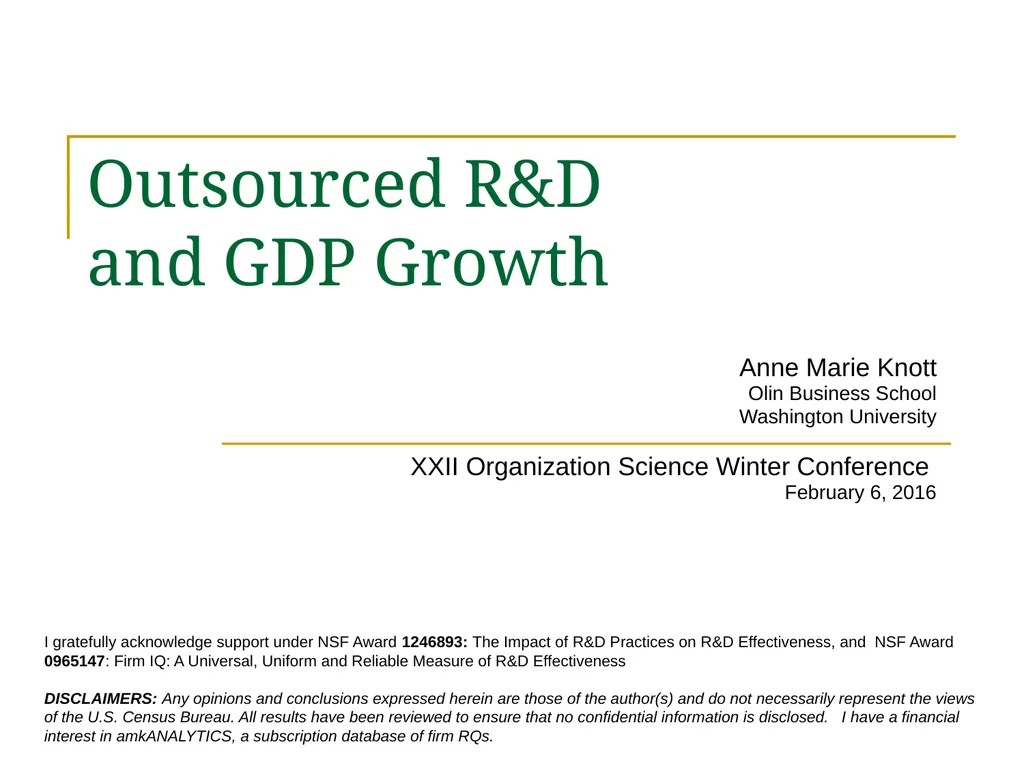
Outsourced R&D and GDP Growth Anne Marie Knott
1 / 1
Outsourced R&D and GDP Growth Anne Marie Knott - slide 1 of 18 Outsourced R&D and GDP Growth Anne Marie Knott - slide 2 of 18 Outsourced R&D and GDP Growth Anne Marie Knott - slide 3 of 18 Outsourced R&D and GDP Growth Anne Marie Knott - slide 4 of 18 Outsourced R&D and GDP Growth Anne Marie Knott - slide 5 of 18 Outsourced R&D and GDP Growth Anne Marie Knott - slide 6 of 18 Outsourced R&D and GDP Growth Anne Marie Knott - slide 7 of 18 Outsourced R&D and GDP Growth Anne Marie Knott - slide 8 of 18 Outsourced R&D and GDP Growth Anne Marie Knott - slide 9 of 18 Outsourced R&D and GDP Growth Anne Marie Knott - slide 10 of 18 Outsourced R&D and GDP Growth Anne Marie Knott - slide 11 of 18 Outsourced R&D and GDP Growth Anne Marie Knott - slide 12 of 18 Outsourced R&D and GDP Growth Anne Marie Knott - slide 13 of 18 Outsourced R&D and GDP Growth Anne Marie Knott - slide 14 of 18 Outsourced R&D and GDP Growth Anne Marie Knott - slide 15 of 18 Outsourced R&D and GDP Growth Anne Marie Knott - slide 16 of 18 Outsourced R&D and GDP Growth Anne Marie Knott - slide 17 of 18 Outsourced R&D and GDP Growth Anne Marie Knott - slide 18 of 18
Description: Outsourced RD and GDP Growth Anne Marie Knott Olin Business School Washington University XXII Organization Science Winter Conference February 6, 2016 I gratefully acknowledge support under NSF Award 1246893: The Impact of RD Practices on

Related Topics

Download Presentation

"Outsourced R&D and GDP Growth Anne Marie Knott" is the property of its rightful owner. Permission is granted to download and print the materials on this website for personal, non-commercial use only, and to display it on your personal computer provided you do not modify the materials and that you retain all copyright notices contained in the materials. By downloading content from our website, you accept the terms of this agreement.

Presentation Transcript

slide1. Outsourced R&D and GDP Growth Anne Marie Knott
Olin Business School
Washington University

XXII Organization Science Winter Conference
February 6, 2016 I gratefully acknowledge support under NSF Award 1246893: The Impact of R&D Practices on R&D Effectiveness, and NSF Award 0965147: Firm IQ: A Universal, Uniform and Reliable Measure of R&D Effectiveness

DISCLAIMERS: Any opinions and conclusions expressed herein are those of the author(s) and do not necessarily represent the views of the U.S. Census Bureau. All results have been reviewed to ensure that no confidential information is disclosed. I have a financial interest in amkANALYTICS, a subscription database of firm RQs.<br>
slide2. Romer (1990) provides first formal theory linking R&D to growth Finished goods production function:
Y=Ka(ALY)1-a
Imbedded in that is the knowledge production function:
A’=dALA
Where:
A = knowledge/technology
d = research productivity
LA= research labor
Combining:
Y=Ka((A+dALA)*LY)1-a
Most important conclusions:
Growth in steady state: gA=gY=A’/A=(dALA)/A=dLA
Testable proposition: doubling LA doubles g (Scale effects)<br>
slide3. The puzzle Scientific labor (LA) has increased 2.5x
GDP growth declining 0.03% per year<br>
slide4. Two explanations for the disconnect* Jones (1995) explanation R&D has gotten harder
Eliminates scale effects prediction, by adding
Fishing out effect, q, - probability of finding new idea is declining in the stock of ideas
Diminishing returns to scientific labor, l, -due to higher likelihood of duplicate efforts
Revision:
Implication: growth converges to 0 Alternative explanation Firms have become worse at R&D
Scientific labor productivity, d, has declined
Leave Romer intact
Implication:
Steady state growth
Scale effects Third explanation is extension of first<br>
slide5. Paper tests the two explanations Characterize firms’ R&D productivity (RQ)
Conduct semi-critical test of two explanations
Identify source of declining RQ
Demonstrate sufficient to account for decline
Rule out alternative explanations linking source to declining RQ
Speculate why it causes decline in RQ
Speculate why firms persist with it<br>
slide6. RQ is most intuitive measure you could construct for R&D productivity Derived from production function:
Y = Ka Lb

Expand it to include intangibles:
Outputit = Capitalita *Laboritb * R&Dit-1g * Spilloversit-1d* Advertisingite

Matches most common approach to measuring R&D productivity (Hall, Mairesse, Mohnen 2010)

Make all exponents firm-specific:
Outputit = Capitalitai *Laboritbi * R&Dit-1gi * Spilloversit-1di* Advertisingitei

RQ is the exponent, gi, on R&D

Exact definition:
“firm-specific output elasticity of R&D”
% output increase from 1% R&D increase<br>
slide7. Important properties of RQ Universal: Can estimate for all firms doing R&D
(only 50% of R&D firms patent)
Uniform: It’s essentially a ratio of inputs to outputs, so interpretation is same across firms
Patents are apples and oranges:10% of patents comprise 85% of total value of all patents (Scherer and Harhoff 2000)
Reliable: Consistent with propositions from endogenous growth theory (tested over 47 years)*:
R&D investment, market value (MV) and firm growth increase with RQ
Patents fail MV and growth props; TFP fails growth prop * Knott and Vieregger 2015, “An Empirical Test of Endogenous Growth”<br>
slide8. 2a. Test of firms getting worse at R&D RQ has declined 65% over 30 years!<br>
slide9. 2b. Test of R&D getting harder If R&D has gotten harder, maximum RQ should decline over time
Maximum RQ is actually increasing
Though the increase comes from new industries
Max RQ is declining within industries<br>
slide10. 3. Identify source of declining RQ using NSF Survey of Industrial R&D (SIRD) Annual survey of US firms conducting R&D
1957 to 2007
Replaced by BRDIS in 2008
Sample intended to represent all for-profit R&D-performing companies
The data includes:
domestic sales
domestic employment
number of scientists/engineers
total domestic R&D expenditures by
source of funding (Federal R&D versus company R&D funds)
horizon (basic research, applied research, and development)
location (internal, outsourced within US, foreign entities). 20.1x rise in R&D outsourcing
versus 2.4x for R&D labor<br>
slide11. 4a. Demonstrate outsourcing can account for RQ decline Treat three sources of R&D (internal, outsource in US, foreign) as separate inputs
Estimate contributions of each to firm production function:
Outputit = Capitalitai *Laboritbi * RDintit-1g1i * RDoutit-1g2i * RDforit-1g3i * Spilloversit-1di<br>
slide12. 4b. Results: Outsourced R&D unproductive for funding firm Elasticity of outsourced R&D 0.001
Versus 0.13 for internal R&D
robust to exclusion of spillovers
No evidence R&D has gotten harder:
Elasticities for each R&D form are equivalent (3)vs(5)<br>
slide13. 5. Rule out selection effects A. Do lower quality firms outsource?
Treatment regression
If lower quality firms outsource should affect both internal and aggregate RQ
B. Do firms outsource less productive projects?
What happens to internal RQ pre/post outsource
If firms outsource lower quality projects, internal RQ should increase following first outsourcing<br>
slide14. 5a. Test of firm quality suggests productivity problem lies elsewhere Two stage treatment model:
First stage models p(outsource): neverout
Second stage models treatment effects of neverout on R&D productivity
If firm quality is driving outsourcing:
Treatment effect (neverout) should be same for internal and aggregate RQ
Results:
No treatment effect on internal RQ
Positive effect on aggregate RQ (significant at 10%)<br>
slide15. 5b. Test of project selection suggests productivity problem lies elsewhere If firms outsource their less productive projects
should see internal RQ increase post-outsourcing
Characterize internal RQ in window of first outsource
Create 7 year moving estimates of firm’s internal RQ
Create dummies for years around first outsource
RQit=ai +Sbt(dummies)+eit
Results:
No significant effect
Mean coefficient:
0.0006 pre-outsource
0.0000 post-outsource<br>
slide16. 6. Speculate why outsourcing has no impact on revenues Loss of internal spillovers
Benefits of knowledge from abandoned projects accrue to outsourcing firm rather than funding firm
Raises rivals
Lost internal opportunity (Hughes ion beam propulsion)
Lower ability to exploit research outcomes (Frank’s “absorptive capacity in reverse”)
Key technical resources lie outside the firm
Exploitation less likely and/or more costly
Firms who outsource IT integration less able to develop new applications (Weigelt 2009)<br>
slide17. 7. Speculate why firms persist given outsourcing is unproductive Firms don’t know their R&D productivity
Need for better R&D measures top concern for IRI members (Schwartz, Miller, Plummer, Fusfeld 2011)
Evidence
Fewer than 5% of firms R&D investment within +10% of optimum level (Knott 2012)
70% of surveyed CIOs and CEOs believe outsourcing innovation improves financial performance (Osteria and Kotlarsky 2011)
Susceptible to information cascades (Bikhchandani et al 1992)
Information cascade occurs when it is optimal for actors to ignore private information in favor of following prior actors
Relevant cascade is open innovation trend
Note outsourcing is only subset of open innovation
Other forms: alliances, joint ventures and external technology sourcing
External technology sourcing seems to benefit firms (Cassiman & Veugulers 2006; Arora, Cohen, Walsh 2014)<br>
slide18. Summary Proposed and tested an alternative to Jones for the broken link between R&D and growth
No evidence R&D getting harder
Rather it appears firms have become worse at it--their R&D productivity, RQ, has declined.
Fortunately the decline in RQ appears to stem from increased use of outsourced R&D
No decline in firms’ internal RQ.
Implications
Preserves model with growth in steady state (and scale effects)
vs Jones’ expectation of convergence toward 0 growth
Since outsourcing is fairly easily reversed, may restore firm RQs as well as US GDP growth.<br>