Overview Purpose Methodology Results Conclusions and recommendations Purpose Report of the purpose of the survey and the questions you wanted to answer. Methodology Report on the timeframe, response rate, method for advertising the
"Overview Purpose Methodology Results Conclusions" is the property of its rightful owner. Permission is granted to
download and print the materials on this website for personal, non-commercial use only, and to display it
on your personal computer provided you do not modify the materials and that you retain all copyright
notices contained in the materials. By downloading content from our website, you accept the terms of this
agreement.
Presentation Transcript
01
Overview Purpose
Methodology
Results
Conclusions and recommendations<br>
02
Purpose [Report of the purpose of the survey and the questions you wanted to answer.]<br>
03
Methodology [Report on the timeframe, response rate, method for advertising the survey, and possible influences on the data. Consider including a screenshot of the survey on your site.]<br>
04
Results: Who is using the XX site? [Consider structuring your results section by the question you wanted to answer. Then show the relevant data from the survey to answer the question.
Depending on your survey questions, typical information you might report on from a survey includes:
Who is using the site now (role, gender, age, education, location)?
How frequently do they use the site?
What are their main reasons for visiting the site?
What are their specific tasks?
Can they complete their tasks? How long does it take?
How satisfied are they with the site?
You can categorize answers to open-ended questions and report on the categories, with representative quotes included for each category.]<br>
05
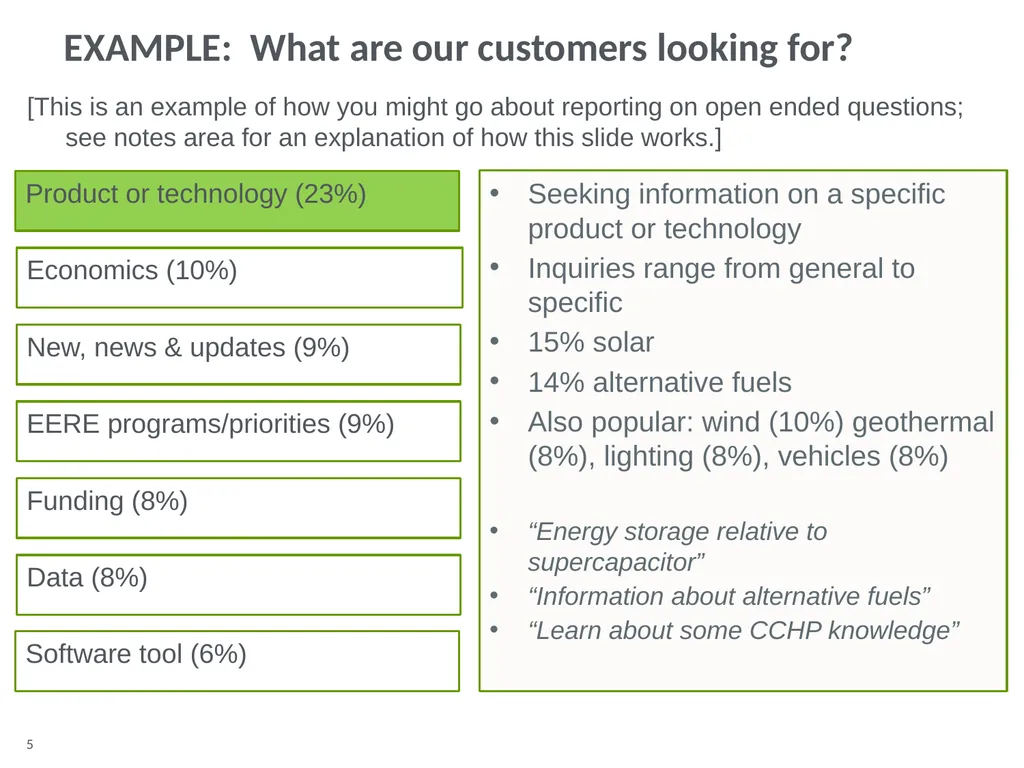
Seeking information on a specific product or technology
Inquiries range from general to specific
15% solar
14% alternative fuels
Also popular: wind (10%) geothermal (8%), lighting (8%), vehicles (8%)
“Energy storage relative to supercapacitor”
“Information about alternative fuels”
“Learn about some CCHP knowledge” Product or technology (23%) Economics (10%) New, news & updates (9%) EERE programs/priorities (9%) Funding (8%) Data (8%) Software tool (6%) EXAMPLE: What are our customers looking for? [This is an example of how you might go about reporting on open ended questions; see notes area for an explanation of how this slide works.]<br>
06
Results by Role [Next, report on the results by specific audience segment; focus on reporting findings that are unique or interesting about each audience.
You may choose to look at other ways to segment your data as well – for example, by satisfaction, or by frequency of usage – report on any interesting trends/differences you see in the data as you slice and dice it.]<br>
07
Conclusions and Recommendations [Report on any conclusions you can draw from the survey data and recommendations for next steps.]<br>