PDF Estimation Applied Machine Learning Derek Hoiem Dall-E Last class: EM True or False The EM algorithm is a method for maximum likelihood estimation in the presence of missing or incomplete data. The EM algorithm guarantees convergence to
"PDF Estimation Applied Machine Learning Derek" is the property of its rightful owner. Permission is granted to
download and print the materials on this website for personal, non-commercial use only, and to display it
on your personal computer provided you do not modify the materials and that you retain all copyright
notices contained in the materials. By downloading content from our website, you accept the terms of this
agreement.
Presentation Transcript
01
PDF Estimation Applied Machine Learning Derek Hoiem Dall-E<br>
02
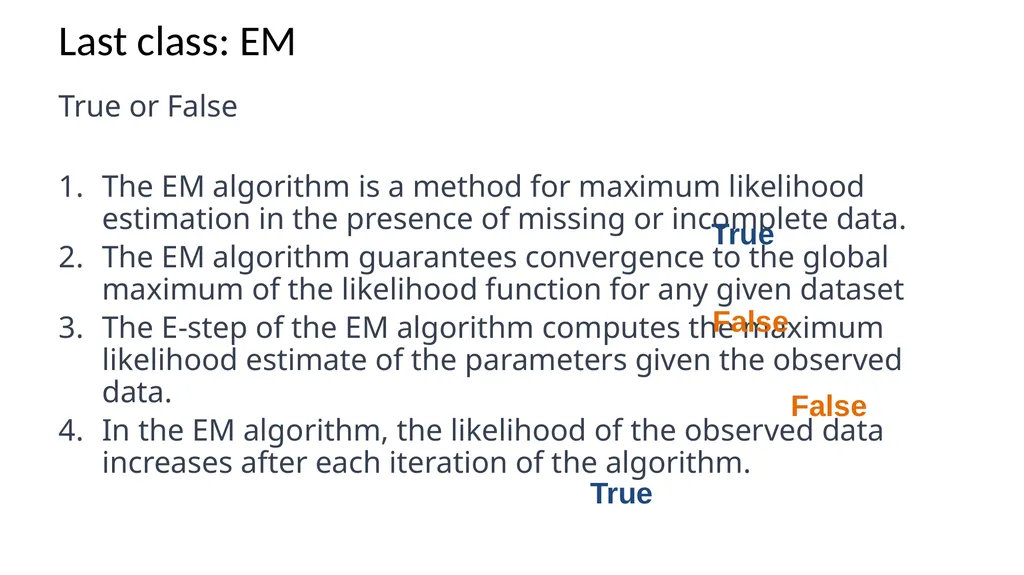
Last class: EM True or False
The EM algorithm is a method for maximum likelihood estimation in the presence of missing or incomplete data.
The EM algorithm guarantees convergence to the global maximum of the likelihood function for any given dataset
The E-step of the EM algorithm computes the maximum likelihood estimate of the parameters given the observed data.
In the EM algorithm, the likelihood of the observed data increases after each iteration of the algorithm. True False False True<br>
03
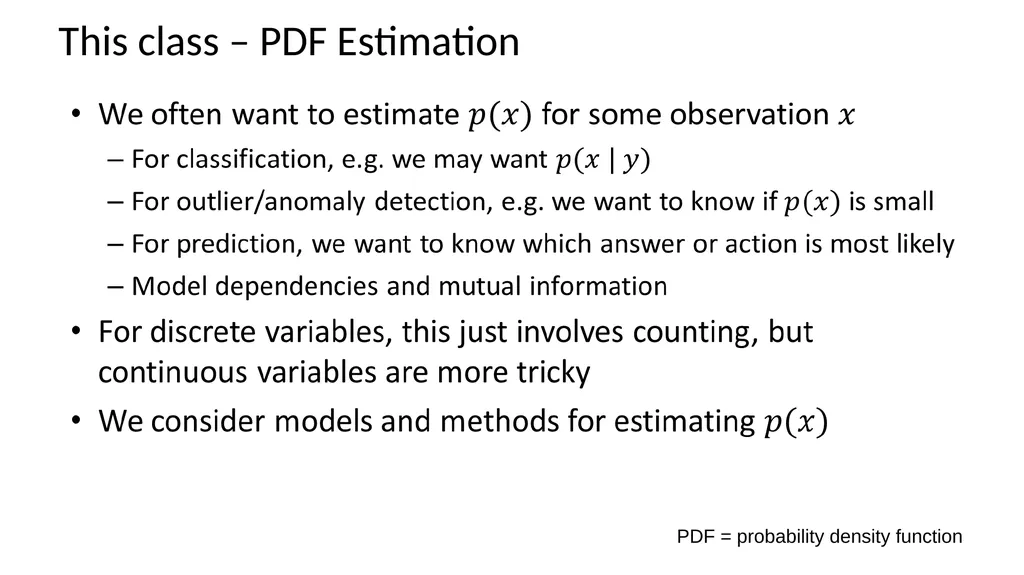
This class – PDF Estimation PDF = probability density function<br>
04
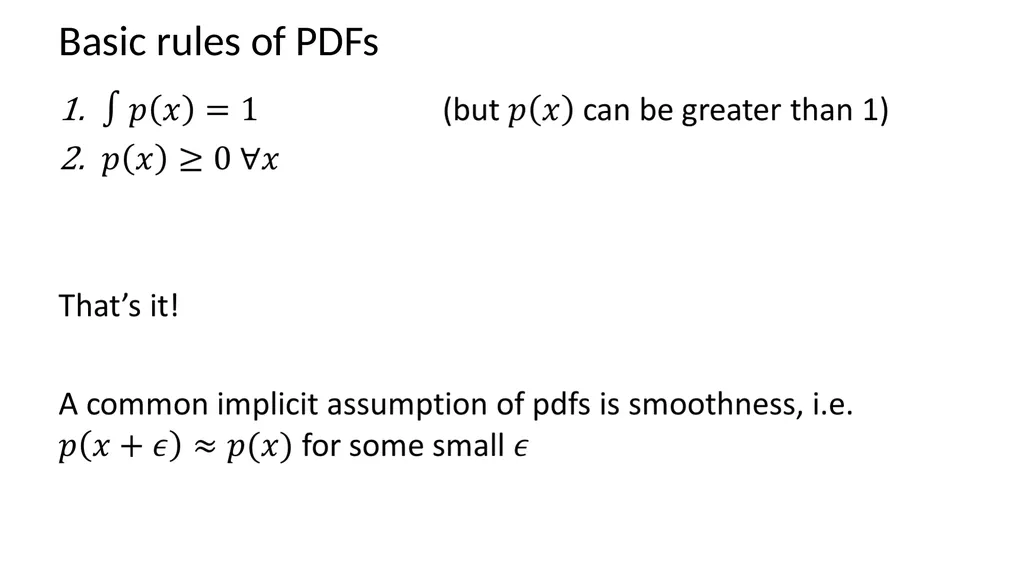
Basic rules of PDFs<br>
05
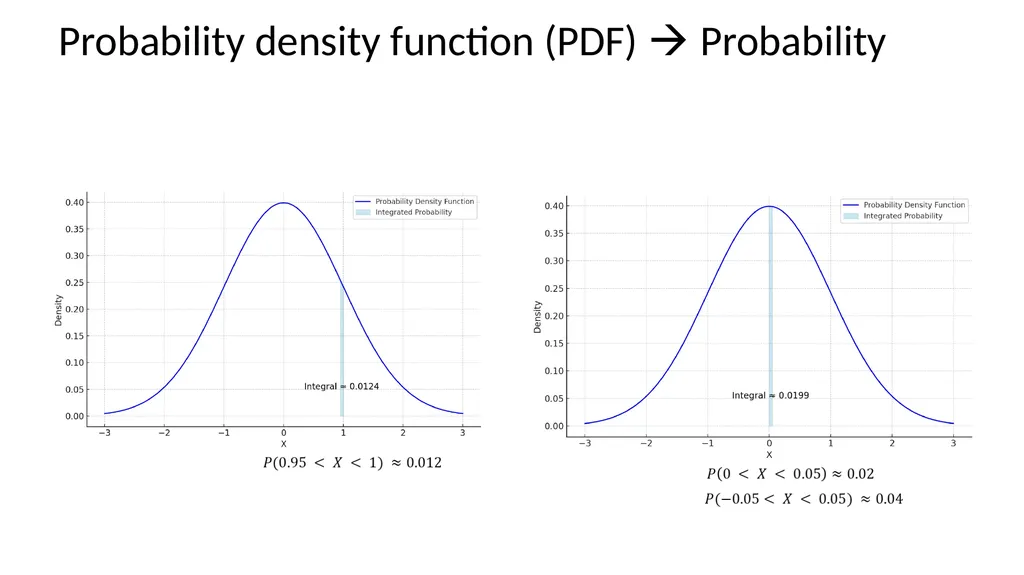
Probability density function (PDF) Probability<br>
06
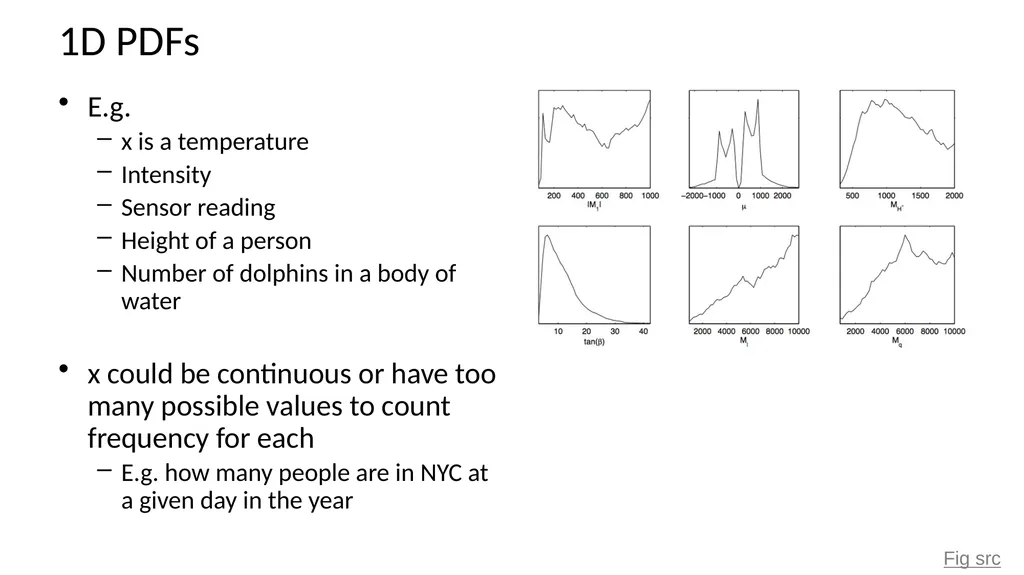
1D PDFs E.g.
x is a temperature
Intensity
Sensor reading
Height of a person
Number of dolphins in a body of water
x could be continuous or have too many possible values to count frequency for each
E.g. how many people are in NYC at a given day in the year Fig src<br>
07
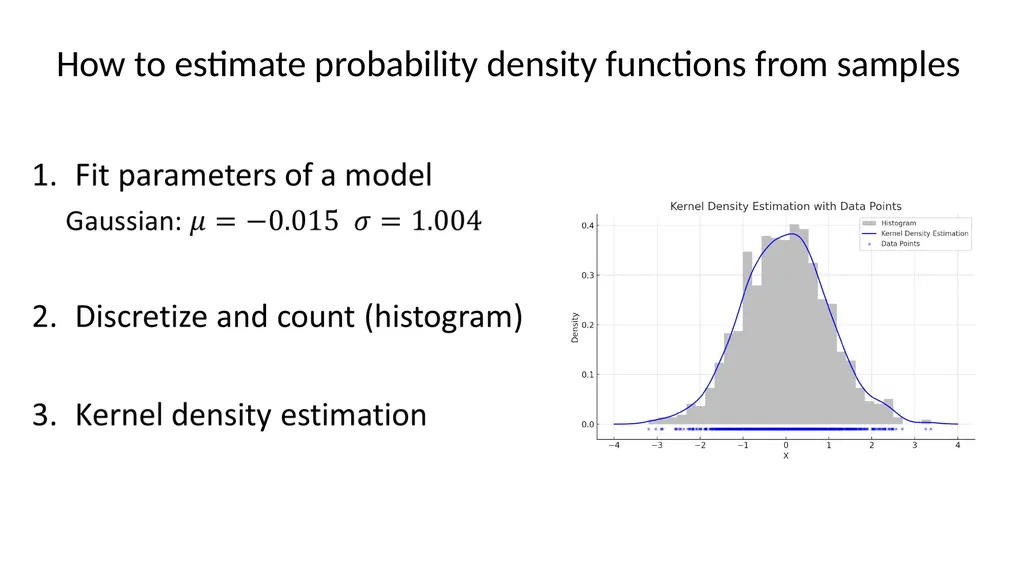
How to estimate probability density functions from samples<br>
08
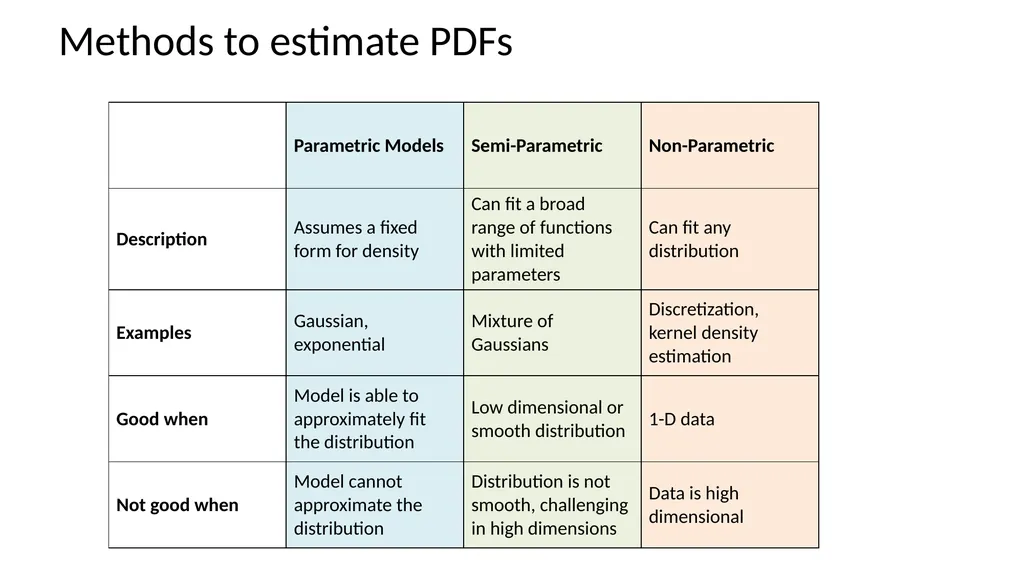
Methods to estimate PDFs<br>
09
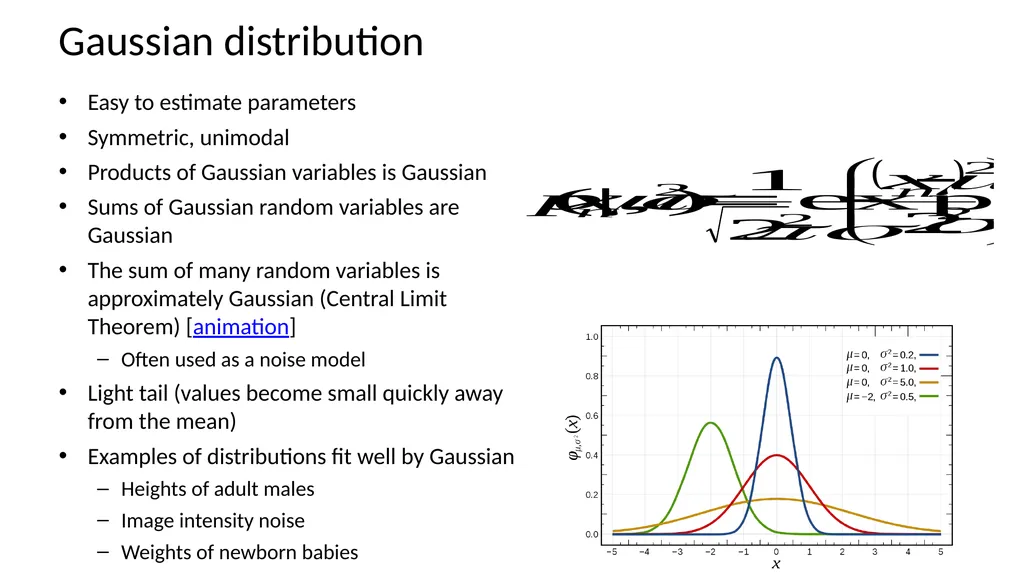
Gaussian distribution Easy to estimate parameters
Symmetric, unimodal
Products of Gaussian variables is Gaussian
Sums of Gaussian random variables are Gaussian
The sum of many random variables is approximately Gaussian (Central Limit Theorem) [animation]
Often used as a noise model
Light tail (values become small quickly away from the mean)
Examples of distributions fit well by Gaussian
Heights of adult males
Image intensity noise
Weights of newborn babies<br>
10
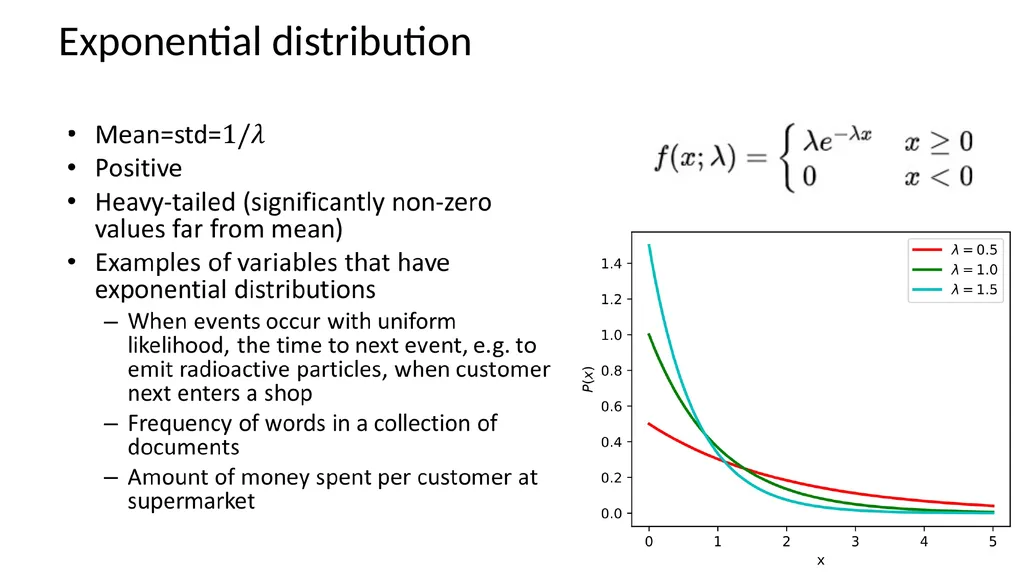
Exponential distribution<br>
11
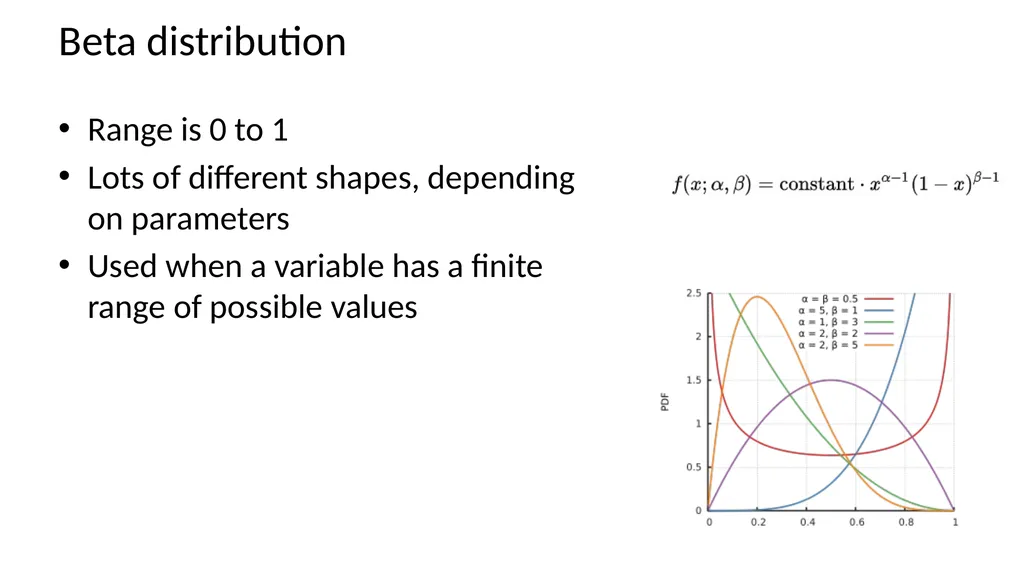
Beta distribution Range is 0 to 1
Lots of different shapes, depending on parameters
Used when a variable has a finite range of possible values<br>
12
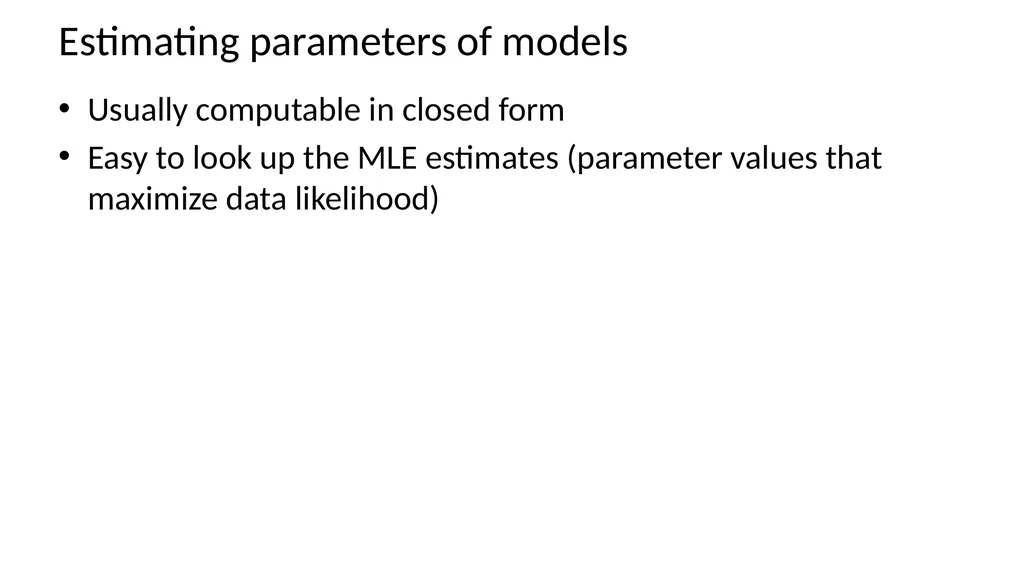
Estimating parameters of models Usually computable in closed form
Easy to look up the MLE estimates (parameter values that maximize data likelihood)<br>
13
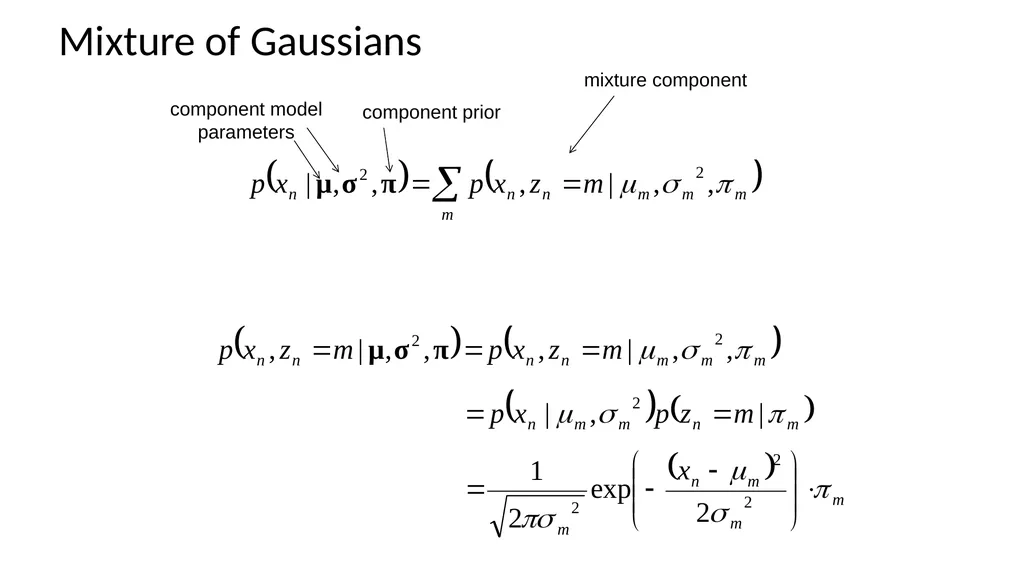
Mixture of Gaussians mixture component component prior component model parameters<br>
14
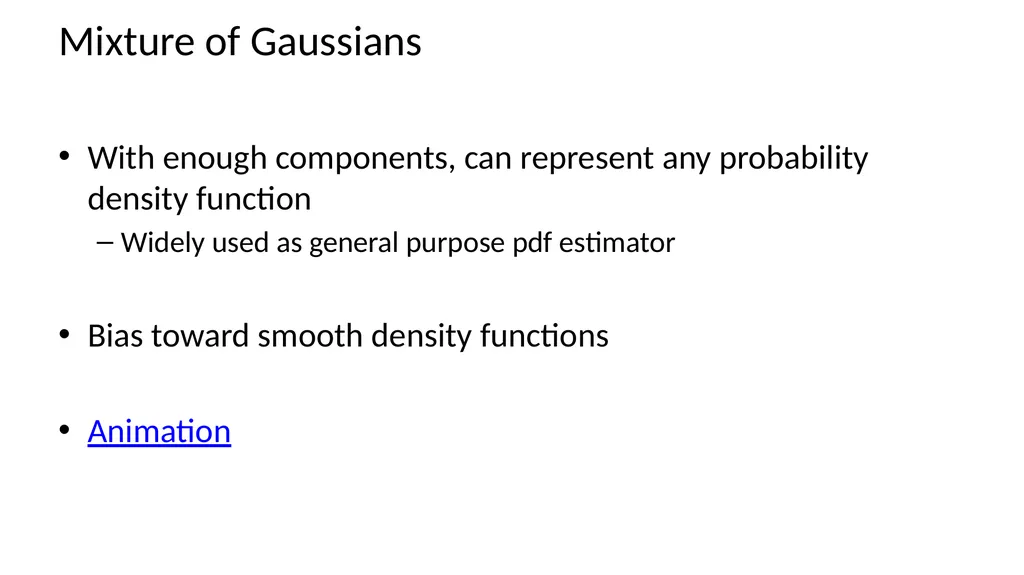
Mixture of Gaussians With enough components, can represent any probability density function
Widely used as general purpose pdf estimator
Bias toward smooth density functions
Animation<br>
15
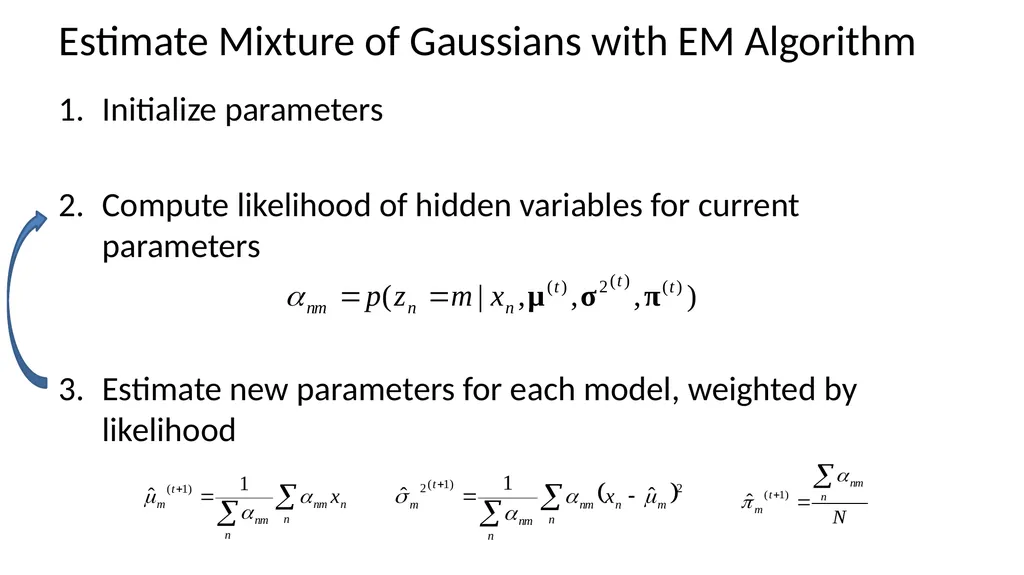
Estimate Mixture of Gaussians with EM Algorithm Initialize parameters
Compute likelihood of hidden variables for current parameters
Estimate new parameters for each model, weighted by likelihood<br>
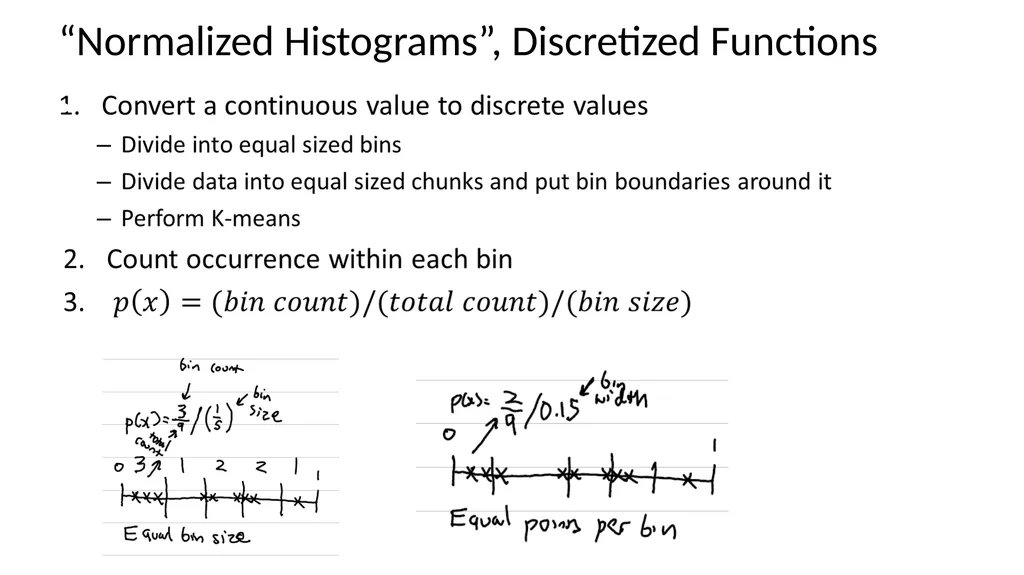
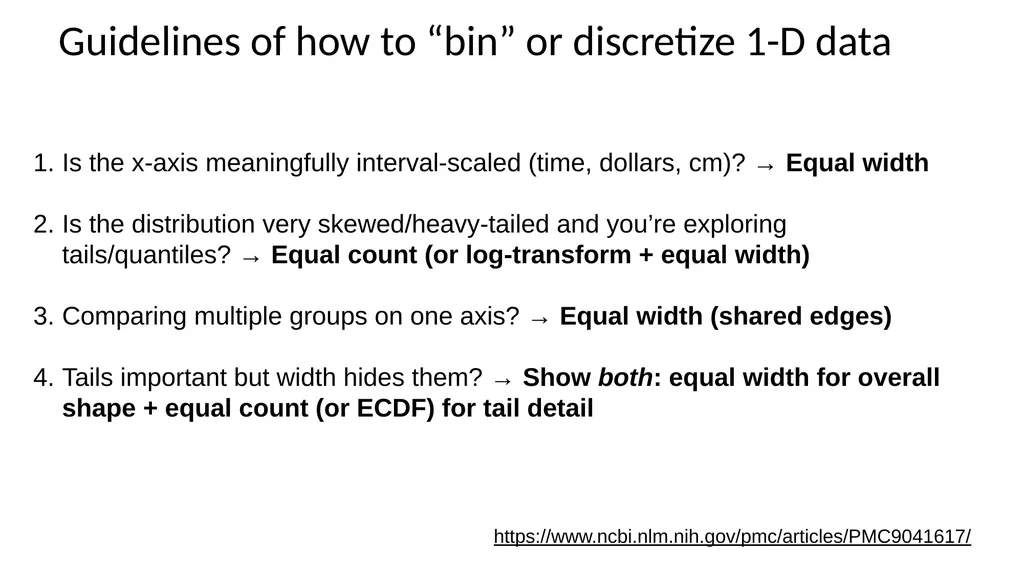
Guidelines of how to “bin” or discretize 1-D data https://www.ncbi.nlm.nih.gov/pmc/articles/PMC9041617/ Is the x-axis meaningfully interval-scaled (time, dollars, cm)? → Equal width
Is the distribution very skewed/heavy-tailed and you’re exploring tails/quantiles? → Equal count (or log-transform + equal width)
Comparing multiple groups on one axis? → Equal width (shared edges)
Tails important but width hides them? → Show both: equal width for overall shape + equal count (or ECDF) for tail detail<br>
18
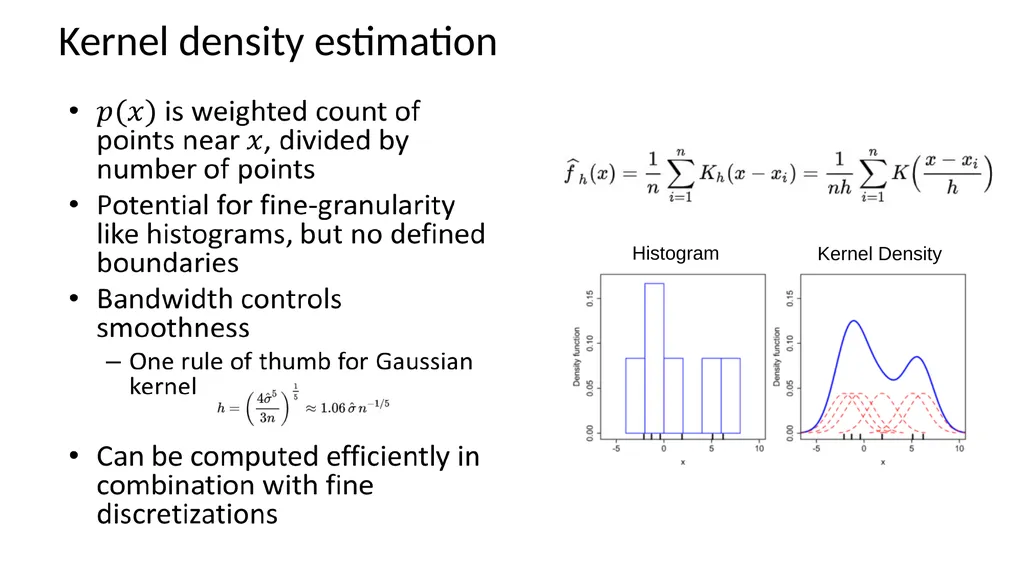
Kernel density estimation Histogram Kernel Density<br>
19
Q1-2 https://tinyurl.com/AML441-L10<br>
20
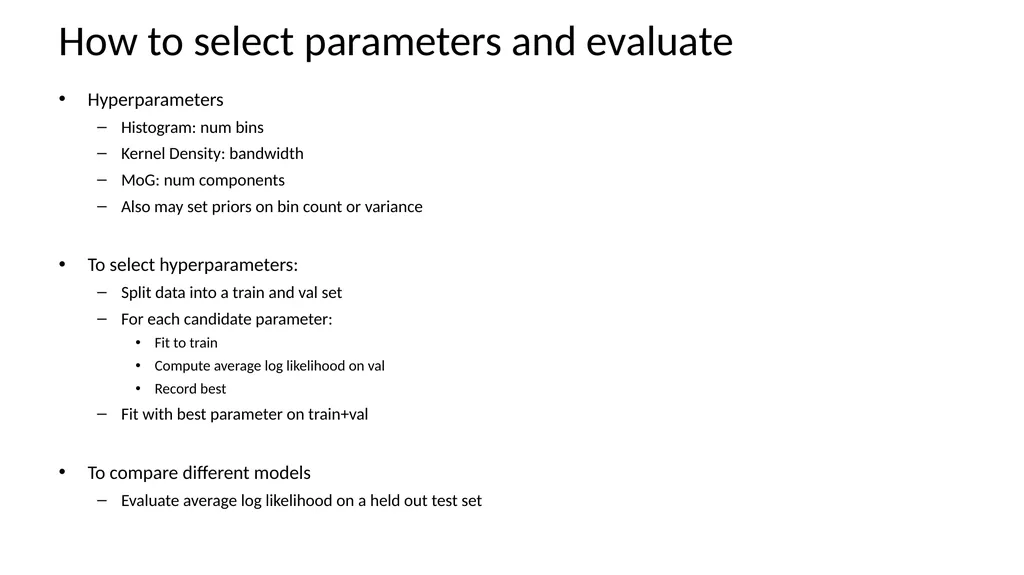
How to select parameters and evaluate Hyperparameters
Histogram: num bins
Kernel Density: bandwidth
MoG: num components
Also may set priors on bin count or variance
To select hyperparameters:
Split data into a train and val set
For each candidate parameter:
Fit to train
Compute average log likelihood on val
Record best
Fit with best parameter on train+val
To compare different models
Evaluate average log likelihood on a held out test set<br>
21
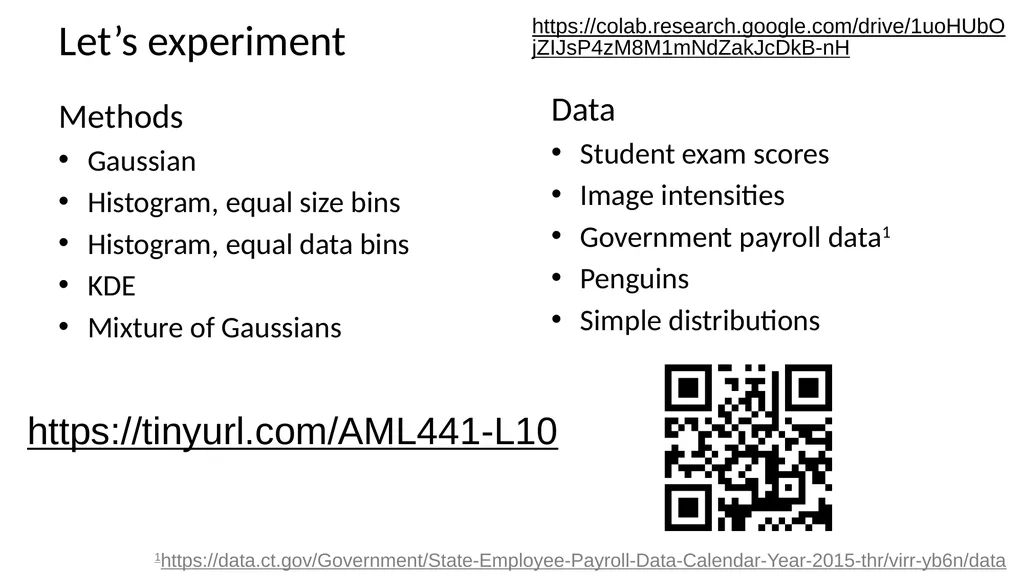
Let’s experiment Data
Student exam scores
Image intensities
Government payroll data1
Penguins
Simple distributions 1https://data.ct.gov/Government/State-Employee-Payroll-Data-Calendar-Year-2015-thr/virr-yb6n/data Methods
Gaussian
Histogram, equal size bins
Histogram, equal data bins
KDE
Mixture of Gaussians https://colab.research.google.com/drive/1uoHUbOjZIJsP4zM8M1mNdZakJcDkB-nH https://tinyurl.com/AML441-L10<br>