
Positioning Positioning concept Perceptual mapping
PT
Published · 71 slides · 0 views
1 / 1




Description
Positioning Positioning concept Perceptual mapping Preference mapping Key Concepts Differentiation (What you do to an offering): Creating tangible or intangible differences on one or more attributes between a focal offering and its main
Related Topics
Share
Embed code
Download this presentation From Below
"Positioning Positioning concept Perceptual mapping" is the property of its rightful owner. Permission is granted to download and print the materials on this website for personal, non-commercial use only, and to display it on your personal computer provided you do not modify the materials and that you retain all copyright notices contained in the materials. By downloading content from our website, you accept the terms of this agreement.
Presentation Transcript
01
Positioning Positioning concept
Perceptual mapping
Preference mapping<br>
Perceptual mapping
Preference mapping<br>
02
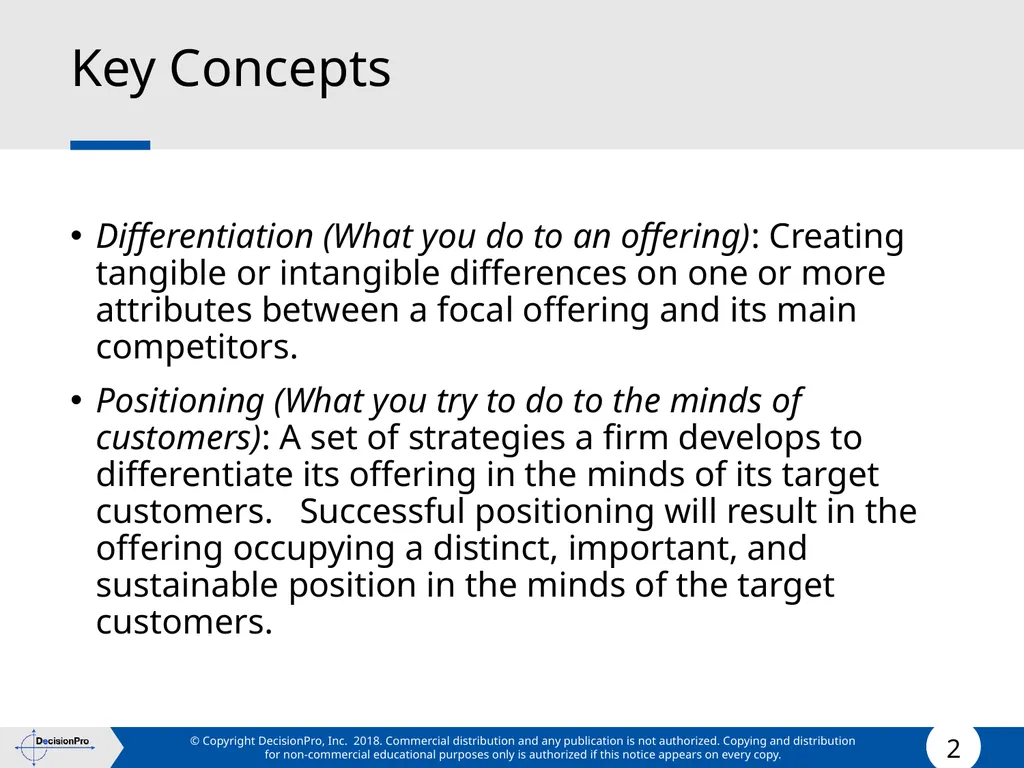
Key Concepts Differentiation (What you do to an offering): Creating tangible or intangible differences on one or more attributes between a focal offering and its main competitors.
Positioning (What you try to do to the minds of customers): A set of strategies a firm develops to differentiate its offering in the minds of its target customers. Successful positioning will result in the offering occupying a distinct, important, and sustainable position in the minds of the target customers.<br>
Positioning (What you try to do to the minds of customers): A set of strategies a firm develops to differentiate its offering in the minds of its target customers. Successful positioning will result in the offering occupying a distinct, important, and sustainable position in the minds of the target customers.<br>
03
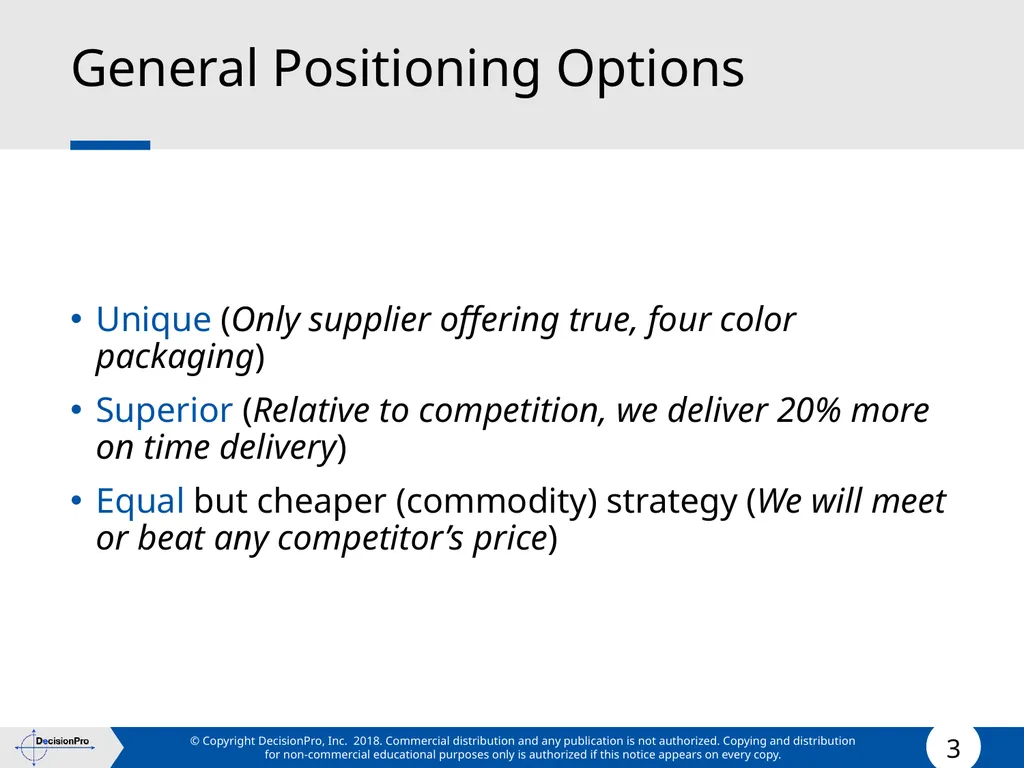
General Positioning Options Unique (Only supplier offering true, four color packaging)
Superior (Relative to competition, we deliver 20% more on time delivery)
Equal but cheaper (commodity) strategy (We will meet or beat any competitor’s price)<br>
Superior (Relative to competition, we deliver 20% more on time delivery)
Equal but cheaper (commodity) strategy (We will meet or beat any competitor’s price)<br>
04
Example Positioning Statements For [target segment], the [product/concept] is [most important claim] because [single most important support].
Iomega
For [PC Users], the [IOMEGA Zip drive] is the [best portable storage device] because [it is most cost-effective system].
JC Penney
For [Modern Spenders and Starting-outs in mid-income levels who shop for apparel, accessories, and home furnishings] we offer [private-label, supplier exclusive, and national brands] that [deliver greater value than that of our competitors] because of [our unique combination of quality, selection, fashion, service, price, and shopping experience]. (From jcpenney.com)<br>
Iomega
For [PC Users], the [IOMEGA Zip drive] is the [best portable storage device] because [it is most cost-effective system].
JC Penney
For [Modern Spenders and Starting-outs in mid-income levels who shop for apparel, accessories, and home furnishings] we offer [private-label, supplier exclusive, and national brands] that [deliver greater value than that of our competitors] because of [our unique combination of quality, selection, fashion, service, price, and shopping experience]. (From jcpenney.com)<br>
05
Example Positioning Statements Pantene
For [females 18-49 who possess dry damaged hair and believe they cannot achieve truly healthy/shiny hair] Pantene is a [hair care system (shampoo/conditioner/ styling aids)] that offers [“hair so healthy it shines”] because it [“penetrates from root to tip” through its patented Pro-Vitamin B5 formula].
Microsoft .NET
For [companies whose employees and partners need timely information], Microsoft.NET is a [new protocol and software system] that enables [unprecedented levels of software integration through XML Web services], because [unlike Java, .NET is infused into the Microsoft platform, providing the ability to quickly and reliably build, host, deploy, and utilize connected applications].<br>
For [females 18-49 who possess dry damaged hair and believe they cannot achieve truly healthy/shiny hair] Pantene is a [hair care system (shampoo/conditioner/ styling aids)] that offers [“hair so healthy it shines”] because it [“penetrates from root to tip” through its patented Pro-Vitamin B5 formula].
Microsoft .NET
For [companies whose employees and partners need timely information], Microsoft.NET is a [new protocol and software system] that enables [unprecedented levels of software integration through XML Web services], because [unlike Java, .NET is infused into the Microsoft platform, providing the ability to quickly and reliably build, host, deploy, and utilize connected applications].<br>
06
Key Concepts Mapping: Techniques that enable managers to develop differentiation and positioning strategies by helping them to visualize the competitive structure of their markets as perceived by their customers. The maps are derived from data of customer perceptions of existing products (and new concepts) along various attributes, perceptions of similarities between brands, preferences for the products, or measures of behavioral response of customers toward the products.<br>
07
Crowded Markets Consumers face increasing number of choices
Over 9,000 mutual funds
Over 500 different make-models of cars
Over 30,000 products in a typical grocery store
Over 100,000 prescription drugs
If you can figure out how to stand out in the crowd, you will have a better handle on your future profitability.<br>
Over 9,000 mutual funds
Over 500 different make-models of cars
Over 30,000 products in a typical grocery store
Over 100,000 prescription drugs
If you can figure out how to stand out in the crowd, you will have a better handle on your future profitability.<br>
08
The need for positioning maps<br>
09
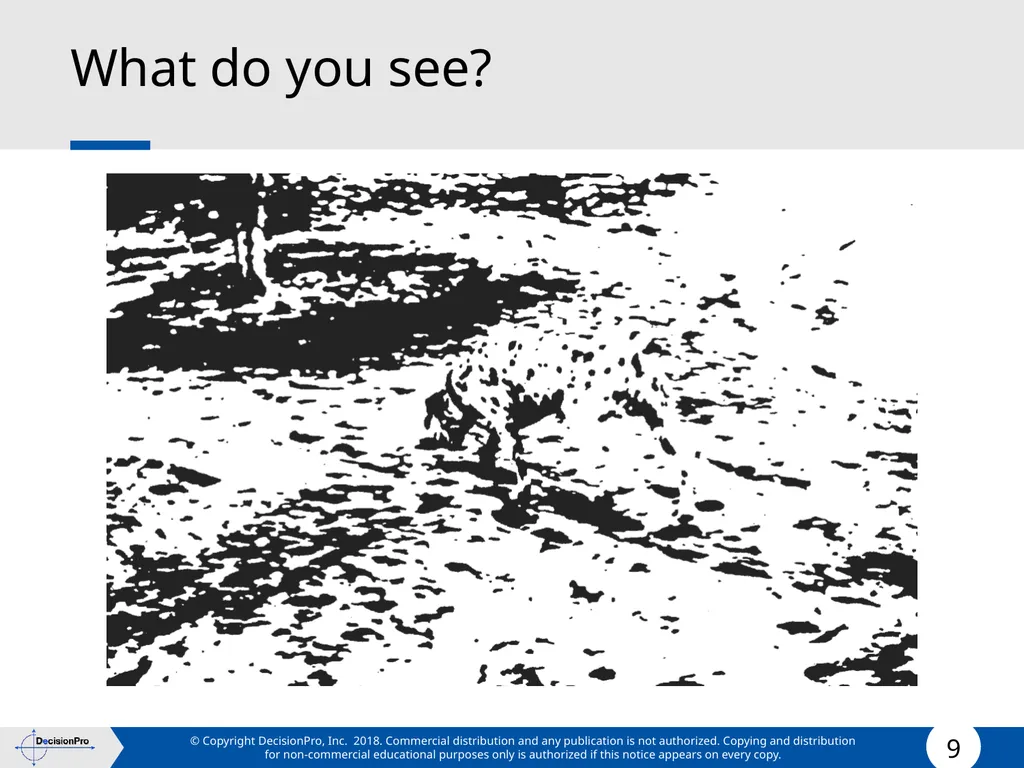
What do you see?<br>
10
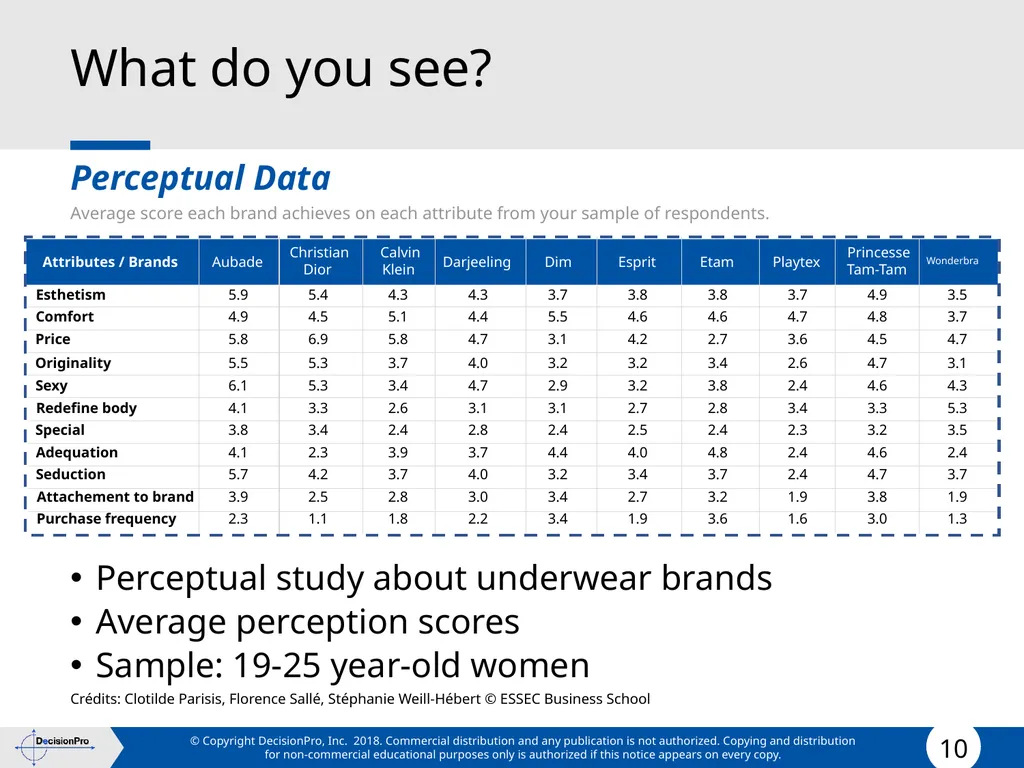
What do you see? Perceptual Data
Average score each brand achieves on each attribute from your sample of respondents.
Perceptual study about underwear brands
Average perception scores
Sample: 19-25 year-old women
Crédits: Clotilde Parisis, Florence Sallé, Stéphanie Weill-Hébert © ESSEC Business School<br>
Average score each brand achieves on each attribute from your sample of respondents.
Perceptual study about underwear brands
Average perception scores
Sample: 19-25 year-old women
Crédits: Clotilde Parisis, Florence Sallé, Stéphanie Weill-Hébert © ESSEC Business School<br>
11
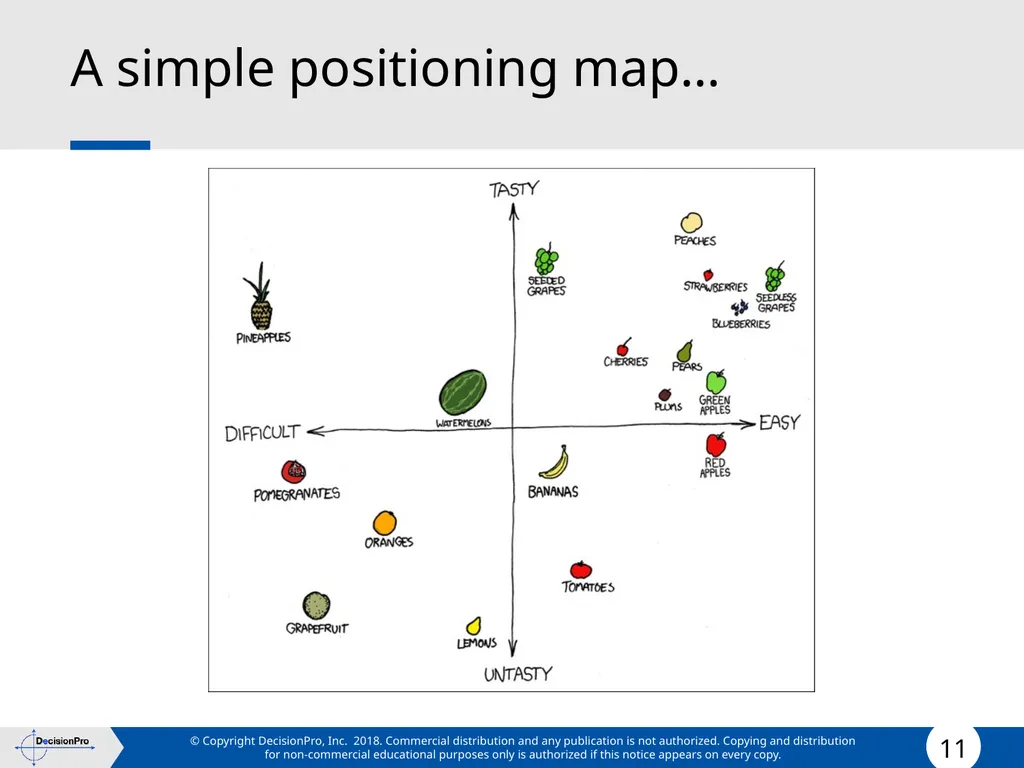
A simple positioning map…<br>
12
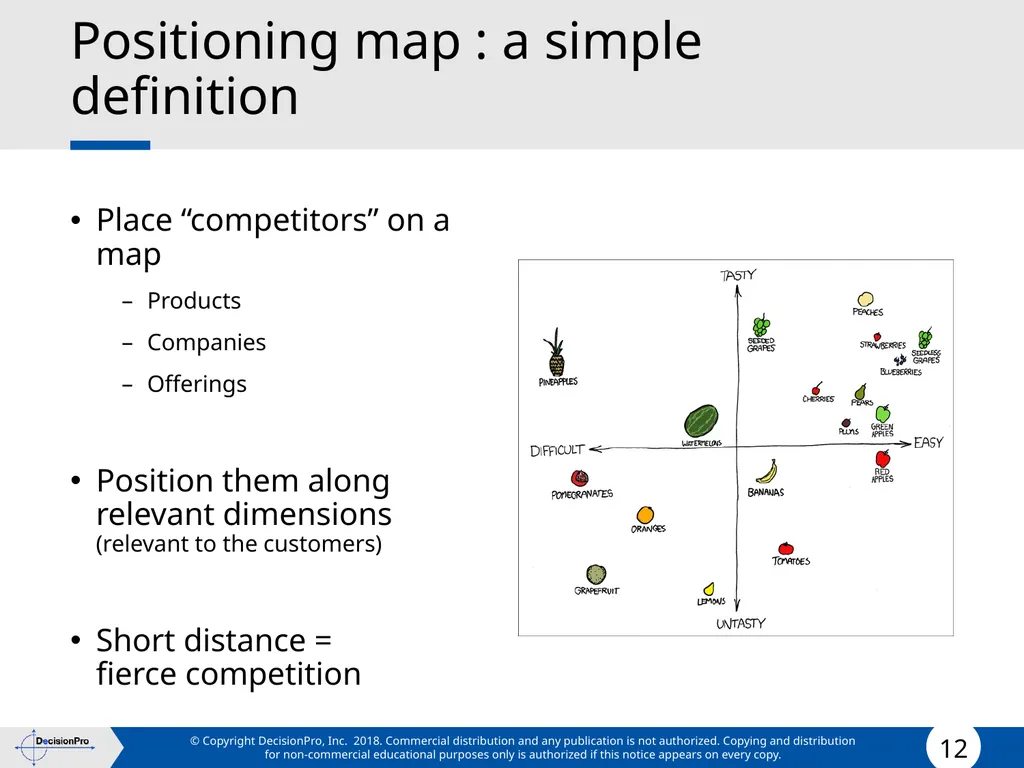
Positioning map : a simple definition Place “competitors” on a map
Products
Companies
Offerings
Position them along relevant dimensions (relevant to the customers)
Short distance = fierce competition<br>
Products
Companies
Offerings
Position them along relevant dimensions (relevant to the customers)
Short distance = fierce competition<br>
13
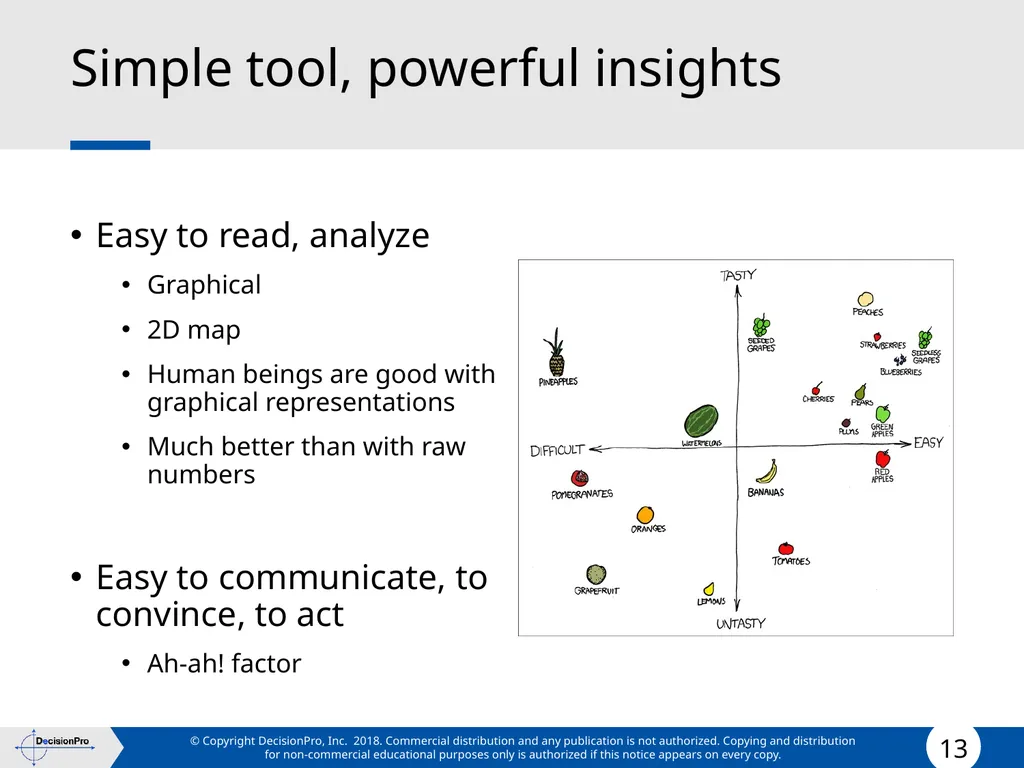
Simple tool, powerful insights Easy to read, analyze
Graphical
2D map
Human beings are good with graphical representations
Much better than with raw numbers
Easy to communicate, to convince, to act
Ah-ah! factor<br>
Graphical
2D map
Human beings are good with graphical representations
Much better than with raw numbers
Easy to communicate, to convince, to act
Ah-ah! factor<br>
14
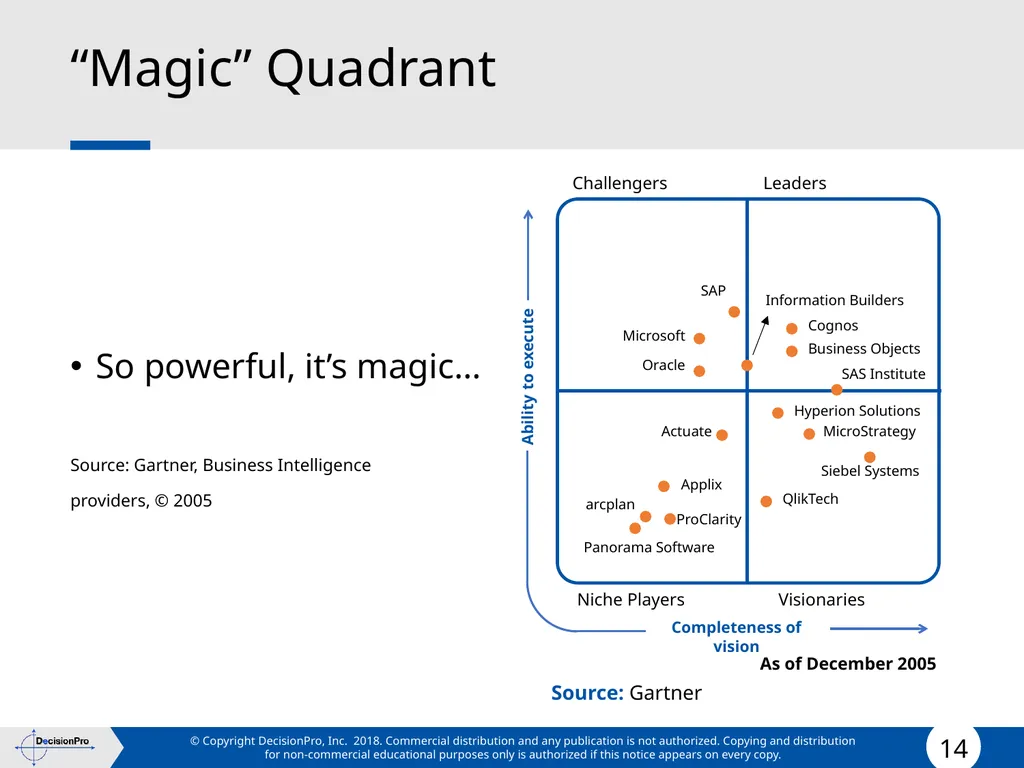
“Magic” Quadrant So powerful, it’s magic…
Source: Gartner, Business Intelligence
providers, © 2005 Challengers Leaders Niche Players Visionaries SAP Microsoft Oracle Information Builders Cognos Business Objects SAS Institute Hyperion Solutions MicroStrategy Siebel Systems QlikTech Actuate Applix arcplan ProClarity Panorama Software Completeness of vision Ability to execute As of December 2005 Source: Gartner<br>
Source: Gartner, Business Intelligence
providers, © 2005 Challengers Leaders Niche Players Visionaries SAP Microsoft Oracle Information Builders Cognos Business Objects SAS Institute Hyperion Solutions MicroStrategy Siebel Systems QlikTech Actuate Applix arcplan ProClarity Panorama Software Completeness of vision Ability to execute As of December 2005 Source: Gartner<br>
15
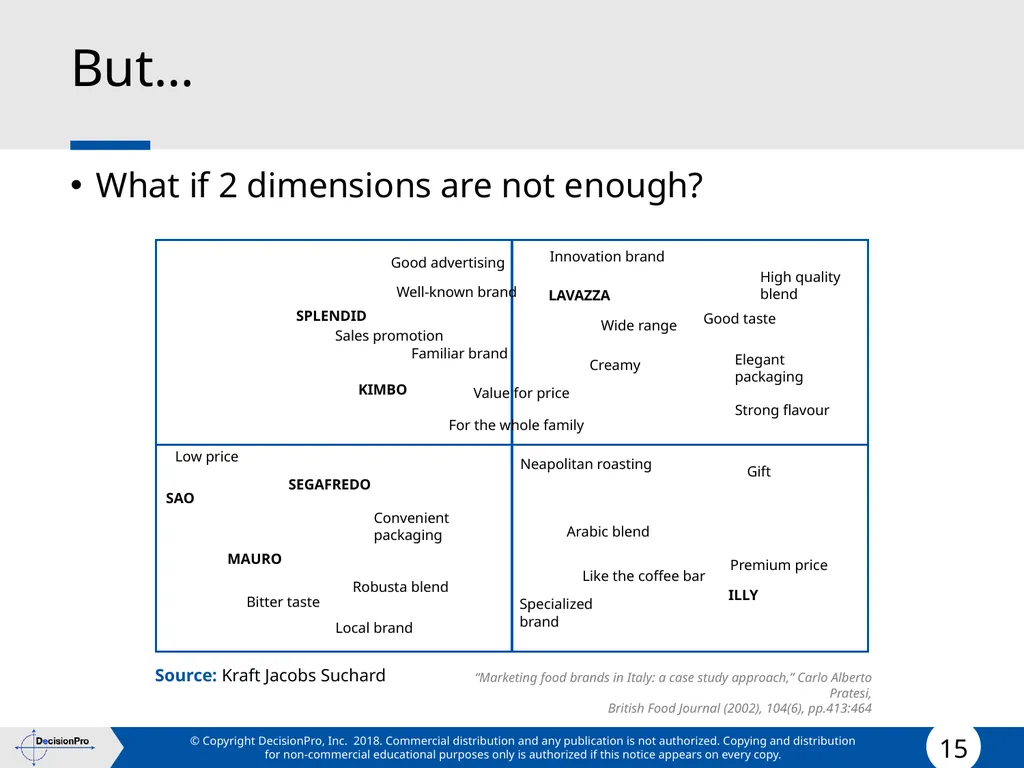
But… What if 2 dimensions are not enough? “Marketing food brands in Italy: a case study approach,” Carlo Alberto Pratesi,
British Food Journal (2002), 104(6), pp.413:464 SEGAFREDO SAO MAURO LAVAZZA ILLY SPLENDID KIMBO Good advertising Well-known brand Sales promotion Familiar brand Value for price For the whole family Innovation brand Wide range Creamy Good taste High quality blend Elegant packaging Strong flavour Neapolitan roasting Gift Arabic blend Premium price Like the coffee bar Specialized brand Low price Convenient packaging Robusta blend Bitter taste Local brand Source: Kraft Jacobs Suchard<br>
16
But… What if 2 dimensions are not enough?
What data to collect? Is it hard to do?
How to link these perceptions to preferences and market shares?<br>
What data to collect? Is it hard to do?
How to link these perceptions to preferences and market shares?<br>
17
Why we should care Understanding customers’ perceptions<br>
18
Quizz: a car manufacturer When I say SAFETY you think…<br>
19
Quizz: a car manufacturer When I say SAFETY you think… “We’ve been saving people in car accidents
for more than 80 years” (Volvo website)<br>
20
Illustration #1
Volvo GM first to perform barrier crash test (1934)
SAAB first to produce cars with a safety cage (1949)
FORD first to build a fleet of cars with airbags (1971)
For the first rollover risk of new cars and SUVs (2004), only the MAZDA RX-8 got a 5-star rating
Yet… VOLVO = SAFETY<br>
SAAB first to produce cars with a safety cage (1949)
FORD first to build a fleet of cars with airbags (1971)
For the first rollover risk of new cars and SUVs (2004), only the MAZDA RX-8 got a 5-star rating
Yet… VOLVO = SAFETY<br>
21
Illustration #2
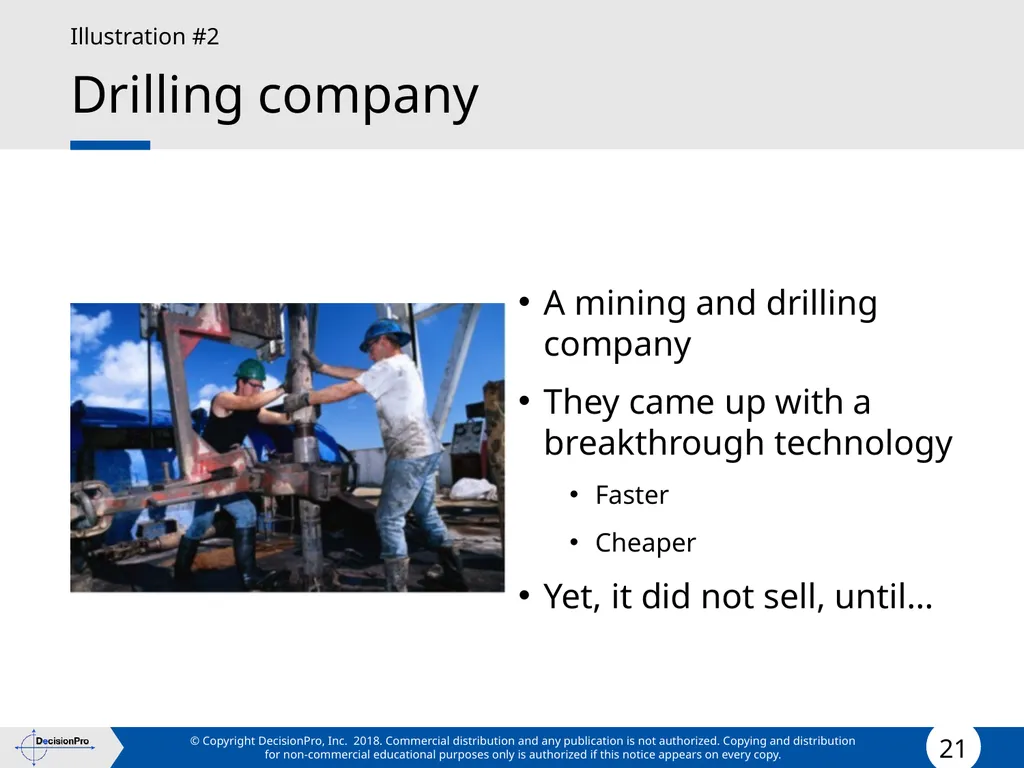
Drilling company A mining and drilling company
They came up with a breakthrough technology
Faster
Cheaper
Yet, it did not sell, until…<br>
They came up with a breakthrough technology
Faster
Cheaper
Yet, it did not sell, until…<br>
22
Illustration #2
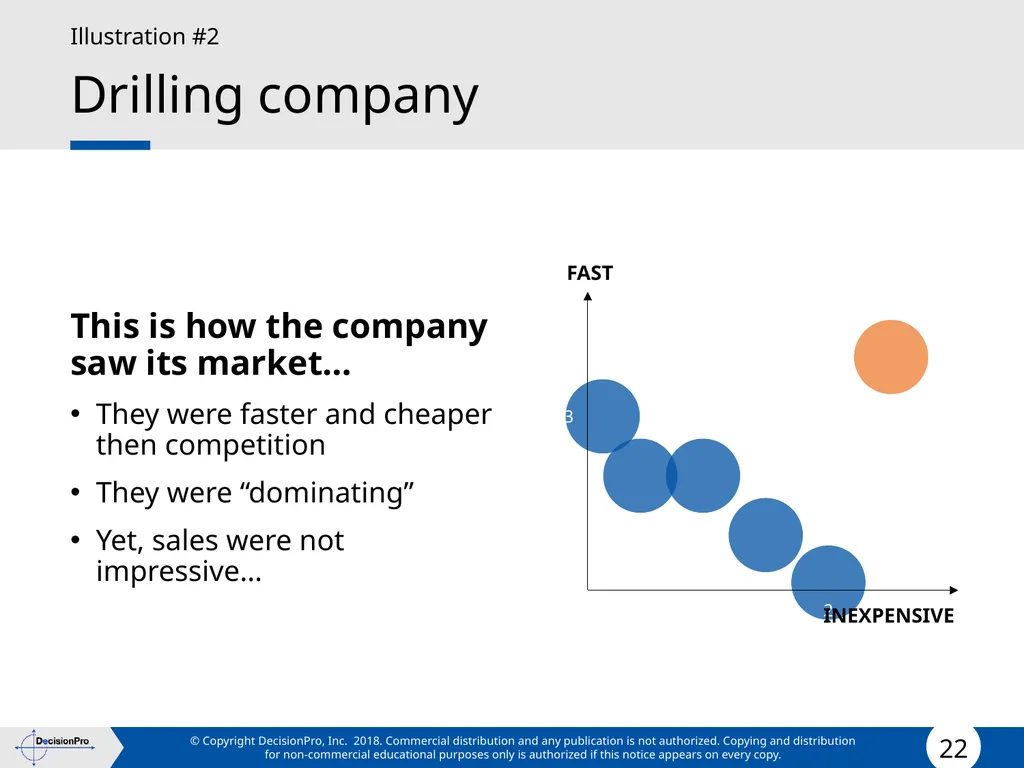
Drilling company This is how the company saw its market…
They were faster and cheaper then competition
They were “dominating”
Yet, sales were not impressive… FAST INEXPENSIVE<br>
They were faster and cheaper then competition
They were “dominating”
Yet, sales were not impressive… FAST INEXPENSIVE<br>
23
Illustration #2
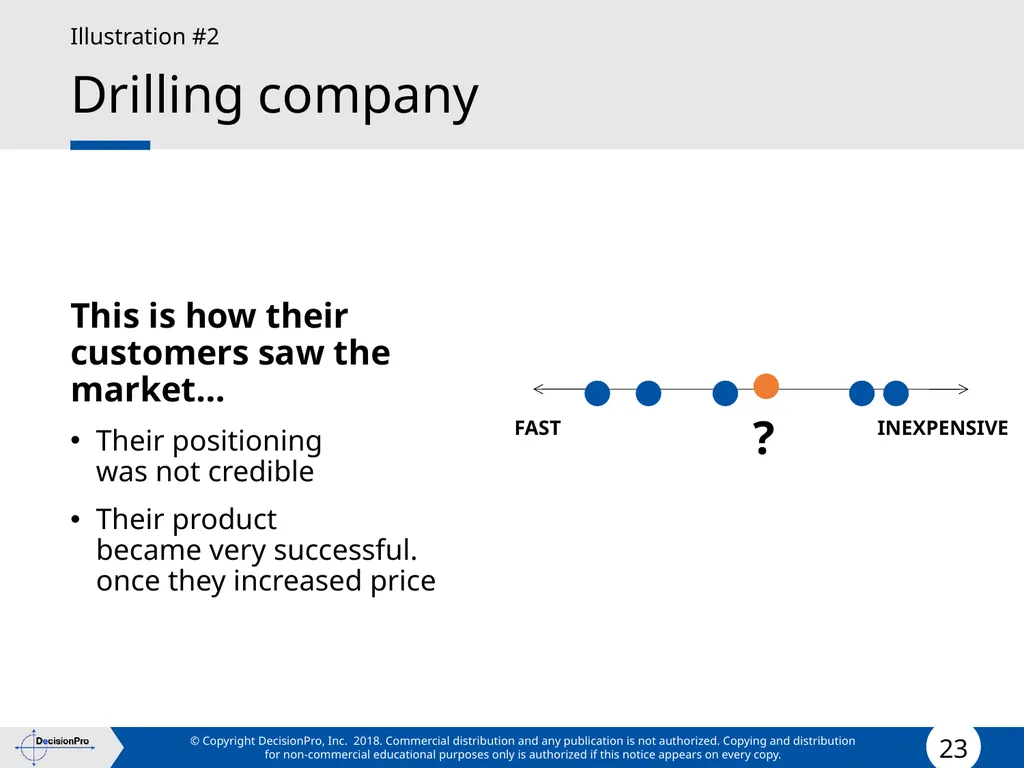
Drilling company This is how their customers saw the market…
Their positioning was not credible
Their product became very successful. once they increased price FAST INEXPENSIVE ?<br>
Their positioning was not credible
Their product became very successful. once they increased price FAST INEXPENSIVE ?<br>
24
Illustration #3
Débitel Débitel = French, low-cost “reseller” or “aggregator”
Cell phone company, with no network
Buys air time from SFR, #1 network in quality
Like Immix Wireless in the USA
Perceptions of “network quality”
SFR = 8.0 / 10
Débitel = 5.9 / 10
Same network
Débitel purchased by SFR, now Simpleo (2008)<br>
Cell phone company, with no network
Buys air time from SFR, #1 network in quality
Like Immix Wireless in the USA
Perceptions of “network quality”
SFR = 8.0 / 10
Débitel = 5.9 / 10
Same network
Débitel purchased by SFR, now Simpleo (2008)<br>
25
Illustration #4
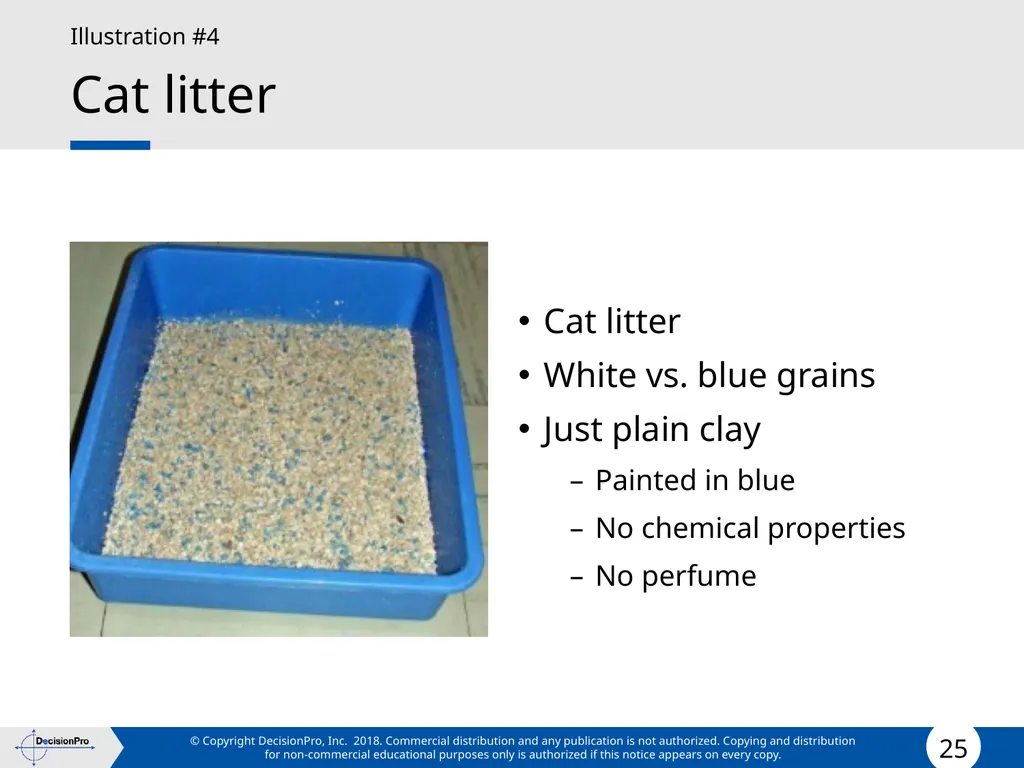
Cat litter Cat litter
White vs. blue grains
Just plain clay
Painted in blue
No chemical properties
No perfume<br>
White vs. blue grains
Just plain clay
Painted in blue
No chemical properties
No perfume<br>
26
We live in an attention economy<br>
27
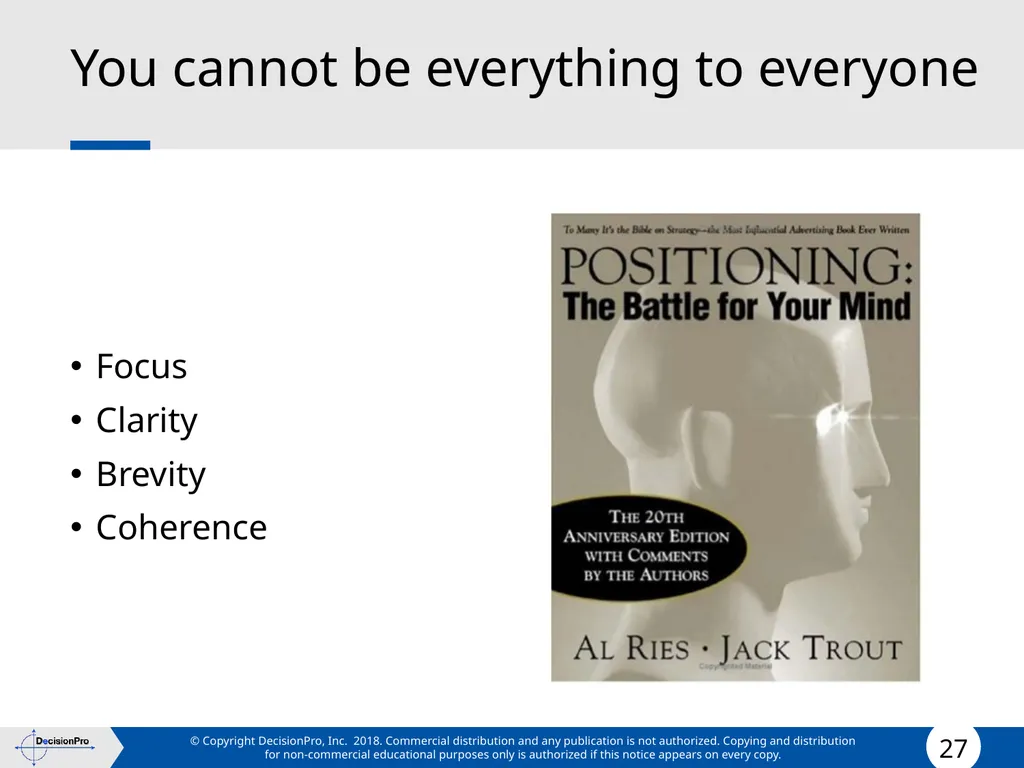
You cannot be everything to everyone Focus
Clarity
Brevity
Coherence<br>
Clarity
Brevity
Coherence<br>
28
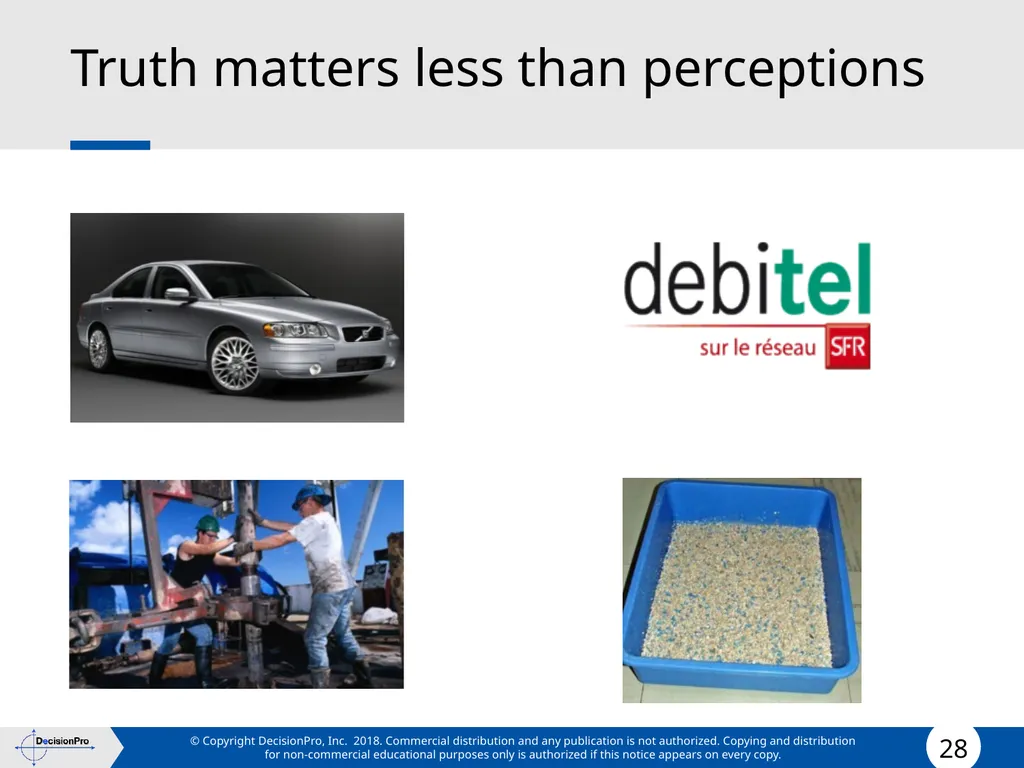
Truth matters less than perceptions<br>
29
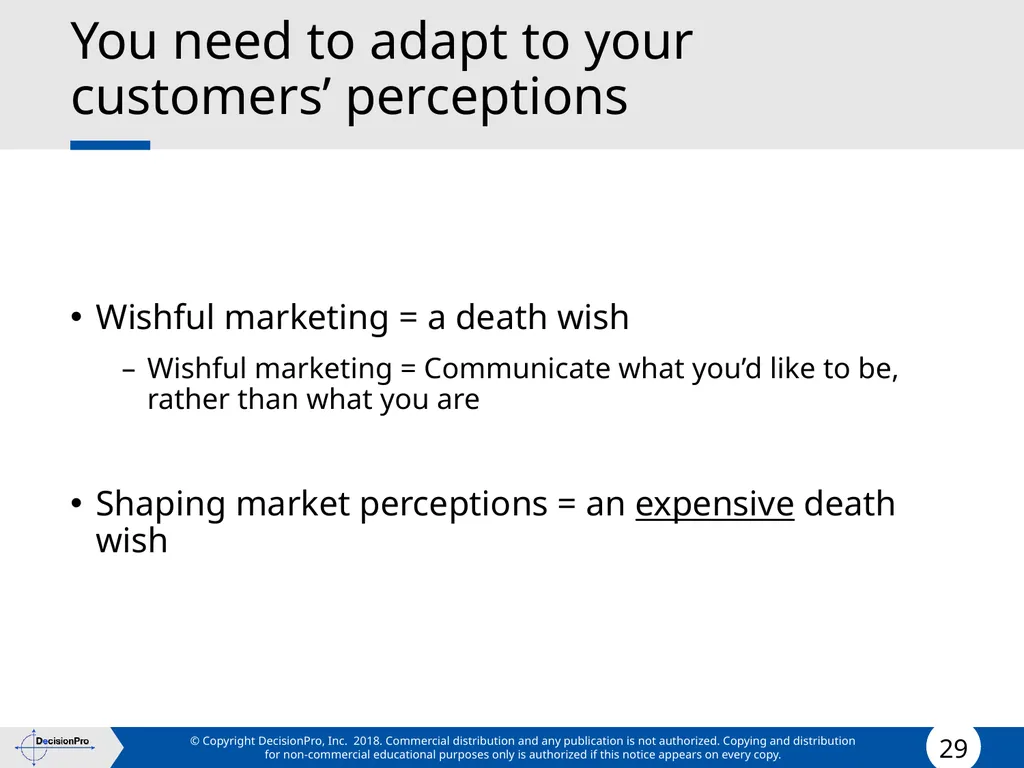
You need to adapt to your customers’ perceptions Wishful marketing = a death wish
Wishful marketing = Communicate what you’d like to be, rather than what you are
Shaping market perceptions = an expensive death wish<br>
Wishful marketing = Communicate what you’d like to be, rather than what you are
Shaping market perceptions = an expensive death wish<br>
30
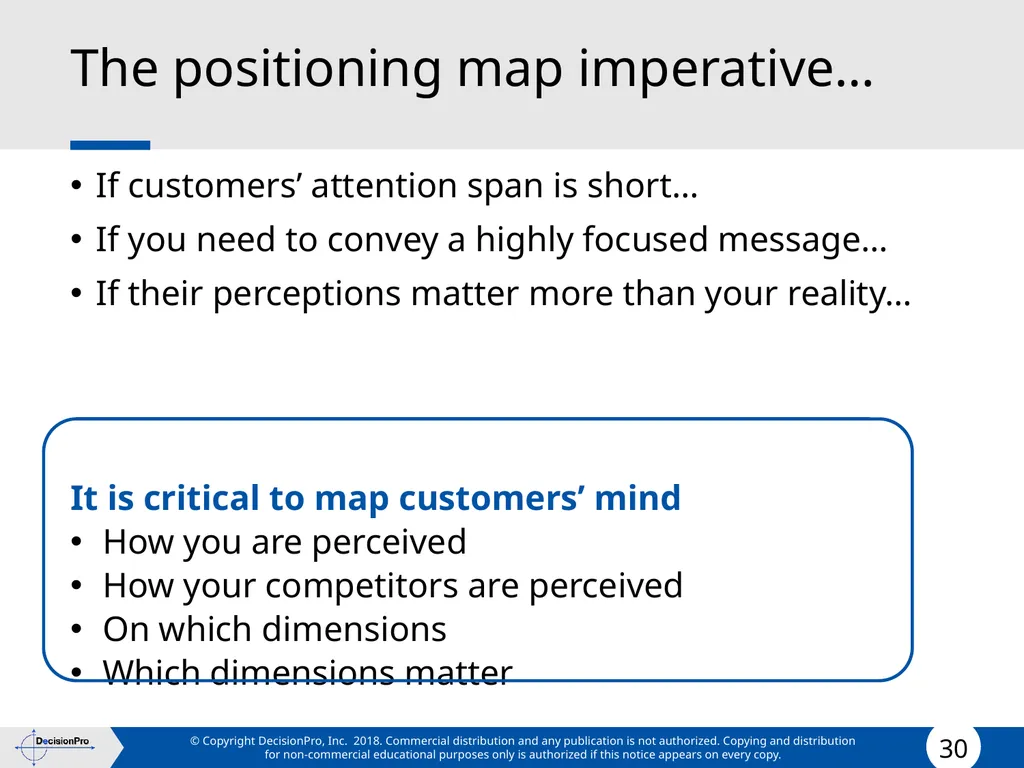
The positioning map imperative… If customers’ attention span is short…
If you need to convey a highly focused message…
If their perceptions matter more than your reality…
It is critical to map customers’ mind
How you are perceived
How your competitors are perceived
On which dimensions
Which dimensions matter<br>
If you need to convey a highly focused message…
If their perceptions matter more than your reality…
It is critical to map customers’ mind
How you are perceived
How your competitors are perceived
On which dimensions
Which dimensions matter<br>
31
Correspondence analysis<br>
32
Correspondence analysis Human brain is not very good at visualizing numbers
Need a method to represent graphically complex patterns
Correspondence Analysis
(a.k.a. Perceptual Mapping, Multi-Dimensional Scaling,
Factor Analysis, Principal Component Analysis)<br>
Need a method to represent graphically complex patterns
Correspondence Analysis
(a.k.a. Perceptual Mapping, Multi-Dimensional Scaling,
Factor Analysis, Principal Component Analysis)<br>
33
Correspondence analysis Correspondence analysis allows for the reduction of an important number of variables (product attributes, perceptions) into sub-sets of key dimensions (linear combination of the original variables) by analyzing their correlations<br>
34
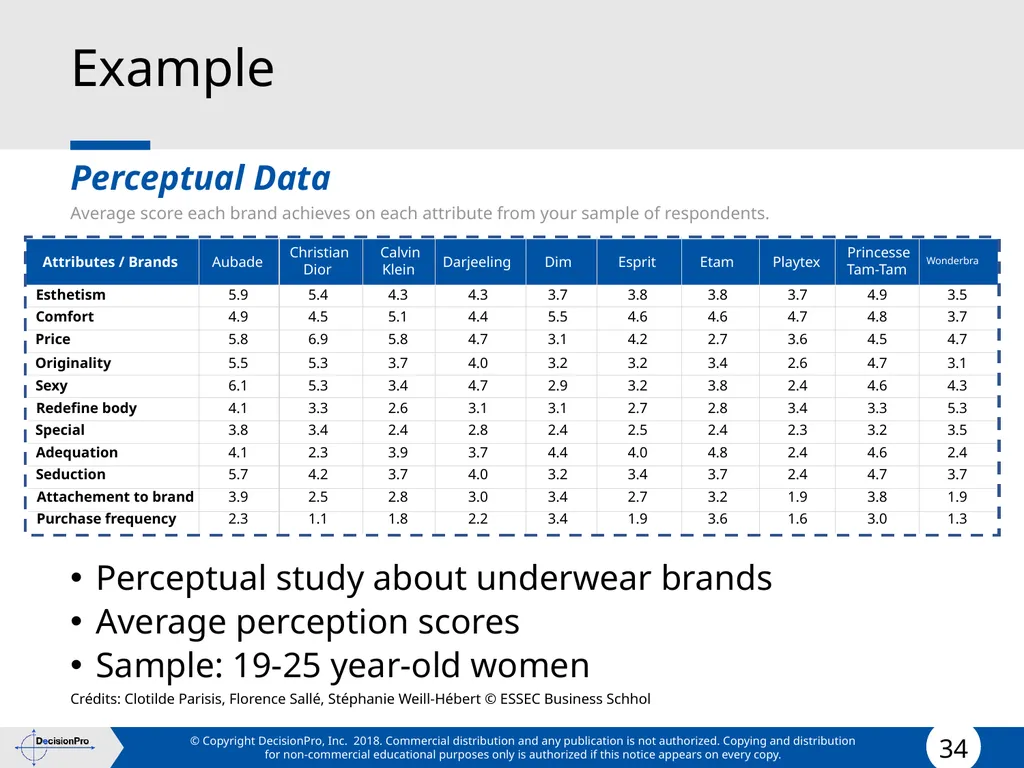
Example Perceptual Data
Average score each brand achieves on each attribute from your sample of respondents.
Perceptual study about underwear brands
Average perception scores
Sample: 19-25 year-old women
Crédits: Clotilde Parisis, Florence Sallé, Stéphanie Weill-Hébert © ESSEC Business Schhol<br>
Average score each brand achieves on each attribute from your sample of respondents.
Perceptual study about underwear brands
Average perception scores
Sample: 19-25 year-old women
Crédits: Clotilde Parisis, Florence Sallé, Stéphanie Weill-Hébert © ESSEC Business Schhol<br>
35
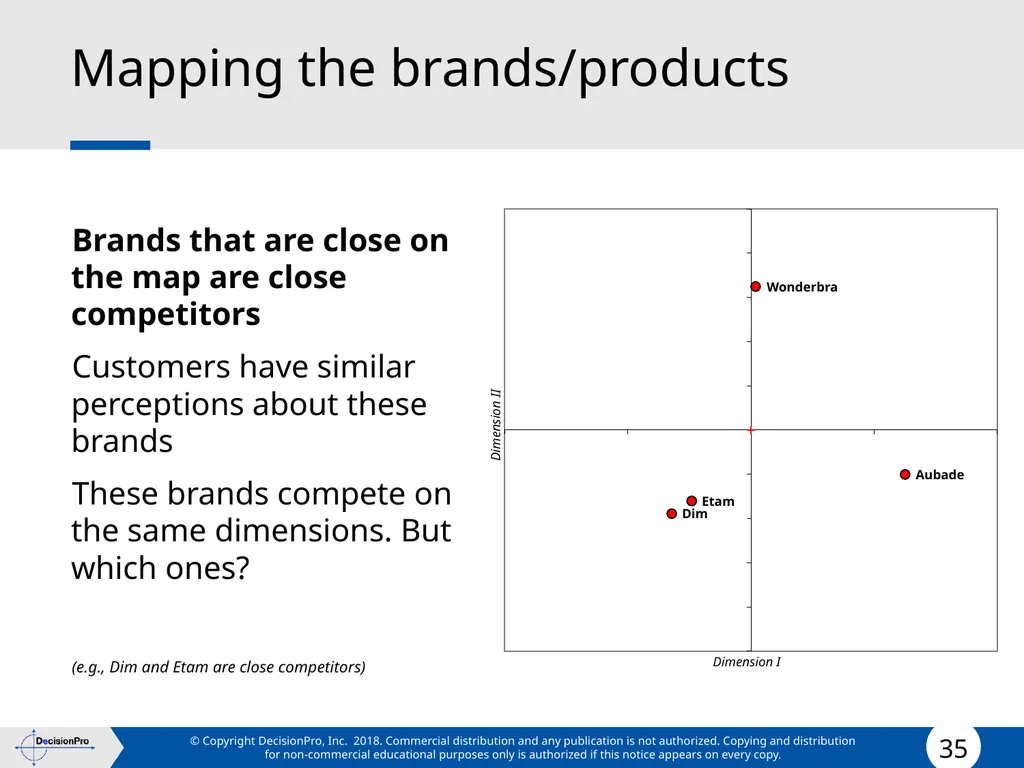
Mapping the brands/products Brands that are close on the map are close competitors
Customers have similar perceptions about these brands
These brands compete on the same dimensions. But which ones?
(e.g., Dim and Etam are close competitors) Aubade Dim Etam Wonderbra Dimension I Dimension II<br>
Customers have similar perceptions about these brands
These brands compete on the same dimensions. But which ones?
(e.g., Dim and Etam are close competitors) Aubade Dim Etam Wonderbra Dimension I Dimension II<br>
36
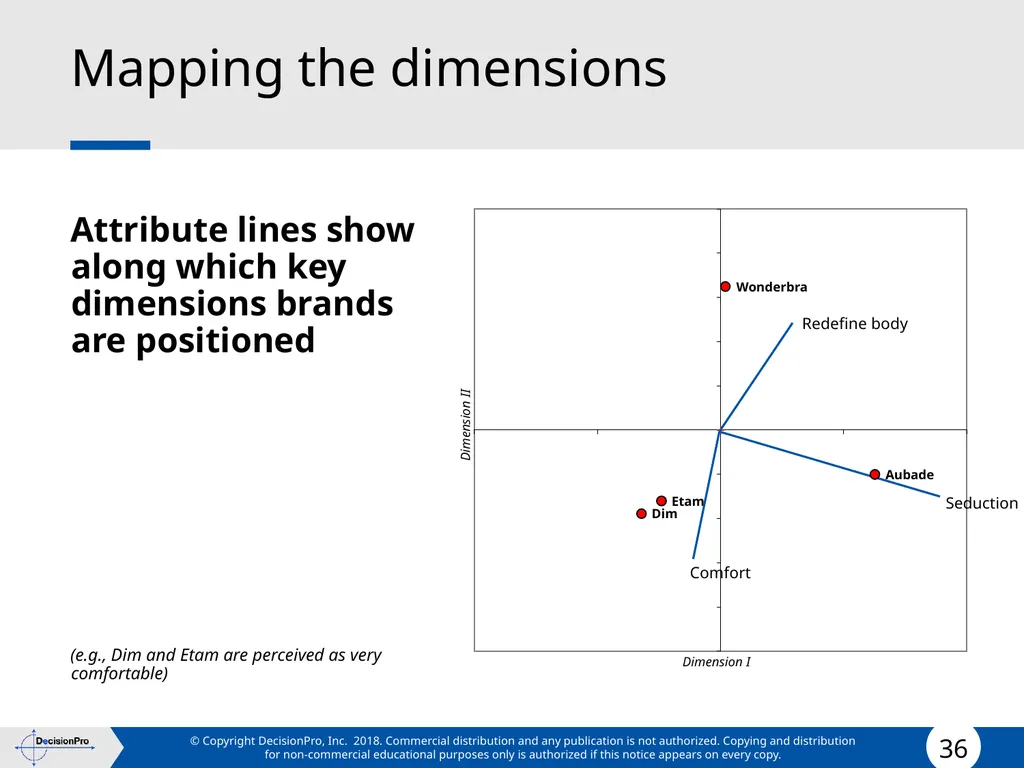
Mapping the dimensions Attribute lines show along which key dimensions brands are positioned
(e.g., Dim and Etam are perceived as very comfortable) Aubade Dim Etam Wonderbra Dimension I Dimension II Comfort Redefine body Seduction<br>
(e.g., Dim and Etam are perceived as very comfortable) Aubade Dim Etam Wonderbra Dimension I Dimension II Comfort Redefine body Seduction<br>
37
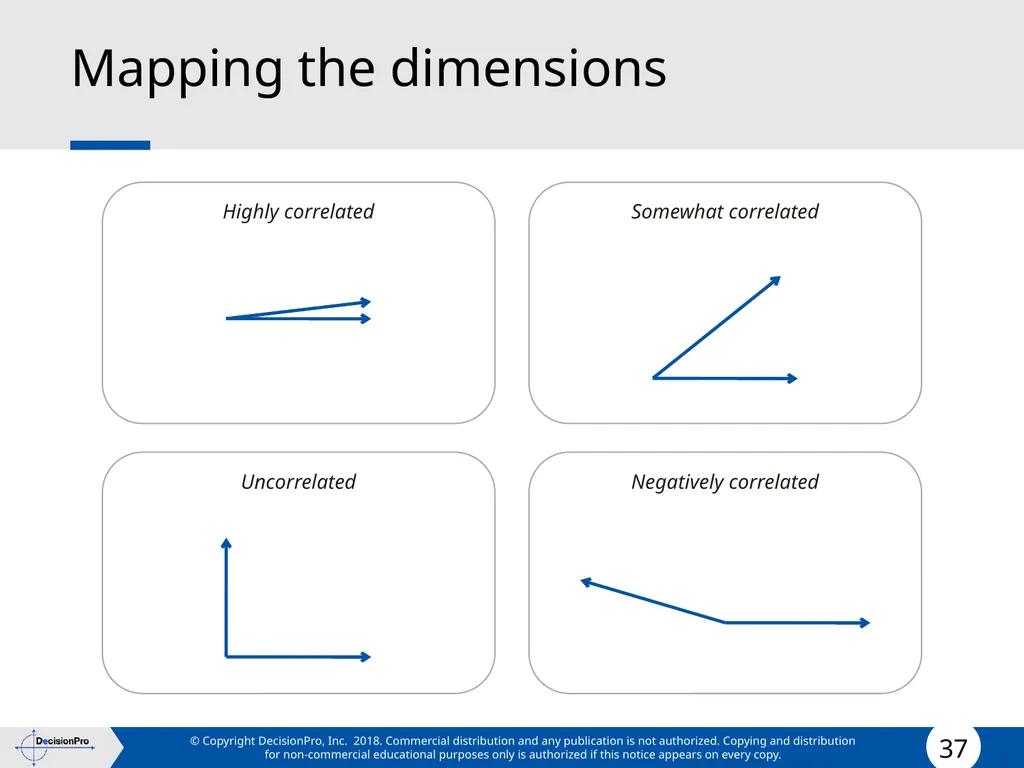
Mapping the dimensions Highly correlated Uncorrelated Negatively correlated Somewhat correlated<br>
38
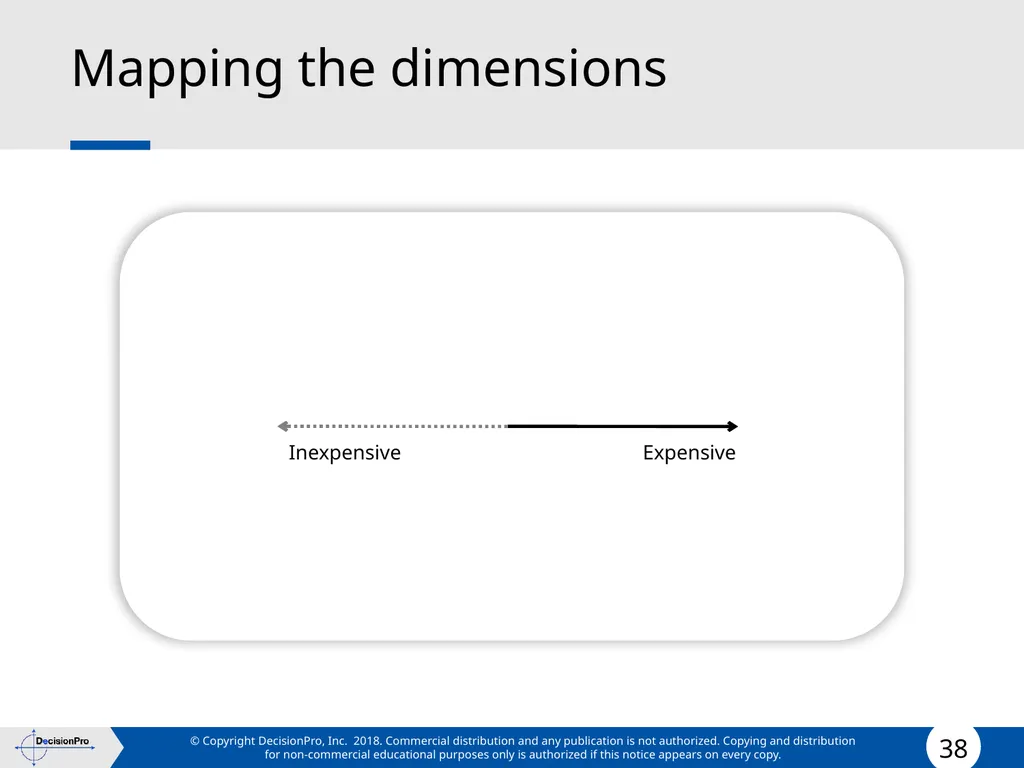
Mapping the dimensions<br>
39
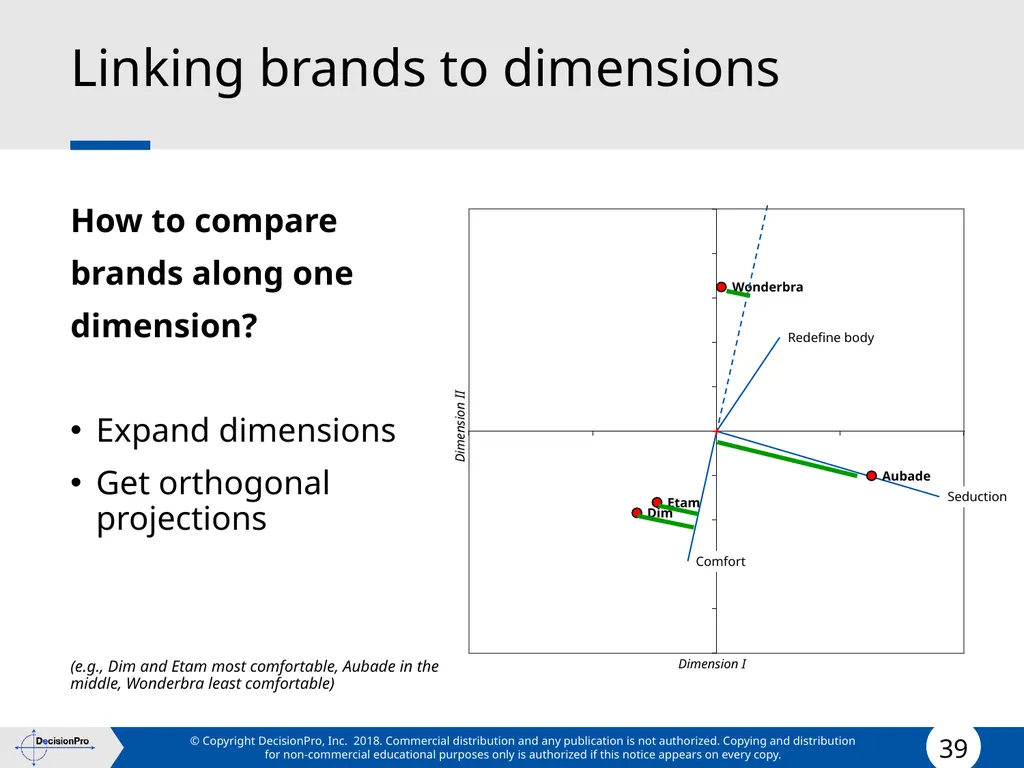
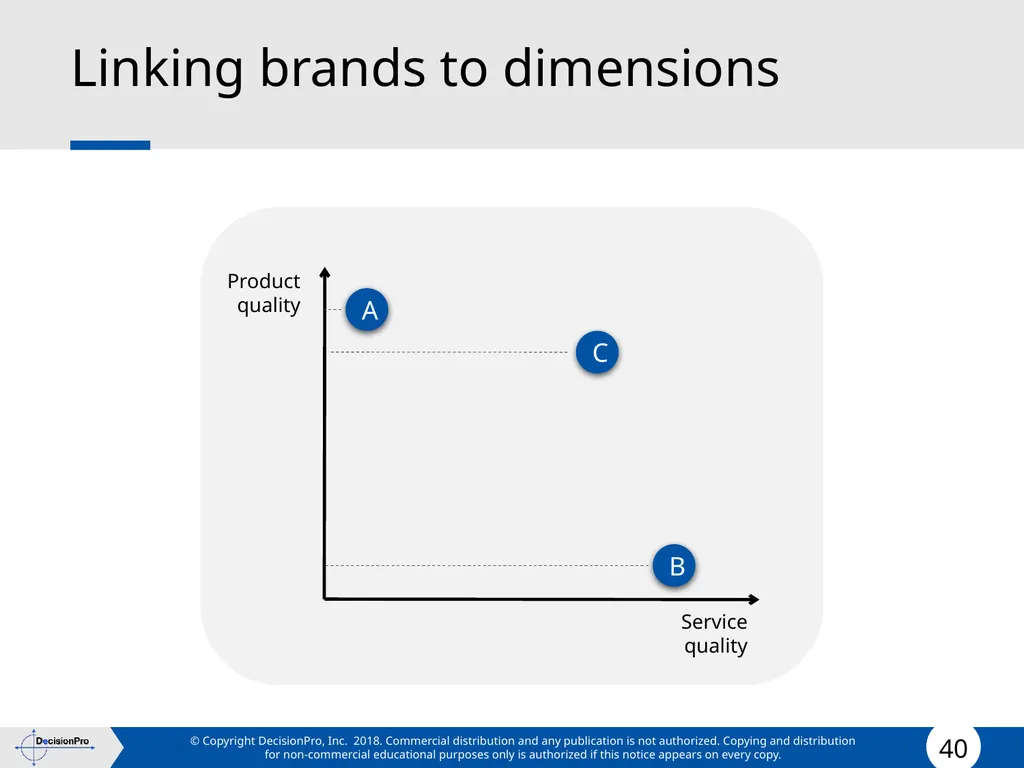
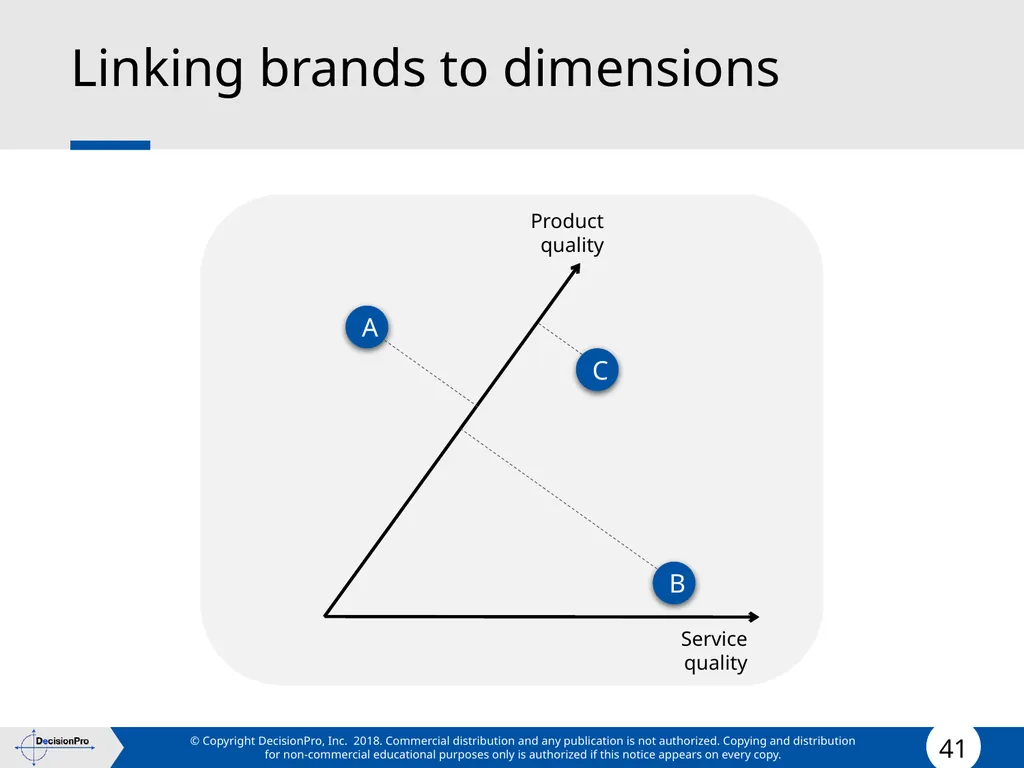
Linking brands to dimensions How to compare
brands along one
dimension?
Expand dimensions
Get orthogonal projections
(e.g., Dim and Etam most comfortable, Aubade in the middle, Wonderbra least comfortable) Aubade Dim Etam Wonderbra Comfort Redefine body Seduction Dimension I Dimension II<br>
brands along one
dimension?
Expand dimensions
Get orthogonal projections
(e.g., Dim and Etam most comfortable, Aubade in the middle, Wonderbra least comfortable) Aubade Dim Etam Wonderbra Comfort Redefine body Seduction Dimension I Dimension II<br>
40
Linking brands to dimensions Service
quality Product
quality A B C<br>
quality Product
quality A B C<br>
41
Linking brands to dimensions Service
quality Product
quality A C B<br>
quality Product
quality A C B<br>
42
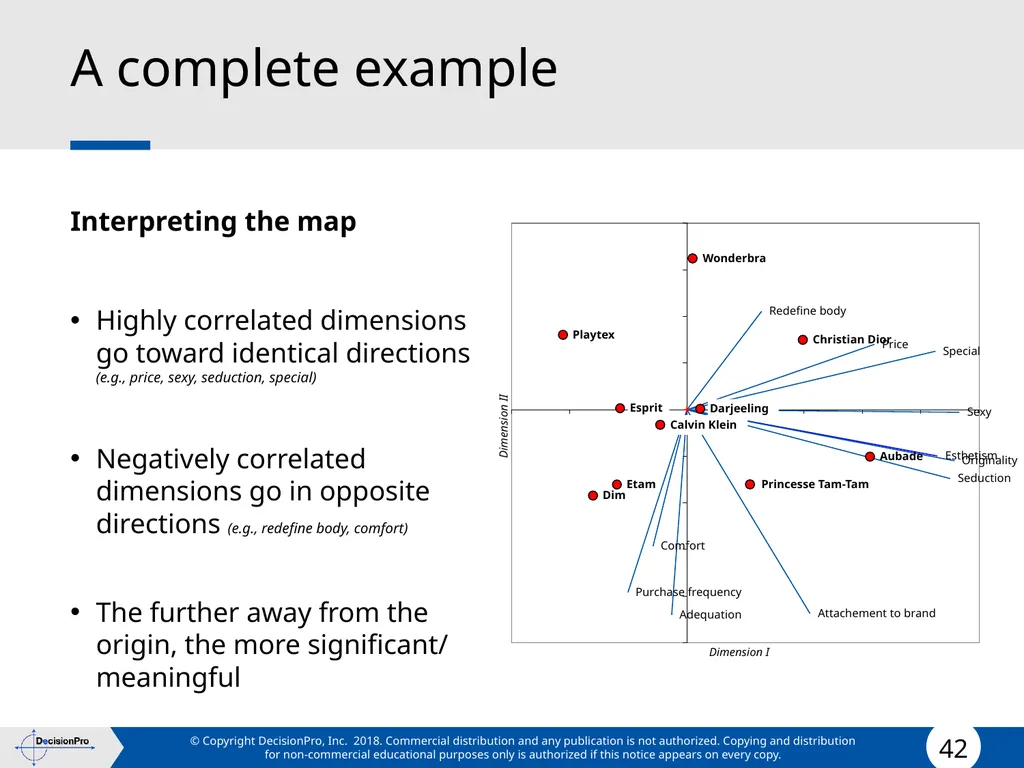
A complete example Interpreting the map
Highly correlated dimensions go toward identical directions (e.g., price, sexy, seduction, special)
Negatively correlated dimensions go in opposite directions (e.g., redefine body, comfort)
The further away from the origin, the more significant/ meaningful Aubade Christian Dior Calvin Klein Darjeeling Dim Esprit Etam Playtex Princesse Tam-Tam Wonderbra Esthetism Comfort Price Originality Sexy Redefine body Special Adequation Seduction Attachement to brand Purchase frequency Dimension I Dimension II<br>
Highly correlated dimensions go toward identical directions (e.g., price, sexy, seduction, special)
Negatively correlated dimensions go in opposite directions (e.g., redefine body, comfort)
The further away from the origin, the more significant/ meaningful Aubade Christian Dior Calvin Klein Darjeeling Dim Esprit Etam Playtex Princesse Tam-Tam Wonderbra Esthetism Comfort Price Originality Sexy Redefine body Special Adequation Seduction Attachement to brand Purchase frequency Dimension I Dimension II<br>
43
Mapping preferences Some dimensions are correlated with customers’ preferences, choices, and ultimately market shares. Some are not.
Example:
Wonderbra is well positioned on the « Redefine Body » dimension, but we have no guarantee that this characteristic is desired by the target population
We need to link perceptions to preferences<br>
Example:
Wonderbra is well positioned on the « Redefine Body » dimension, but we have no guarantee that this characteristic is desired by the target population
We need to link perceptions to preferences<br>
44
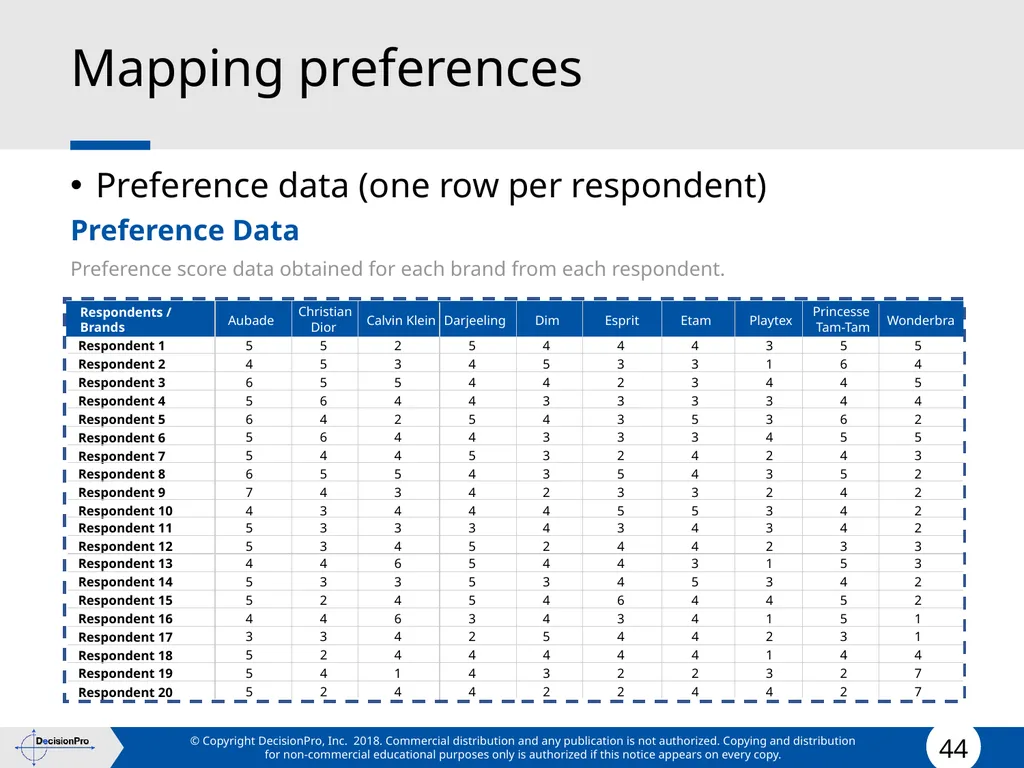
Mapping preferences Preference data (one row per respondent)
Preference Data
Preference score data obtained for each brand from each respondent.<br>
Preference Data
Preference score data obtained for each brand from each respondent.<br>
45
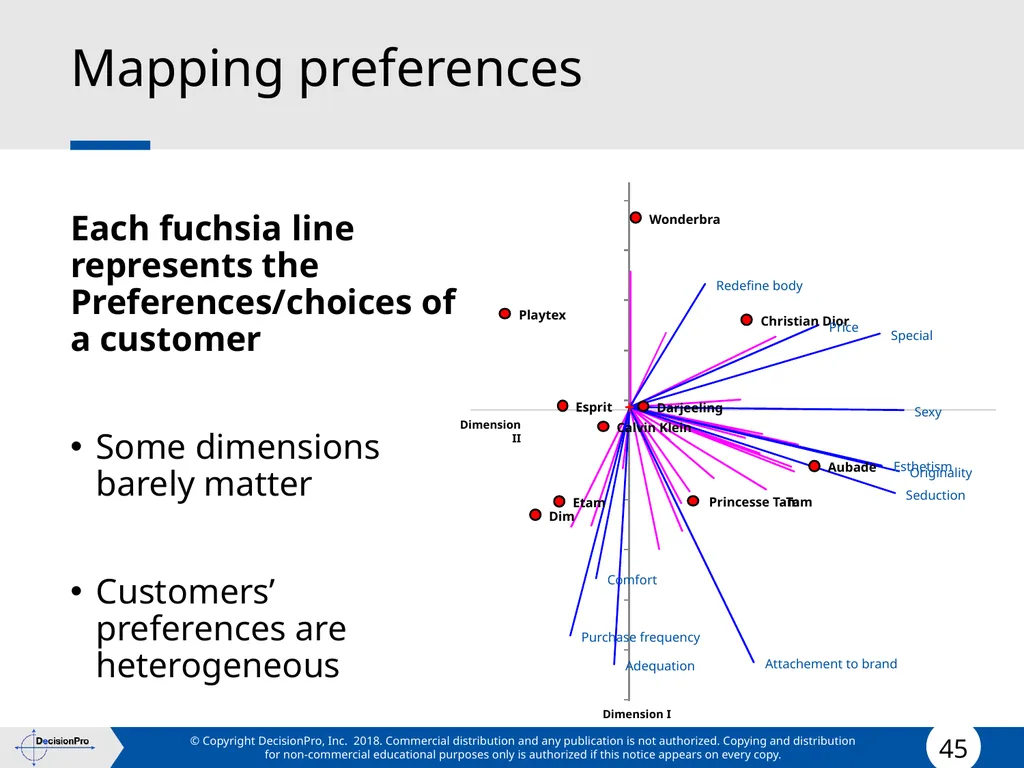
Mapping preferences Each fuchsia line represents the Preferences/choices of a customer
Some dimensions barely matter
Customers’ preferences are heterogeneous<br>
Some dimensions barely matter
Customers’ preferences are heterogeneous<br>
46
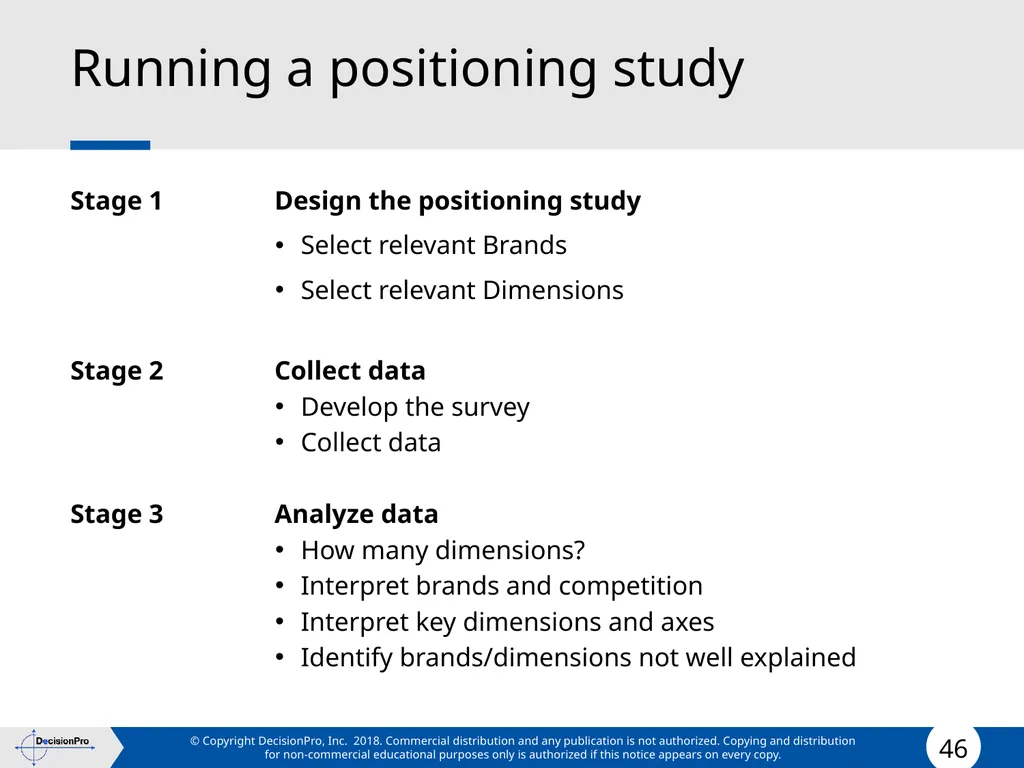
Running a positioning study Stage 1 Design the positioning study
Select relevant Brands
Select relevant Dimensions
Stage 2 Collect data
Develop the survey
Collect data
Stage 3 Analyze data
How many dimensions?
Interpret brands and competition
Interpret key dimensions and axes
Identify brands/dimensions not well explained<br>
Select relevant Brands
Select relevant Dimensions
Stage 2 Collect data
Develop the survey
Collect data
Stage 3 Analyze data
How many dimensions?
Interpret brands and competition
Interpret key dimensions and axes
Identify brands/dimensions not well explained<br>
47
Stage 1
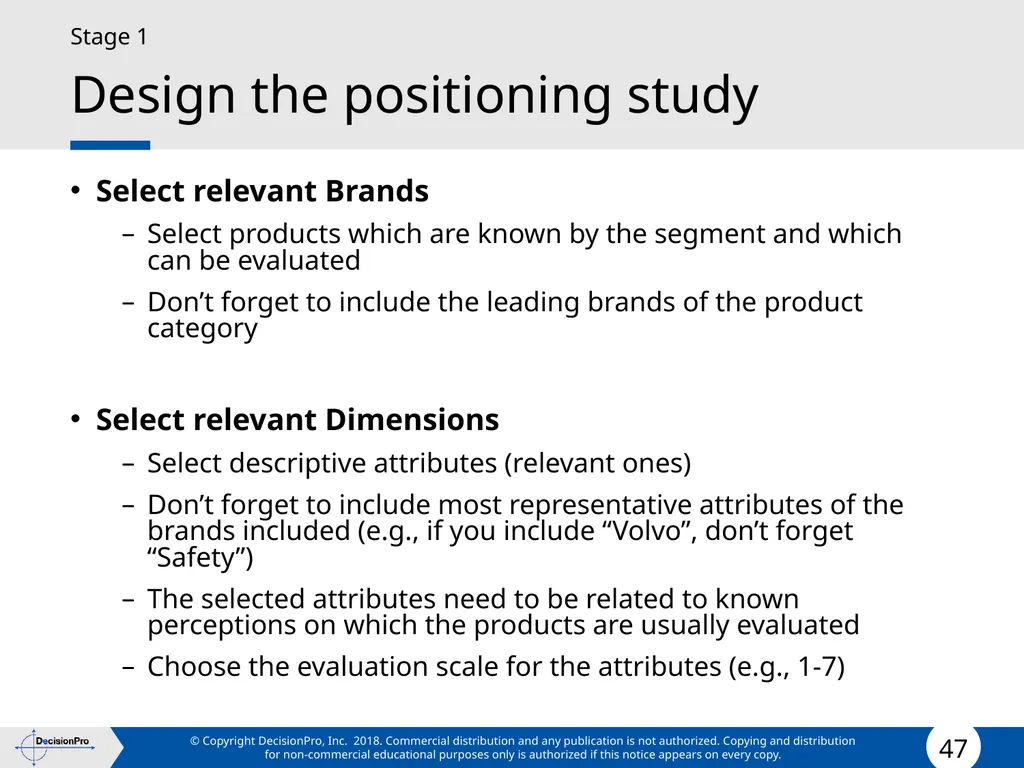
Design the positioning study Select relevant Brands
Select products which are known by the segment and which can be evaluated
Don’t forget to include the leading brands of the product category
Select relevant Dimensions
Select descriptive attributes (relevant ones)
Don’t forget to include most representative attributes of the brands included (e.g., if you include “Volvo”, don’t forget “Safety”)
The selected attributes need to be related to known perceptions on which the products are usually evaluated
Choose the evaluation scale for the attributes (e.g., 1-7)<br>
Select products which are known by the segment and which can be evaluated
Don’t forget to include the leading brands of the product category
Select relevant Dimensions
Select descriptive attributes (relevant ones)
Don’t forget to include most representative attributes of the brands included (e.g., if you include “Volvo”, don’t forget “Safety”)
The selected attributes need to be related to known perceptions on which the products are usually evaluated
Choose the evaluation scale for the attributes (e.g., 1-7)<br>
48
Stage 2
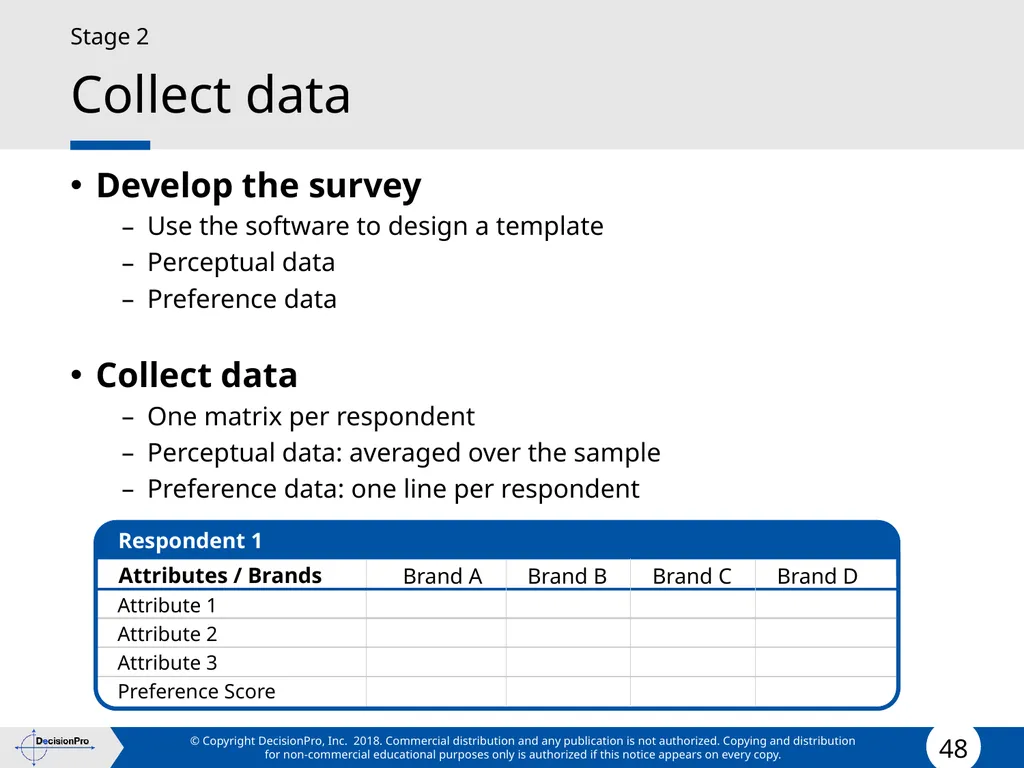
Collect data Develop the survey
Use the software to design a template
Perceptual data
Preference data
Collect data
One matrix per respondent
Perceptual data: averaged over the sample
Preference data: one line per respondent<br>
Use the software to design a template
Perceptual data
Preference data
Collect data
One matrix per respondent
Perceptual data: averaged over the sample
Preference data: one line per respondent<br>
49
Stage 3
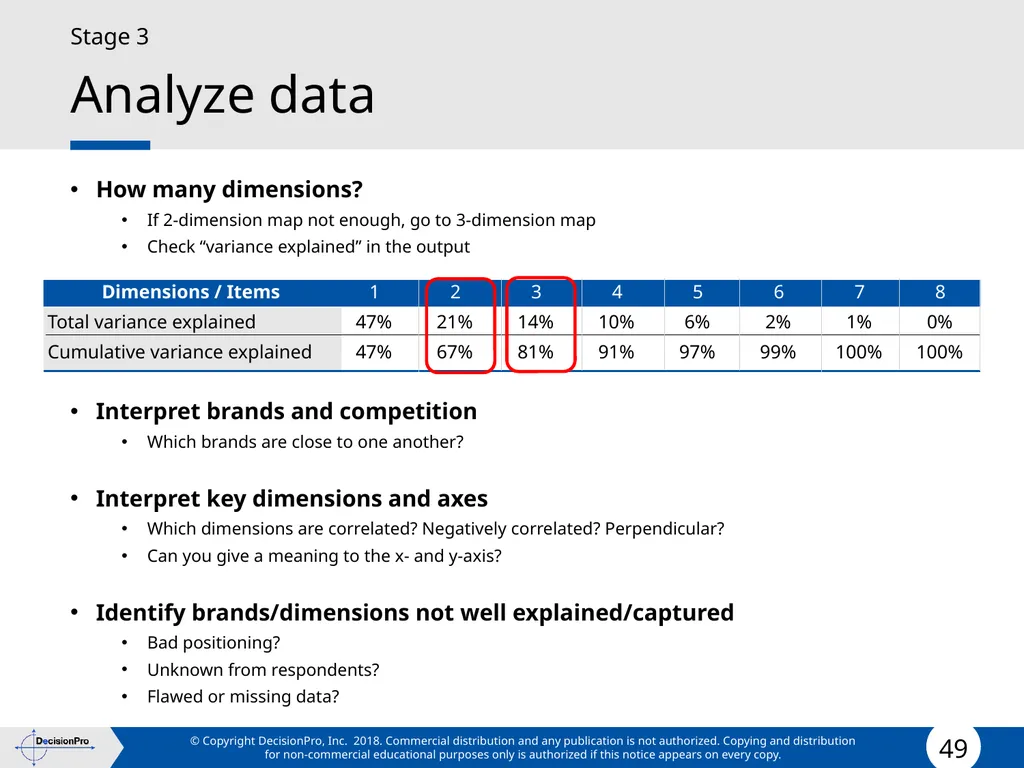
Analyze data How many dimensions?
If 2-dimension map not enough, go to 3-dimension map
Check “variance explained” in the output
Interpret brands and competition
Which brands are close to one another?
Interpret key dimensions and axes
Which dimensions are correlated? Negatively correlated? Perpendicular?
Can you give a meaning to the x- and y-axis?
Identify brands/dimensions not well explained/captured
Bad positioning?
Unknown from respondents?
Flawed or missing data?<br>
If 2-dimension map not enough, go to 3-dimension map
Check “variance explained” in the output
Interpret brands and competition
Which brands are close to one another?
Interpret key dimensions and axes
Which dimensions are correlated? Negatively correlated? Perpendicular?
Can you give a meaning to the x- and y-axis?
Identify brands/dimensions not well explained/captured
Bad positioning?
Unknown from respondents?
Flawed or missing data?<br>
50
Uses of Mapping Check how customer perceptions of client products compare to perceptions of competitors.
Identify product strengths and weaknesses.
Select competitors to compete against.
Determine how much change is needed on key product attributes to move products to more favorable positions.
Visually determine impact of communications programs on market perceptions.<br>
Identify product strengths and weaknesses.
Select competitors to compete against.
Determine how much change is needed on key product attributes to move products to more favorable positions.
Visually determine impact of communications programs on market perceptions.<br>
51
Implementing Positioning Leverage strategically advantaged resources:
Product characteristics
features, performance, durability, conformance, reliability, style, etc.
Service attributes
delivery, installation, consultation, customer training, repair, etc.
Personnel
competency, credibility, courtesy, responsiveness, etc.
Brand image
symbols, emotion, personality, etc.<br>
Product characteristics
features, performance, durability, conformance, reliability, style, etc.
Service attributes
delivery, installation, consultation, customer training, repair, etc.
Personnel
competency, credibility, courtesy, responsiveness, etc.
Brand image
symbols, emotion, personality, etc.<br>
52
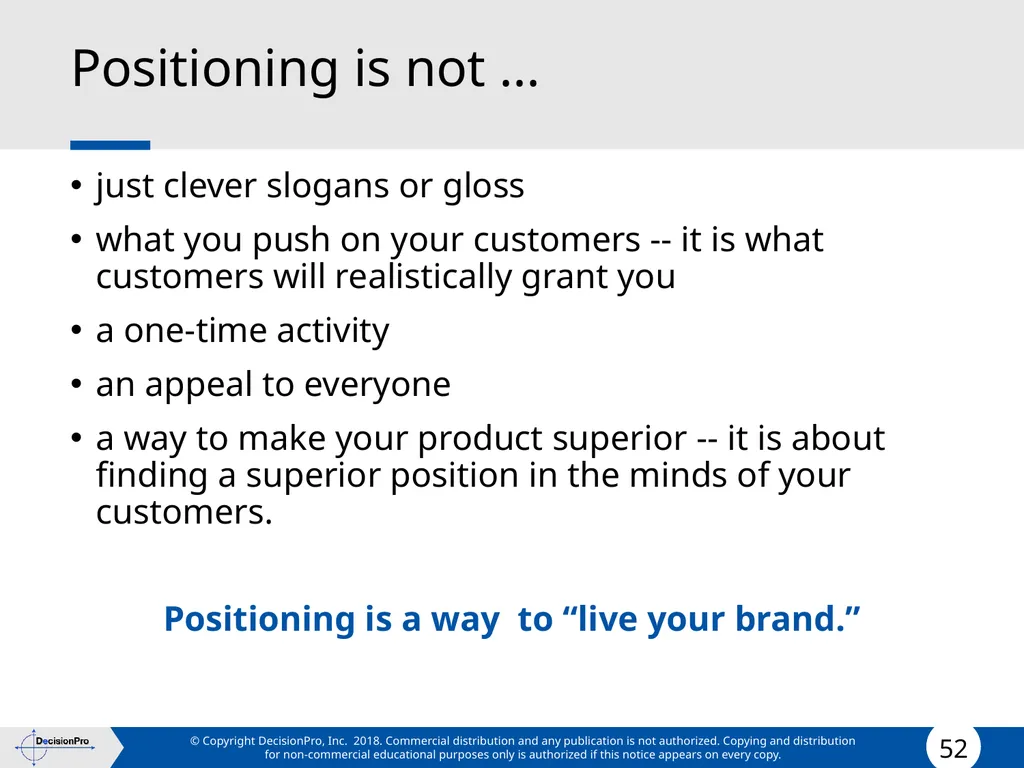
Positioning is not ... just clever slogans or gloss
what you push on your customers -- it is what customers will realistically grant you
a one-time activity
an appeal to everyone
a way to make your product superior -- it is about finding a superior position in the minds of your customers.
Positioning is a way to “live your brand.”<br>
what you push on your customers -- it is what customers will realistically grant you
a one-time activity
an appeal to everyone
a way to make your product superior -- it is about finding a superior position in the minds of your customers.
Positioning is a way to “live your brand.”<br>
53
OTHER SLIDES<br>
54
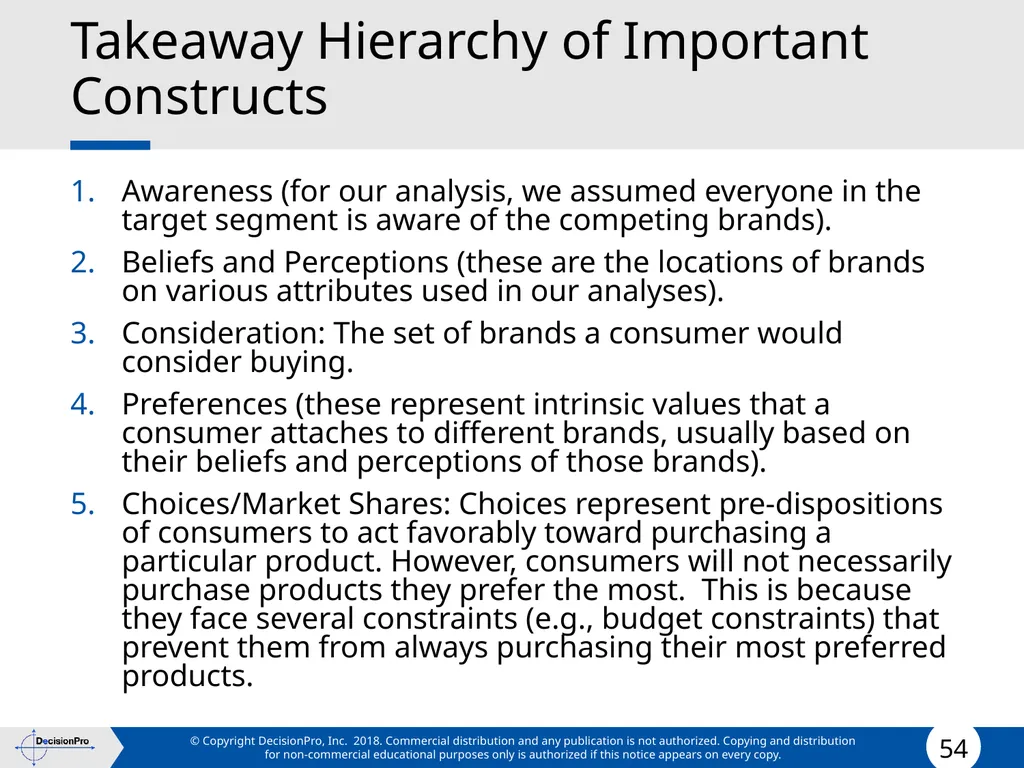
Takeaway Hierarchy of Important Constructs Awareness (for our analysis, we assumed everyone in the target segment is aware of the competing brands).
Beliefs and Perceptions (these are the locations of brands on various attributes used in our analyses).
Consideration: The set of brands a consumer would consider buying.
Preferences (these represent intrinsic values that a consumer attaches to different brands, usually based on their beliefs and perceptions of those brands).
Choices/Market Shares: Choices represent pre-dispositions of consumers to act favorably toward purchasing a particular product. However, consumers will not necessarily purchase products they prefer the most. This is because they face several constraints (e.g., budget constraints) that prevent them from always purchasing their most preferred products.<br>
Beliefs and Perceptions (these are the locations of brands on various attributes used in our analyses).
Consideration: The set of brands a consumer would consider buying.
Preferences (these represent intrinsic values that a consumer attaches to different brands, usually based on their beliefs and perceptions of those brands).
Choices/Market Shares: Choices represent pre-dispositions of consumers to act favorably toward purchasing a particular product. However, consumers will not necessarily purchase products they prefer the most. This is because they face several constraints (e.g., budget constraints) that prevent them from always purchasing their most preferred products.<br>
55
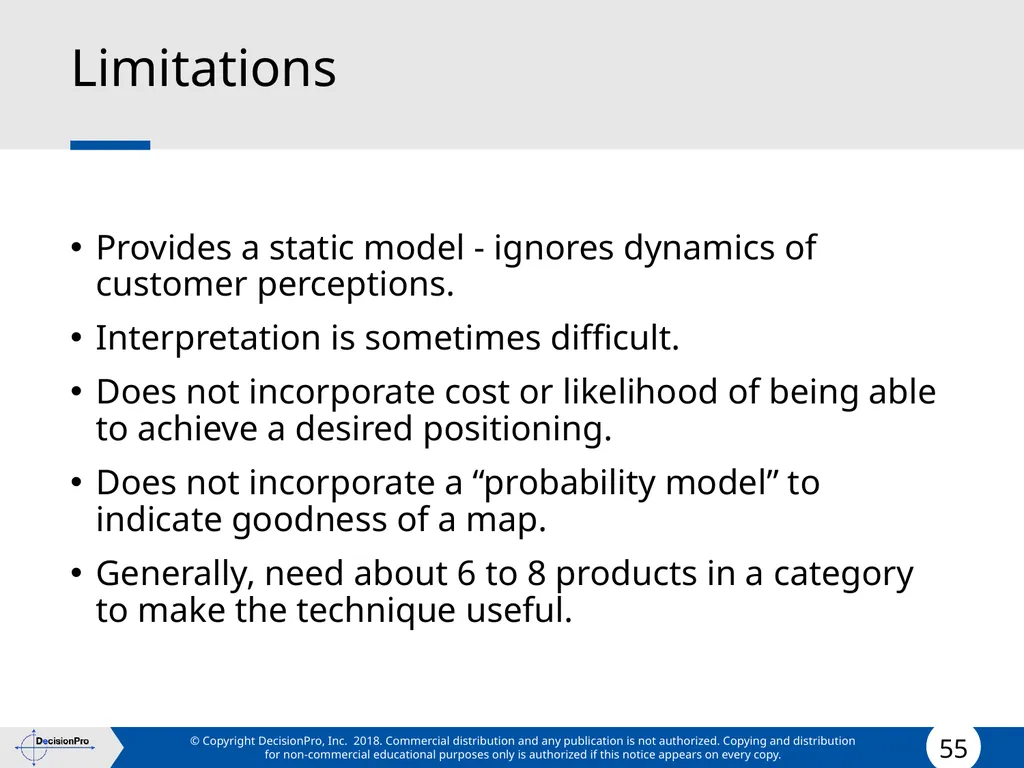
Limitations Provides a static model - ignores dynamics of customer perceptions.
Interpretation is sometimes difficult.
Does not incorporate cost or likelihood of being able to achieve a desired positioning.
Does not incorporate a “probability model” to indicate goodness of a map.
Generally, need about 6 to 8 products in a category to make the technique useful.<br>
Interpretation is sometimes difficult.
Does not incorporate cost or likelihood of being able to achieve a desired positioning.
Does not incorporate a “probability model” to indicate goodness of a map.
Generally, need about 6 to 8 products in a category to make the technique useful.<br>
56
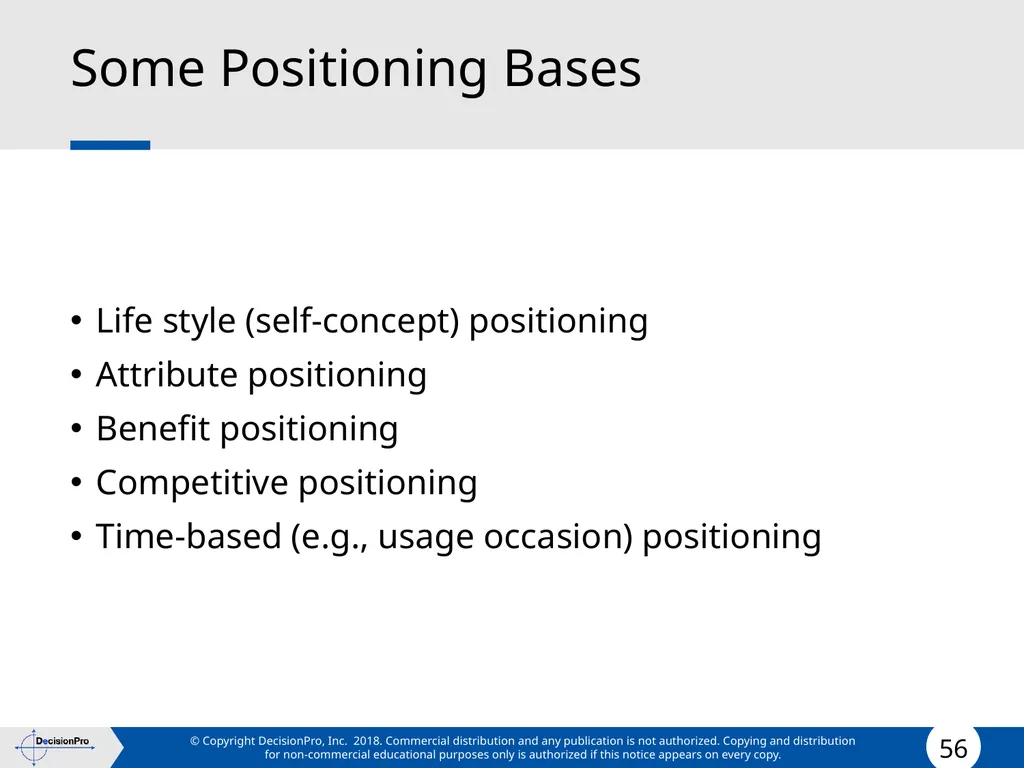
Some Positioning Bases Life style (self-concept) positioning
Attribute positioning
Benefit positioning
Competitive positioning
Time-based (e.g., usage occasion) positioning<br>
Attribute positioning
Benefit positioning
Competitive positioning
Time-based (e.g., usage occasion) positioning<br>
57
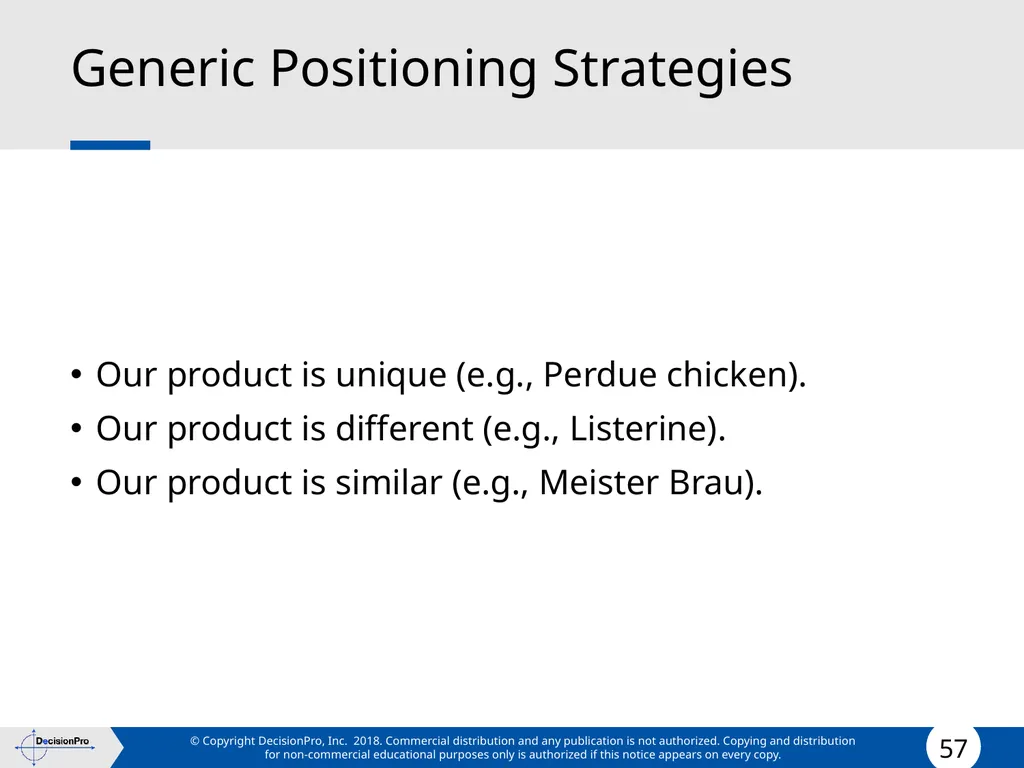
Generic Positioning Strategies Our product is unique (e.g., Perdue chicken).
Our product is different (e.g., Listerine).
Our product is similar (e.g., Meister Brau).<br>
Our product is different (e.g., Listerine).
Our product is similar (e.g., Meister Brau).<br>
58
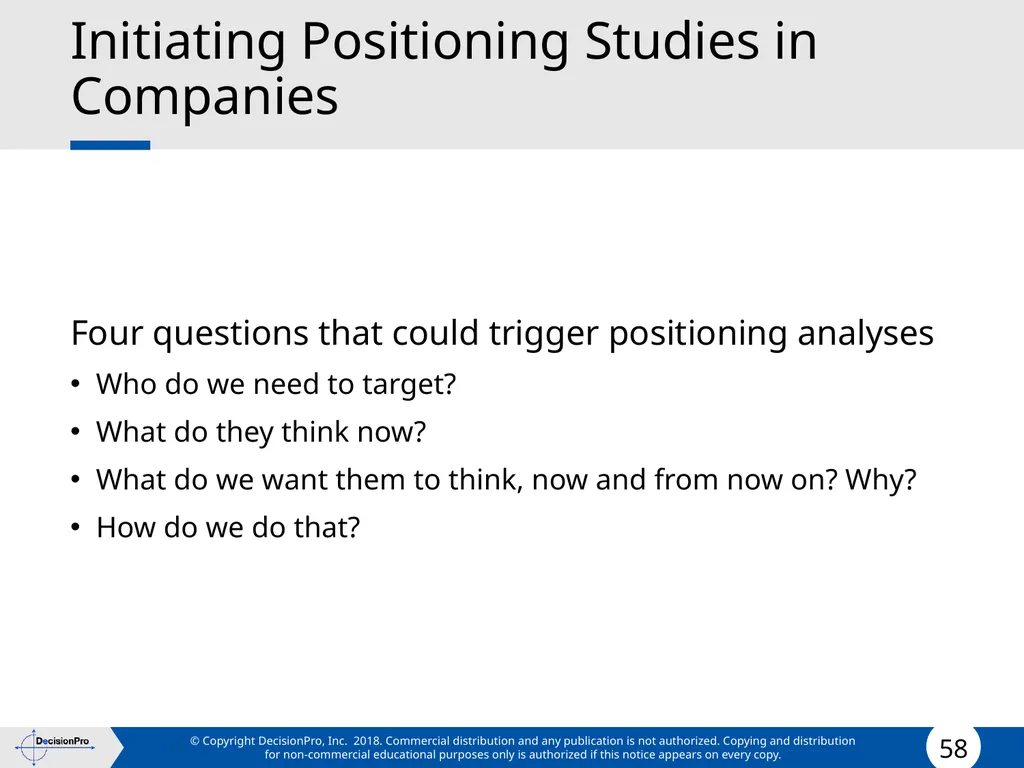
Initiating Positioning Studies in Companies Four questions that could trigger positioning analyses
Who do we need to target?
What do they think now?
What do we want them to think, now and from now on? Why?
How do we do that?<br>
Who do we need to target?
What do they think now?
What do we want them to think, now and from now on? Why?
How do we do that?<br>
59
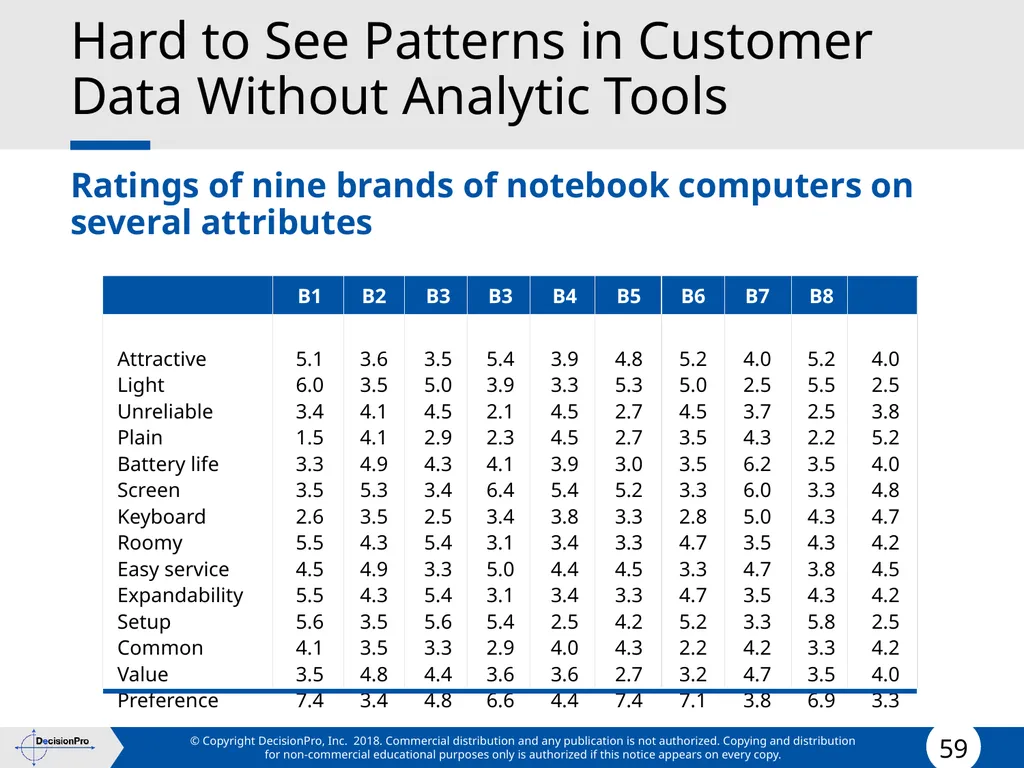
Hard to See Patterns in Customer Data Without Analytic Tools Ratings of nine brands of notebook computers on several attributes<br>
60
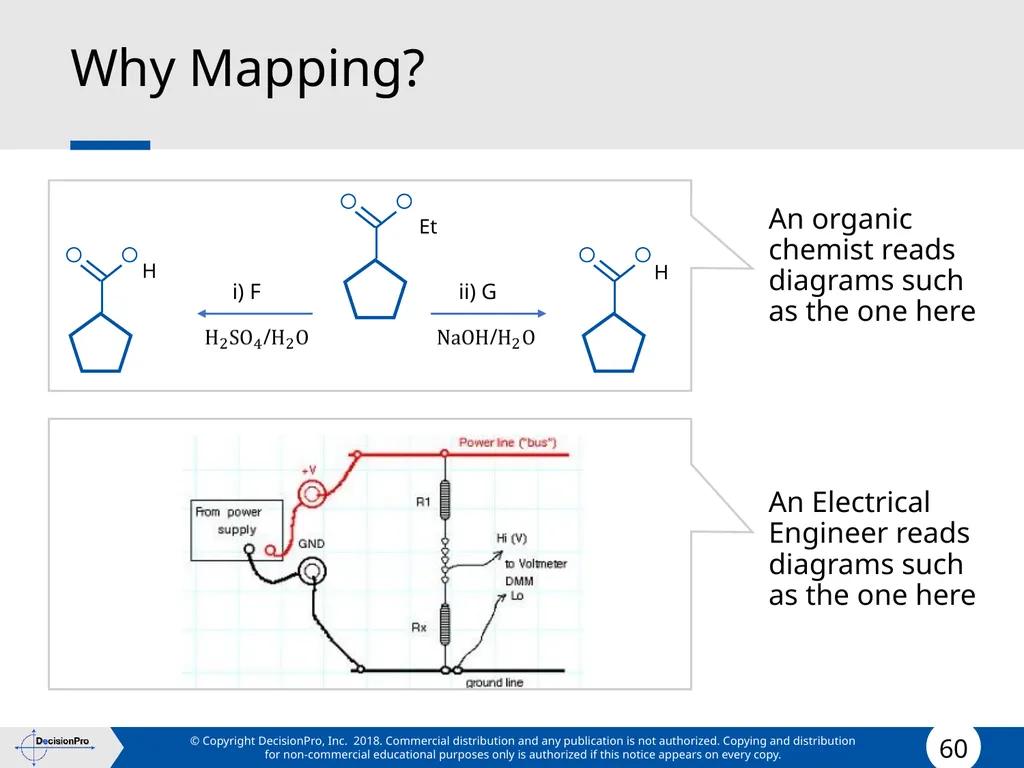
Why Mapping? An organic chemist reads diagrams such as the one here
An Electrical Engineer reads diagrams such as the one here H i) F Et ii) G H<br>
An Electrical Engineer reads diagrams such as the one here H i) F Et ii) G H<br>
61
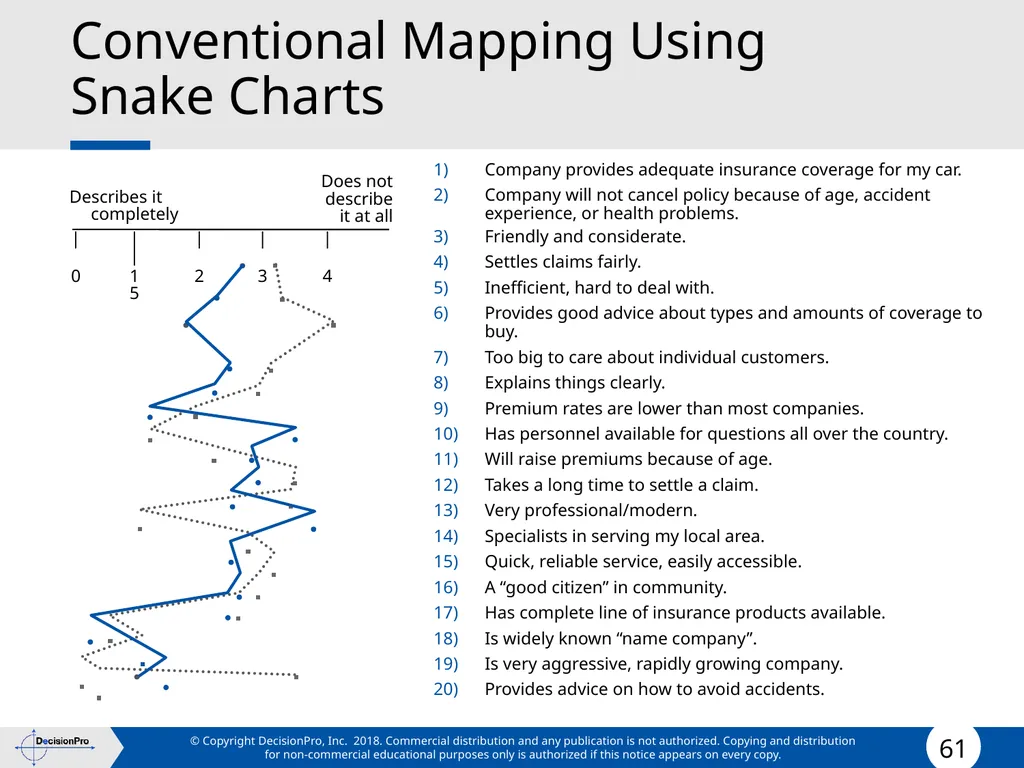
Conventional Mapping Using
Snake Charts Company provides adequate insurance coverage for my car.
Company will not cancel policy because of age, accident experience, or health problems.
Friendly and considerate.
Settles claims fairly.
Inefficient, hard to deal with.
Provides good advice about types and amounts of coverage to buy.
Too big to care about individual customers.
Explains things clearly.
Premium rates are lower than most companies.
Has personnel available for questions all over the country.
Will raise premiums because of age.
Takes a long time to settle a claim.
Very professional/modern.
Specialists in serving my local area.
Quick, reliable service, easily accessible.
A “good citizen” in community.
Has complete line of insurance products available.
Is widely known “name company”.
Is very aggressive, rapidly growing company.
Provides advice on how to avoid accidents.<br>
Company will not cancel policy because of age, accident experience, or health problems.
Friendly and considerate.
Settles claims fairly.
Inefficient, hard to deal with.
Provides good advice about types and amounts of coverage to buy.
Too big to care about individual customers.
Explains things clearly.
Premium rates are lower than most companies.
Has personnel available for questions all over the country.
Will raise premiums because of age.
Takes a long time to settle a claim.
Very professional/modern.
Specialists in serving my local area.
Quick, reliable service, easily accessible.
A “good citizen” in community.
Has complete line of insurance products available.
Is widely known “name company”.
Is very aggressive, rapidly growing company.
Provides advice on how to avoid accidents.<br>
62
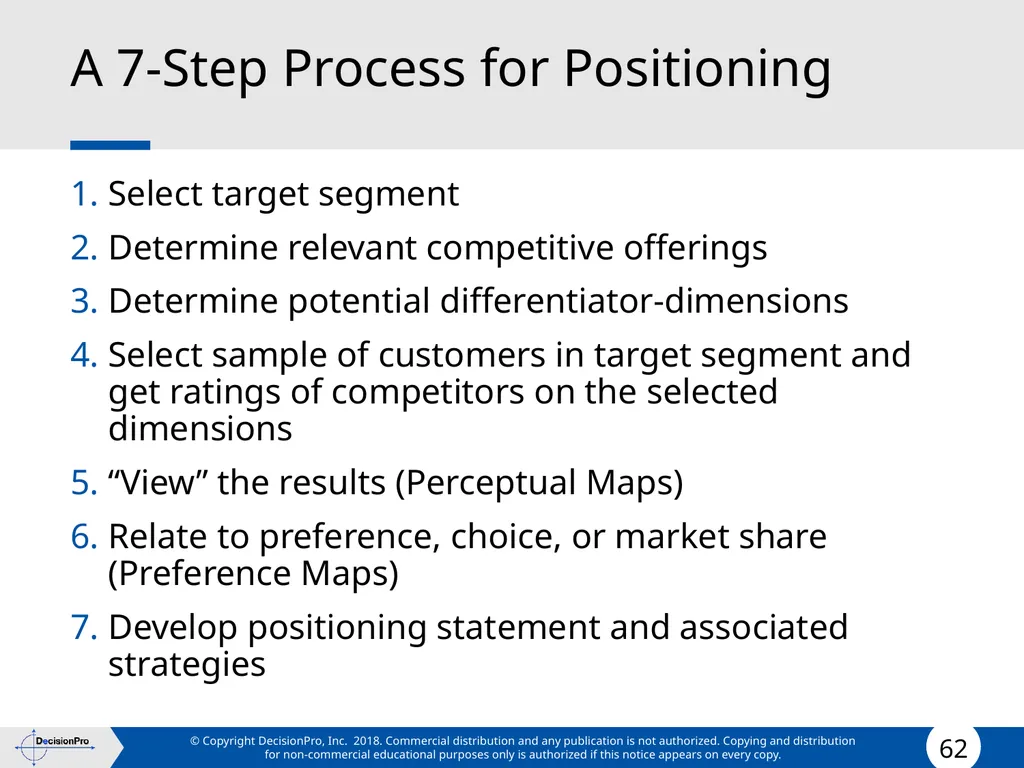
A 7-Step Process for Positioning Select target segment
Determine relevant competitive offerings
Determine potential differentiator-dimensions
Select sample of customers in target segment and get ratings of competitors on the selected dimensions
“View” the results (Perceptual Maps)
Relate to preference, choice, or market share (Preference Maps)
Develop positioning statement and associated strategies<br>
Determine relevant competitive offerings
Determine potential differentiator-dimensions
Select sample of customers in target segment and get ratings of competitors on the selected dimensions
“View” the results (Perceptual Maps)
Relate to preference, choice, or market share (Preference Maps)
Develop positioning statement and associated strategies<br>
63
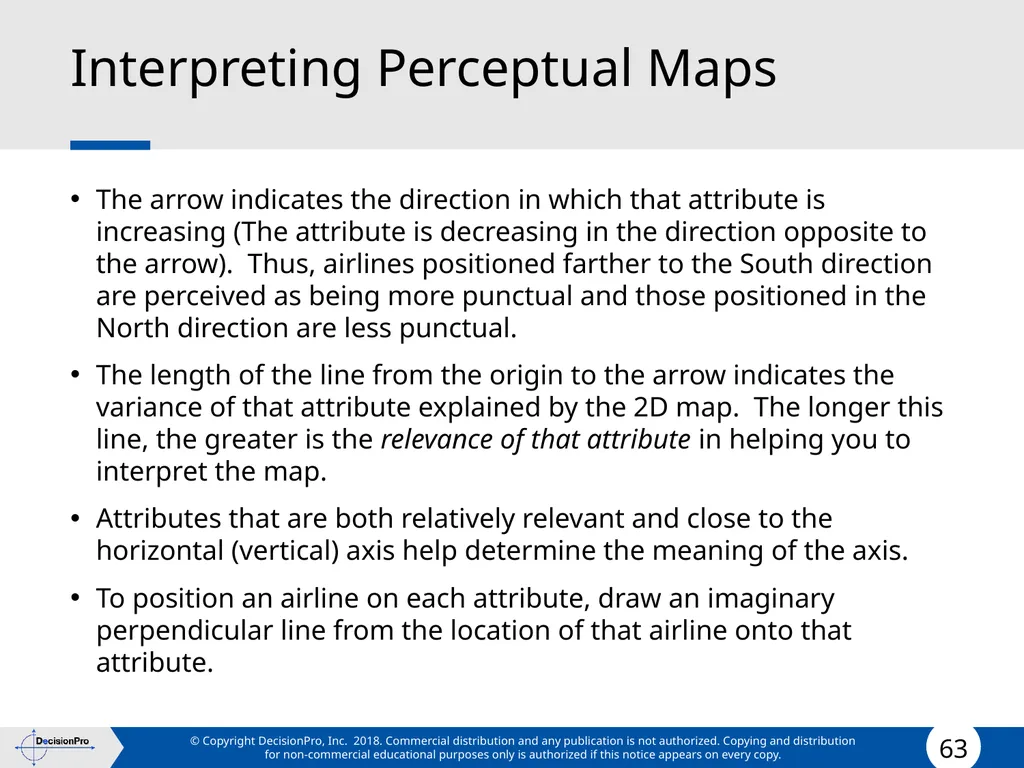
Interpreting Perceptual Maps The arrow indicates the direction in which that attribute is increasing (The attribute is decreasing in the direction opposite to the arrow). Thus, airlines positioned farther to the South direction are perceived as being more punctual and those positioned in the North direction are less punctual.
The length of the line from the origin to the arrow indicates the variance of that attribute explained by the 2D map. The longer this line, the greater is the relevance of that attribute in helping you to interpret the map.
Attributes that are both relatively relevant and close to the horizontal (vertical) axis help determine the meaning of the axis.
To position an airline on each attribute, draw an imaginary perpendicular line from the location of that airline onto that attribute.<br>
The length of the line from the origin to the arrow indicates the variance of that attribute explained by the 2D map. The longer this line, the greater is the relevance of that attribute in helping you to interpret the map.
Attributes that are both relatively relevant and close to the horizontal (vertical) axis help determine the meaning of the axis.
To position an airline on each attribute, draw an imaginary perpendicular line from the location of that airline onto that attribute.<br>
64
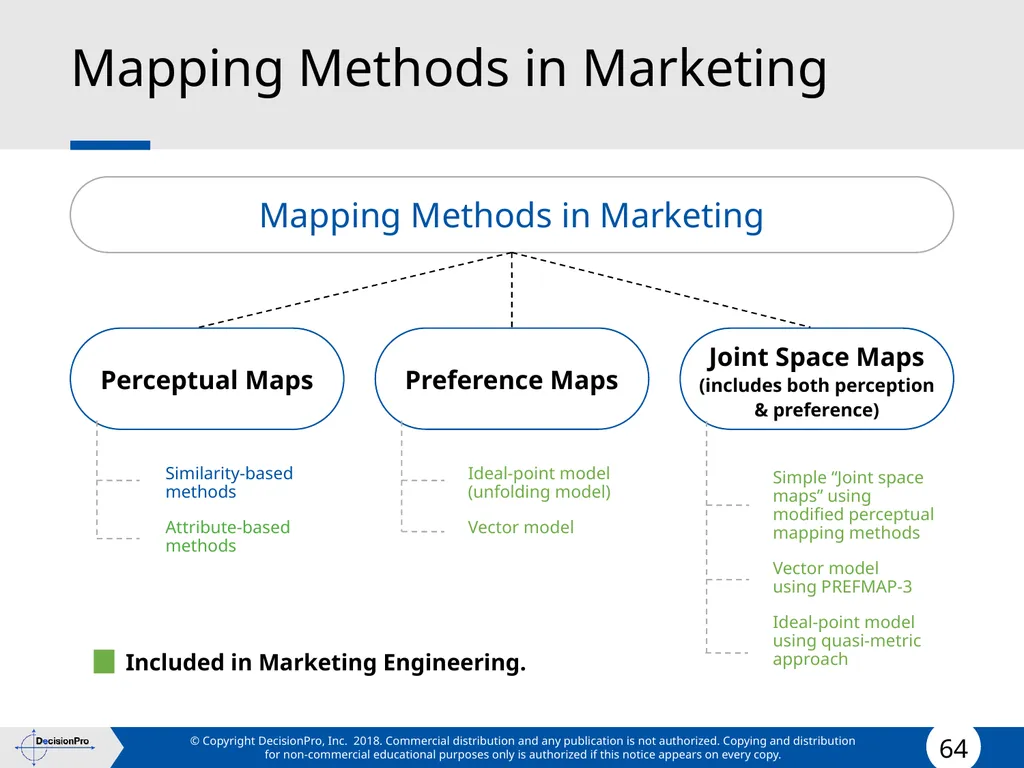
Mapping Methods in Marketing Mapping Methods in Marketing Perceptual Maps Preference Maps Joint Space Maps
(includes both perception & preference) Similarity-based methods
Attribute-based methods Ideal-point model (unfolding model)
Vector model Simple “Joint space maps” using modified perceptual mapping methods
Vector model using PREFMAP-3
Ideal-point model using quasi-metric approach Included in Marketing Engineering.<br>
Attribute-based methods Ideal-point model (unfolding model)
Vector model Simple “Joint space maps” using modified perceptual mapping methods
Vector model using PREFMAP-3
Ideal-point model using quasi-metric approach Included in Marketing Engineering.<br>
65
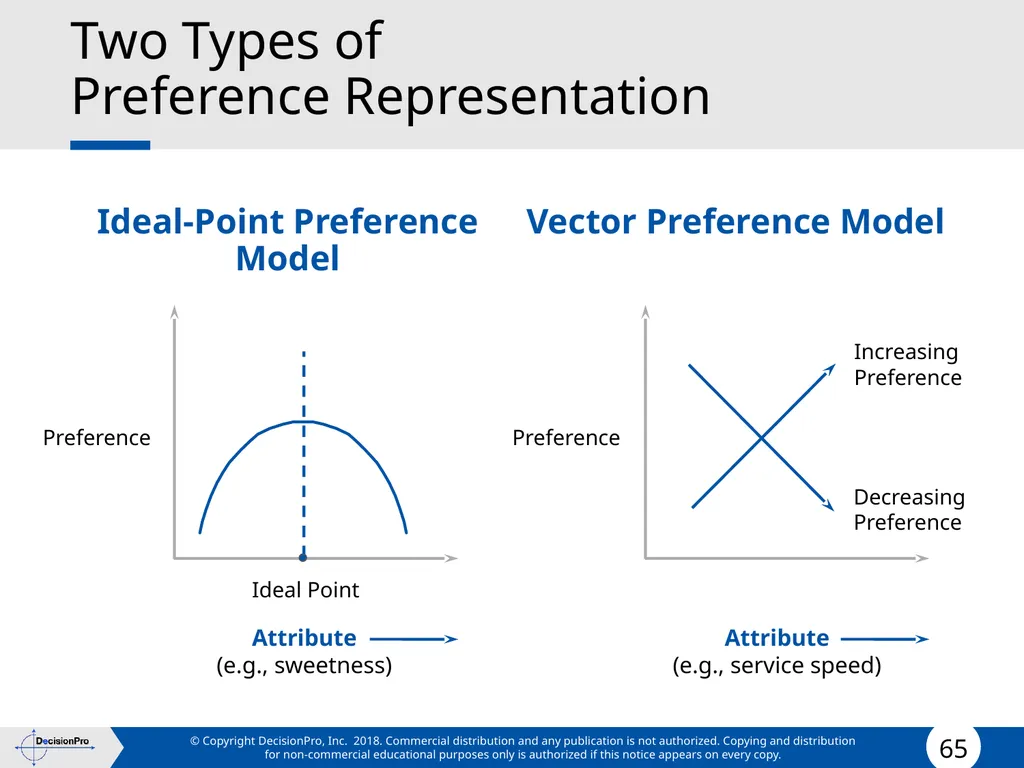
Ideal-Point Preference Model Two Types of
Preference Representation Vector Preference Model Attribute
(e.g., sweetness) Attribute
(e.g., service speed) Preference Preference Ideal Point Increasing Preference Decreasing Preference<br>
(e.g., sweetness) Attribute
(e.g., service speed) Preference Preference Ideal Point Increasing Preference Decreasing Preference<br>
66
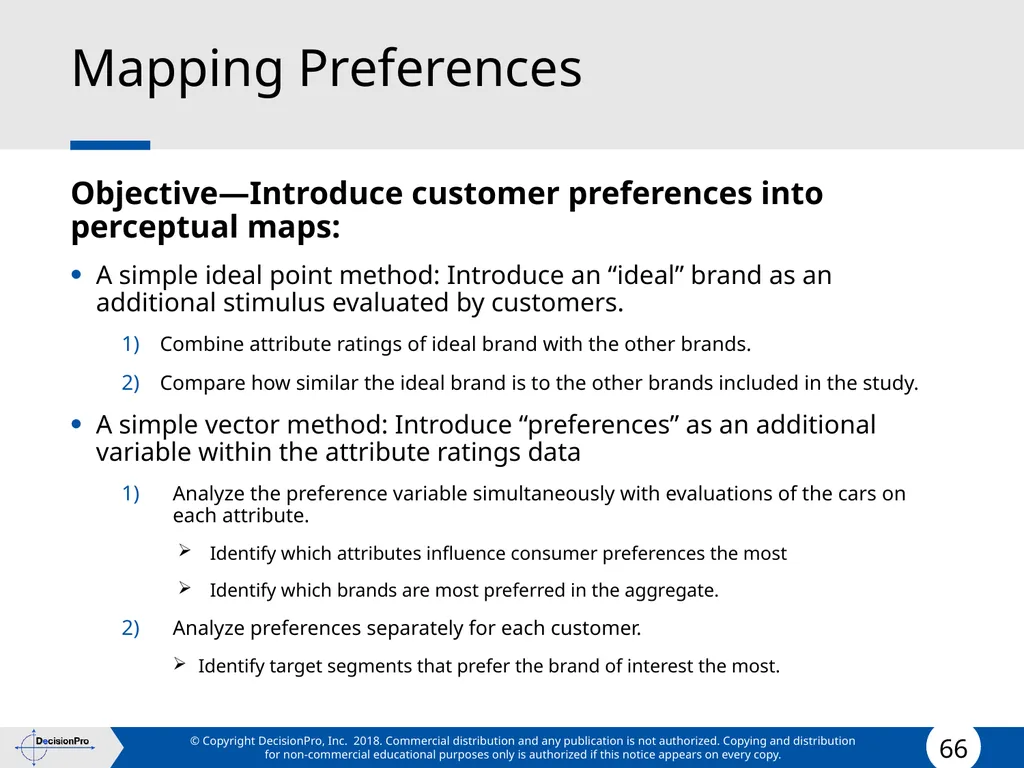
Mapping Preferences Objective—Introduce customer preferences into perceptual maps:
A simple ideal point method: Introduce an “ideal” brand as an additional stimulus evaluated by customers.
Combine attribute ratings of ideal brand with the other brands.
Compare how similar the ideal brand is to the other brands included in the study.
A simple vector method: Introduce “preferences” as an additional variable within the attribute ratings data
Analyze the preference variable simultaneously with evaluations of the cars on each attribute.
Identify which attributes influence consumer preferences the most
Identify which brands are most preferred in the aggregate.
Analyze preferences separately for each customer.
Identify target segments that prefer the brand of interest the most.<br>
A simple ideal point method: Introduce an “ideal” brand as an additional stimulus evaluated by customers.
Combine attribute ratings of ideal brand with the other brands.
Compare how similar the ideal brand is to the other brands included in the study.
A simple vector method: Introduce “preferences” as an additional variable within the attribute ratings data
Analyze the preference variable simultaneously with evaluations of the cars on each attribute.
Identify which attributes influence consumer preferences the most
Identify which brands are most preferred in the aggregate.
Analyze preferences separately for each customer.
Identify target segments that prefer the brand of interest the most.<br>
67
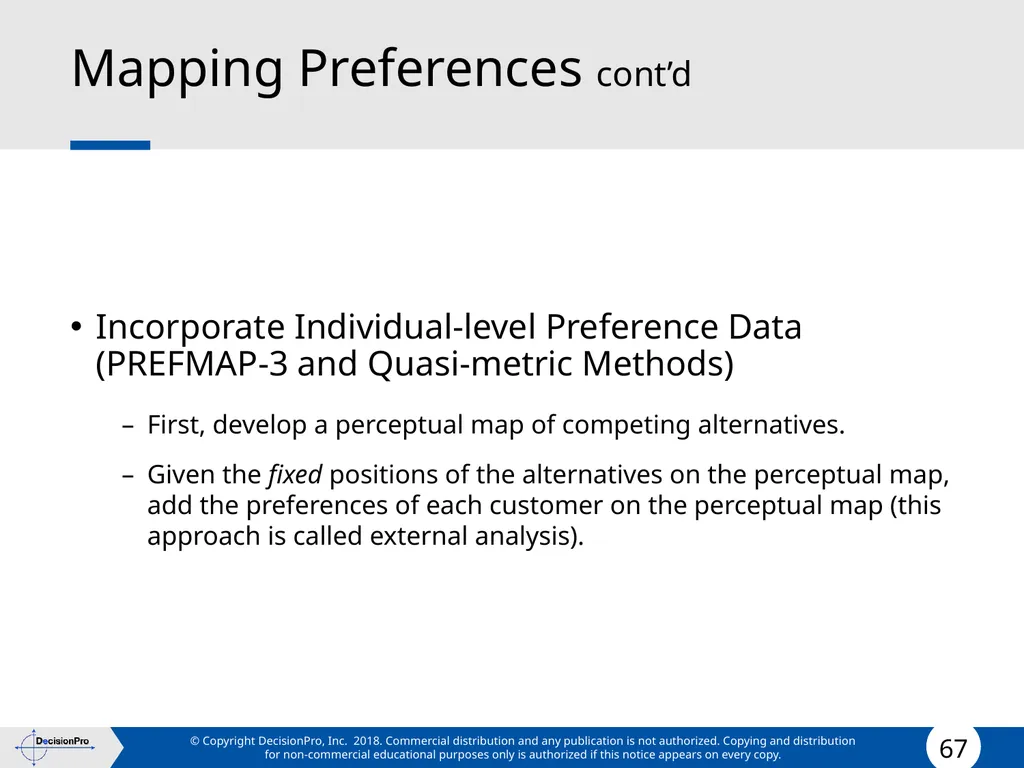
Mapping Preferences cont’d Incorporate Individual-level Preference Data (PREFMAP-3 and Quasi-metric Methods)
First, develop a perceptual map of competing alternatives.
Given the fixed positions of the alternatives on the perceptual map, add the preferences of each customer on the perceptual map (this approach is called external analysis).<br>
First, develop a perceptual map of competing alternatives.
Given the fixed positions of the alternatives on the perceptual map, add the preferences of each customer on the perceptual map (this approach is called external analysis).<br>
68
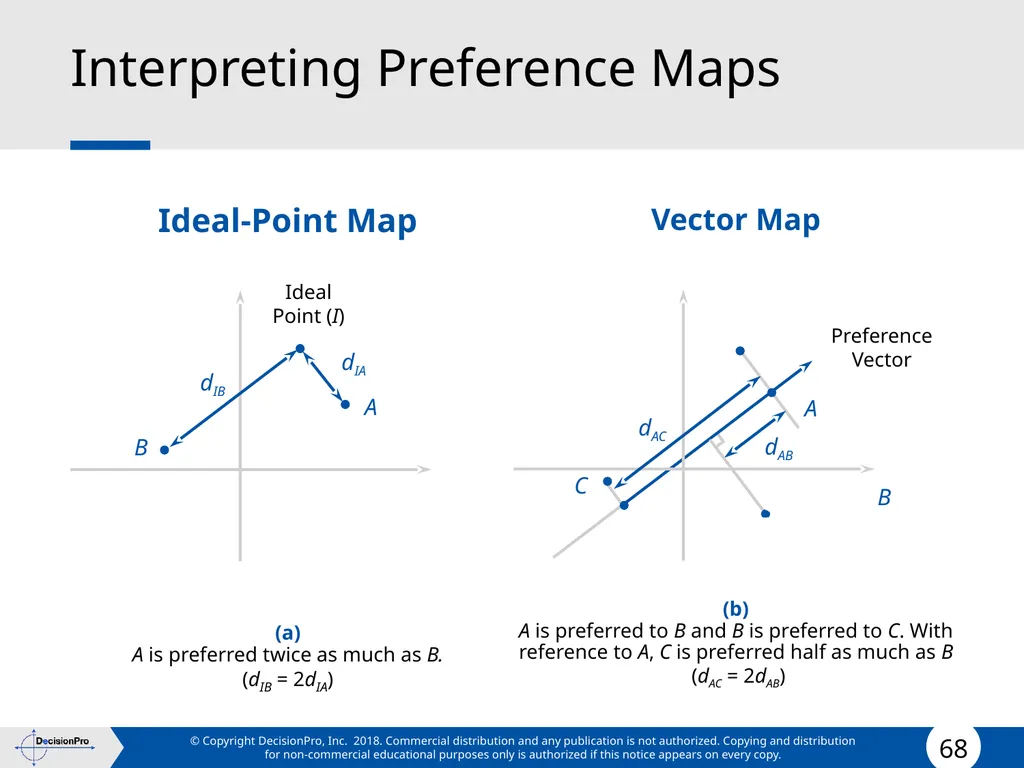
Interpreting Preference Maps Ideal-Point Map
(a) A is preferred twice as much as B. (dIB = 2dIA) Vector Map
(b) A is preferred to B and B is preferred to C. With reference to A, C is preferred half as much as B (dAC = 2dAB)<br>
(a) A is preferred twice as much as B. (dIB = 2dIA) Vector Map
(b) A is preferred to B and B is preferred to C. With reference to A, C is preferred half as much as B (dAC = 2dAB)<br>
69
Preference Data for PREFMAP-3
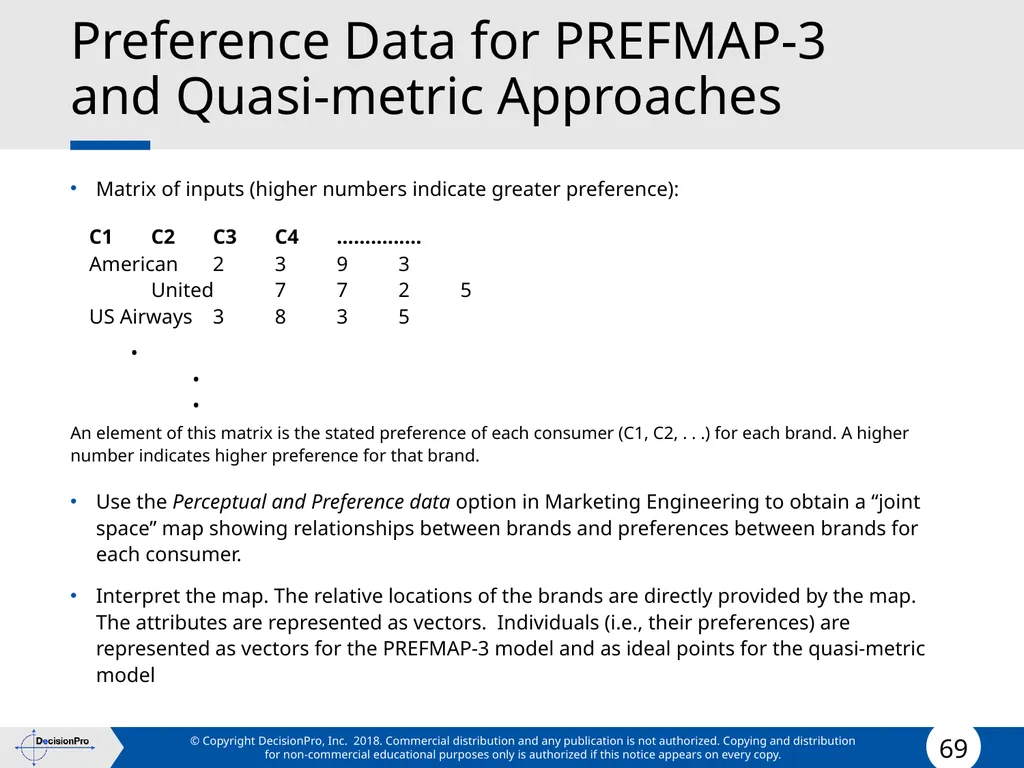
and Quasi-metric Approaches Matrix of inputs (higher numbers indicate greater preference):
C1 C2 C3 C4 ...............
American 2 3 9 3
United 7 7 2 5
US Airways 3 8 3 5
• • •
An element of this matrix is the stated preference of each consumer (C1, C2, . . .) for each brand. A higher number indicates higher preference for that brand.
Use the Perceptual and Preference data option in Marketing Engineering to obtain a “joint space” map showing relationships between brands and preferences between brands for each consumer.
Interpret the map. The relative locations of the brands are directly provided by the map. The attributes are represented as vectors. Individuals (i.e., their preferences) are represented as vectors for the PREFMAP-3 model and as ideal points for the quasi-metric model<br>
C1 C2 C3 C4 ...............
American 2 3 9 3
United 7 7 2 5
US Airways 3 8 3 5
• • •
An element of this matrix is the stated preference of each consumer (C1, C2, . . .) for each brand. A higher number indicates higher preference for that brand.
Use the Perceptual and Preference data option in Marketing Engineering to obtain a “joint space” map showing relationships between brands and preferences between brands for each consumer.
Interpret the map. The relative locations of the brands are directly provided by the map. The attributes are represented as vectors. Individuals (i.e., their preferences) are represented as vectors for the PREFMAP-3 model and as ideal points for the quasi-metric model<br>
70
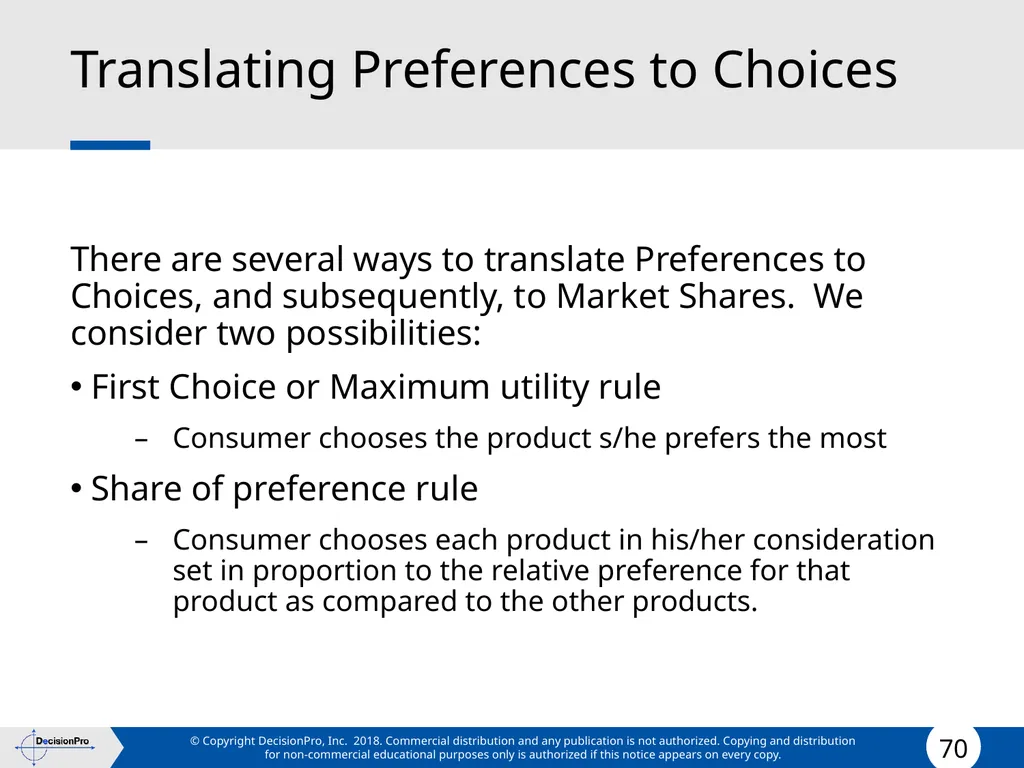
Translating Preferences to Choices There are several ways to translate Preferences to Choices, and subsequently, to Market Shares. We consider two possibilities:
First Choice or Maximum utility rule
Consumer chooses the product s/he prefers the most
Share of preference rule
Consumer chooses each product in his/her consideration set in proportion to the relative preference for that product as compared to the other products.<br>
First Choice or Maximum utility rule
Consumer chooses the product s/he prefers the most
Share of preference rule
Consumer chooses each product in his/her consideration set in proportion to the relative preference for that product as compared to the other products.<br>
71
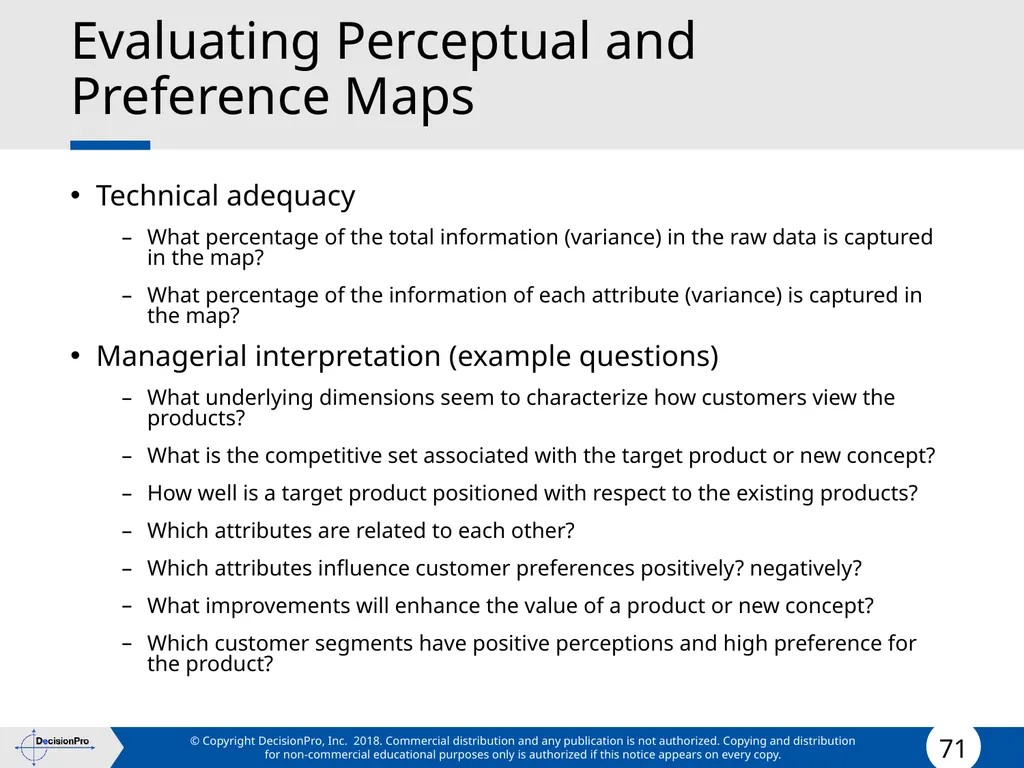
Evaluating Perceptual and Preference Maps Technical adequacy
What percentage of the total information (variance) in the raw data is captured in the map?
What percentage of the information of each attribute (variance) is captured in the map?
Managerial interpretation (example questions)
What underlying dimensions seem to characterize how customers view the products?
What is the competitive set associated with the target product or new concept?
How well is a target product positioned with respect to the existing products?
Which attributes are related to each other?
Which attributes influence customer preferences positively? negatively?
What improvements will enhance the value of a product or new concept?
Which customer segments have positive perceptions and high preference for the product?<br>
What percentage of the total information (variance) in the raw data is captured in the map?
What percentage of the information of each attribute (variance) is captured in the map?
Managerial interpretation (example questions)
What underlying dimensions seem to characterize how customers view the products?
What is the competitive set associated with the target product or new concept?
How well is a target product positioned with respect to the existing products?
Which attributes are related to each other?
Which attributes influence customer preferences positively? negatively?
What improvements will enhance the value of a product or new concept?
Which customer segments have positive perceptions and high preference for the product?<br>