
PRESENTATION ON ESG & BRSR – OPPORTUNITIES FOR
DP
Published · 91 slides · 0 views
1 / 1





Description
PRESENTATION ON ESG BRSR OPPORTUNITIES FOR CMAs FOR SIRC OF ICMAI JANUARY 8, 2025 By CS A Sekar a.sekar.csgmail.com Cell : 98202-29134 SCOPE, GAMUT AND CONCERNS OF ESG TRIPLE BOTTOM LINE (TBL) ACCOUNTING Source:
Related Topics
Share
Embed code
Download this presentation From Below
"PRESENTATION ON ESG & BRSR – OPPORTUNITIES FOR" is the property of its rightful owner. Permission is granted to download and print the materials on this website for personal, non-commercial use only, and to display it on your personal computer provided you do not modify the materials and that you retain all copyright notices contained in the materials. By downloading content from our website, you accept the terms of this agreement.
Presentation Transcript
01
PRESENTATION ON
ESG & BRSR –
OPPORTUNITIES FOR CMAs
FOR SIRC OF ICMAI
JANUARY 8, 2025 By CS A Sekar
a.sekar.cs@gmail.com
Cell : 98202-29134<br>
a.sekar.cs@gmail.com
Cell : 98202-29134<br>
02
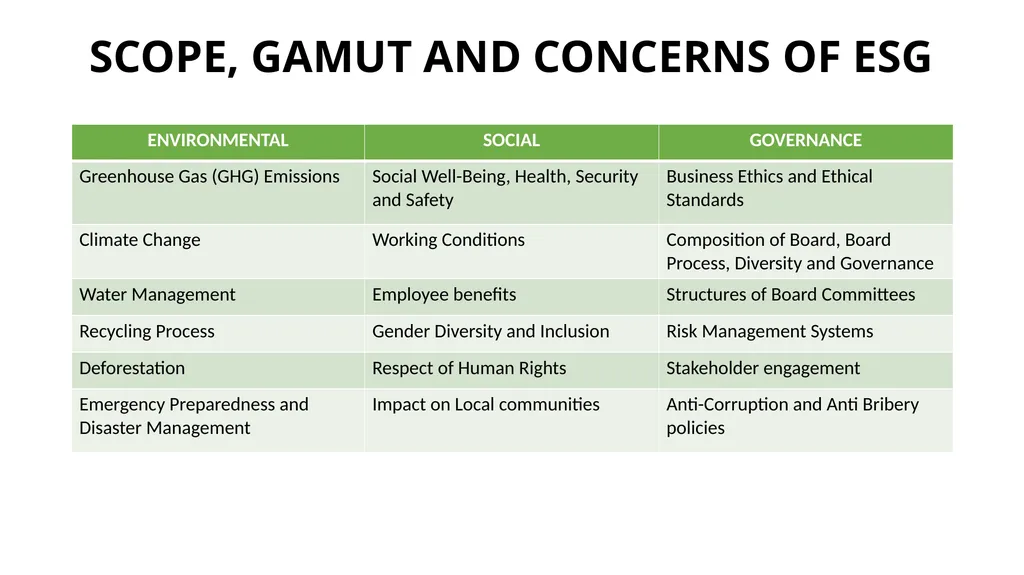
SCOPE, GAMUT AND CONCERNS OF ESG<br>
03
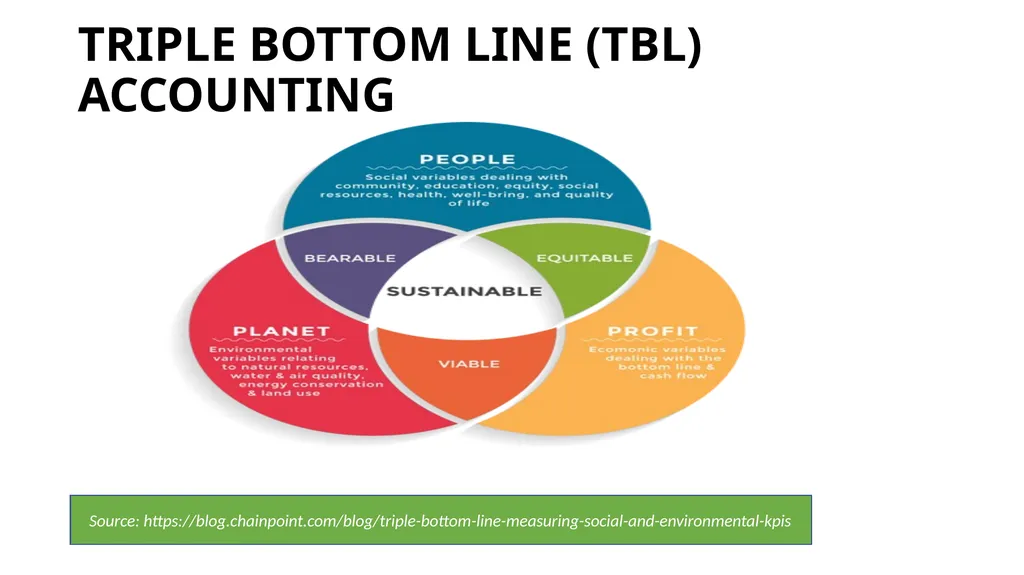
TRIPLE BOTTOM LINE (TBL) ACCOUNTING Source: https://blog.chainpoint.com/blog/triple-bottom-line-measuring-social-and-environmental-kpis<br>
04
TRIPLE BOTTOM LINE (TBL) ACCOUNTING It consists of three Ps: profit, people and planet
The phrase “the triple bottom line” was first coined in 1994 by John Elkington, the founder of a British consultancy called SustainAbility
The triple bottom line (TBL) is an accounting framework that includes social, environmental and financial results as bottom lines<br>
The triple bottom line (TBL) is an accounting framework that includes social, environmental and financial results as bottom lines<br>
05
SUSTAINABILITY CONCEPTS<br>
06
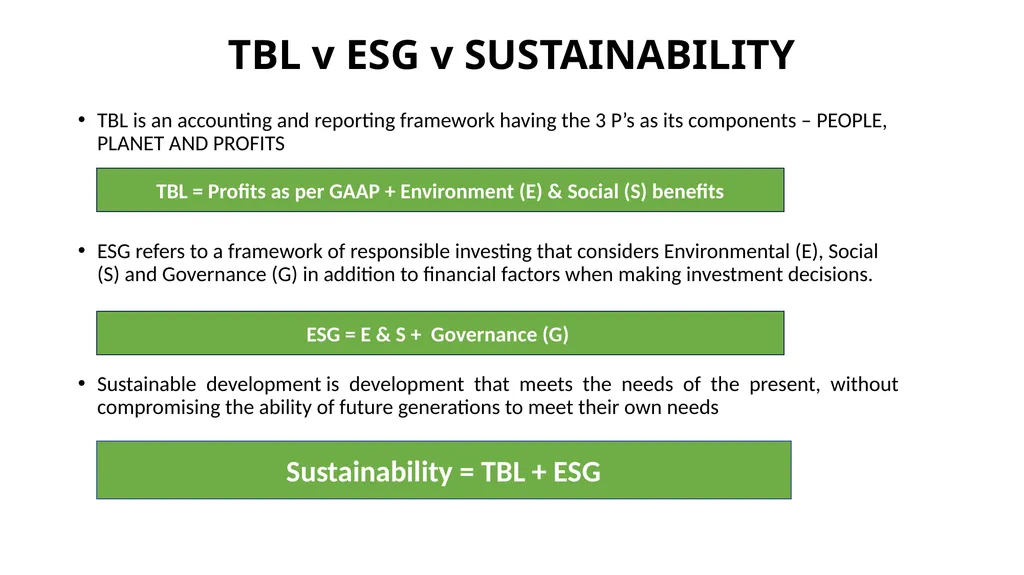
TBL v ESG v SUSTAINABILITY TBL is an accounting and reporting framework having the 3 P’s as its components – PEOPLE, PLANET AND PROFITS
ESG refers to a framework of responsible investing that considers Environmental (E), Social (S) and Governance (G) in addition to financial factors when making investment decisions.
Sustainable development is development that meets the needs of the present, without compromising the ability of future generations to meet their own needs Sustainability = TBL + ESG TBL = Profits as per GAAP + Environment (E) & Social (S) benefits ESG = E & S + Governance (G)<br>
ESG refers to a framework of responsible investing that considers Environmental (E), Social (S) and Governance (G) in addition to financial factors when making investment decisions.
Sustainable development is development that meets the needs of the present, without compromising the ability of future generations to meet their own needs Sustainability = TBL + ESG TBL = Profits as per GAAP + Environment (E) & Social (S) benefits ESG = E & S + Governance (G)<br>
07
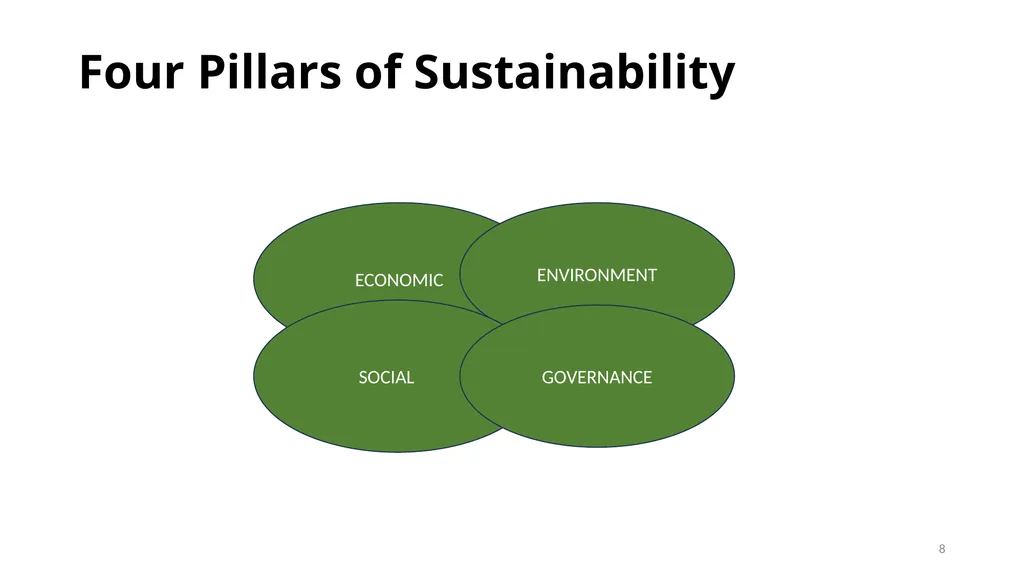
Four Pillars of Sustainability ECONOMIC ENVIRONMENT SOCIAL GOVERNANCE 8<br>
08
Sustainable Development Simple concept but difficult to implement considering diverse viewpoint of stakeholders
Four Components:
Economics
Environment
Society
Governance
“Sustainable development refers to a mode of human development in which resource use aims to meet human needs while preserving the environment so that these needs can be met not only in the present, but also for the generations to come.” - Dr. APJ Abdul Kalam, former President of India as a Chief Guest in CSR Summit-cum-Awards in 2012 9<br>
Four Components:
Economics
Environment
Society
Governance
“Sustainable development refers to a mode of human development in which resource use aims to meet human needs while preserving the environment so that these needs can be met not only in the present, but also for the generations to come.” - Dr. APJ Abdul Kalam, former President of India as a Chief Guest in CSR Summit-cum-Awards in 2012 9<br>
09
Economic Sustainability Economic Sustainability is influenced by:
Responsible Management of resources
Financial Stability at the macro level
Capacity for achieving efficiency and innovation by enterprises
Efficient recycling and the use of renewable resources
Commitment to promoting policies, programmes and initiatives that address
social issues such as poverty, reducing inequalities of wealth & income, gender equality, access to education & health care and other social issues
Environmental sustainability issues
International co-operation and partnership between public administration and private enterprises
Corporate responsibility 10<br>
Responsible Management of resources
Financial Stability at the macro level
Capacity for achieving efficiency and innovation by enterprises
Efficient recycling and the use of renewable resources
Commitment to promoting policies, programmes and initiatives that address
social issues such as poverty, reducing inequalities of wealth & income, gender equality, access to education & health care and other social issues
Environmental sustainability issues
International co-operation and partnership between public administration and private enterprises
Corporate responsibility 10<br>
10
Sustainability – A balancing act Interconnection between pillars of Sustainability
Economic Sustainability v/s Overall Sustainability
Prioritising Sustainability Objectives – short term, medium term & long term
Understanding stakeholder concerns
Balancing and Reconciliation 11<br>
Economic Sustainability v/s Overall Sustainability
Prioritising Sustainability Objectives – short term, medium term & long term
Understanding stakeholder concerns
Balancing and Reconciliation 11<br>
11
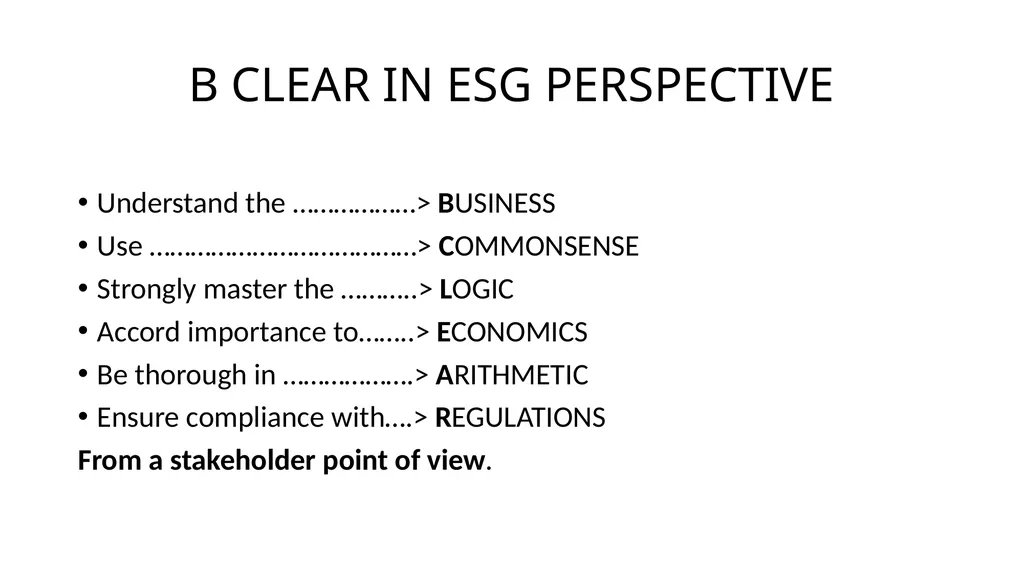
B CLEAR IN ESG PERSPECTIVE Understand the ………………> BUSINESS
Use …………………………………> COMMONSENSE
Strongly master the ………..> LOGIC
Accord importance to……..> ECONOMICS
Be thorough in ……………….> ARITHMETIC
Ensure compliance with….> REGULATIONS
From a stakeholder point of view.<br>
Use …………………………………> COMMONSENSE
Strongly master the ………..> LOGIC
Accord importance to……..> ECONOMICS
Be thorough in ……………….> ARITHMETIC
Ensure compliance with….> REGULATIONS
From a stakeholder point of view.<br>
12
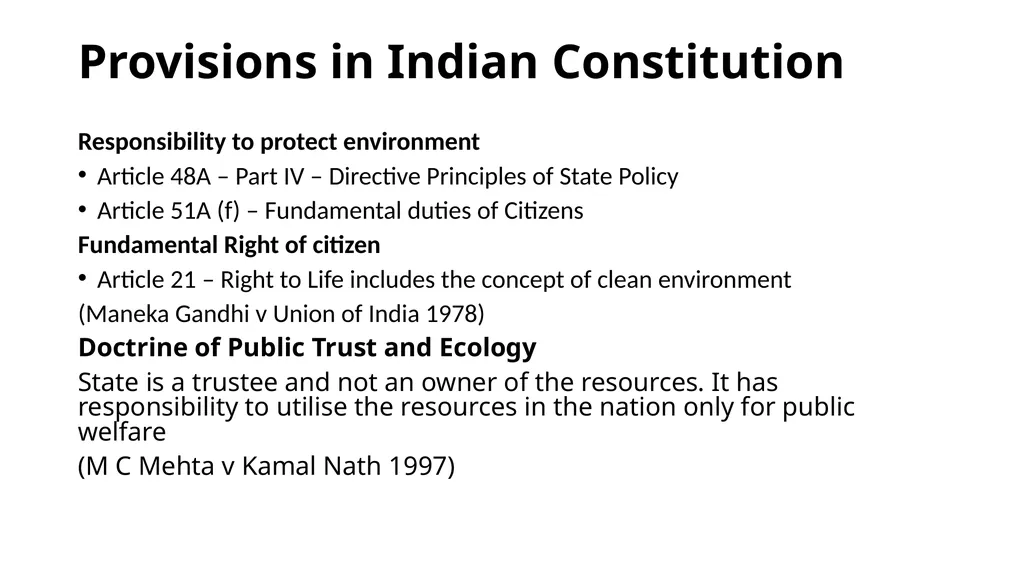
Provisions in Indian Constitution Responsibility to protect environment
Article 48A – Part IV – Directive Principles of State Policy
Article 51A (f) – Fundamental duties of Citizens
Fundamental Right of citizen
Article 21 – Right to Life includes the concept of clean environment
(Maneka Gandhi v Union of India 1978)
Doctrine of Public Trust and Ecology
State is a trustee and not an owner of the resources. It has responsibility to utilise the resources in the nation only for public welfare
(M C Mehta v Kamal Nath 1997)<br>
Article 48A – Part IV – Directive Principles of State Policy
Article 51A (f) – Fundamental duties of Citizens
Fundamental Right of citizen
Article 21 – Right to Life includes the concept of clean environment
(Maneka Gandhi v Union of India 1978)
Doctrine of Public Trust and Ecology
State is a trustee and not an owner of the resources. It has responsibility to utilise the resources in the nation only for public welfare
(M C Mehta v Kamal Nath 1997)<br>
13
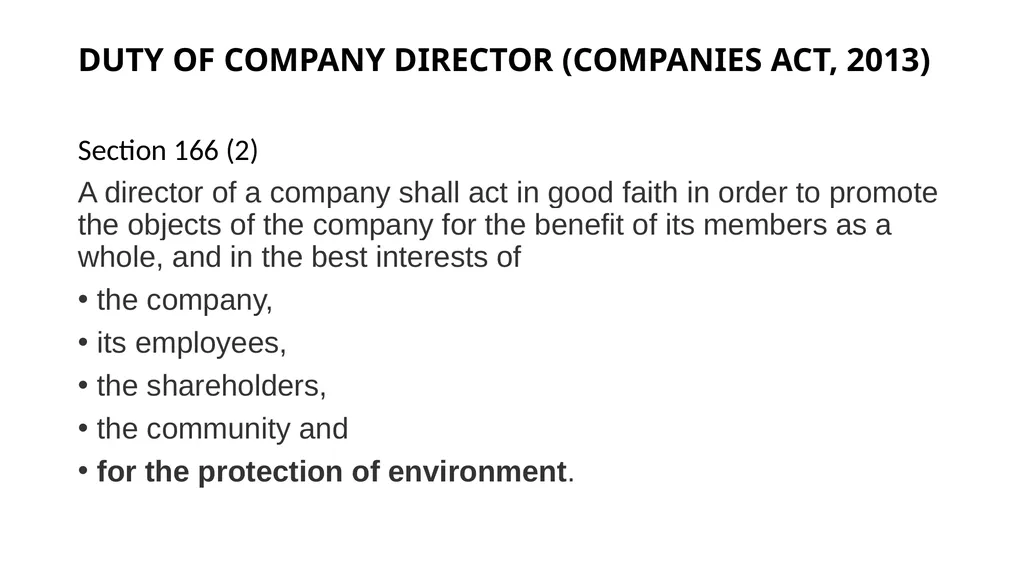
DUTY OF COMPANY DIRECTOR (COMPANIES ACT, 2013) Section 166 (2)
A director of a company shall act in good faith in order to promote the objects of the company for the benefit of its members as a whole, and in the best interests of
the company,
its employees,
the shareholders,
the community and
for the protection of environment.<br>
A director of a company shall act in good faith in order to promote the objects of the company for the benefit of its members as a whole, and in the best interests of
the company,
its employees,
the shareholders,
the community and
for the protection of environment.<br>
14
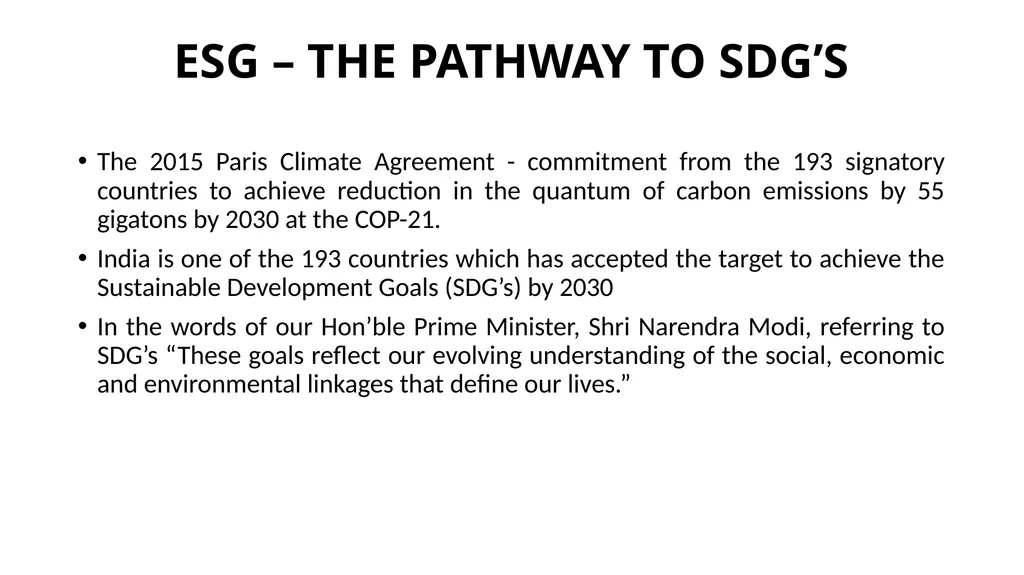
ESG – THE PATHWAY TO SDG’S The 2015 Paris Climate Agreement - commitment from the 193 signatory countries to achieve reduction in the quantum of carbon emissions by 55 gigatons by 2030 at the COP-21.
India is one of the 193 countries which has accepted the target to achieve the Sustainable Development Goals (SDG’s) by 2030
In the words of our Hon’ble Prime Minister, Shri Narendra Modi, referring to SDG’s “These goals reflect our evolving understanding of the social, economic and environmental linkages that define our lives.”<br>
India is one of the 193 countries which has accepted the target to achieve the Sustainable Development Goals (SDG’s) by 2030
In the words of our Hon’ble Prime Minister, Shri Narendra Modi, referring to SDG’s “These goals reflect our evolving understanding of the social, economic and environmental linkages that define our lives.”<br>
15
COP 26 – What was agreed Countries will meet next year to pledge further cuts to CO2 emissions in an attempt to keep temperature rise to within 1.5C.
Commitment to reduce use of coal – India and China agreed to Phase Down rather than Phase Out. (Coal responsible for 40% of CO2 emissions)
Pledge to increase money support to developing countries to switch to clean energy
Agreement to phase out fossil fuel subsidies
Agreement to cut 30% of methane emissions by 2030
Most commitments made at COP-26 have to be self-monitored, barring a few countries which have made legally binding pledges
COP 27 held in Egypt re-affirmed the commitments
COP 28 held in Dubai undertook global stocktake – need to speed up
COP 29 held at Baku, Azerbaijan (Nov 11 to Nov 22, 2024)
COP 30 scheduled at Belem, Brazil (Nov 2025)<br>
Commitment to reduce use of coal – India and China agreed to Phase Down rather than Phase Out. (Coal responsible for 40% of CO2 emissions)
Pledge to increase money support to developing countries to switch to clean energy
Agreement to phase out fossil fuel subsidies
Agreement to cut 30% of methane emissions by 2030
Most commitments made at COP-26 have to be self-monitored, barring a few countries which have made legally binding pledges
COP 27 held in Egypt re-affirmed the commitments
COP 28 held in Dubai undertook global stocktake – need to speed up
COP 29 held at Baku, Azerbaijan (Nov 11 to Nov 22, 2024)
COP 30 scheduled at Belem, Brazil (Nov 2025)<br>
16
India and COP26 India’s commitments:
cut India’s total projected carbon emission by 100 crore tonnes by 2030
Meeting 50% of India’s energy requirements from renewable energy by 2030 & increasing non-fossil fuel power generation capacity to 500 GW by end of this decade
reduce the carbon intensity of the economy by less than 45% by the end of the decade
Net zero carbon emissions by 2070
Implications for India arising out of ambitious targets: Opens up exciting investment opportunities across segments like
renewables,
the EV ecosystem,
ethanol blending with petrol
improvement in energy efficiencies and
carbon capture technologies<br>
cut India’s total projected carbon emission by 100 crore tonnes by 2030
Meeting 50% of India’s energy requirements from renewable energy by 2030 & increasing non-fossil fuel power generation capacity to 500 GW by end of this decade
reduce the carbon intensity of the economy by less than 45% by the end of the decade
Net zero carbon emissions by 2070
Implications for India arising out of ambitious targets: Opens up exciting investment opportunities across segments like
renewables,
the EV ecosystem,
ethanol blending with petrol
improvement in energy efficiencies and
carbon capture technologies<br>
17
Net Zero (Carbon Neutrality) “Net Zero” emissions refers to achieving an overall balance between greenhouse gas emissions produced and greenhouse gas emissions taken out of the atmosphere.
Getting to net zero means we can still produce some emissions, as long as they are offset by processes that reduce greenhouse gases already in the atmosphere.
The more emissions that are produced, the more carbon dioxide we need to remove from the atmosphere to reach Net Zero (referred to as “Sequestration”
“Net Zero” is the first step to get to “Real Zero”
The end goal is to balance the scales again, and restore the global climate to pre-climate change levels<br>
Getting to net zero means we can still produce some emissions, as long as they are offset by processes that reduce greenhouse gases already in the atmosphere.
The more emissions that are produced, the more carbon dioxide we need to remove from the atmosphere to reach Net Zero (referred to as “Sequestration”
“Net Zero” is the first step to get to “Real Zero”
The end goal is to balance the scales again, and restore the global climate to pre-climate change levels<br>
18
Ethanol Blending Ethanol : a bio-fuel which is naturally produced by fermentation of sugar by yeasts or by petrochemical processes
Ethanol is a less polluting fuel and equally efficient at a lower cost than Petrol.
Ethanol is considered to be renewable fuel, made from various plant-based materials collectively known as Bio-Mass.
India’s oil imports is currently 85% of its requirements
Ethanol Blending contributes to huge forex savings, contributes to employment creation and reduces greenhouse effect
The negative aspect is possible spike in food prices (corn the RM is a food product), increased water requirements and consumes a lot of heat in distillation process
India’s target - 20% ethanol blending by 2025<br>
Ethanol is a less polluting fuel and equally efficient at a lower cost than Petrol.
Ethanol is considered to be renewable fuel, made from various plant-based materials collectively known as Bio-Mass.
India’s oil imports is currently 85% of its requirements
Ethanol Blending contributes to huge forex savings, contributes to employment creation and reduces greenhouse effect
The negative aspect is possible spike in food prices (corn the RM is a food product), increased water requirements and consumes a lot of heat in distillation process
India’s target - 20% ethanol blending by 2025<br>
19
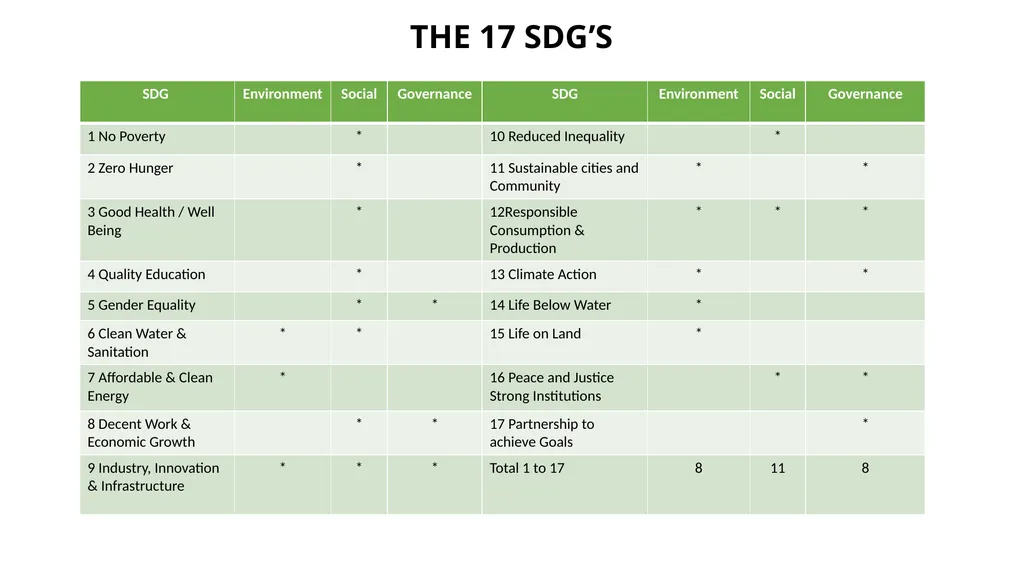
THE 17 SDG’S<br>
20
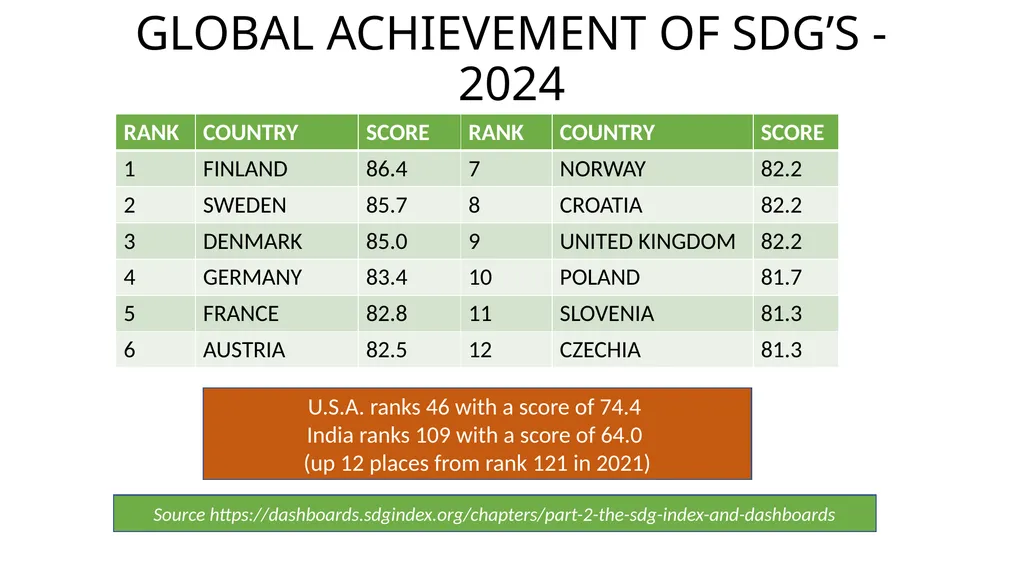
GLOBAL ACHIEVEMENT OF SDG’S - 2024 U.S.A. ranks 46 with a score of 74.4
India ranks 109 with a score of 64.0
(up 12 places from rank 121 in 2021) Source https://dashboards.sdgindex.org/chapters/part-2-the-sdg-index-and-dashboards<br>
India ranks 109 with a score of 64.0
(up 12 places from rank 121 in 2021) Source https://dashboards.sdgindex.org/chapters/part-2-the-sdg-index-and-dashboards<br>
21
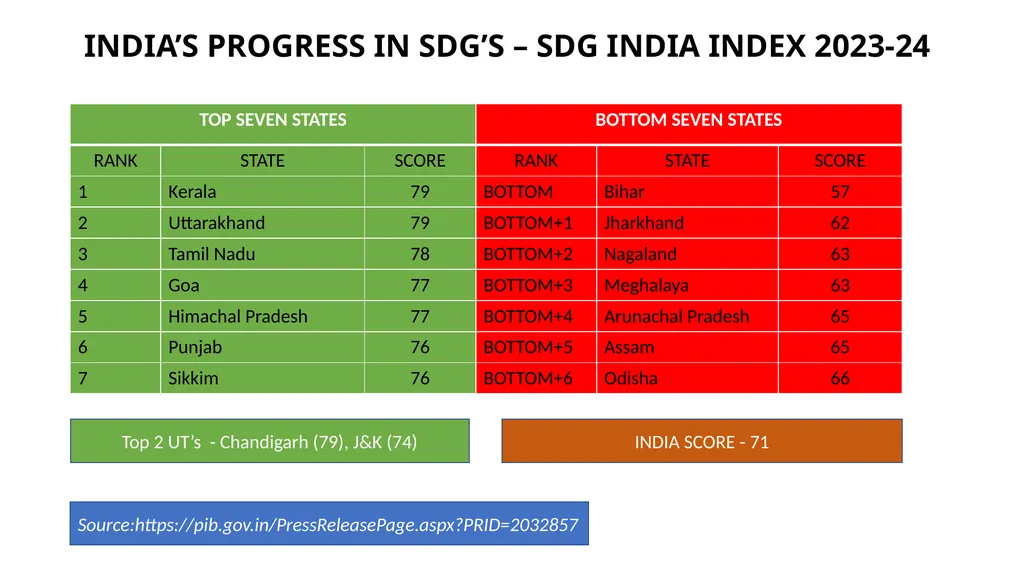
INDIA’S PROGRESS IN SDG’S – SDG INDIA INDEX 2023-24 Top 2 UT’s - Chandigarh (79), J&K (74) INDIA SCORE - 71 Source:https://pib.gov.in/PressReleasePage.aspx?PRID=2032857<br>
22
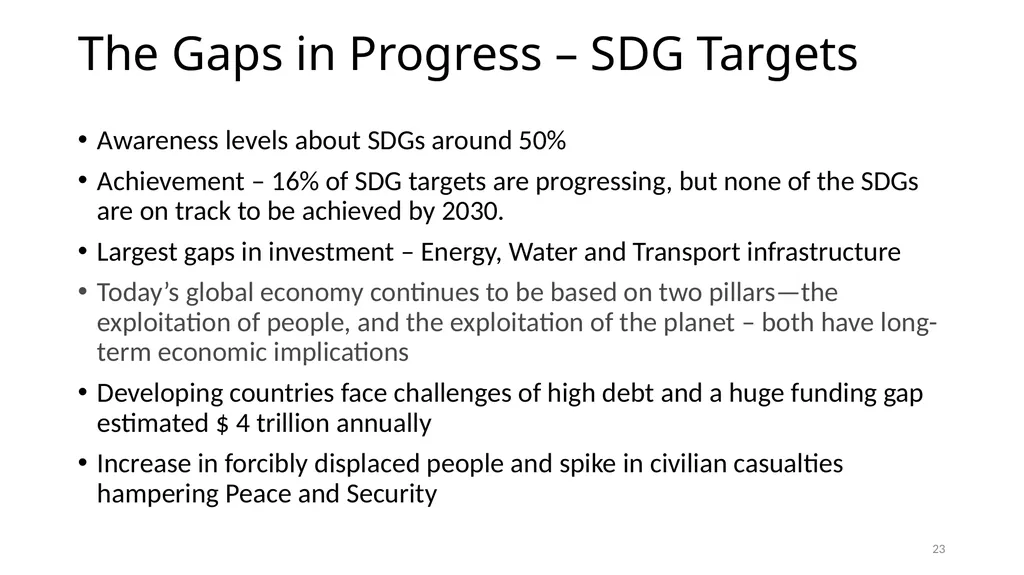
The Gaps in Progress – SDG Targets Awareness levels about SDGs around 50%
Achievement – 16% of SDG targets are progressing, but none of the SDGs are on track to be achieved by 2030.
Largest gaps in investment – Energy, Water and Transport infrastructure
Today’s global economy continues to be based on two pillars—the exploitation of people, and the exploitation of the planet – both have long-term economic implications
Developing countries face challenges of high debt and a huge funding gap estimated $ 4 trillion annually
Increase in forcibly displaced people and spike in civilian casualties hampering Peace and Security 23<br>
Achievement – 16% of SDG targets are progressing, but none of the SDGs are on track to be achieved by 2030.
Largest gaps in investment – Energy, Water and Transport infrastructure
Today’s global economy continues to be based on two pillars—the exploitation of people, and the exploitation of the planet – both have long-term economic implications
Developing countries face challenges of high debt and a huge funding gap estimated $ 4 trillion annually
Increase in forcibly displaced people and spike in civilian casualties hampering Peace and Security 23<br>
23
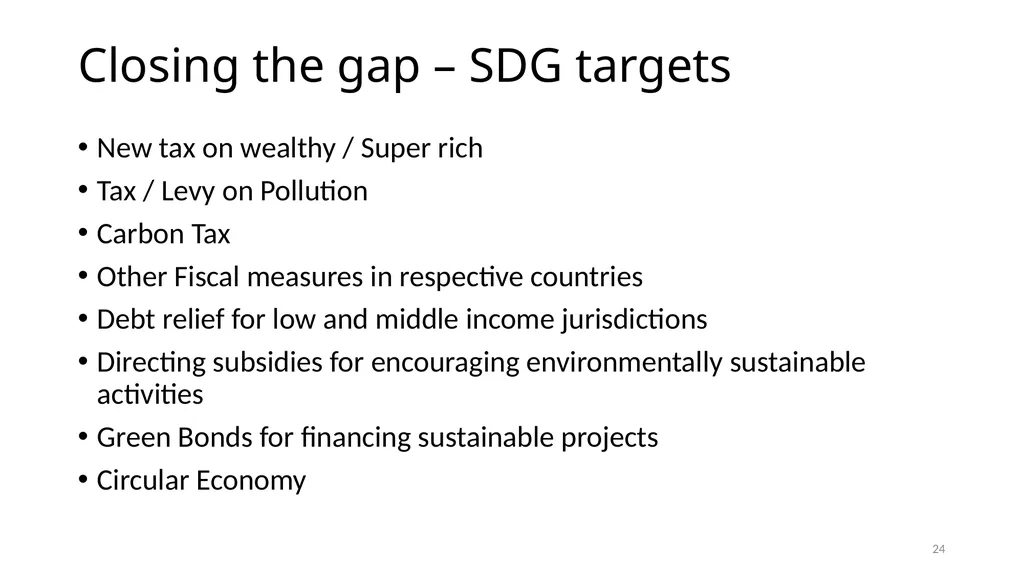
Closing the gap – SDG targets New tax on wealthy / Super rich
Tax / Levy on Pollution
Carbon Tax
Other Fiscal measures in respective countries
Debt relief for low and middle income jurisdictions
Directing subsidies for encouraging environmentally sustainable activities
Green Bonds for financing sustainable projects
Circular Economy 24<br>
Tax / Levy on Pollution
Carbon Tax
Other Fiscal measures in respective countries
Debt relief for low and middle income jurisdictions
Directing subsidies for encouraging environmentally sustainable activities
Green Bonds for financing sustainable projects
Circular Economy 24<br>
24
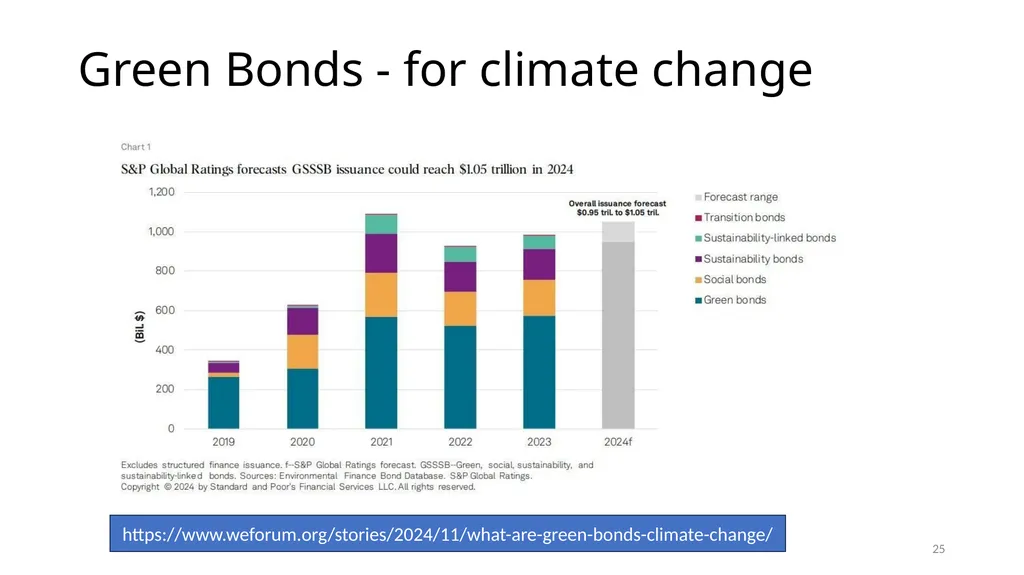
Green Bonds - for climate change https://www.weforum.org/stories/2024/11/what-are-green-bonds-climate-change/ 25<br>
25
LIFE CYCLE ASSESSMENT,
CIRCULAR ECONOMY
&
ESG MATURITY<br>
26
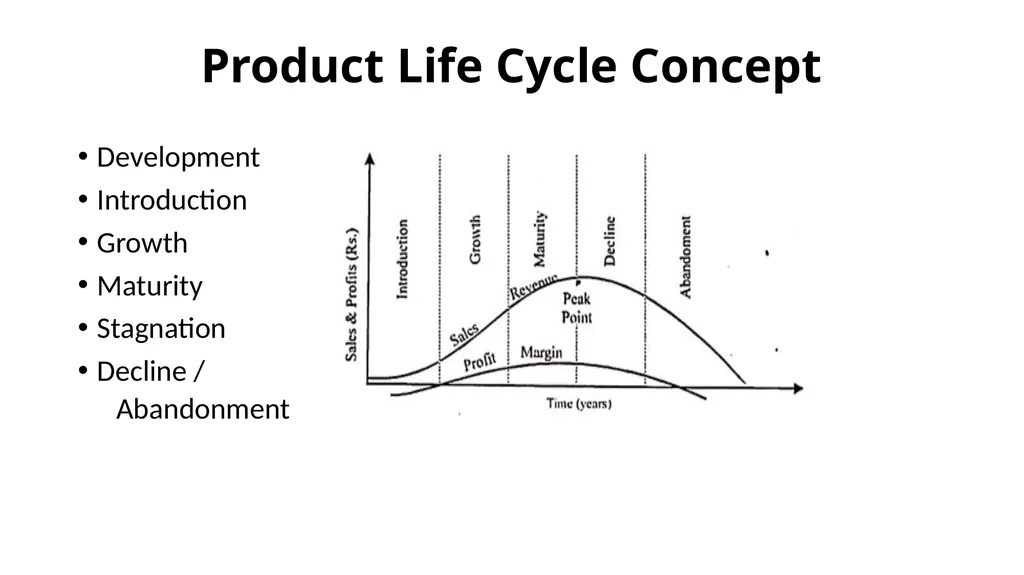
Product Life Cycle Concept Development
Introduction
Growth
Maturity
Stagnation
Decline /
Abandonment<br>
Introduction
Growth
Maturity
Stagnation
Decline /
Abandonment<br>
27
What is Life Cycle Assessment (LCA) LCA is a tool for identifying or comparing the environmental impacts of a product or industrial activity by quantifying all material flows and assessing how they interact with the natural environment
LCA helps to make Sustainability more concrete and actionable through the scientific measurement of environmental impacts.
In LCA, metrics are set to quantify the different inputs (e.g., energy, water, resources, land) and outputs (e.g., emissions, wastes, products) that occur throughout the life cycle of an industrial process, technology, or commodity. 28<br>
LCA helps to make Sustainability more concrete and actionable through the scientific measurement of environmental impacts.
In LCA, metrics are set to quantify the different inputs (e.g., energy, water, resources, land) and outputs (e.g., emissions, wastes, products) that occur throughout the life cycle of an industrial process, technology, or commodity. 28<br>
28
Life Cycle Assessment – ESG Concept Life Cycle Assessment (LCA) is a standardized method to evaluate the environmental consequences of a product or activity across its entire life.
Assessing a product’s life cycle includes examining
-human impacts
-energy
-materials
-waste
at each stage of a product’s life cycle from cradle (the inception of the idea, Design) to the grave (disposal).<br>
Assessing a product’s life cycle includes examining
-human impacts
-energy
-materials
-waste
at each stage of a product’s life cycle from cradle (the inception of the idea, Design) to the grave (disposal).<br>
29
Stages in Product Life Cycle – ESG Perspective Also called “Cradle to Grave” concept of Product Life Cycle
Five Stages:
Raw Material Extraction
Manufacturing & Processing
Transportation
Usage & Retail
Waste Disposal<br>
Five Stages:
Raw Material Extraction
Manufacturing & Processing
Transportation
Usage & Retail
Waste Disposal<br>
30
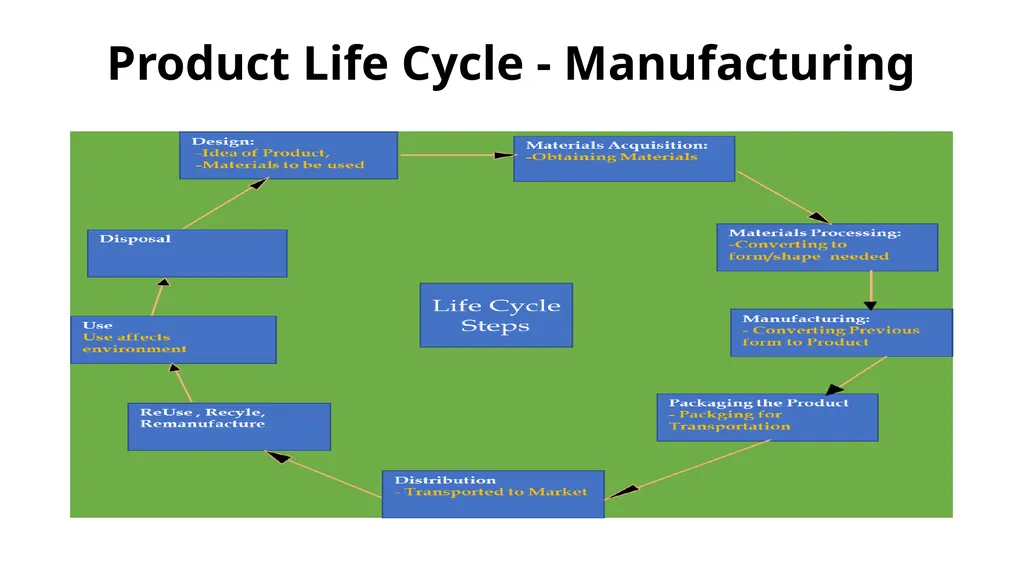
Product Life Cycle - Manufacturing<br>
31
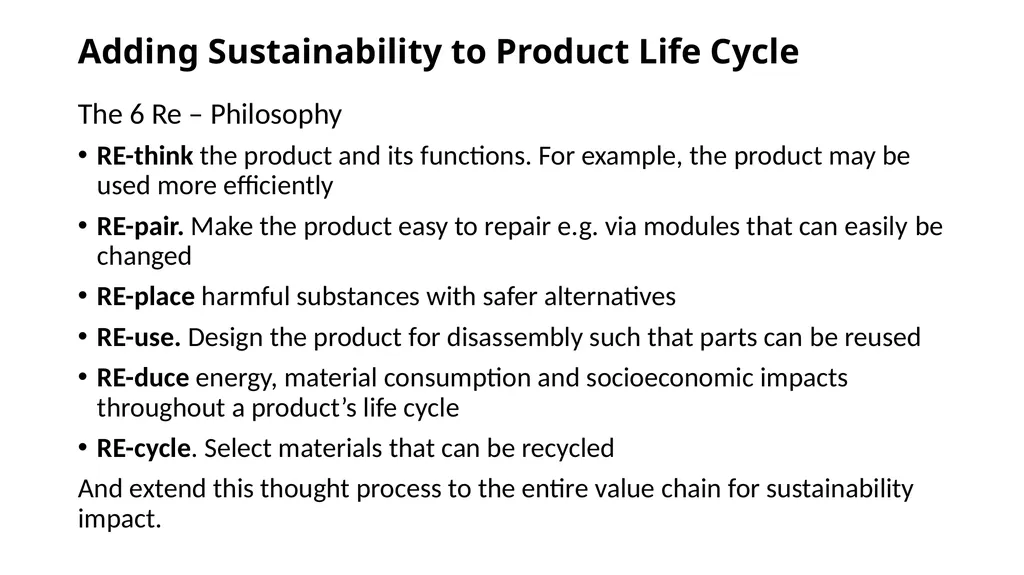
Adding Sustainability to Product Life Cycle The 6 Re – Philosophy
RE-think the product and its functions. For example, the product may be used more efficiently
RE-pair. Make the product easy to repair e.g. via modules that can easily be changed
RE-place harmful substances with safer alternatives
RE-use. Design the product for disassembly such that parts can be reused
RE-duce energy, material consumption and socioeconomic impacts throughout a product’s life cycle
RE-cycle. Select materials that can be recycled
And extend this thought process to the entire value chain for sustainability impact.<br>
RE-think the product and its functions. For example, the product may be used more efficiently
RE-pair. Make the product easy to repair e.g. via modules that can easily be changed
RE-place harmful substances with safer alternatives
RE-use. Design the product for disassembly such that parts can be reused
RE-duce energy, material consumption and socioeconomic impacts throughout a product’s life cycle
RE-cycle. Select materials that can be recycled
And extend this thought process to the entire value chain for sustainability impact.<br>
32
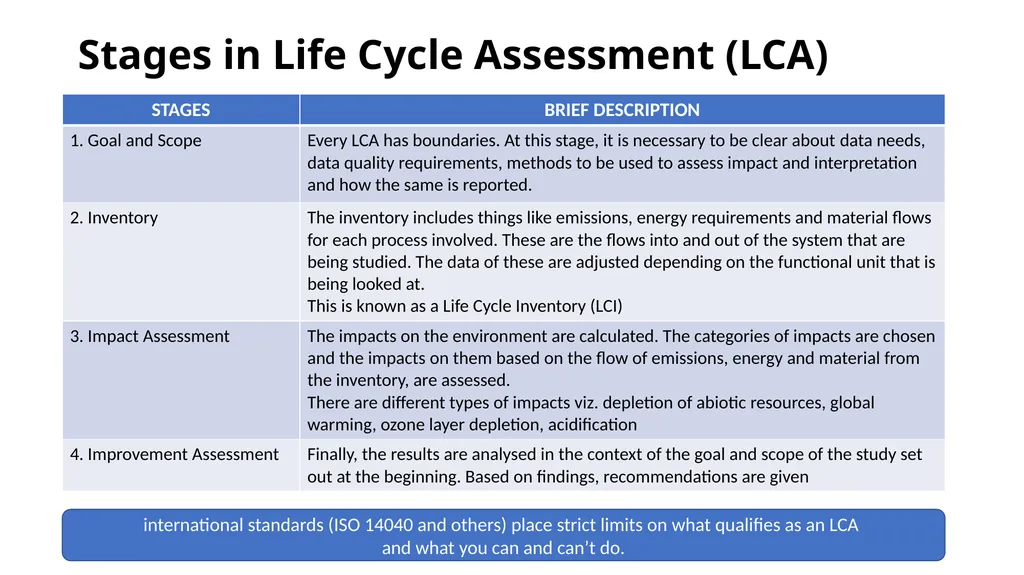
Stages in Life Cycle Assessment (LCA) international standards (ISO 14040 and others) place strict limits on what qualifies as an LCA
and what you can and can’t do.<br>
and what you can and can’t do.<br>
33
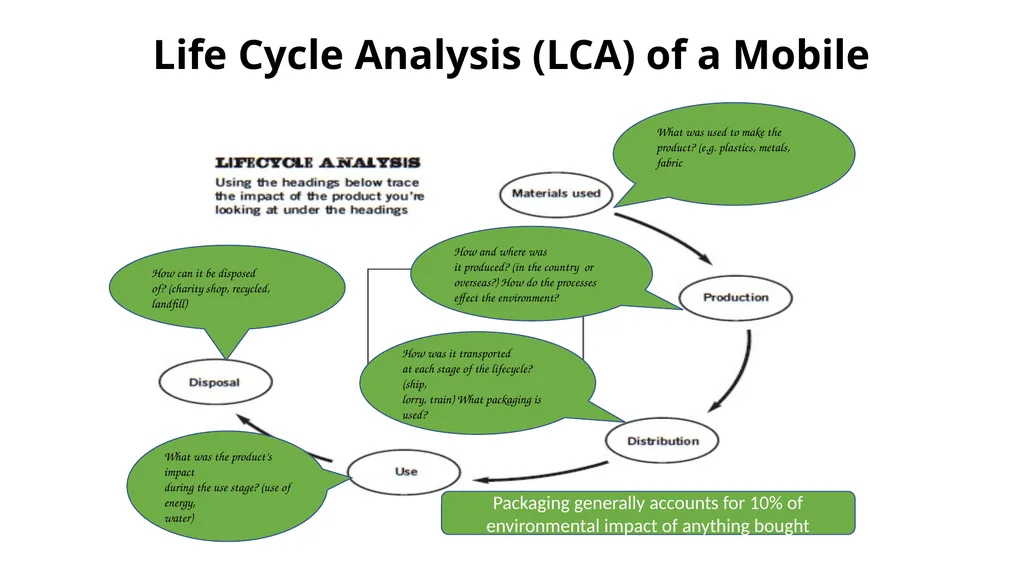
Life Cycle Analysis (LCA) of a Mobile What was used to make the product? (e.g. plastics, metals, fabric How and where was
it produced? (in the country or overseas?) How do the processes effect the environment? How was it transported
at each stage of the lifecycle? (ship,
lorry, train) What packaging is used? What was the product’s impact
during the use stage? (use of energy,
water) How can it be disposed
of? (charity shop, recycled, landfill) Packaging generally accounts for 10% of environmental impact of anything bought<br>
it produced? (in the country or overseas?) How do the processes effect the environment? How was it transported
at each stage of the lifecycle? (ship,
lorry, train) What packaging is used? What was the product’s impact
during the use stage? (use of energy,
water) How can it be disposed
of? (charity shop, recycled, landfill) Packaging generally accounts for 10% of environmental impact of anything bought<br>
34
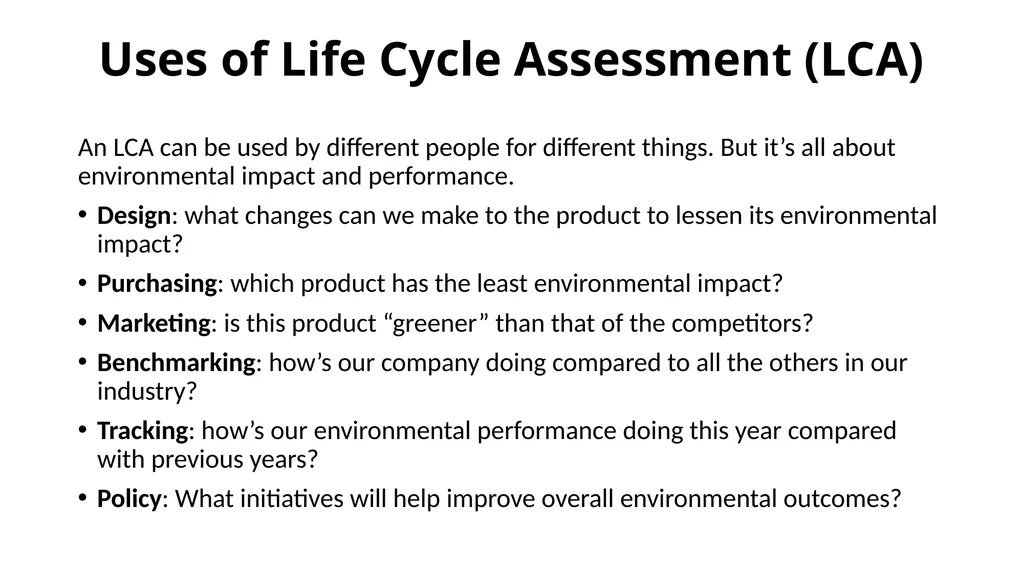
Uses of Life Cycle Assessment (LCA) An LCA can be used by different people for different things. But it’s all about environmental impact and performance.
Design: what changes can we make to the product to lessen its environmental impact?
Purchasing: which product has the least environmental impact?
Marketing: is this product “greener” than that of the competitors?
Benchmarking: how’s our company doing compared to all the others in our industry?
Tracking: how’s our environmental performance doing this year compared with previous years?
Policy: What initiatives will help improve overall environmental outcomes?<br>
Design: what changes can we make to the product to lessen its environmental impact?
Purchasing: which product has the least environmental impact?
Marketing: is this product “greener” than that of the competitors?
Benchmarking: how’s our company doing compared to all the others in our industry?
Tracking: how’s our environmental performance doing this year compared with previous years?
Policy: What initiatives will help improve overall environmental outcomes?<br>
35
CIRCULAR ECONOMY 36<br>
36
Problem with the linear economy According to a report only 9% of the world is circular. Our current economy is hardly sustainable and follows a linear model.
The core tenets of the linear economy include the wasteful take of resources – make use of said resources, which further generates waste that is then disposed.
This vicious practice is detrimental to the environment, which cannot supply the growing populace of our planet with essential services, and naturally leads to strained profitability.
Planetary boundaries, a concept given by Rockstrom in his paper, is a measure of human impact on the ecosystem.
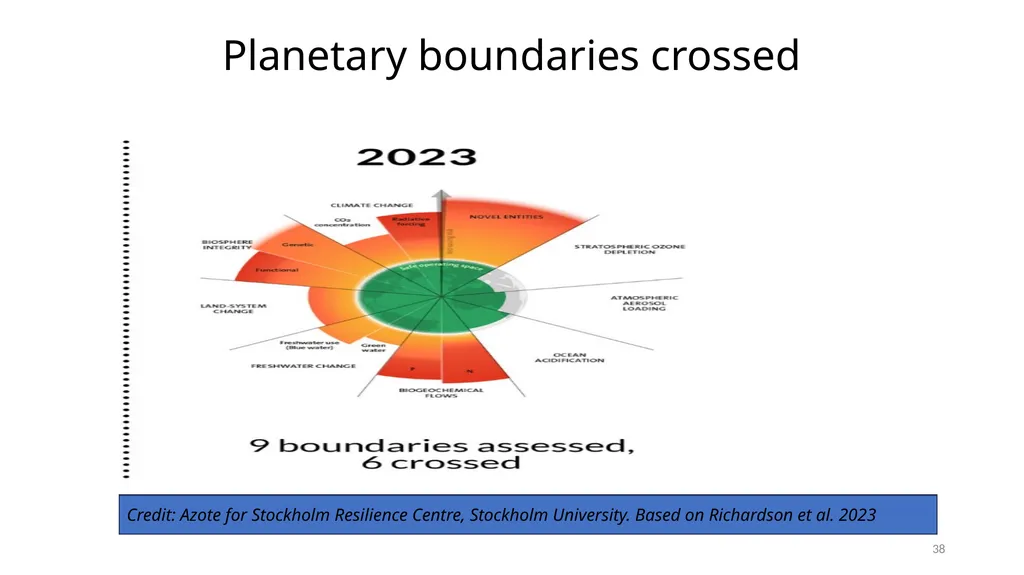
In 2023, according to Stockholm Research Centre, six of the nine planetary boundaries have been crossed:
https://ic-ce.com/article-circular-economy-and-sustainability/ 37<br>
The core tenets of the linear economy include the wasteful take of resources – make use of said resources, which further generates waste that is then disposed.
This vicious practice is detrimental to the environment, which cannot supply the growing populace of our planet with essential services, and naturally leads to strained profitability.
Planetary boundaries, a concept given by Rockstrom in his paper, is a measure of human impact on the ecosystem.
In 2023, according to Stockholm Research Centre, six of the nine planetary boundaries have been crossed:
https://ic-ce.com/article-circular-economy-and-sustainability/ 37<br>
37
Planetary boundaries crossed 38 Credit: Azote for Stockholm Resilience Centre, Stockholm University. Based on Richardson et al. 2023<br>
38
Concept of Circular Economy (CE) An industrial system that is restorative or regenerative by intention and design replaces the end-of-life (EOL) concept with restoration, shifting to renewable energy, and eliminating toxic chemicals, which impair reuse.
It aims to eliminate waste through the superior design of materials, products, systems, and related business models
Ultimately, CE is not the goal but rather a tool or mechanism to achieve other sustainability goals 39<br>
It aims to eliminate waste through the superior design of materials, products, systems, and related business models
Ultimately, CE is not the goal but rather a tool or mechanism to achieve other sustainability goals 39<br>
39
Three Principles on which CE is based Eliminate waste and pollution
Circulate products and materials at their highest value
Regenerate nature Underpinned by a transition to renewable energy and materials, the circular economy is a resilient system that is good for business, people, and the environment. 40<br>
Circulate products and materials at their highest value
Regenerate nature Underpinned by a transition to renewable energy and materials, the circular economy is a resilient system that is good for business, people, and the environment. 40<br>
40
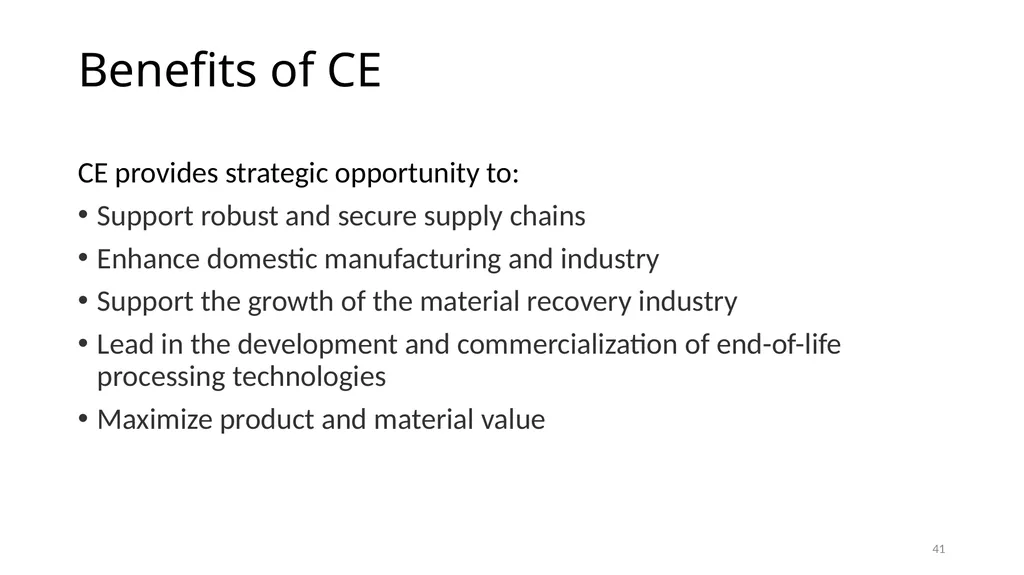
Benefits of CE CE provides strategic opportunity to:
Support robust and secure supply chains
Enhance domestic manufacturing and industry
Support the growth of the material recovery industry
Lead in the development and commercialization of end-of-life processing technologies
Maximize product and material value 41<br>
Support robust and secure supply chains
Enhance domestic manufacturing and industry
Support the growth of the material recovery industry
Lead in the development and commercialization of end-of-life processing technologies
Maximize product and material value 41<br>
41
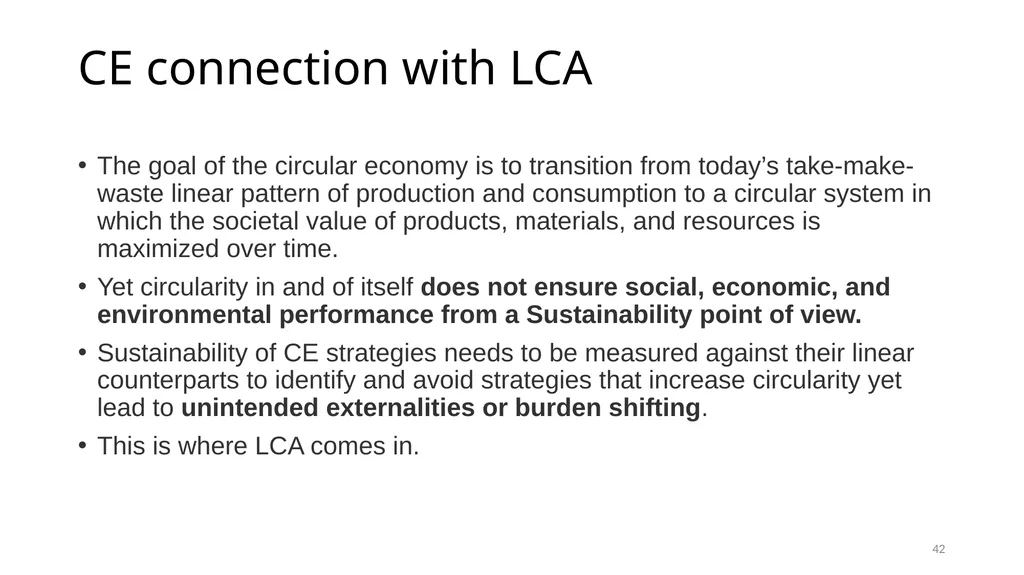
CE connection with LCA The goal of the circular economy is to transition from today’s take-make-waste linear pattern of production and consumption to a circular system in which the societal value of products, materials, and resources is maximized over time.
Yet circularity in and of itself does not ensure social, economic, and environmental performance from a Sustainability point of view.
Sustainability of CE strategies needs to be measured against their linear counterparts to identify and avoid strategies that increase circularity yet lead to unintended externalities or burden shifting.
This is where LCA comes in. 42<br>
Yet circularity in and of itself does not ensure social, economic, and environmental performance from a Sustainability point of view.
Sustainability of CE strategies needs to be measured against their linear counterparts to identify and avoid strategies that increase circularity yet lead to unintended externalities or burden shifting.
This is where LCA comes in. 42<br>
42
ESG MATURITY<br>
43
Phases of ESG Maturity<br>
44
BUSINESS RESPONSIBILITY &
SUSTAINABILITY REPORTING
(BRSR)<br>
45
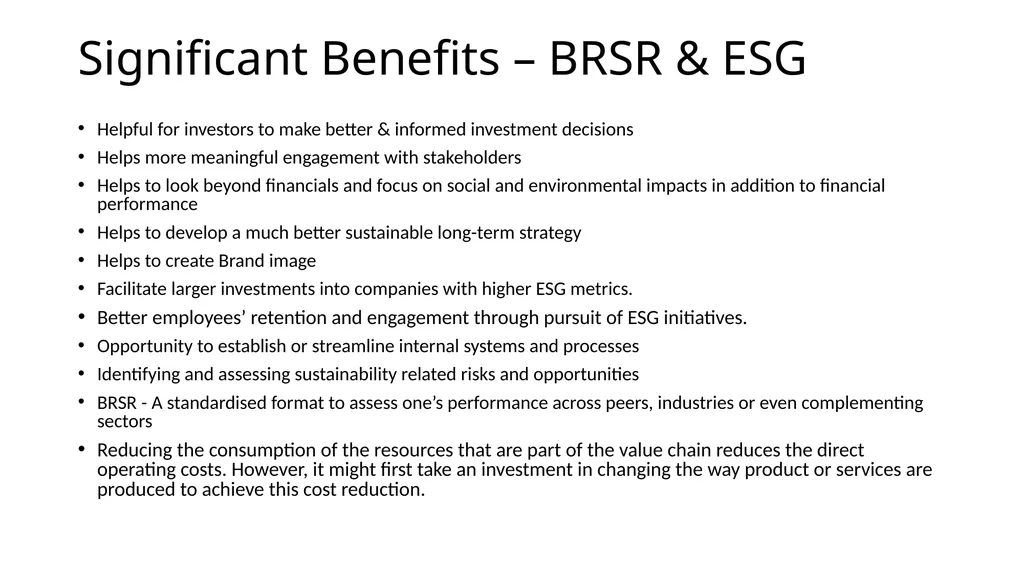
Significant Benefits – BRSR & ESG Helpful for investors to make better & informed investment decisions
Helps more meaningful engagement with stakeholders
Helps to look beyond financials and focus on social and environmental impacts in addition to financial performance
Helps to develop a much better sustainable long-term strategy
Helps to create Brand image
Facilitate larger investments into companies with higher ESG metrics.
Better employees’ retention and engagement through pursuit of ESG initiatives.
Opportunity to establish or streamline internal systems and processes
Identifying and assessing sustainability related risks and opportunities
BRSR - A standardised format to assess one’s performance across peers, industries or even complementing sectors
Reducing the consumption of the resources that are part of the value chain reduces the direct operating costs. However, it might first take an investment in changing the way product or services are produced to achieve this cost reduction.<br>
Helps more meaningful engagement with stakeholders
Helps to look beyond financials and focus on social and environmental impacts in addition to financial performance
Helps to develop a much better sustainable long-term strategy
Helps to create Brand image
Facilitate larger investments into companies with higher ESG metrics.
Better employees’ retention and engagement through pursuit of ESG initiatives.
Opportunity to establish or streamline internal systems and processes
Identifying and assessing sustainability related risks and opportunities
BRSR - A standardised format to assess one’s performance across peers, industries or even complementing sectors
Reducing the consumption of the resources that are part of the value chain reduces the direct operating costs. However, it might first take an investment in changing the way product or services are produced to achieve this cost reduction.<br>
46
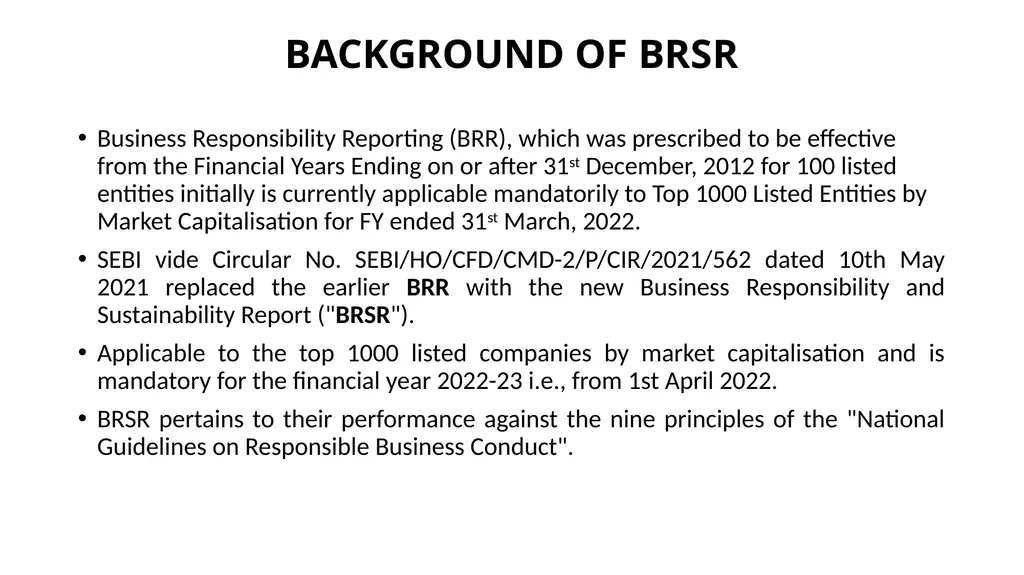
BACKGROUND OF BRSR Business Responsibility Reporting (BRR), which was prescribed to be effective from the Financial Years Ending on or after 31st December, 2012 for 100 listed entities initially is currently applicable mandatorily to Top 1000 Listed Entities by Market Capitalisation for FY ended 31st March, 2022.
SEBI vide Circular No. SEBI/HO/CFD/CMD-2/P/CIR/2021/562 dated 10th May 2021 replaced the earlier BRR with the new Business Responsibility and Sustainability Report ("BRSR").
Applicable to the top 1000 listed companies by market capitalisation and is mandatory for the financial year 2022-23 i.e., from 1st April 2022.
BRSR pertains to their performance against the nine principles of the "National Guidelines on Responsible Business Conduct".<br>
SEBI vide Circular No. SEBI/HO/CFD/CMD-2/P/CIR/2021/562 dated 10th May 2021 replaced the earlier BRR with the new Business Responsibility and Sustainability Report ("BRSR").
Applicable to the top 1000 listed companies by market capitalisation and is mandatory for the financial year 2022-23 i.e., from 1st April 2022.
BRSR pertains to their performance against the nine principles of the "National Guidelines on Responsible Business Conduct".<br>
47
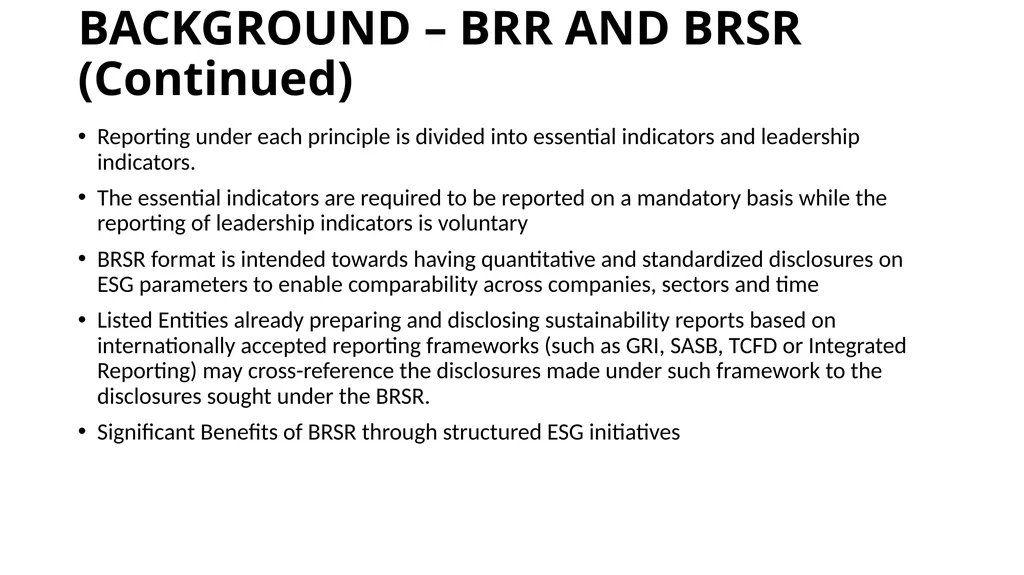
BACKGROUND – BRR AND BRSR (Continued) Reporting under each principle is divided into essential indicators and leadership indicators.
The essential indicators are required to be reported on a mandatory basis while the reporting of leadership indicators is voluntary
BRSR format is intended towards having quantitative and standardized disclosures on ESG parameters to enable comparability across companies, sectors and time
Listed Entities already preparing and disclosing sustainability reports based on internationally accepted reporting frameworks (such as GRI, SASB, TCFD or Integrated Reporting) may cross-reference the disclosures made under such framework to the disclosures sought under the BRSR.
Significant Benefits of BRSR through structured ESG initiatives<br>
The essential indicators are required to be reported on a mandatory basis while the reporting of leadership indicators is voluntary
BRSR format is intended towards having quantitative and standardized disclosures on ESG parameters to enable comparability across companies, sectors and time
Listed Entities already preparing and disclosing sustainability reports based on internationally accepted reporting frameworks (such as GRI, SASB, TCFD or Integrated Reporting) may cross-reference the disclosures made under such framework to the disclosures sought under the BRSR.
Significant Benefits of BRSR through structured ESG initiatives<br>
48
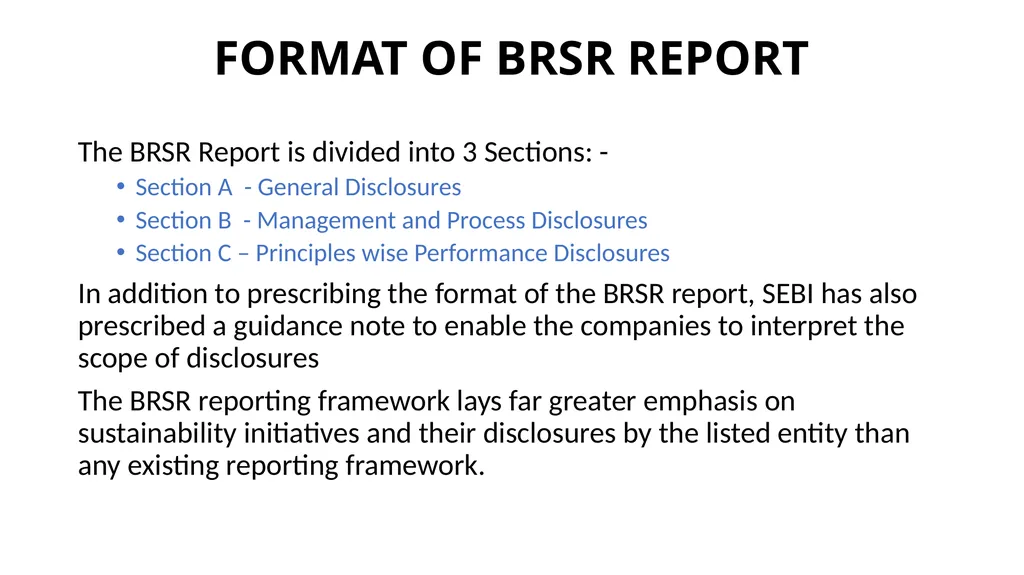
FORMAT OF BRSR REPORT The BRSR Report is divided into 3 Sections: -
Section A - General Disclosures
Section B - Management and Process Disclosures
Section C – Principles wise Performance Disclosures
In addition to prescribing the format of the BRSR report, SEBI has also prescribed a guidance note to enable the companies to interpret the scope of disclosures
The BRSR reporting framework lays far greater emphasis on sustainability initiatives and their disclosures by the listed entity than any existing reporting framework.<br>
Section A - General Disclosures
Section B - Management and Process Disclosures
Section C – Principles wise Performance Disclosures
In addition to prescribing the format of the BRSR report, SEBI has also prescribed a guidance note to enable the companies to interpret the scope of disclosures
The BRSR reporting framework lays far greater emphasis on sustainability initiatives and their disclosures by the listed entity than any existing reporting framework.<br>
49
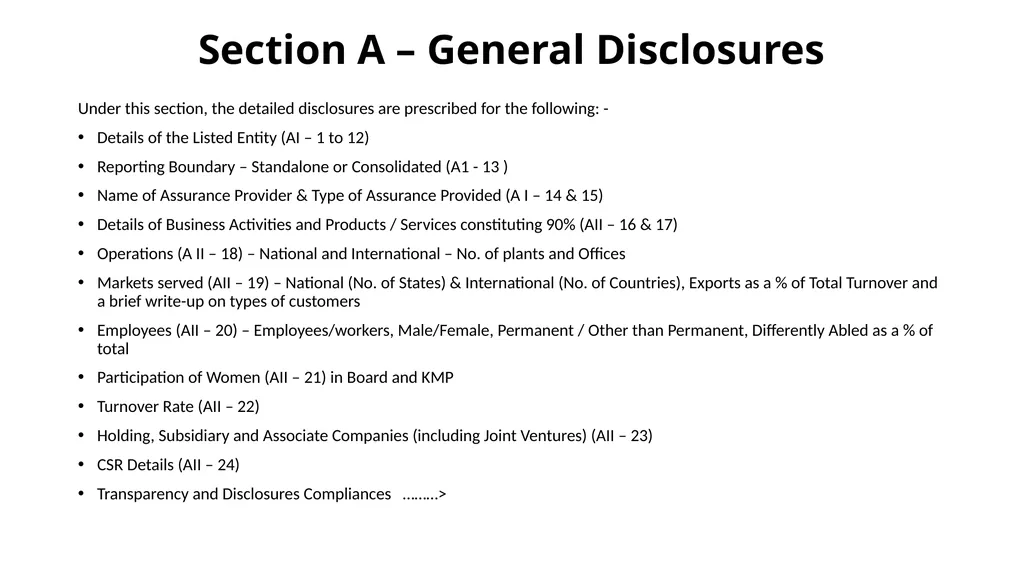
Section A – General Disclosures Under this section, the detailed disclosures are prescribed for the following: -
Details of the Listed Entity (AI – 1 to 12)
Reporting Boundary – Standalone or Consolidated (A1 - 13 )
Name of Assurance Provider & Type of Assurance Provided (A I – 14 & 15)
Details of Business Activities and Products / Services constituting 90% (AII – 16 & 17)
Operations (A II – 18) – National and International – No. of plants and Offices
Markets served (AII – 19) – National (No. of States) & International (No. of Countries), Exports as a % of Total Turnover and a brief write-up on types of customers
Employees (AII – 20) – Employees/workers, Male/Female, Permanent / Other than Permanent, Differently Abled as a % of total
Participation of Women (AII – 21) in Board and KMP
Turnover Rate (AII – 22)
Holding, Subsidiary and Associate Companies (including Joint Ventures) (AII – 23)
CSR Details (AII – 24)
Transparency and Disclosures Compliances ………><br>
Details of the Listed Entity (AI – 1 to 12)
Reporting Boundary – Standalone or Consolidated (A1 - 13 )
Name of Assurance Provider & Type of Assurance Provided (A I – 14 & 15)
Details of Business Activities and Products / Services constituting 90% (AII – 16 & 17)
Operations (A II – 18) – National and International – No. of plants and Offices
Markets served (AII – 19) – National (No. of States) & International (No. of Countries), Exports as a % of Total Turnover and a brief write-up on types of customers
Employees (AII – 20) – Employees/workers, Male/Female, Permanent / Other than Permanent, Differently Abled as a % of total
Participation of Women (AII – 21) in Board and KMP
Turnover Rate (AII – 22)
Holding, Subsidiary and Associate Companies (including Joint Ventures) (AII – 23)
CSR Details (AII – 24)
Transparency and Disclosures Compliances ………><br>
50
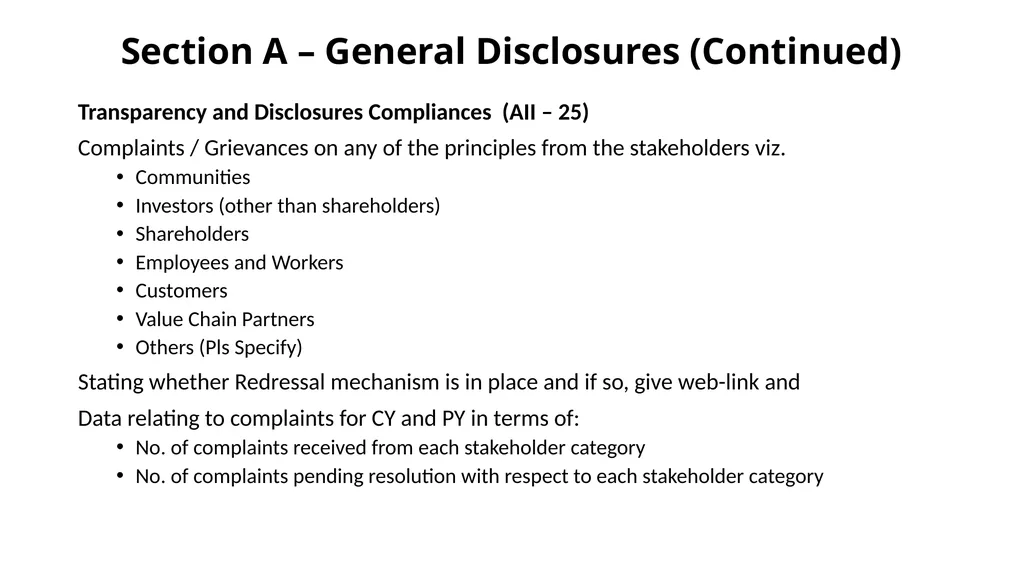
Section A – General Disclosures (Continued) Transparency and Disclosures Compliances (AII – 25)
Complaints / Grievances on any of the principles from the stakeholders viz.
Communities
Investors (other than shareholders)
Shareholders
Employees and Workers
Customers
Value Chain Partners
Others (Pls Specify)
Stating whether Redressal mechanism is in place and if so, give web-link and
Data relating to complaints for CY and PY in terms of:
No. of complaints received from each stakeholder category
No. of complaints pending resolution with respect to each stakeholder category<br>
Complaints / Grievances on any of the principles from the stakeholders viz.
Communities
Investors (other than shareholders)
Shareholders
Employees and Workers
Customers
Value Chain Partners
Others (Pls Specify)
Stating whether Redressal mechanism is in place and if so, give web-link and
Data relating to complaints for CY and PY in terms of:
No. of complaints received from each stakeholder category
No. of complaints pending resolution with respect to each stakeholder category<br>
51
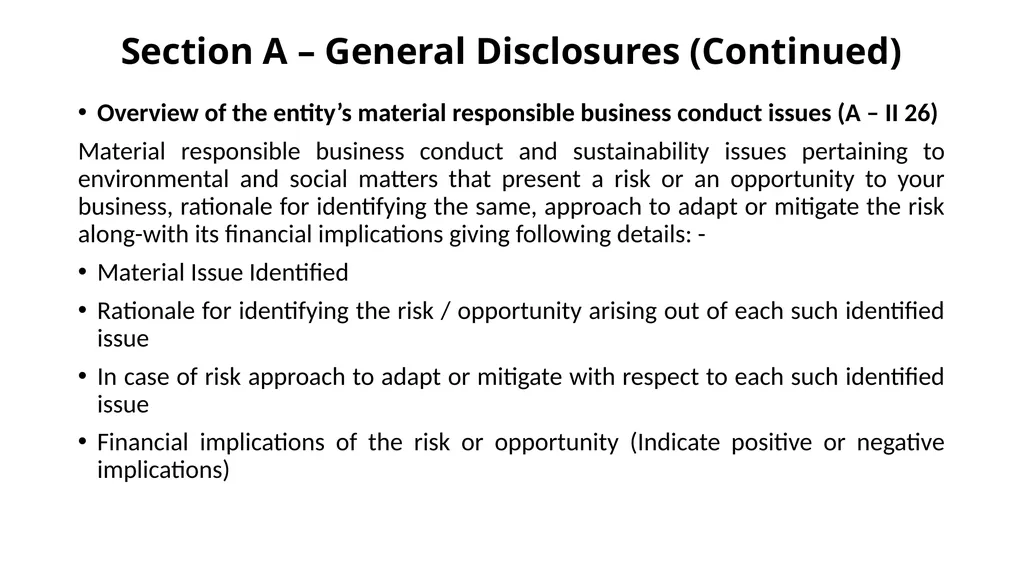
Section A – General Disclosures (Continued) Overview of the entity’s material responsible business conduct issues (A – II 26)
Material responsible business conduct and sustainability issues pertaining to environmental and social matters that present a risk or an opportunity to your business, rationale for identifying the same, approach to adapt or mitigate the risk along-with its financial implications giving following details: -
Material Issue Identified
Rationale for identifying the risk / opportunity arising out of each such identified issue
In case of risk approach to adapt or mitigate with respect to each such identified issue
Financial implications of the risk or opportunity (Indicate positive or negative implications)<br>
Material responsible business conduct and sustainability issues pertaining to environmental and social matters that present a risk or an opportunity to your business, rationale for identifying the same, approach to adapt or mitigate the risk along-with its financial implications giving following details: -
Material Issue Identified
Rationale for identifying the risk / opportunity arising out of each such identified issue
In case of risk approach to adapt or mitigate with respect to each such identified issue
Financial implications of the risk or opportunity (Indicate positive or negative implications)<br>
52
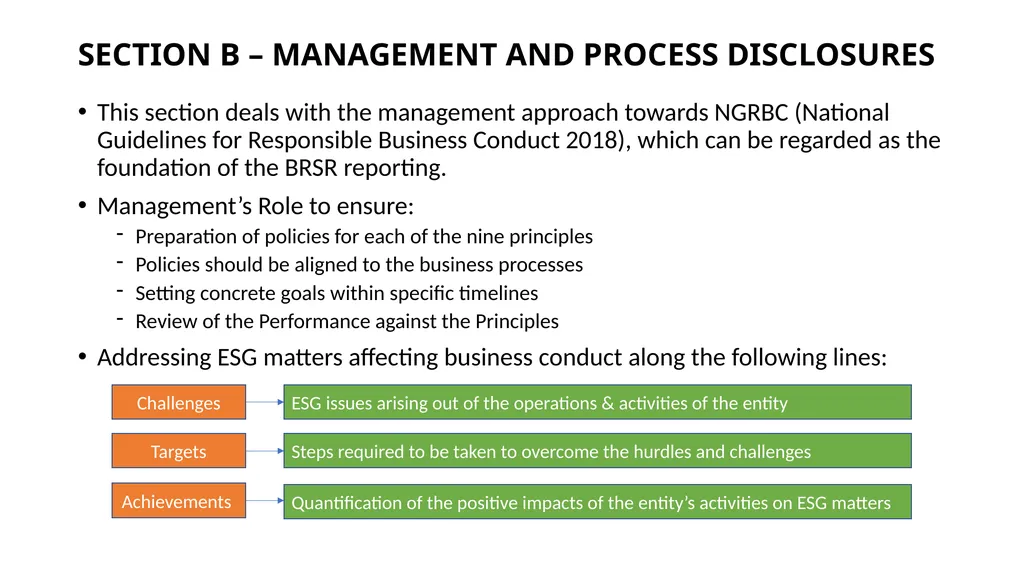
SECTION B – MANAGEMENT AND PROCESS DISCLOSURES This section deals with the management approach towards NGRBC (National Guidelines for Responsible Business Conduct 2018), which can be regarded as the foundation of the BRSR reporting.
Management’s Role to ensure:
Preparation of policies for each of the nine principles
Policies should be aligned to the business processes
Setting concrete goals within specific timelines
Review of the Performance against the Principles
Addressing ESG matters affecting business conduct along the following lines: Challenges Targets Achievements ESG issues arising out of the operations & activities of the entity Steps required to be taken to overcome the hurdles and challenges Quantification of the positive impacts of the entity’s activities on ESG matters<br>
Management’s Role to ensure:
Preparation of policies for each of the nine principles
Policies should be aligned to the business processes
Setting concrete goals within specific timelines
Review of the Performance against the Principles
Addressing ESG matters affecting business conduct along the following lines: Challenges Targets Achievements ESG issues arising out of the operations & activities of the entity Steps required to be taken to overcome the hurdles and challenges Quantification of the positive impacts of the entity’s activities on ESG matters<br>
53
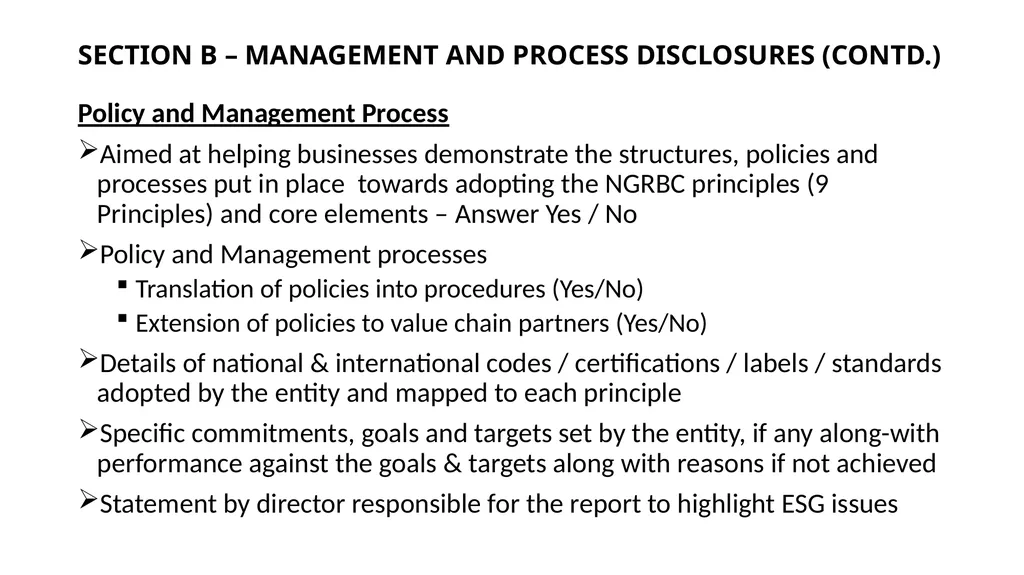
SECTION B – MANAGEMENT AND PROCESS DISCLOSURES (CONTD.) Policy and Management Process
Aimed at helping businesses demonstrate the structures, policies and processes put in place towards adopting the NGRBC principles (9 Principles) and core elements – Answer Yes / No
Policy and Management processes
Translation of policies into procedures (Yes/No)
Extension of policies to value chain partners (Yes/No)
Details of national & international codes / certifications / labels / standards adopted by the entity and mapped to each principle
Specific commitments, goals and targets set by the entity, if any along-with performance against the goals & targets along with reasons if not achieved
Statement by director responsible for the report to highlight ESG issues<br>
Aimed at helping businesses demonstrate the structures, policies and processes put in place towards adopting the NGRBC principles (9 Principles) and core elements – Answer Yes / No
Policy and Management processes
Translation of policies into procedures (Yes/No)
Extension of policies to value chain partners (Yes/No)
Details of national & international codes / certifications / labels / standards adopted by the entity and mapped to each principle
Specific commitments, goals and targets set by the entity, if any along-with performance against the goals & targets along with reasons if not achieved
Statement by director responsible for the report to highlight ESG issues<br>
54
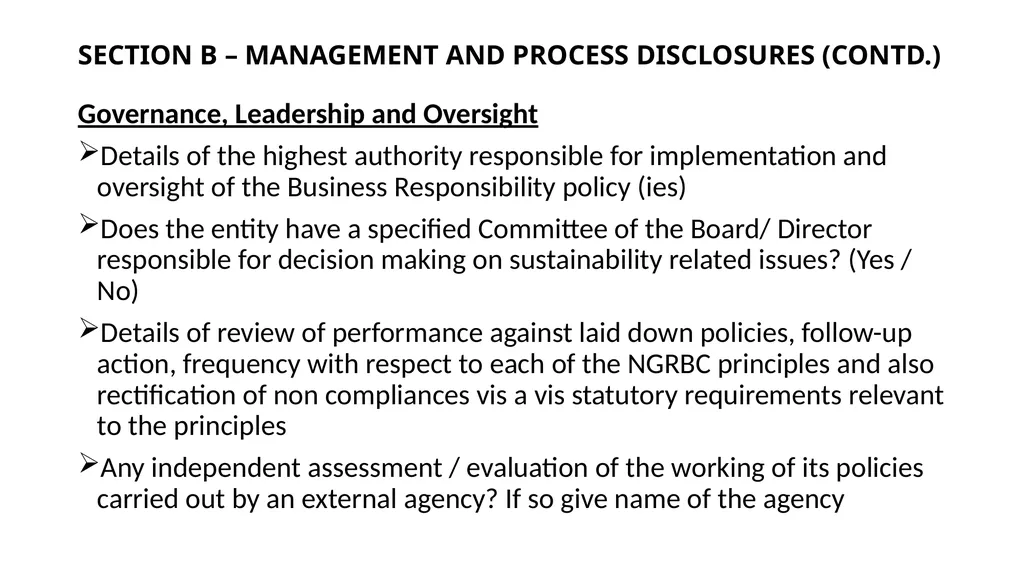
SECTION B – MANAGEMENT AND PROCESS DISCLOSURES (CONTD.) Governance, Leadership and Oversight
Details of the highest authority responsible for implementation and oversight of the Business Responsibility policy (ies)
Does the entity have a specified Committee of the Board/ Director responsible for decision making on sustainability related issues? (Yes / No)
Details of review of performance against laid down policies, follow-up action, frequency with respect to each of the NGRBC principles and also rectification of non compliances vis a vis statutory requirements relevant to the principles
Any independent assessment / evaluation of the working of its policies carried out by an external agency? If so give name of the agency<br>
Details of the highest authority responsible for implementation and oversight of the Business Responsibility policy (ies)
Does the entity have a specified Committee of the Board/ Director responsible for decision making on sustainability related issues? (Yes / No)
Details of review of performance against laid down policies, follow-up action, frequency with respect to each of the NGRBC principles and also rectification of non compliances vis a vis statutory requirements relevant to the principles
Any independent assessment / evaluation of the working of its policies carried out by an external agency? If so give name of the agency<br>
55
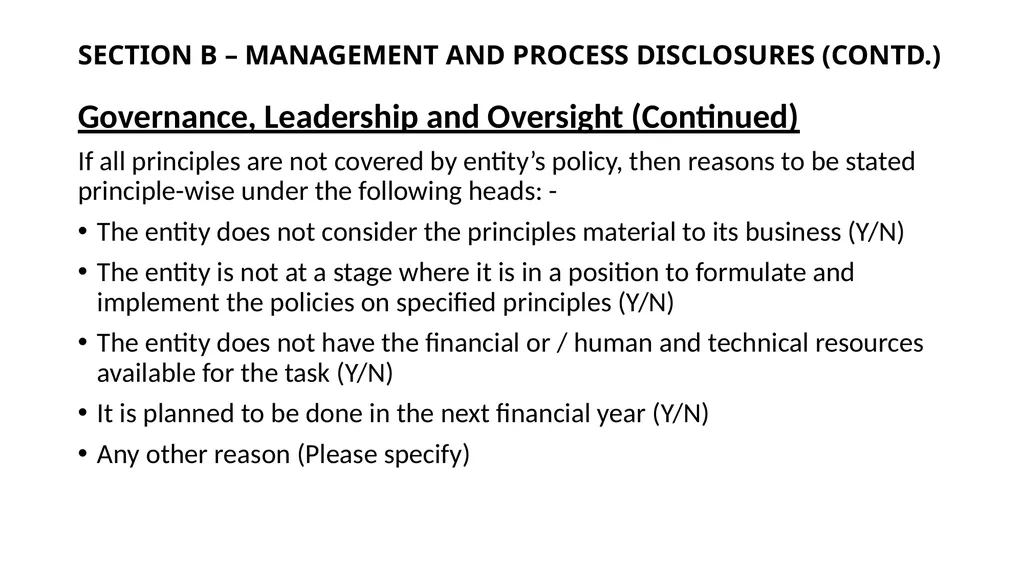
SECTION B – MANAGEMENT AND PROCESS DISCLOSURES (CONTD.) Governance, Leadership and Oversight (Continued)
If all principles are not covered by entity’s policy, then reasons to be stated principle-wise under the following heads: -
The entity does not consider the principles material to its business (Y/N)
The entity is not at a stage where it is in a position to formulate and implement the policies on specified principles (Y/N)
The entity does not have the financial or / human and technical resources available for the task (Y/N)
It is planned to be done in the next financial year (Y/N)
Any other reason (Please specify)<br>
If all principles are not covered by entity’s policy, then reasons to be stated principle-wise under the following heads: -
The entity does not consider the principles material to its business (Y/N)
The entity is not at a stage where it is in a position to formulate and implement the policies on specified principles (Y/N)
The entity does not have the financial or / human and technical resources available for the task (Y/N)
It is planned to be done in the next financial year (Y/N)
Any other reason (Please specify)<br>
56
THE NINE PRINCIPLES
AND
MAPPING WITH THE SDGs<br>
57
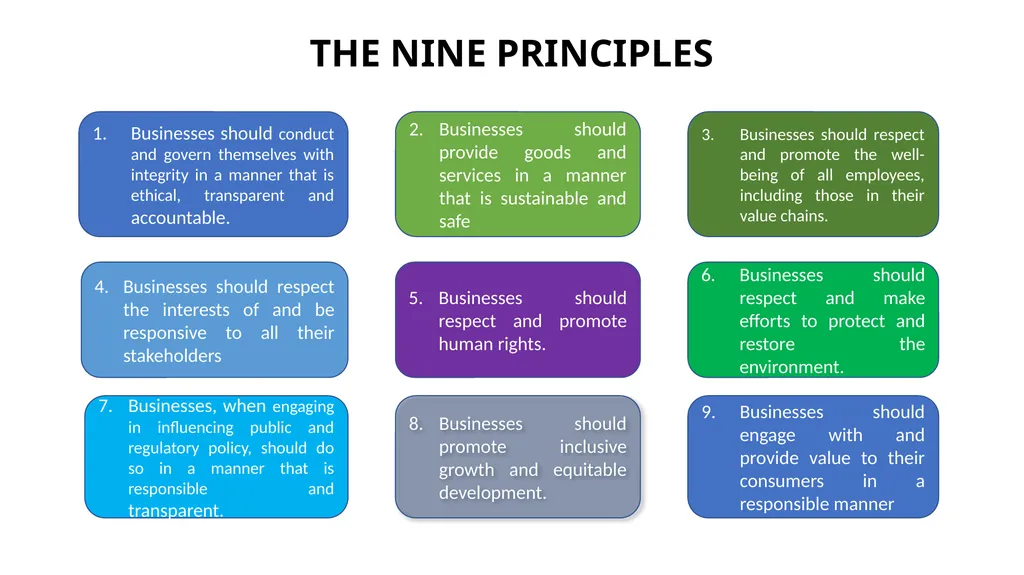
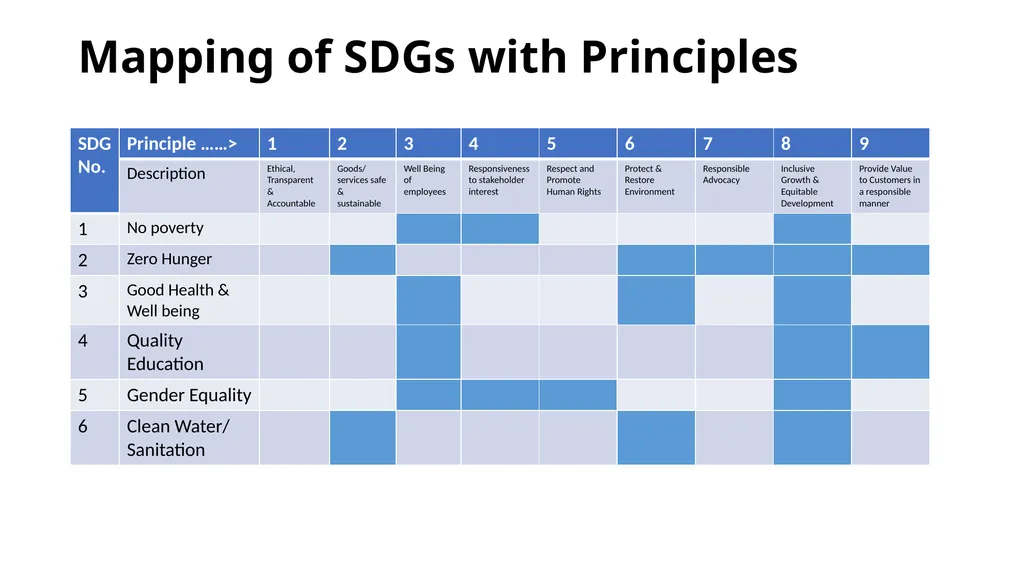
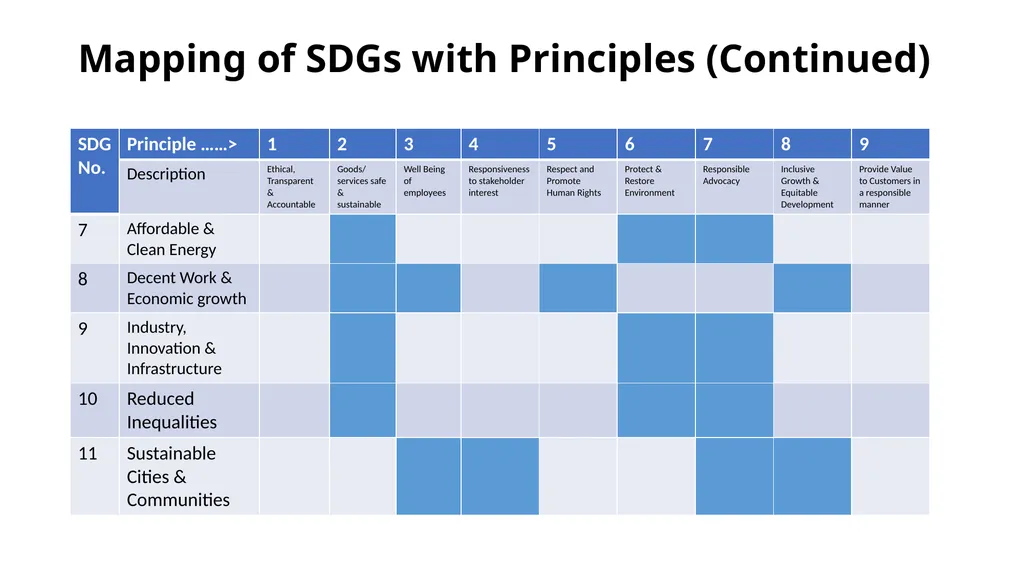
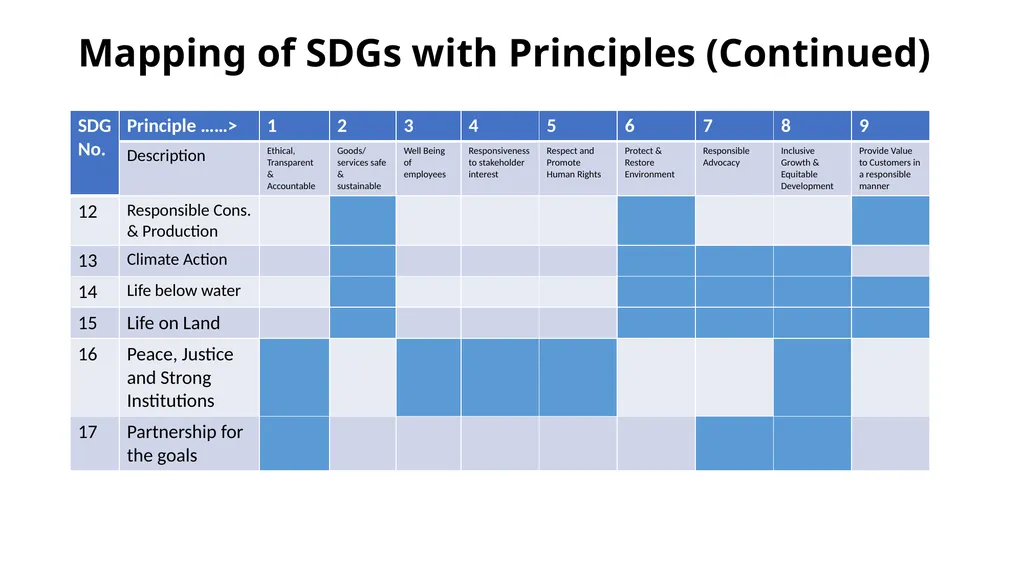
THE NINE PRINCIPLES Businesses should conduct and govern themselves with integrity in a manner that is ethical, transparent and accountable. Businesses should provide goods and services in a manner that is sustainable and safe Businesses should respect and promote the well-being of all employees, including those in their value chains. Businesses should respect the interests of and be responsive to all their stakeholders Businesses should respect and promote human rights. Businesses should respect and make efforts to protect and restore the environment. Businesses, when engaging in influencing public and regulatory policy, should do so in a manner that is responsible and transparent. Businesses should promote inclusive growth and equitable development. Businesses should engage with and provide value to their consumers in a responsible manner<br>
58
Mapping of SDGs with Principles<br>
59
Mapping of SDGs with Principles (Continued)<br>
60
Mapping of SDGs with Principles (Continued)<br>
61
PRINCIPLE-WISE
PERFORMANCE
DISCLOSURES<br>
62
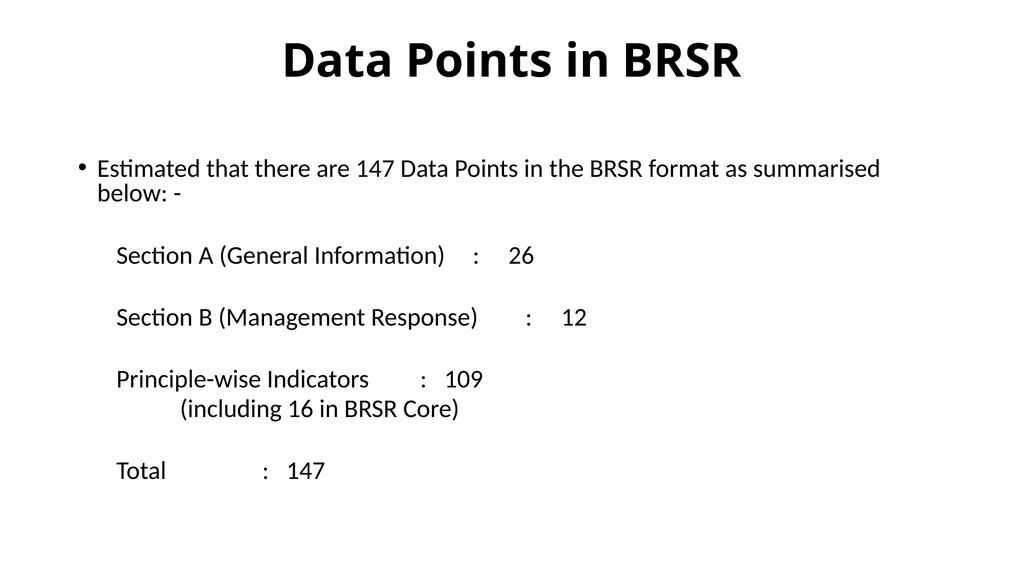
Data Points in BRSR Estimated that there are 147 Data Points in the BRSR format as summarised below: -
Section A (General Information) : 26
Section B (Management Response) : 12
Principle-wise Indicators : 109
(including 16 in BRSR Core)
Total : 147<br>
Section A (General Information) : 26
Section B (Management Response) : 12
Principle-wise Indicators : 109
(including 16 in BRSR Core)
Total : 147<br>
63
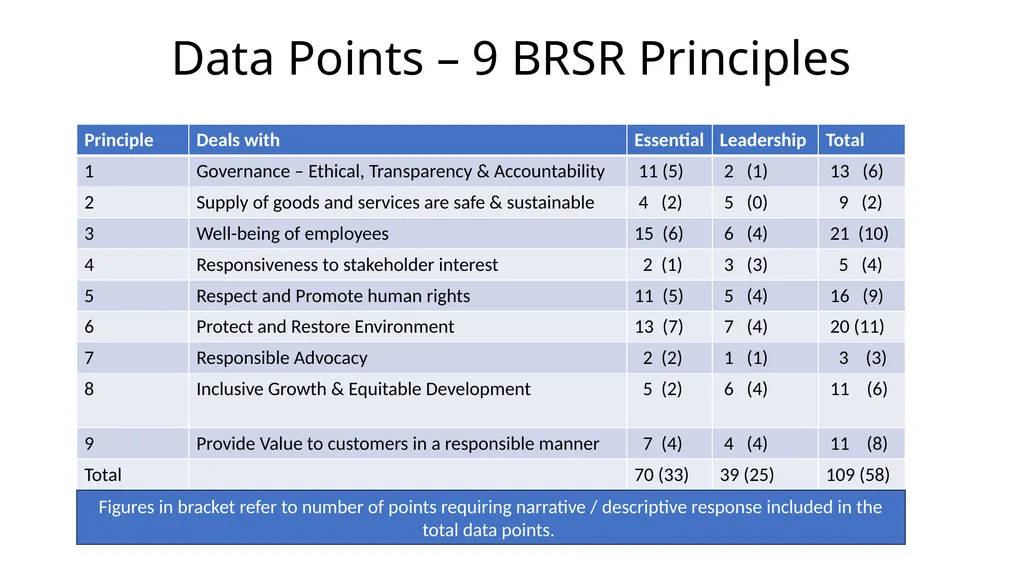
Data Points – 9 BRSR Principles Figures in bracket refer to number of points requiring narrative / descriptive response included in the total data points.<br>
64
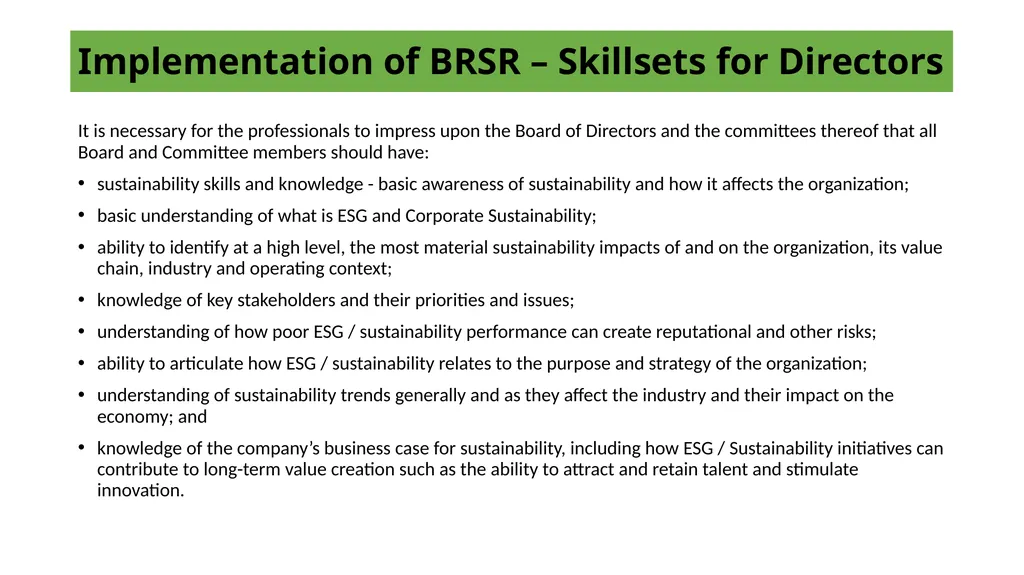
Implementation of BRSR – Skillsets for Directors It is necessary for the professionals to impress upon the Board of Directors and the committees thereof that all Board and Committee members should have:
sustainability skills and knowledge - basic awareness of sustainability and how it affects the organization;
basic understanding of what is ESG and Corporate Sustainability;
ability to identify at a high level, the most material sustainability impacts of and on the organization, its value chain, industry and operating context;
knowledge of key stakeholders and their priorities and issues;
understanding of how poor ESG / sustainability performance can create reputational and other risks;
ability to articulate how ESG / sustainability relates to the purpose and strategy of the organization;
understanding of sustainability trends generally and as they affect the industry and their impact on the economy; and
knowledge of the company’s business case for sustainability, including how ESG / Sustainability initiatives can contribute to long-term value creation such as the ability to attract and retain talent and stimulate innovation.<br>
sustainability skills and knowledge - basic awareness of sustainability and how it affects the organization;
basic understanding of what is ESG and Corporate Sustainability;
ability to identify at a high level, the most material sustainability impacts of and on the organization, its value chain, industry and operating context;
knowledge of key stakeholders and their priorities and issues;
understanding of how poor ESG / sustainability performance can create reputational and other risks;
ability to articulate how ESG / sustainability relates to the purpose and strategy of the organization;
understanding of sustainability trends generally and as they affect the industry and their impact on the economy; and
knowledge of the company’s business case for sustainability, including how ESG / Sustainability initiatives can contribute to long-term value creation such as the ability to attract and retain talent and stimulate innovation.<br>
65
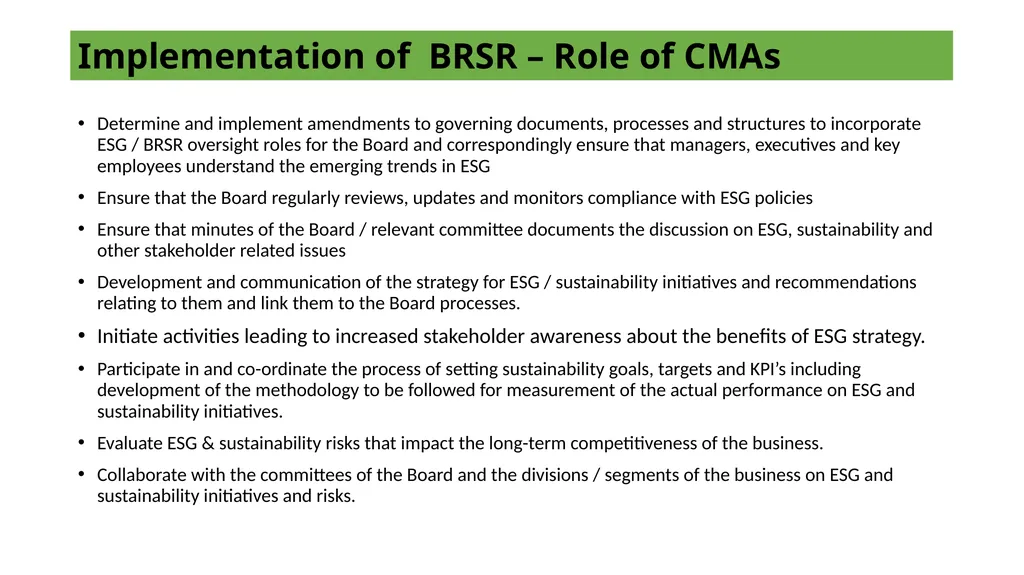
Implementation of BRSR – Role of CMAs Determine and implement amendments to governing documents, processes and structures to incorporate ESG / BRSR oversight roles for the Board and correspondingly ensure that managers, executives and key employees understand the emerging trends in ESG
Ensure that the Board regularly reviews, updates and monitors compliance with ESG policies
Ensure that minutes of the Board / relevant committee documents the discussion on ESG, sustainability and other stakeholder related issues
Development and communication of the strategy for ESG / sustainability initiatives and recommendations relating to them and link them to the Board processes.
Initiate activities leading to increased stakeholder awareness about the benefits of ESG strategy.
Participate in and co-ordinate the process of setting sustainability goals, targets and KPI’s including development of the methodology to be followed for measurement of the actual performance on ESG and sustainability initiatives.
Evaluate ESG & sustainability risks that impact the long-term competitiveness of the business.
Collaborate with the committees of the Board and the divisions / segments of the business on ESG and sustainability initiatives and risks.<br>
Ensure that the Board regularly reviews, updates and monitors compliance with ESG policies
Ensure that minutes of the Board / relevant committee documents the discussion on ESG, sustainability and other stakeholder related issues
Development and communication of the strategy for ESG / sustainability initiatives and recommendations relating to them and link them to the Board processes.
Initiate activities leading to increased stakeholder awareness about the benefits of ESG strategy.
Participate in and co-ordinate the process of setting sustainability goals, targets and KPI’s including development of the methodology to be followed for measurement of the actual performance on ESG and sustainability initiatives.
Evaluate ESG & sustainability risks that impact the long-term competitiveness of the business.
Collaborate with the committees of the Board and the divisions / segments of the business on ESG and sustainability initiatives and risks.<br>
66
COMPLIANCE FRAMEWORK<br>
67
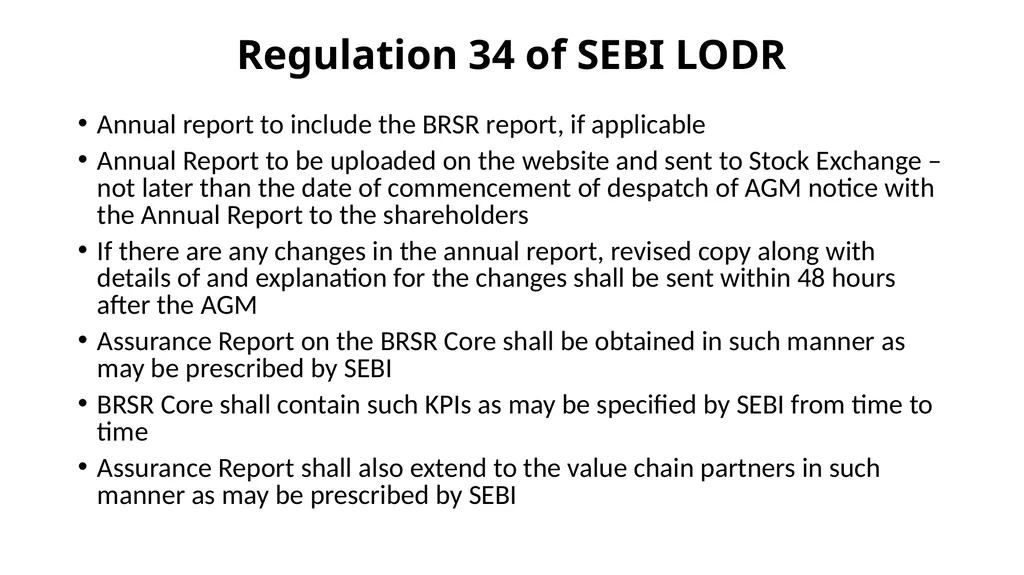
Regulation 34 of SEBI LODR Annual report to include the BRSR report, if applicable
Annual Report to be uploaded on the website and sent to Stock Exchange – not later than the date of commencement of despatch of AGM notice with the Annual Report to the shareholders
If there are any changes in the annual report, revised copy along with details of and explanation for the changes shall be sent within 48 hours after the AGM
Assurance Report on the BRSR Core shall be obtained in such manner as may be prescribed by SEBI
BRSR Core shall contain such KPIs as may be specified by SEBI from time to time
Assurance Report shall also extend to the value chain partners in such manner as may be prescribed by SEBI<br>
Annual Report to be uploaded on the website and sent to Stock Exchange – not later than the date of commencement of despatch of AGM notice with the Annual Report to the shareholders
If there are any changes in the annual report, revised copy along with details of and explanation for the changes shall be sent within 48 hours after the AGM
Assurance Report on the BRSR Core shall be obtained in such manner as may be prescribed by SEBI
BRSR Core shall contain such KPIs as may be specified by SEBI from time to time
Assurance Report shall also extend to the value chain partners in such manner as may be prescribed by SEBI<br>
68
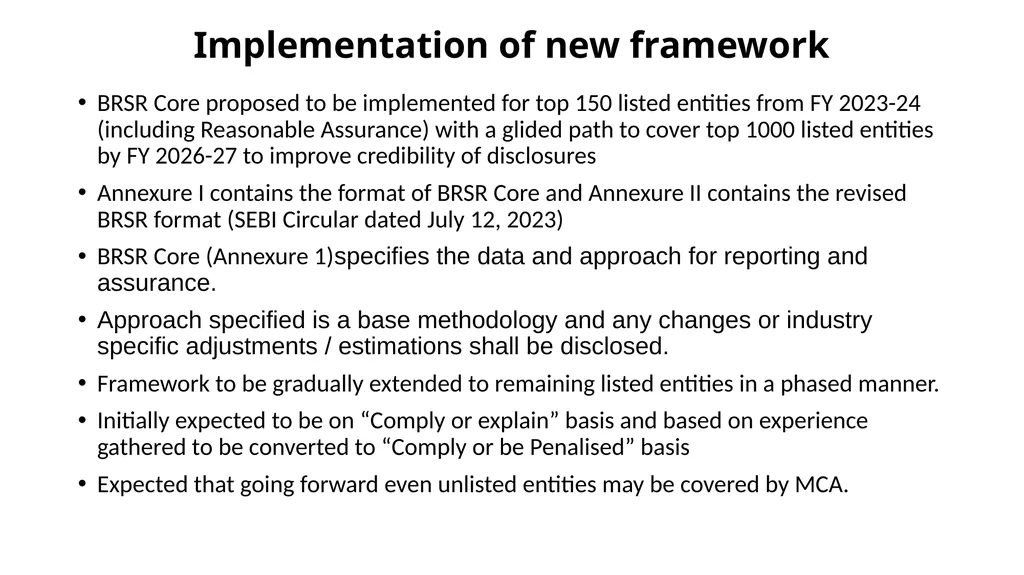
Implementation of new framework BRSR Core proposed to be implemented for top 150 listed entities from FY 2023-24 (including Reasonable Assurance) with a glided path to cover top 1000 listed entities by FY 2026-27 to improve credibility of disclosures
Annexure I contains the format of BRSR Core and Annexure II contains the revised BRSR format (SEBI Circular dated July 12, 2023)
BRSR Core (Annexure 1)specifies the data and approach for reporting and assurance.
Approach specified is a base methodology and any changes or industry specific adjustments / estimations shall be disclosed.
Framework to be gradually extended to remaining listed entities in a phased manner.
Initially expected to be on “Comply or explain” basis and based on experience gathered to be converted to “Comply or be Penalised” basis
Expected that going forward even unlisted entities may be covered by MCA.<br>
Annexure I contains the format of BRSR Core and Annexure II contains the revised BRSR format (SEBI Circular dated July 12, 2023)
BRSR Core (Annexure 1)specifies the data and approach for reporting and assurance.
Approach specified is a base methodology and any changes or industry specific adjustments / estimations shall be disclosed.
Framework to be gradually extended to remaining listed entities in a phased manner.
Initially expected to be on “Comply or explain” basis and based on experience gathered to be converted to “Comply or be Penalised” basis
Expected that going forward even unlisted entities may be covered by MCA.<br>
69
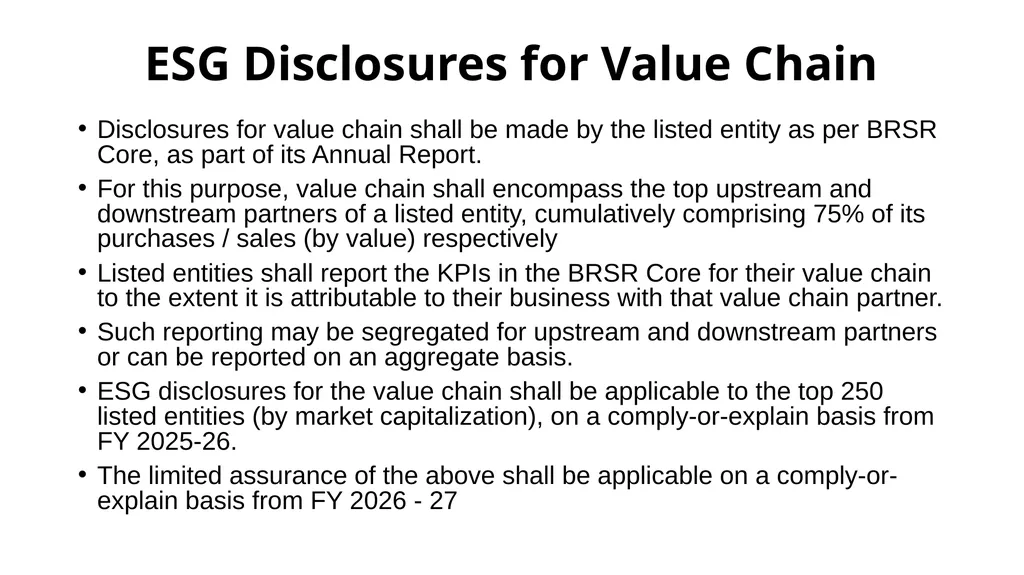
ESG Disclosures for Value Chain Disclosures for value chain shall be made by the listed entity as per BRSR Core, as part of its Annual Report.
For this purpose, value chain shall encompass the top upstream and downstream partners of a listed entity, cumulatively comprising 75% of its purchases / sales (by value) respectively
Listed entities shall report the KPIs in the BRSR Core for their value chain to the extent it is attributable to their business with that value chain partner.
Such reporting may be segregated for upstream and downstream partners or can be reported on an aggregate basis.
ESG disclosures for the value chain shall be applicable to the top 250 listed entities (by market capitalization), on a comply-or-explain basis from FY 2025-26.
The limited assurance of the above shall be applicable on a comply-or-explain basis from FY 2026 - 27<br>
For this purpose, value chain shall encompass the top upstream and downstream partners of a listed entity, cumulatively comprising 75% of its purchases / sales (by value) respectively
Listed entities shall report the KPIs in the BRSR Core for their value chain to the extent it is attributable to their business with that value chain partner.
Such reporting may be segregated for upstream and downstream partners or can be reported on an aggregate basis.
ESG disclosures for the value chain shall be applicable to the top 250 listed entities (by market capitalization), on a comply-or-explain basis from FY 2025-26.
The limited assurance of the above shall be applicable on a comply-or-explain basis from FY 2026 - 27<br>
70
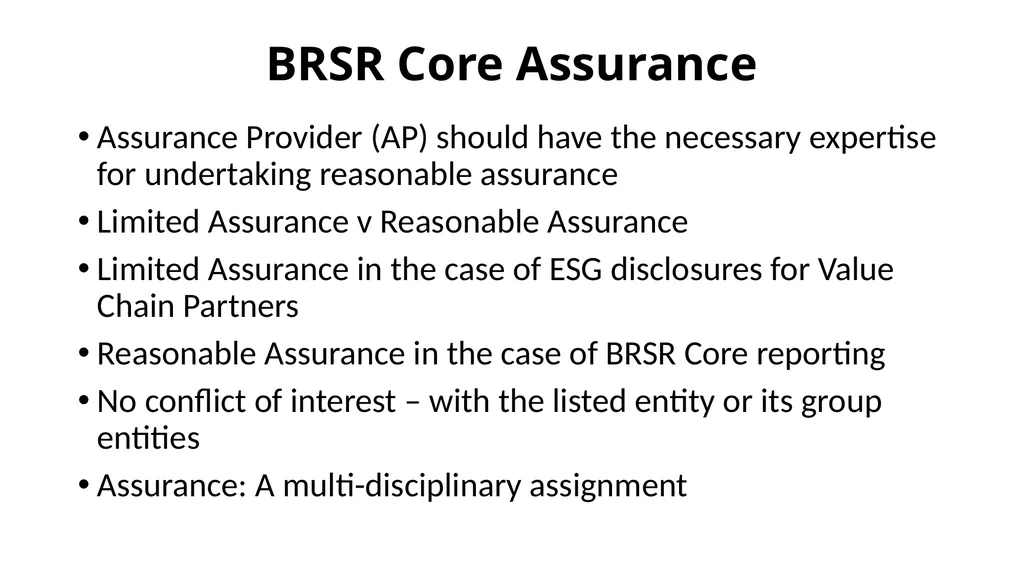
BRSR Core Assurance Assurance Provider (AP) should have the necessary expertise for undertaking reasonable assurance
Limited Assurance v Reasonable Assurance
Limited Assurance in the case of ESG disclosures for Value Chain Partners
Reasonable Assurance in the case of BRSR Core reporting
No conflict of interest – with the listed entity or its group entities
Assurance: A multi-disciplinary assignment<br>
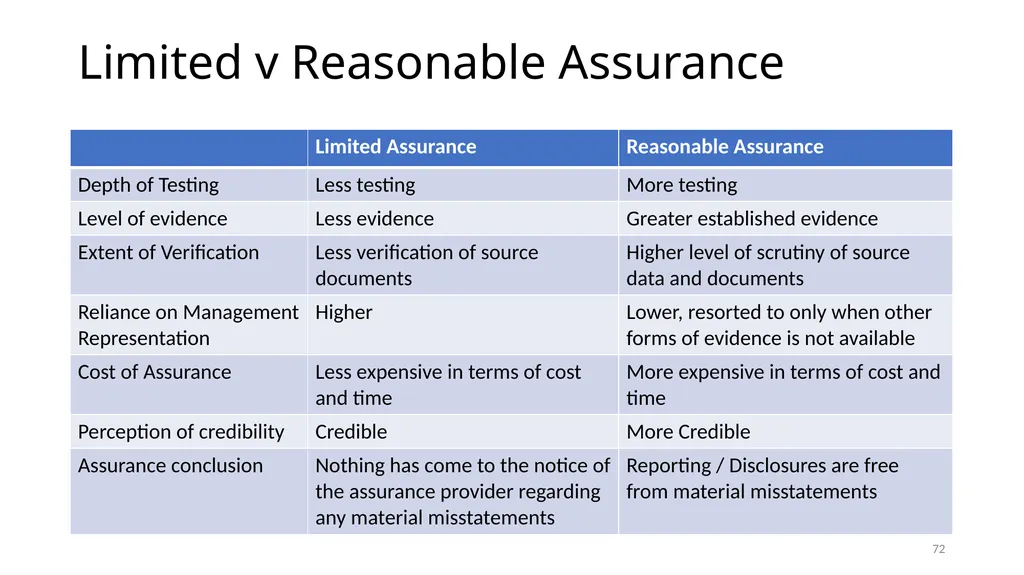
Limited Assurance v Reasonable Assurance
Limited Assurance in the case of ESG disclosures for Value Chain Partners
Reasonable Assurance in the case of BRSR Core reporting
No conflict of interest – with the listed entity or its group entities
Assurance: A multi-disciplinary assignment<br>
71
Limited v Reasonable Assurance 72<br>
72
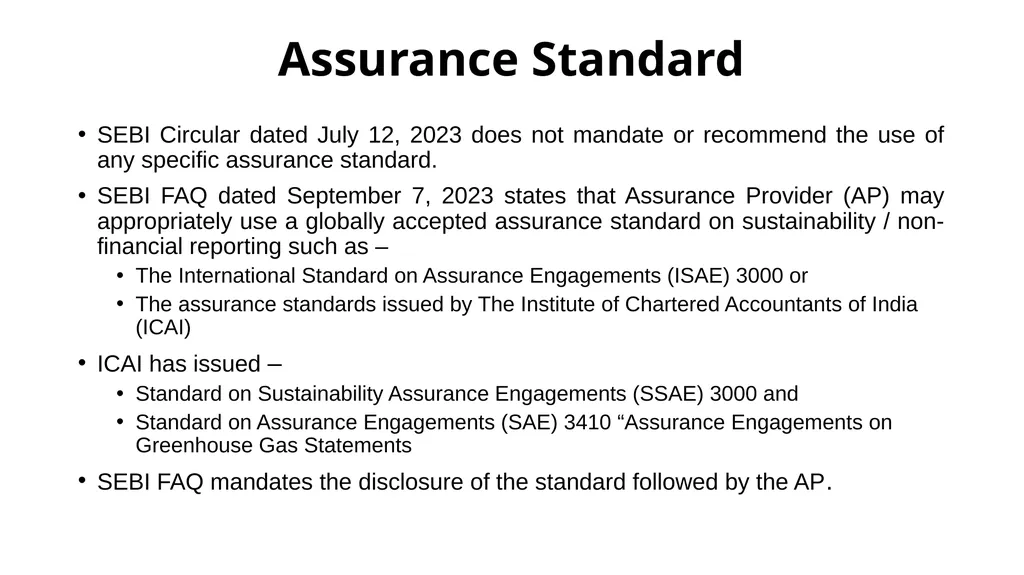
Assurance Standard SEBI Circular dated July 12, 2023 does not mandate or recommend the use of any specific assurance standard.
SEBI FAQ dated September 7, 2023 states that Assurance Provider (AP) may appropriately use a globally accepted assurance standard on sustainability / non-financial reporting such as –
The International Standard on Assurance Engagements (ISAE) 3000 or
The assurance standards issued by The Institute of Chartered Accountants of India (ICAI)
ICAI has issued –
Standard on Sustainability Assurance Engagements (SSAE) 3000 and
Standard on Assurance Engagements (SAE) 3410 “Assurance Engagements on Greenhouse Gas Statements
SEBI FAQ mandates the disclosure of the standard followed by the AP.<br>
SEBI FAQ dated September 7, 2023 states that Assurance Provider (AP) may appropriately use a globally accepted assurance standard on sustainability / non-financial reporting such as –
The International Standard on Assurance Engagements (ISAE) 3000 or
The assurance standards issued by The Institute of Chartered Accountants of India (ICAI)
ICAI has issued –
Standard on Sustainability Assurance Engagements (SSAE) 3000 and
Standard on Assurance Engagements (SAE) 3410 “Assurance Engagements on Greenhouse Gas Statements
SEBI FAQ mandates the disclosure of the standard followed by the AP.<br>
73
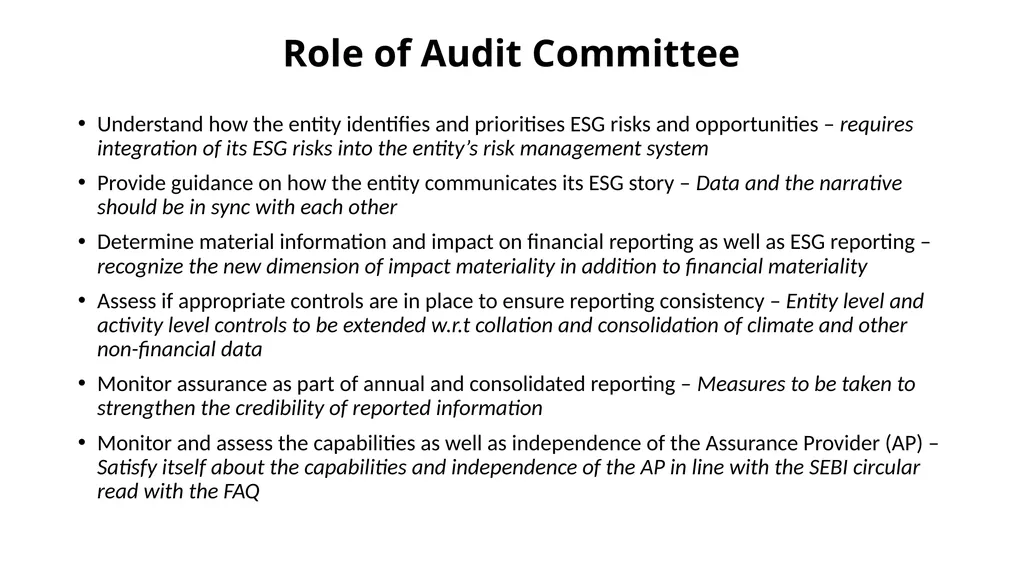
Role of Audit Committee Understand how the entity identifies and prioritises ESG risks and opportunities – requires integration of its ESG risks into the entity’s risk management system
Provide guidance on how the entity communicates its ESG story – Data and the narrative should be in sync with each other
Determine material information and impact on financial reporting as well as ESG reporting – recognize the new dimension of impact materiality in addition to financial materiality
Assess if appropriate controls are in place to ensure reporting consistency – Entity level and activity level controls to be extended w.r.t collation and consolidation of climate and other non-financial data
Monitor assurance as part of annual and consolidated reporting – Measures to be taken to strengthen the credibility of reported information
Monitor and assess the capabilities as well as independence of the Assurance Provider (AP) – Satisfy itself about the capabilities and independence of the AP in line with the SEBI circular read with the FAQ<br>
Provide guidance on how the entity communicates its ESG story – Data and the narrative should be in sync with each other
Determine material information and impact on financial reporting as well as ESG reporting – recognize the new dimension of impact materiality in addition to financial materiality
Assess if appropriate controls are in place to ensure reporting consistency – Entity level and activity level controls to be extended w.r.t collation and consolidation of climate and other non-financial data
Monitor assurance as part of annual and consolidated reporting – Measures to be taken to strengthen the credibility of reported information
Monitor and assess the capabilities as well as independence of the Assurance Provider (AP) – Satisfy itself about the capabilities and independence of the AP in line with the SEBI circular read with the FAQ<br>
74
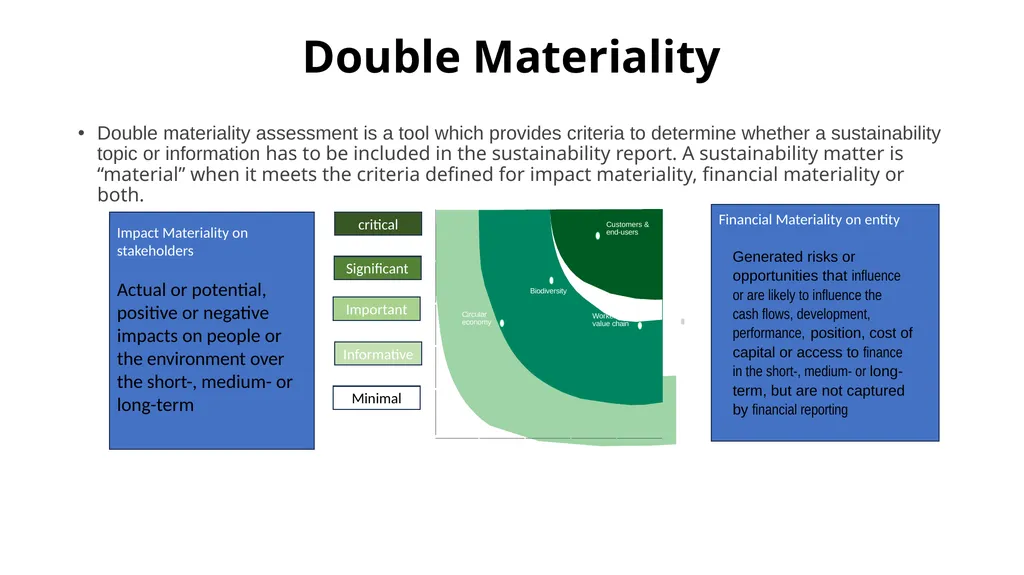
Double Materiality Double materiality assessment is a tool which provides criteria to determine whether a sustainability topic or information has to be included in the sustainability report. A sustainability matter is “material” when it meets the criteria defined for impact materiality, financial materiality or both. Impact Materiality on stakeholders
Actual or potential, positive or negative impacts on people or the environment over the short-, medium- or long-term Financial Materiality on entity
Generated risks or opportunities that influence or are likely to influence the cash flows, development, performance, position, cost of capital or access to finance in the short-, medium- or long-term, but are not captured by financial reporting critical Significant Important Informative Minimal<br>
Actual or potential, positive or negative impacts on people or the environment over the short-, medium- or long-term Financial Materiality on entity
Generated risks or opportunities that influence or are likely to influence the cash flows, development, performance, position, cost of capital or access to finance in the short-, medium- or long-term, but are not captured by financial reporting critical Significant Important Informative Minimal<br>
75
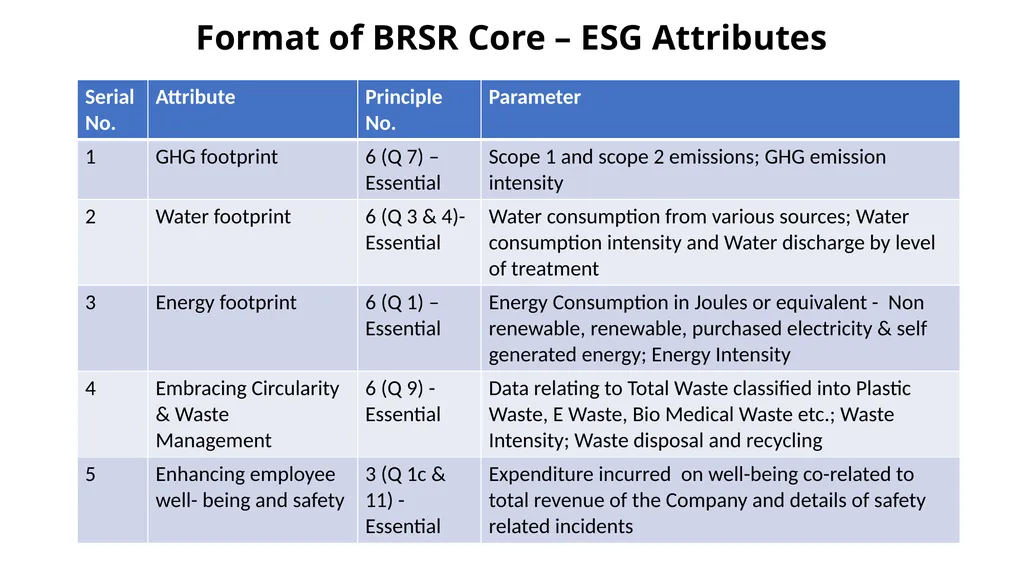
Format of BRSR Core – ESG Attributes<br>
76
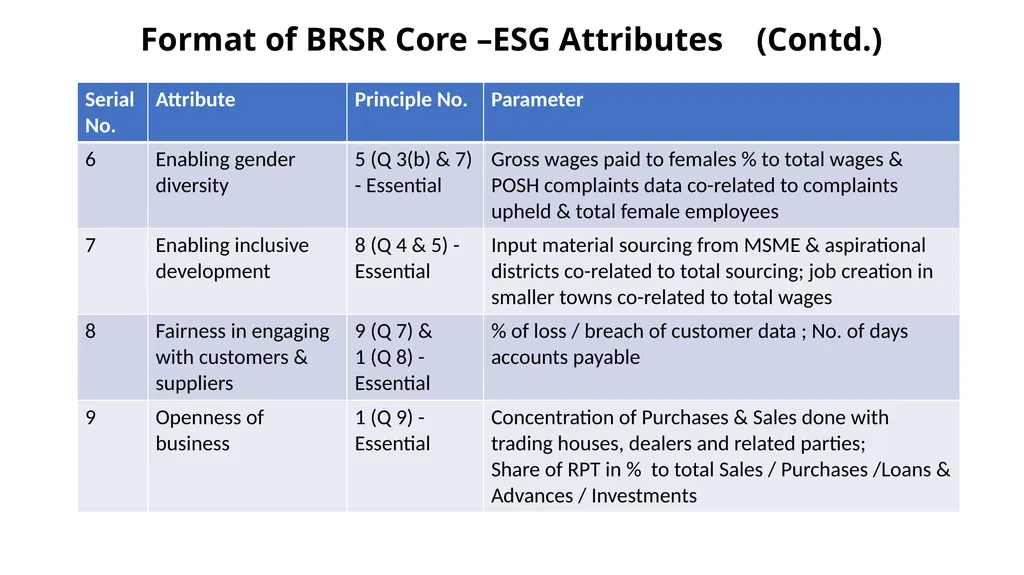
Format of BRSR Core –ESG Attributes (Contd.)<br>
77
BANKING AND FINANCE SECTOR 78<br>
78
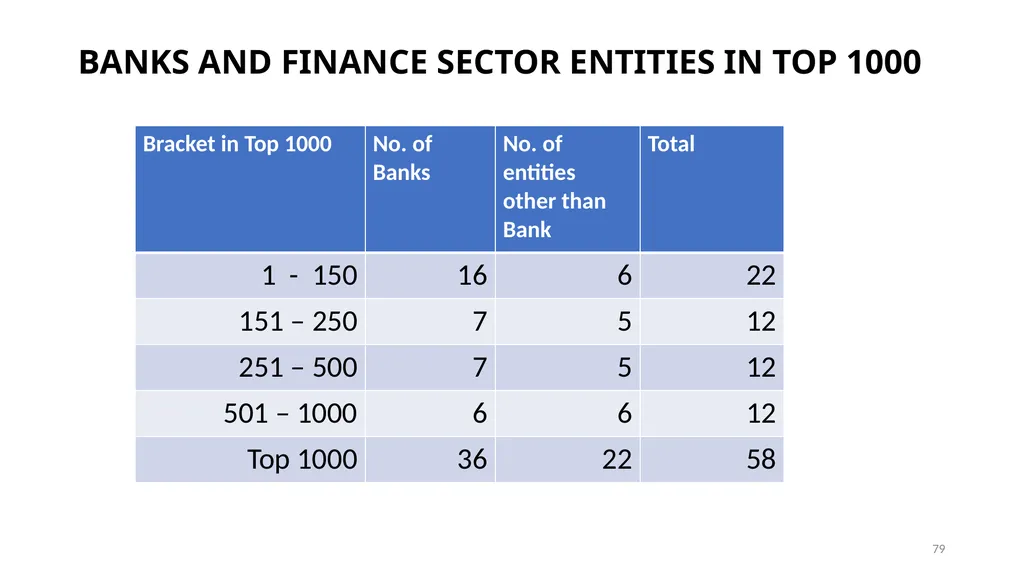
BANKS AND FINANCE SECTOR ENTITIES IN TOP 1000 79<br>
79
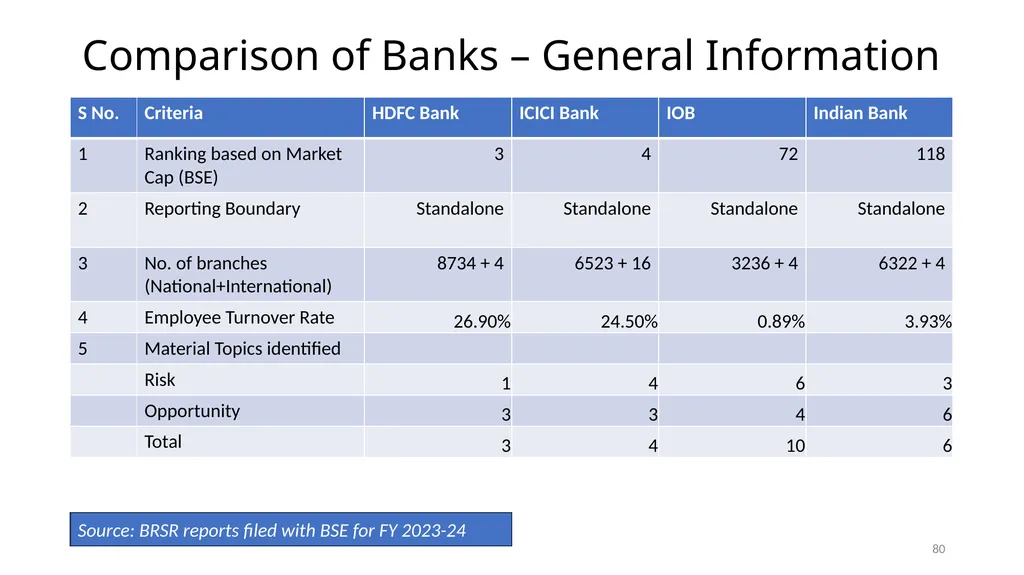
Comparison of Banks – General Information Source: BRSR reports filed with BSE for FY 2023-24 80<br>
80
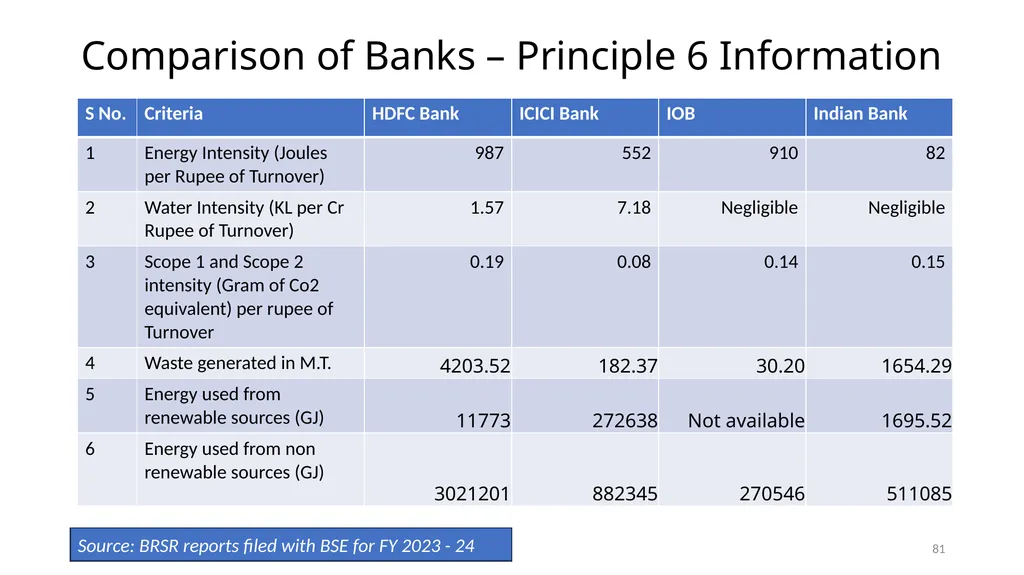
Comparison of Banks – Principle 6 Information Source: BRSR reports filed with BSE for FY 2023 - 24 81<br>
81
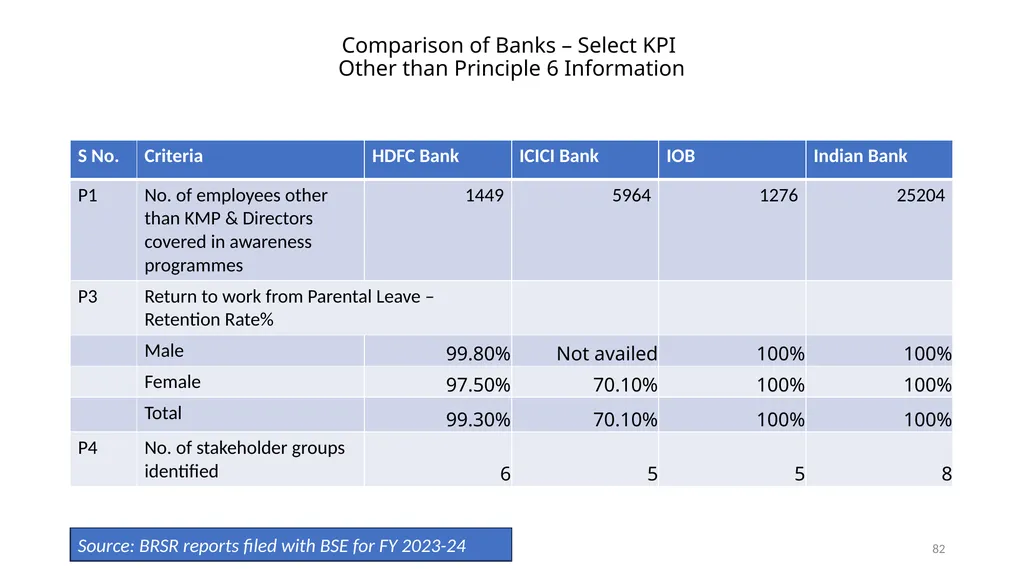
Comparison of Banks – Select KPI
Other than Principle 6 Information Source: BRSR reports filed with BSE for FY 2023-24 82<br>
82
Comparison of Banks – Select KPI
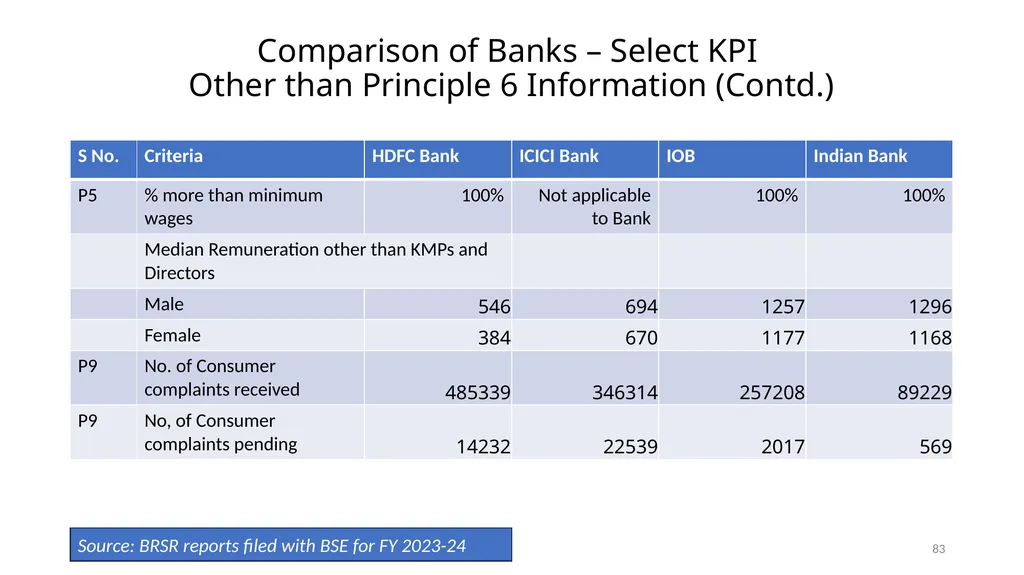
Other than Principle 6 Information (Contd.) Source: BRSR reports filed with BSE for FY 2023-24 83<br>
83
ILLUSTRATIVE COMPARISON 2024 V 2023
SUN PHARMACEUTICALS LIMITED
RANK 15: BSE MARKET CAP AS AT 31.03.2024
SOME CORE ESG KPIs 84<br>
84
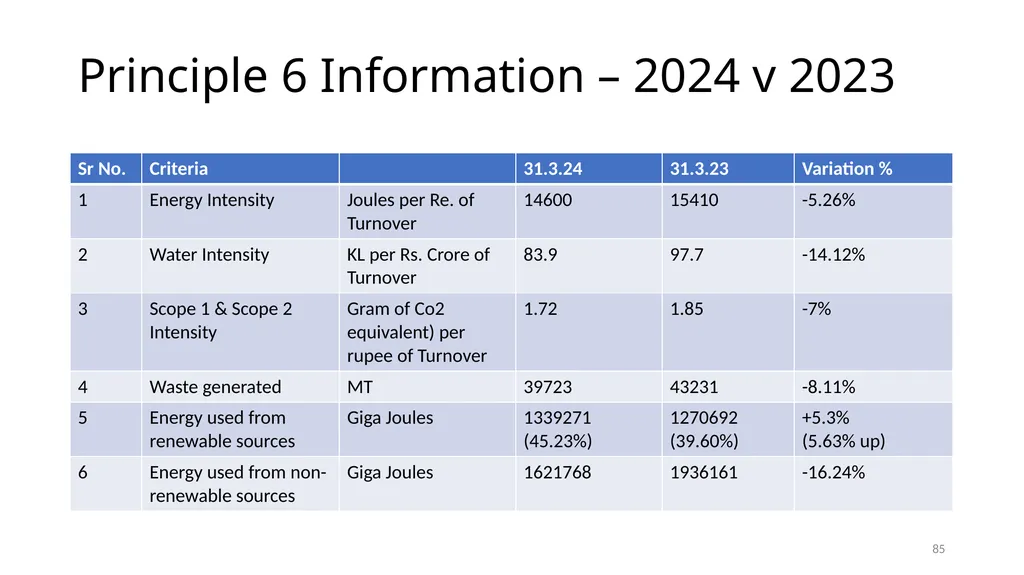
Principle 6 Information – 2024 v 2023 85<br>
85
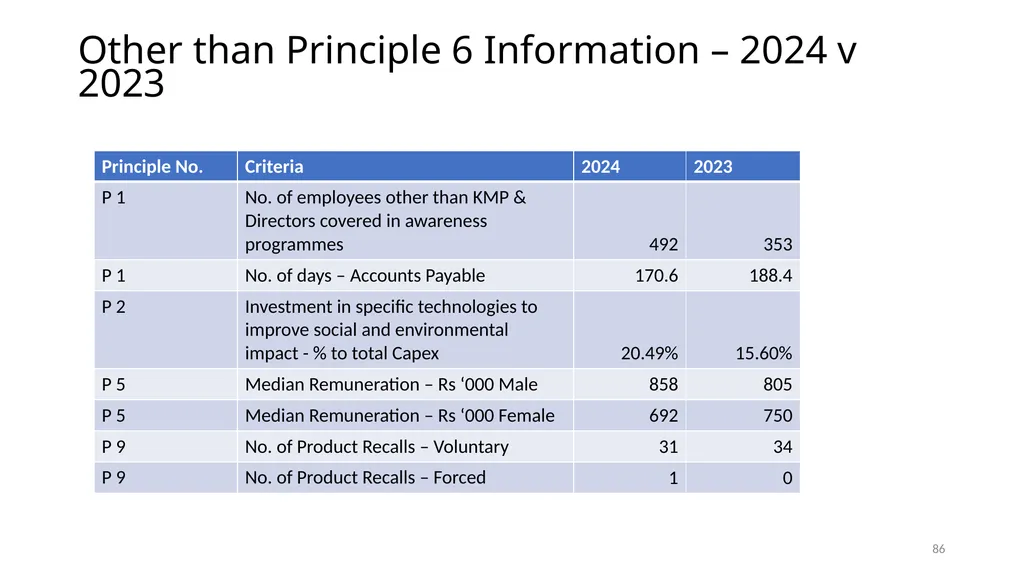
Other than Principle 6 Information – 2024 v 2023 86<br>
86
HOW OUR TEAM CAN ASSIST FOR BRSR 87<br>
87
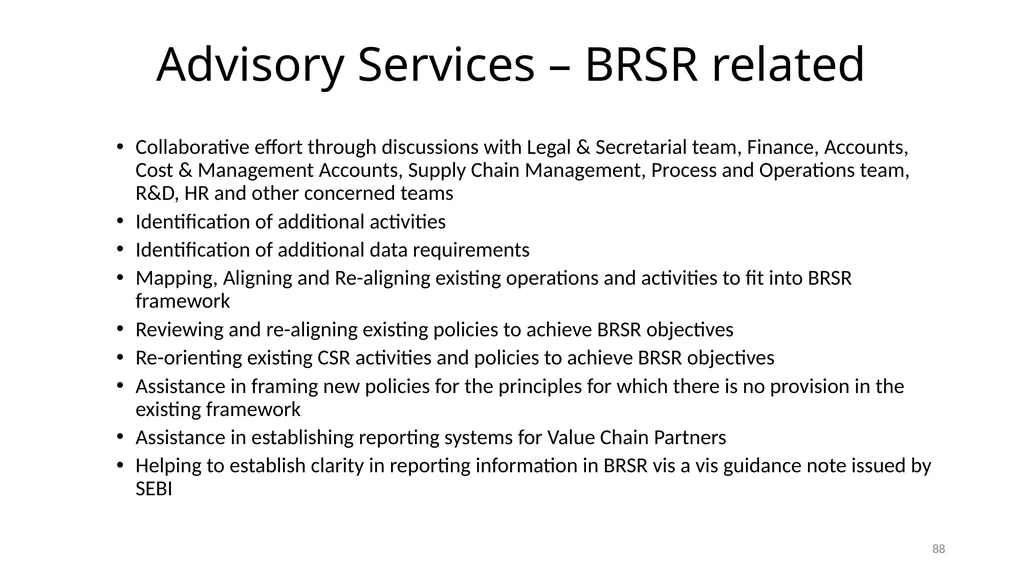
Advisory Services – BRSR related Collaborative effort through discussions with Legal & Secretarial team, Finance, Accounts, Cost & Management Accounts, Supply Chain Management, Process and Operations team, R&D, HR and other concerned teams
Identification of additional activities
Identification of additional data requirements
Mapping, Aligning and Re-aligning existing operations and activities to fit into BRSR framework
Reviewing and re-aligning existing policies to achieve BRSR objectives
Re-orienting existing CSR activities and policies to achieve BRSR objectives
Assistance in framing new policies for the principles for which there is no provision in the existing framework
Assistance in establishing reporting systems for Value Chain Partners
Helping to establish clarity in reporting information in BRSR vis a vis guidance note issued by SEBI 88<br>
Identification of additional activities
Identification of additional data requirements
Mapping, Aligning and Re-aligning existing operations and activities to fit into BRSR framework
Reviewing and re-aligning existing policies to achieve BRSR objectives
Re-orienting existing CSR activities and policies to achieve BRSR objectives
Assistance in framing new policies for the principles for which there is no provision in the existing framework
Assistance in establishing reporting systems for Value Chain Partners
Helping to establish clarity in reporting information in BRSR vis a vis guidance note issued by SEBI 88<br>
88
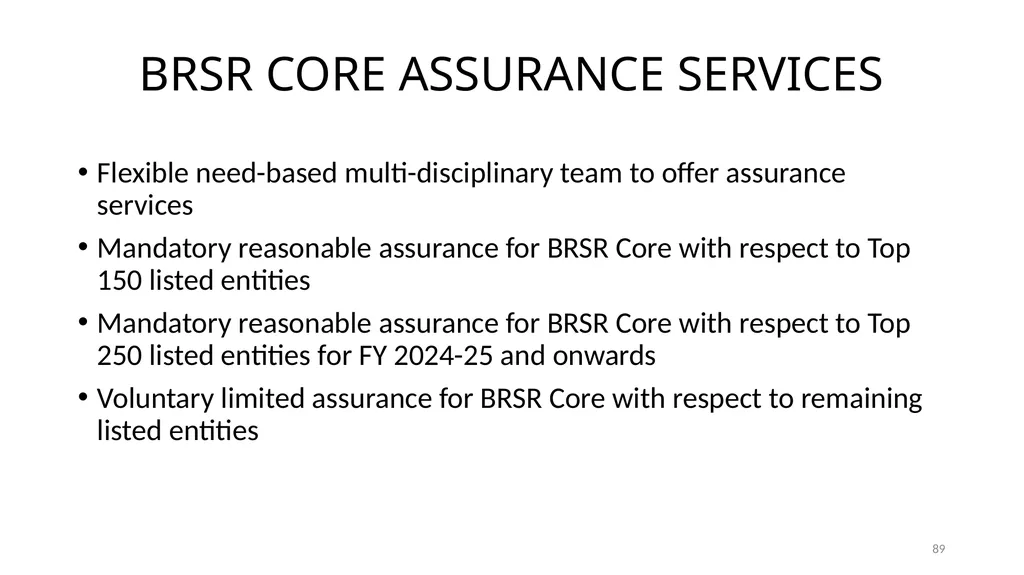
BRSR CORE ASSURANCE SERVICES Flexible need-based multi-disciplinary team to offer assurance services
Mandatory reasonable assurance for BRSR Core with respect to Top 150 listed entities
Mandatory reasonable assurance for BRSR Core with respect to Top 250 listed entities for FY 2024-25 and onwards
Voluntary limited assurance for BRSR Core with respect to remaining listed entities 89<br>
Mandatory reasonable assurance for BRSR Core with respect to Top 150 listed entities
Mandatory reasonable assurance for BRSR Core with respect to Top 250 listed entities for FY 2024-25 and onwards
Voluntary limited assurance for BRSR Core with respect to remaining listed entities 89<br>
89
HOW WE CAN ASSIST FOR BRSR<br>
90
THANK YOU<br>