
Preventing Premature and Avoidable Mortality Essex
EM
Published · 20 slides · 0 views
1 / 1



Description
Preventing Premature and Avoidable Mortality Essex Joint Strategic Needs Assessment 202122 Clinical Care Quality Access Research Citizen Insight Chief Executives Office This focused report on preventing premature and avoidable
Related Topics
Share
Embed code
Download this presentation From Below
"Preventing Premature and Avoidable Mortality Essex" is the property of its rightful owner. Permission is granted to download and print the materials on this website for personal, non-commercial use only, and to display it on your personal computer provided you do not modify the materials and that you retain all copyright notices contained in the materials. By downloading content from our website, you accept the terms of this agreement.
Presentation Transcript
01
Preventing Premature and Avoidable Mortality Essex Joint Strategic Needs Assessment 2021/22
Clinical Care Quality & Access Research & Citizen Insight
Chief Executive’s Office<br>
Clinical Care Quality & Access Research & Citizen Insight
Chief Executive’s Office<br>
02
This focused report on preventing premature and avoidable mortality forms part of the Clinical Care Quality and Access Joint Strategic Needs Assessment (JSNA) products, which forms part of a wider JSNA suite of products that provide an overview of the key issues across Essex against the Robert Wood Johnson model of determinants of health. The aim of this report is to provide information for Essex against the first aim for healthcare according to the NHS Outcome Framework domains, preventing early and avoidable deaths.
Mortality rates give a general outcome measure of population health, influenced by quality of care but also a range of other wider factors including behavioural, social, economic and environmental factors. Premature, early mortality is commonly measured as mortality among people aged under 75 years. Measures of premature mortality that is considered avoidable refers to early death for conditions where timely, effective healthcare can reduce chances of death. [1,2,3,4,5]
An internationally recognised definition of avoidable mortality was developed by the Organisation for Economic Co-operation and Development (OECD) in 2019 [5] :
Avoidable mortality – deaths defined as either preventable or treatable:
Preventable mortality – deaths that can be mainly avoided through effective public health and primary prevention interventions (i.e. before disease/injury onset, to reduce incidence);
Treatable (or amenable) mortality – deaths that can be mainly avoided through timely and effective health care interventions, including secondary prevention and treatment (i.e. after onset to reduce case-fatality).
As such, to ensure reductions in premature mortality, concerted efforts are needed in both the treatment and prevention of causes of death.
Causes of death are attributed to the ‘preventable’ or ‘treatable’ category is based on whether it is predominantly prevention or health care interventions that can reduce deaths. If causes of death can be both largely prevented before they happen and treated once occurred, they are considered preventable in view of the rationale that, if they were prevented, then treatment wouldn’t be necessary. [1]
Such measures can therefore give a starting point to evaluating the quality and effectiveness of healthcare systems in reducing premature and avoidable mortality, including in terms of differences that may be contributing to health inequalities. Differences in avoidable mortality rates between population groups can in part reflect potential differences in people getting the care they need to address health risks and illnesses. [2] | 2 06/06/2022 About this report Produced by Essex County Council Chief Executive’s Office Source: [1] Mortality rates | The Nuffield Trust
[2] What are health inequalities? | The King's Fund (kingsfund.org.uk)
[3] Premature age-adjusted mortality* | County Health Rankings & Roadmaps
[4] Targets and indicators for Health 2020 Version 3 (who.int)
[5] OECD (2021), "Avoidable mortality (preventable and treatable)", in Health at a Glance 2021: OECD Indicators, OECD Publishing, Paris, https://doi.org/10.1787/ec2b395b-en.<br>
Mortality rates give a general outcome measure of population health, influenced by quality of care but also a range of other wider factors including behavioural, social, economic and environmental factors. Premature, early mortality is commonly measured as mortality among people aged under 75 years. Measures of premature mortality that is considered avoidable refers to early death for conditions where timely, effective healthcare can reduce chances of death. [1,2,3,4,5]
An internationally recognised definition of avoidable mortality was developed by the Organisation for Economic Co-operation and Development (OECD) in 2019 [5] :
Avoidable mortality – deaths defined as either preventable or treatable:
Preventable mortality – deaths that can be mainly avoided through effective public health and primary prevention interventions (i.e. before disease/injury onset, to reduce incidence);
Treatable (or amenable) mortality – deaths that can be mainly avoided through timely and effective health care interventions, including secondary prevention and treatment (i.e. after onset to reduce case-fatality).
As such, to ensure reductions in premature mortality, concerted efforts are needed in both the treatment and prevention of causes of death.
Causes of death are attributed to the ‘preventable’ or ‘treatable’ category is based on whether it is predominantly prevention or health care interventions that can reduce deaths. If causes of death can be both largely prevented before they happen and treated once occurred, they are considered preventable in view of the rationale that, if they were prevented, then treatment wouldn’t be necessary. [1]
Such measures can therefore give a starting point to evaluating the quality and effectiveness of healthcare systems in reducing premature and avoidable mortality, including in terms of differences that may be contributing to health inequalities. Differences in avoidable mortality rates between population groups can in part reflect potential differences in people getting the care they need to address health risks and illnesses. [2] | 2 06/06/2022 About this report Produced by Essex County Council Chief Executive’s Office Source: [1] Mortality rates | The Nuffield Trust
[2] What are health inequalities? | The King's Fund (kingsfund.org.uk)
[3] Premature age-adjusted mortality* | County Health Rankings & Roadmaps
[4] Targets and indicators for Health 2020 Version 3 (who.int)
[5] OECD (2021), "Avoidable mortality (preventable and treatable)", in Health at a Glance 2021: OECD Indicators, OECD Publishing, Paris, https://doi.org/10.1787/ec2b395b-en.<br>
03
The following mortality rate information can be found in this JSNA topic, including equalities data such as by Gender and Deprivation:
Total avoidable, preventable and treatable premature mortality.
All cause premature mortality for: cancer; cardiovascular disease; and respiratory disease.
Preventable premature mortality for: cancer; cardiovascular disease; and respiratory disease.
Focus is given to cancer, cardiovascular disease and respiratory disease in the latter section, as these diseases were among the top causes of preventable and treatable premature mortality across 38 countries in 2019. [1]
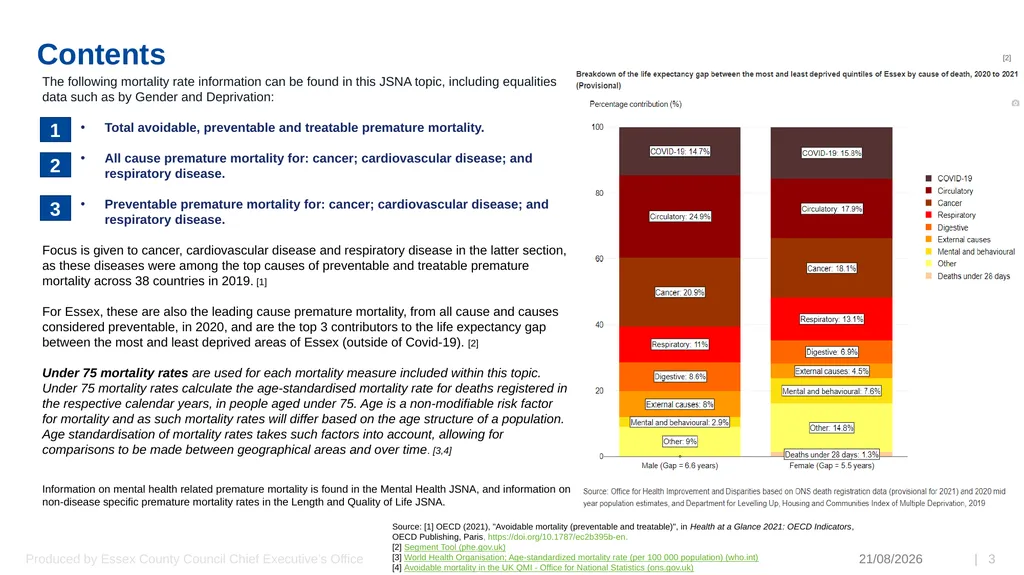
For Essex, these are also the leading cause premature mortality, from all cause and causes considered preventable, in 2020, and are the top 3 contributors to the life expectancy gap between the most and least deprived areas of Essex (outside of Covid-19). [2]
Under 75 mortality rates are used for each mortality measure included within this topic. Under 75 mortality rates calculate the age-standardised mortality rate for deaths registered in the respective calendar years, in people aged under 75. Age is a non-modifiable risk factor for mortality and as such mortality rates will differ based on the age structure of a population. Age standardisation of mortality rates takes such factors into account, allowing for comparisons to be made between geographical areas and over time. [3,4]
Information on mental health related premature mortality is found in the Mental Health JSNA, and information on non-disease specific premature mortality rates in the Length and Quality of Life JSNA. | 3 06/06/2022 Contents Source: [1] OECD (2021), "Avoidable mortality (preventable and treatable)", in Health at a Glance 2021: OECD Indicators, OECD Publishing, Paris, https://doi.org/10.1787/ec2b395b-en.
[2] Segment Tool (phe.gov.uk)
[3] World Health Organisation; Age-standardized mortality rate (per 100 000 population) (who.int)
[4] Avoidable mortality in the UK QMI - Office for National Statistics (ons.gov.uk) Produced by Essex County Council Chief Executive’s Office [2] 1 2 3<br>
Total avoidable, preventable and treatable premature mortality.
All cause premature mortality for: cancer; cardiovascular disease; and respiratory disease.
Preventable premature mortality for: cancer; cardiovascular disease; and respiratory disease.
Focus is given to cancer, cardiovascular disease and respiratory disease in the latter section, as these diseases were among the top causes of preventable and treatable premature mortality across 38 countries in 2019. [1]
For Essex, these are also the leading cause premature mortality, from all cause and causes considered preventable, in 2020, and are the top 3 contributors to the life expectancy gap between the most and least deprived areas of Essex (outside of Covid-19). [2]
Under 75 mortality rates are used for each mortality measure included within this topic. Under 75 mortality rates calculate the age-standardised mortality rate for deaths registered in the respective calendar years, in people aged under 75. Age is a non-modifiable risk factor for mortality and as such mortality rates will differ based on the age structure of a population. Age standardisation of mortality rates takes such factors into account, allowing for comparisons to be made between geographical areas and over time. [3,4]
Information on mental health related premature mortality is found in the Mental Health JSNA, and information on non-disease specific premature mortality rates in the Length and Quality of Life JSNA. | 3 06/06/2022 Contents Source: [1] OECD (2021), "Avoidable mortality (preventable and treatable)", in Health at a Glance 2021: OECD Indicators, OECD Publishing, Paris, https://doi.org/10.1787/ec2b395b-en.
[2] Segment Tool (phe.gov.uk)
[3] World Health Organisation; Age-standardized mortality rate (per 100 000 population) (who.int)
[4] Avoidable mortality in the UK QMI - Office for National Statistics (ons.gov.uk) Produced by Essex County Council Chief Executive’s Office [2] 1 2 3<br>
04
Topic 1.
Avoidable Mortality<br>
05
Avoidable mortality rate, time-series 2008-2010 to 2018-2020
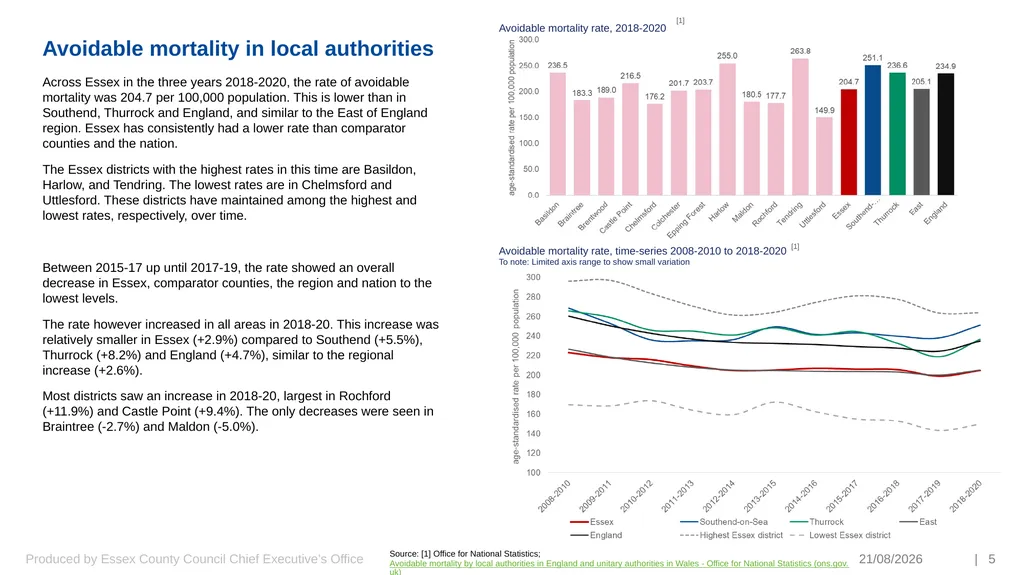
To note: Limited axis range to show small variation Across Essex in the three years 2018-2020, the rate of avoidable mortality was 204.7 per 100,000 population. This is lower than in Southend, Thurrock and England, and similar to the East of England region. Essex has consistently had a lower rate than comparator counties and the nation.
The Essex districts with the highest rates in this time are Basildon, Harlow, and Tendring. The lowest rates are in Chelmsford and Uttlesford. These districts have maintained among the highest and lowest rates, respectively, over time.
Between 2015-17 up until 2017-19, the rate showed an overall decrease in Essex, comparator counties, the region and nation to the lowest levels.
The rate however increased in all areas in 2018-20. This increase was relatively smaller in Essex (+2.9%) compared to Southend (+5.5%), Thurrock (+8.2%) and England (+4.7%), similar to the regional increase (+2.6%).
Most districts saw an increase in 2018-20, largest in Rochford (+11.9%) and Castle Point (+9.4%). The only decreases were seen in Braintree (-2.7%) and Maldon (-5.0%). 06/06/2022 | 5 Produced by Essex County Council Chief Executive’s Office Source: [1] Office for National Statistics; Avoidable mortality by local authorities in England and unitary authorities in Wales - Office for National Statistics (ons.gov.uk) Avoidable mortality in local authorities [1] [1] Avoidable mortality rate, 2018-2020<br>
To note: Limited axis range to show small variation Across Essex in the three years 2018-2020, the rate of avoidable mortality was 204.7 per 100,000 population. This is lower than in Southend, Thurrock and England, and similar to the East of England region. Essex has consistently had a lower rate than comparator counties and the nation.
The Essex districts with the highest rates in this time are Basildon, Harlow, and Tendring. The lowest rates are in Chelmsford and Uttlesford. These districts have maintained among the highest and lowest rates, respectively, over time.
Between 2015-17 up until 2017-19, the rate showed an overall decrease in Essex, comparator counties, the region and nation to the lowest levels.
The rate however increased in all areas in 2018-20. This increase was relatively smaller in Essex (+2.9%) compared to Southend (+5.5%), Thurrock (+8.2%) and England (+4.7%), similar to the regional increase (+2.6%).
Most districts saw an increase in 2018-20, largest in Rochford (+11.9%) and Castle Point (+9.4%). The only decreases were seen in Braintree (-2.7%) and Maldon (-5.0%). 06/06/2022 | 5 Produced by Essex County Council Chief Executive’s Office Source: [1] Office for National Statistics; Avoidable mortality by local authorities in England and unitary authorities in Wales - Office for National Statistics (ons.gov.uk) Avoidable mortality in local authorities [1] [1] Avoidable mortality rate, 2018-2020<br>
06
Across Essex in the three years 2018-2020, the rate of preventable mortality was 131.1 per 100,000 population. This is lower than in Southend, Thurrock and England, and similar to the East of England region. Essex has consistently had a lower rate than comparator counties and the nation.
The Essex districts with the highest rates in this time are Basildon, Harlow, and Tendring. The lowest rates are in Chelmsford and Uttlesford. These districts have maintained among the highest and lowest rates, respectively, over time.
For Basildon, Harlow and Tendring, according to the Public Health Outcomes Framework as illustrated in following slides, the top cause of premature mortality considered preventable in 2020 for these areas was cancer, followed by cardiovascular disease.
Following the decrease to 2017-19, the rate of total preventable mortality showed an increase in 2018-20 in Essex, Southend, Thurrock, the region and nation. This increase was smaller in Essex (+5.0%) compared to Southend (+8.4%), Thurrock (+13.3%), East of England (+5.6%) and England (+7.7%).
Most districts saw an increase in 2018-20, largest in Rochford (+18.3%) and Epping Forest (+14.8%). The only decrease was seen in Braintree (-1.8%). 06/06/2022 | 6 Produced by Essex County Council Chief Executive’s Office Source: [1] Office for National Statistics; Avoidable mortality by local authorities in England and unitary authorities in Wales - Office for National Statistics (ons.gov.uk) Preventable mortality in local authorities [1] [1] Preventable mortality rate, 2018-2020 Preventable mortality rate, time-series 2008-2010 to 2018-2020
To note: Limited axis range to show small variation<br>
The Essex districts with the highest rates in this time are Basildon, Harlow, and Tendring. The lowest rates are in Chelmsford and Uttlesford. These districts have maintained among the highest and lowest rates, respectively, over time.
For Basildon, Harlow and Tendring, according to the Public Health Outcomes Framework as illustrated in following slides, the top cause of premature mortality considered preventable in 2020 for these areas was cancer, followed by cardiovascular disease.
Following the decrease to 2017-19, the rate of total preventable mortality showed an increase in 2018-20 in Essex, Southend, Thurrock, the region and nation. This increase was smaller in Essex (+5.0%) compared to Southend (+8.4%), Thurrock (+13.3%), East of England (+5.6%) and England (+7.7%).
Most districts saw an increase in 2018-20, largest in Rochford (+18.3%) and Epping Forest (+14.8%). The only decrease was seen in Braintree (-1.8%). 06/06/2022 | 6 Produced by Essex County Council Chief Executive’s Office Source: [1] Office for National Statistics; Avoidable mortality by local authorities in England and unitary authorities in Wales - Office for National Statistics (ons.gov.uk) Preventable mortality in local authorities [1] [1] Preventable mortality rate, 2018-2020 Preventable mortality rate, time-series 2008-2010 to 2018-2020
To note: Limited axis range to show small variation<br>
07
Treatable mortality rate, time-series 2008-2010 to 2018-2020
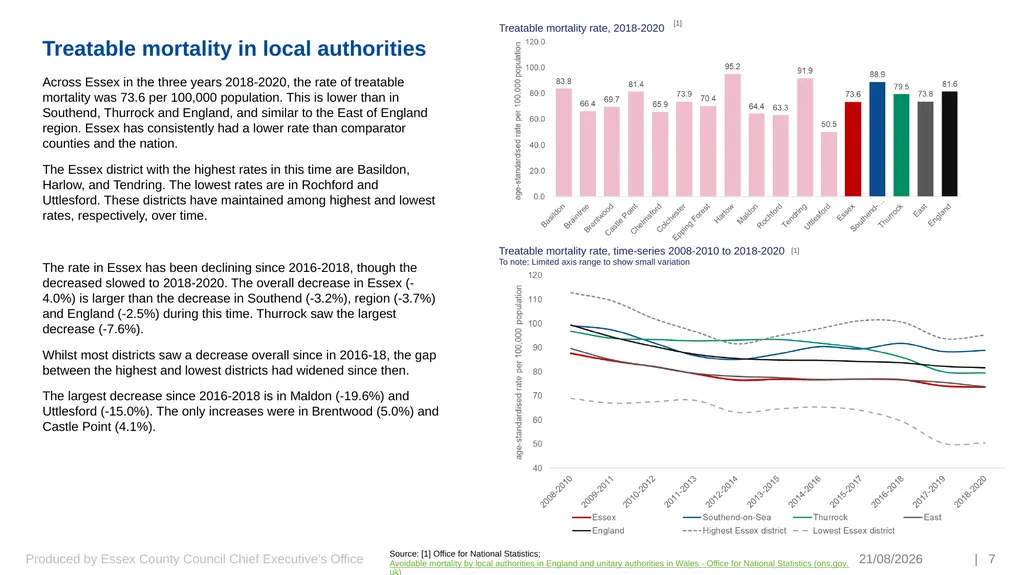
To note: Limited axis range to show small variation Across Essex in the three years 2018-2020, the rate of treatable mortality was 73.6 per 100,000 population. This is lower than in Southend, Thurrock and England, and similar to the East of England region. Essex has consistently had a lower rate than comparator counties and the nation.
The Essex district with the highest rates in this time are Basildon, Harlow, and Tendring. The lowest rates are in Rochford and Uttlesford. These districts have maintained among highest and lowest rates, respectively, over time.
The rate in Essex has been declining since 2016-2018, though the decreased slowed to 2018-2020. The overall decrease in Essex (-4.0%) is larger than the decrease in Southend (-3.2%), region (-3.7%) and England (-2.5%) during this time. Thurrock saw the largest decrease (-7.6%).
Whilst most districts saw a decrease overall since in 2016-18, the gap between the highest and lowest districts had widened since then.
The largest decrease since 2016-2018 is in Maldon (-19.6%) and Uttlesford (-15.0%). The only increases were in Brentwood (5.0%) and Castle Point (4.1%). 06/06/2022 | 7 Produced by Essex County Council Chief Executive’s Office Source: [1] Office for National Statistics; Avoidable mortality by local authorities in England and unitary authorities in Wales - Office for National Statistics (ons.gov.uk) Treatable mortality in local authorities [1] [1] Treatable mortality rate, 2018-2020<br>
To note: Limited axis range to show small variation Across Essex in the three years 2018-2020, the rate of treatable mortality was 73.6 per 100,000 population. This is lower than in Southend, Thurrock and England, and similar to the East of England region. Essex has consistently had a lower rate than comparator counties and the nation.
The Essex district with the highest rates in this time are Basildon, Harlow, and Tendring. The lowest rates are in Rochford and Uttlesford. These districts have maintained among highest and lowest rates, respectively, over time.
The rate in Essex has been declining since 2016-2018, though the decreased slowed to 2018-2020. The overall decrease in Essex (-4.0%) is larger than the decrease in Southend (-3.2%), region (-3.7%) and England (-2.5%) during this time. Thurrock saw the largest decrease (-7.6%).
Whilst most districts saw a decrease overall since in 2016-18, the gap between the highest and lowest districts had widened since then.
The largest decrease since 2016-2018 is in Maldon (-19.6%) and Uttlesford (-15.0%). The only increases were in Brentwood (5.0%) and Castle Point (4.1%). 06/06/2022 | 7 Produced by Essex County Council Chief Executive’s Office Source: [1] Office for National Statistics; Avoidable mortality by local authorities in England and unitary authorities in Wales - Office for National Statistics (ons.gov.uk) Treatable mortality in local authorities [1] [1] Treatable mortality rate, 2018-2020<br>
08
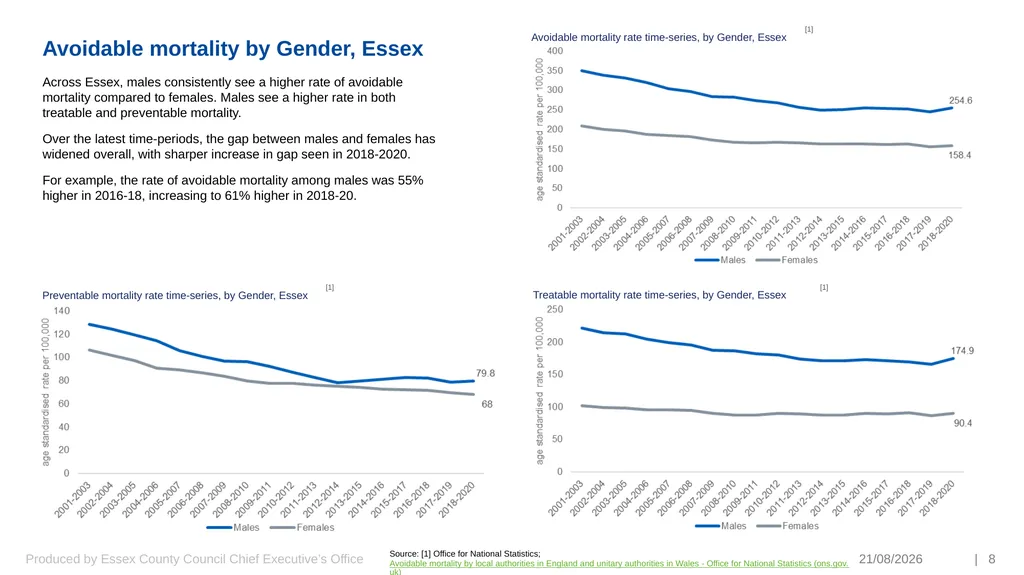
Across Essex, males consistently see a higher rate of avoidable mortality compared to females. Males see a higher rate in both treatable and preventable mortality.
Over the latest time-periods, the gap between males and females has widened overall, with sharper increase in gap seen in 2018-2020.
For example, the rate of avoidable mortality among males was 55% higher in 2016-18, increasing to 61% higher in 2018-20. 06/06/2022 | 8 Produced by Essex County Council Chief Executive’s Office Source: [1] Office for National Statistics; Avoidable mortality by local authorities in England and unitary authorities in Wales - Office for National Statistics (ons.gov.uk) [1] [1] [1] Avoidable mortality by Gender, Essex Avoidable mortality rate time-series, by Gender, Essex Treatable mortality rate time-series, by Gender, Essex Preventable mortality rate time-series, by Gender, Essex<br>
Over the latest time-periods, the gap between males and females has widened overall, with sharper increase in gap seen in 2018-2020.
For example, the rate of avoidable mortality among males was 55% higher in 2016-18, increasing to 61% higher in 2018-20. 06/06/2022 | 8 Produced by Essex County Council Chief Executive’s Office Source: [1] Office for National Statistics; Avoidable mortality by local authorities in England and unitary authorities in Wales - Office for National Statistics (ons.gov.uk) [1] [1] [1] Avoidable mortality by Gender, Essex Avoidable mortality rate time-series, by Gender, Essex Treatable mortality rate time-series, by Gender, Essex Preventable mortality rate time-series, by Gender, Essex<br>
09
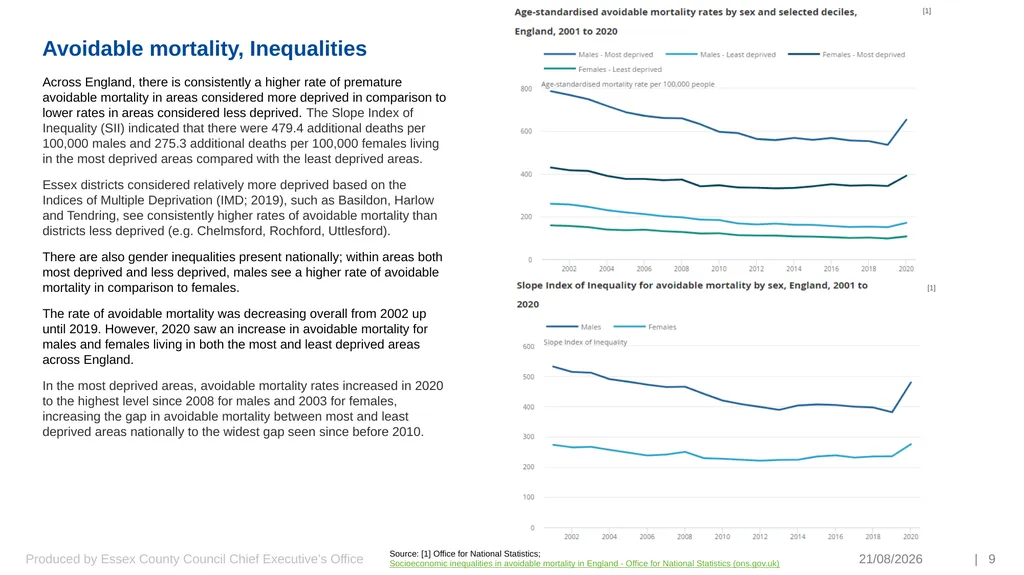
Avoidable mortality, Inequalities Across England, there is consistently a higher rate of premature avoidable mortality in areas considered more deprived in comparison to lower rates in areas considered less deprived. The Slope Index of Inequality (SII) indicated that there were 479.4 additional deaths per 100,000 males and 275.3 additional deaths per 100,000 females living in the most deprived areas compared with the least deprived areas.
Essex districts considered relatively more deprived based on the Indices of Multiple Deprivation (IMD; 2019), such as Basildon, Harlow and Tendring, see consistently higher rates of avoidable mortality than districts less deprived (e.g. Chelmsford, Rochford, Uttlesford).
There are also gender inequalities present nationally; within areas both most deprived and less deprived, males see a higher rate of avoidable mortality in comparison to females.
The rate of avoidable mortality was decreasing overall from 2002 up until 2019. However, 2020 saw an increase in avoidable mortality for males and females living in both the most and least deprived areas across England.
In the most deprived areas, avoidable mortality rates increased in 2020 to the highest level since 2008 for males and 2003 for females, increasing the gap in avoidable mortality between most and least deprived areas nationally to the widest gap seen since before 2010. 06/06/2022 | 9 Produced by Essex County Council Chief Executive’s Office Source: [1] Office for National Statistics; Socioeconomic inequalities in avoidable mortality in England - Office for National Statistics (ons.gov.uk) [1] [1]<br>
Essex districts considered relatively more deprived based on the Indices of Multiple Deprivation (IMD; 2019), such as Basildon, Harlow and Tendring, see consistently higher rates of avoidable mortality than districts less deprived (e.g. Chelmsford, Rochford, Uttlesford).
There are also gender inequalities present nationally; within areas both most deprived and less deprived, males see a higher rate of avoidable mortality in comparison to females.
The rate of avoidable mortality was decreasing overall from 2002 up until 2019. However, 2020 saw an increase in avoidable mortality for males and females living in both the most and least deprived areas across England.
In the most deprived areas, avoidable mortality rates increased in 2020 to the highest level since 2008 for males and 2003 for females, increasing the gap in avoidable mortality between most and least deprived areas nationally to the widest gap seen since before 2010. 06/06/2022 | 9 Produced by Essex County Council Chief Executive’s Office Source: [1] Office for National Statistics; Socioeconomic inequalities in avoidable mortality in England - Office for National Statistics (ons.gov.uk) [1] [1]<br>
10
Topic 2.
Premature and Preventable Mortality for Causes Contributing to the Life Expectancy Gap in Essex<br>
11
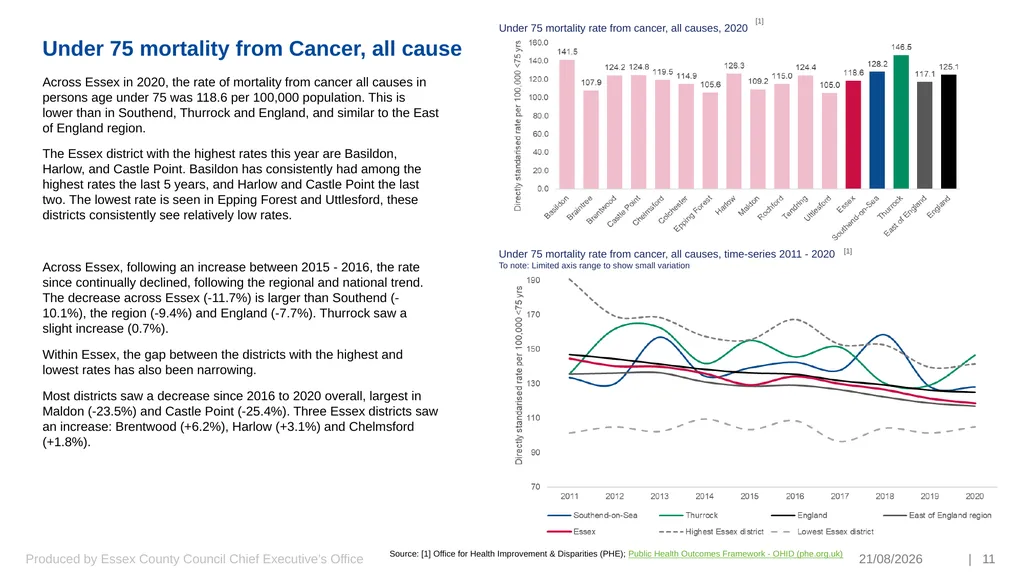
Under 75 mortality rate from cancer, all causes, time-series 2011 - 2020
To note: Limited axis range to show small variation Under 75 mortality rate from cancer, all causes, 2020 Across Essex in 2020, the rate of mortality from cancer all causes in persons age under 75 was 118.6 per 100,000 population. This is lower than in Southend, Thurrock and England, and similar to the East of England region.
The Essex district with the highest rates this year are Basildon, Harlow, and Castle Point. Basildon has consistently had among the highest rates the last 5 years, and Harlow and Castle Point the last two. The lowest rate is seen in Epping Forest and Uttlesford, these districts consistently see relatively low rates.
Across Essex, following an increase between 2015 - 2016, the rate since continually declined, following the regional and national trend. The decrease across Essex (-11.7%) is larger than Southend (-10.1%), the region (-9.4%) and England (-7.7%). Thurrock saw a slight increase (0.7%).
Within Essex, the gap between the districts with the highest and lowest rates has also been narrowing.
Most districts saw a decrease since 2016 to 2020 overall, largest in Maldon (-23.5%) and Castle Point (-25.4%). Three Essex districts saw an increase: Brentwood (+6.2%), Harlow (+3.1%) and Chelmsford (+1.8%). 06/06/2022 | 11 Produced by Essex County Council Chief Executive’s Office Source: [1] Office for Health Improvement & Disparities (PHE); Public Health Outcomes Framework - OHID (phe.org.uk) Under 75 mortality from Cancer, all cause [1] [1]<br>
To note: Limited axis range to show small variation Under 75 mortality rate from cancer, all causes, 2020 Across Essex in 2020, the rate of mortality from cancer all causes in persons age under 75 was 118.6 per 100,000 population. This is lower than in Southend, Thurrock and England, and similar to the East of England region.
The Essex district with the highest rates this year are Basildon, Harlow, and Castle Point. Basildon has consistently had among the highest rates the last 5 years, and Harlow and Castle Point the last two. The lowest rate is seen in Epping Forest and Uttlesford, these districts consistently see relatively low rates.
Across Essex, following an increase between 2015 - 2016, the rate since continually declined, following the regional and national trend. The decrease across Essex (-11.7%) is larger than Southend (-10.1%), the region (-9.4%) and England (-7.7%). Thurrock saw a slight increase (0.7%).
Within Essex, the gap between the districts with the highest and lowest rates has also been narrowing.
Most districts saw a decrease since 2016 to 2020 overall, largest in Maldon (-23.5%) and Castle Point (-25.4%). Three Essex districts saw an increase: Brentwood (+6.2%), Harlow (+3.1%) and Chelmsford (+1.8%). 06/06/2022 | 11 Produced by Essex County Council Chief Executive’s Office Source: [1] Office for Health Improvement & Disparities (PHE); Public Health Outcomes Framework - OHID (phe.org.uk) Under 75 mortality from Cancer, all cause [1] [1]<br>
12
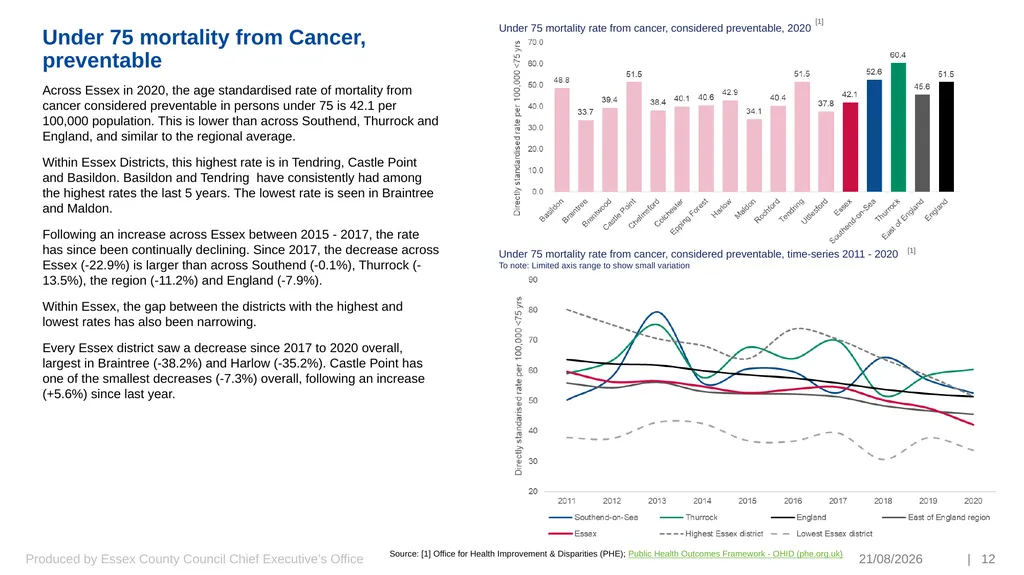
Under 75 mortality rate from cancer, considered preventable, time-series 2011 - 2020
To note: Limited axis range to show small variation Under 75 mortality rate from cancer, considered preventable, 2020 Across Essex in 2020, the age standardised rate of mortality from cancer considered preventable in persons under 75 is 42.1 per 100,000 population. This is lower than across Southend, Thurrock and England, and similar to the regional average.
Within Essex Districts, this highest rate is in Tendring, Castle Point and Basildon. Basildon and Tendring have consistently had among the highest rates the last 5 years. The lowest rate is seen in Braintree and Maldon.
Following an increase across Essex between 2015 - 2017, the rate has since been continually declining. Since 2017, the decrease across Essex (-22.9%) is larger than across Southend (-0.1%), Thurrock (-13.5%), the region (-11.2%) and England (-7.9%).
Within Essex, the gap between the districts with the highest and lowest rates has also been narrowing.
Every Essex district saw a decrease since 2017 to 2020 overall, largest in Braintree (-38.2%) and Harlow (-35.2%). Castle Point has one of the smallest decreases (-7.3%) overall, following an increase (+5.6%) since last year. 06/06/2022 | 12 Produced by Essex County Council Chief Executive’s Office Source: [1] Office for Health Improvement & Disparities (PHE); Public Health Outcomes Framework - OHID (phe.org.uk) Under 75 mortality from Cancer, preventable [1] [1]<br>
To note: Limited axis range to show small variation Under 75 mortality rate from cancer, considered preventable, 2020 Across Essex in 2020, the age standardised rate of mortality from cancer considered preventable in persons under 75 is 42.1 per 100,000 population. This is lower than across Southend, Thurrock and England, and similar to the regional average.
Within Essex Districts, this highest rate is in Tendring, Castle Point and Basildon. Basildon and Tendring have consistently had among the highest rates the last 5 years. The lowest rate is seen in Braintree and Maldon.
Following an increase across Essex between 2015 - 2017, the rate has since been continually declining. Since 2017, the decrease across Essex (-22.9%) is larger than across Southend (-0.1%), Thurrock (-13.5%), the region (-11.2%) and England (-7.9%).
Within Essex, the gap between the districts with the highest and lowest rates has also been narrowing.
Every Essex district saw a decrease since 2017 to 2020 overall, largest in Braintree (-38.2%) and Harlow (-35.2%). Castle Point has one of the smallest decreases (-7.3%) overall, following an increase (+5.6%) since last year. 06/06/2022 | 12 Produced by Essex County Council Chief Executive’s Office Source: [1] Office for Health Improvement & Disparities (PHE); Public Health Outcomes Framework - OHID (phe.org.uk) Under 75 mortality from Cancer, preventable [1] [1]<br>
13
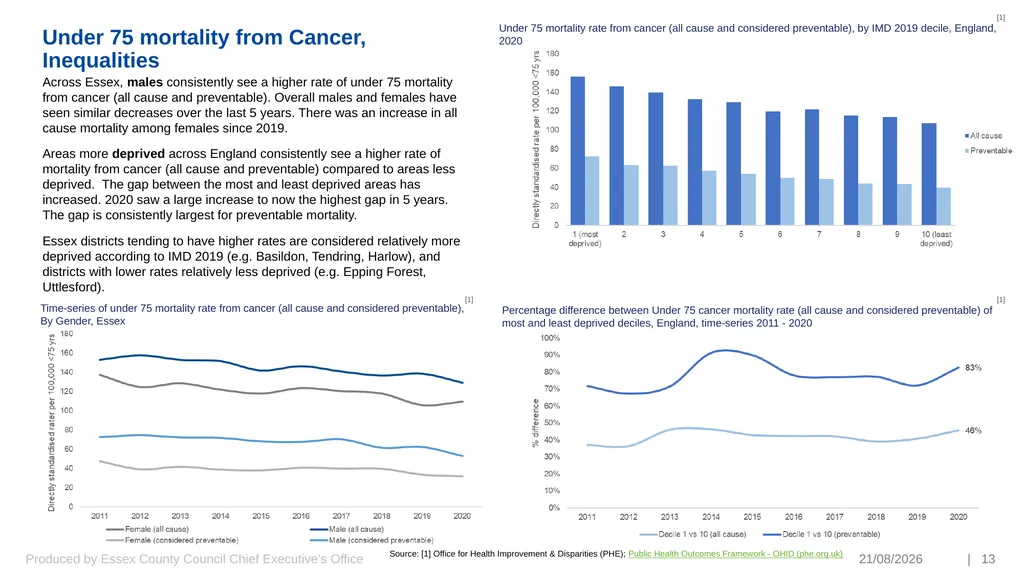
Across Essex, males consistently see a higher rate of under 75 mortality from cancer (all cause and preventable). Overall males and females have seen similar decreases over the last 5 years. There was an increase in all cause mortality among females since 2019.
Areas more deprived across England consistently see a higher rate of mortality from cancer (all cause and preventable) compared to areas less deprived. The gap between the most and least deprived areas has increased. 2020 saw a large increase to now the highest gap in 5 years. The gap is consistently largest for preventable mortality.
Essex districts tending to have higher rates are considered relatively more deprived according to IMD 2019 (e.g. Basildon, Tendring, Harlow), and districts with lower rates relatively less deprived (e.g. Epping Forest, Uttlesford). Time-series of under 75 mortality rate from cancer (all cause and considered preventable),
By Gender, Essex 06/06/2022 | 13 Produced by Essex County Council Chief Executive’s Office Source: [1] Office for Health Improvement & Disparities (PHE); Public Health Outcomes Framework - OHID (phe.org.uk) Under 75 mortality from Cancer, Inequalities [1] [1] [1] Percentage difference between Under 75 cancer mortality rate (all cause and considered preventable) of most and least deprived deciles, England, time-series 2011 - 2020 Under 75 mortality rate from cancer (all cause and considered preventable), by IMD 2019 decile, England, 2020<br>
Areas more deprived across England consistently see a higher rate of mortality from cancer (all cause and preventable) compared to areas less deprived. The gap between the most and least deprived areas has increased. 2020 saw a large increase to now the highest gap in 5 years. The gap is consistently largest for preventable mortality.
Essex districts tending to have higher rates are considered relatively more deprived according to IMD 2019 (e.g. Basildon, Tendring, Harlow), and districts with lower rates relatively less deprived (e.g. Epping Forest, Uttlesford). Time-series of under 75 mortality rate from cancer (all cause and considered preventable),
By Gender, Essex 06/06/2022 | 13 Produced by Essex County Council Chief Executive’s Office Source: [1] Office for Health Improvement & Disparities (PHE); Public Health Outcomes Framework - OHID (phe.org.uk) Under 75 mortality from Cancer, Inequalities [1] [1] [1] Percentage difference between Under 75 cancer mortality rate (all cause and considered preventable) of most and least deprived deciles, England, time-series 2011 - 2020 Under 75 mortality rate from cancer (all cause and considered preventable), by IMD 2019 decile, England, 2020<br>
14
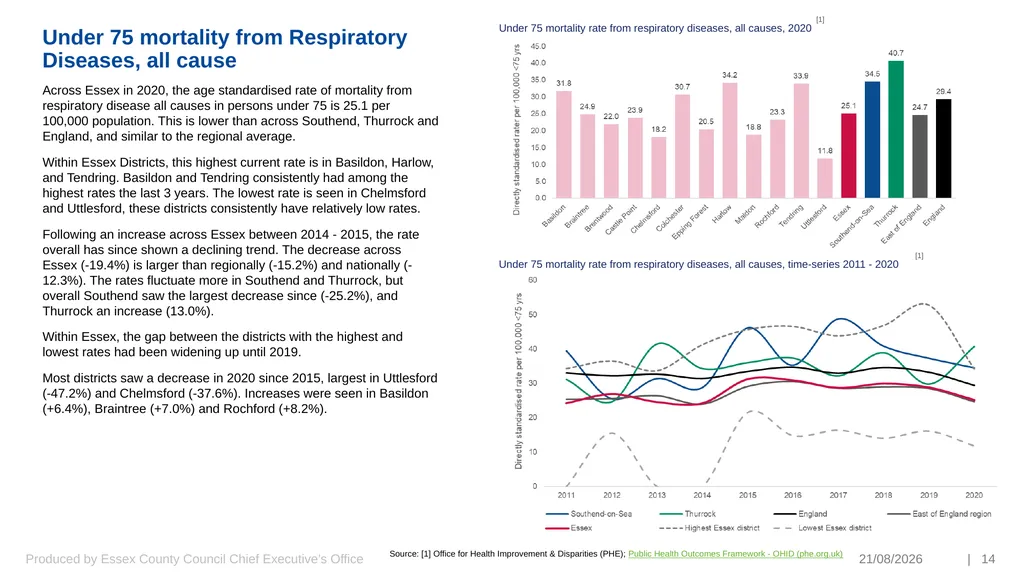
Under 75 mortality rate from respiratory diseases, all causes, 2020 Under 75 mortality rate from respiratory diseases, all causes, time-series 2011 - 2020 Across Essex in 2020, the age standardised rate of mortality from respiratory disease all causes in persons under 75 is 25.1 per 100,000 population. This is lower than across Southend, Thurrock and England, and similar to the regional average.
Within Essex Districts, this highest current rate is in Basildon, Harlow, and Tendring. Basildon and Tendring consistently had among the highest rates the last 3 years. The lowest rate is seen in Chelmsford and Uttlesford, these districts consistently have relatively low rates.
Following an increase across Essex between 2014 - 2015, the rate overall has since shown a declining trend. The decrease across Essex (-19.4%) is larger than regionally (-15.2%) and nationally (-12.3%). The rates fluctuate more in Southend and Thurrock, but overall Southend saw the largest decrease since (-25.2%), and Thurrock an increase (13.0%).
Within Essex, the gap between the districts with the highest and lowest rates had been widening up until 2019.
Most districts saw a decrease in 2020 since 2015, largest in Uttlesford (-47.2%) and Chelmsford (-37.6%). Increases were seen in Basildon (+6.4%), Braintree (+7.0%) and Rochford (+8.2%). 06/06/2022 | 14 Produced by Essex County Council Chief Executive’s Office Source: [1] Office for Health Improvement & Disparities (PHE); Public Health Outcomes Framework - OHID (phe.org.uk) Under 75 mortality from Respiratory Diseases, all cause [1] [1]<br>
Within Essex Districts, this highest current rate is in Basildon, Harlow, and Tendring. Basildon and Tendring consistently had among the highest rates the last 3 years. The lowest rate is seen in Chelmsford and Uttlesford, these districts consistently have relatively low rates.
Following an increase across Essex between 2014 - 2015, the rate overall has since shown a declining trend. The decrease across Essex (-19.4%) is larger than regionally (-15.2%) and nationally (-12.3%). The rates fluctuate more in Southend and Thurrock, but overall Southend saw the largest decrease since (-25.2%), and Thurrock an increase (13.0%).
Within Essex, the gap between the districts with the highest and lowest rates had been widening up until 2019.
Most districts saw a decrease in 2020 since 2015, largest in Uttlesford (-47.2%) and Chelmsford (-37.6%). Increases were seen in Basildon (+6.4%), Braintree (+7.0%) and Rochford (+8.2%). 06/06/2022 | 14 Produced by Essex County Council Chief Executive’s Office Source: [1] Office for Health Improvement & Disparities (PHE); Public Health Outcomes Framework - OHID (phe.org.uk) Under 75 mortality from Respiratory Diseases, all cause [1] [1]<br>
15
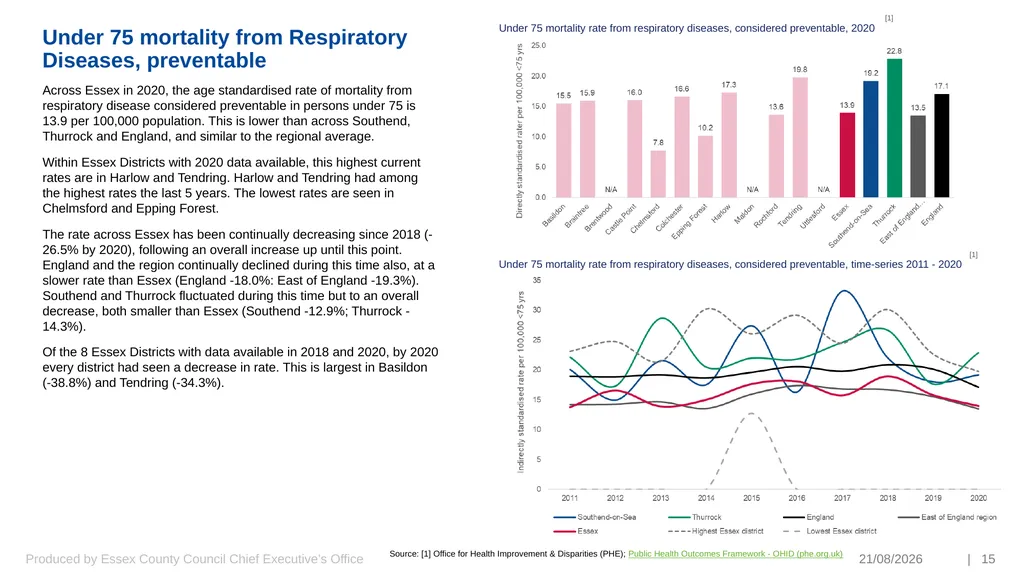
Under 75 mortality rate from respiratory diseases, considered preventable, time-series 2011 - 2020 Under 75 mortality rate from respiratory diseases, considered preventable, 2020 Across Essex in 2020, the age standardised rate of mortality from respiratory disease considered preventable in persons under 75 is 13.9 per 100,000 population. This is lower than across Southend, Thurrock and England, and similar to the regional average.
Within Essex Districts with 2020 data available, this highest current rates are in Harlow and Tendring. Harlow and Tendring had among the highest rates the last 5 years. The lowest rates are seen in Chelmsford and Epping Forest.
The rate across Essex has been continually decreasing since 2018 (-26.5% by 2020), following an overall increase up until this point. England and the region continually declined during this time also, at a slower rate than Essex (England -18.0%: East of England -19.3%). Southend and Thurrock fluctuated during this time but to an overall decrease, both smaller than Essex (Southend -12.9%; Thurrock -14.3%).
Of the 8 Essex Districts with data available in 2018 and 2020, by 2020 every district had seen a decrease in rate. This is largest in Basildon (-38.8%) and Tendring (-34.3%). 06/06/2022 | 15 Produced by Essex County Council Chief Executive’s Office Source: [1] Office for Health Improvement & Disparities (PHE); Public Health Outcomes Framework - OHID (phe.org.uk) Under 75 mortality from Respiratory Diseases, preventable [1] [1]<br>
Within Essex Districts with 2020 data available, this highest current rates are in Harlow and Tendring. Harlow and Tendring had among the highest rates the last 5 years. The lowest rates are seen in Chelmsford and Epping Forest.
The rate across Essex has been continually decreasing since 2018 (-26.5% by 2020), following an overall increase up until this point. England and the region continually declined during this time also, at a slower rate than Essex (England -18.0%: East of England -19.3%). Southend and Thurrock fluctuated during this time but to an overall decrease, both smaller than Essex (Southend -12.9%; Thurrock -14.3%).
Of the 8 Essex Districts with data available in 2018 and 2020, by 2020 every district had seen a decrease in rate. This is largest in Basildon (-38.8%) and Tendring (-34.3%). 06/06/2022 | 15 Produced by Essex County Council Chief Executive’s Office Source: [1] Office for Health Improvement & Disparities (PHE); Public Health Outcomes Framework - OHID (phe.org.uk) Under 75 mortality from Respiratory Diseases, preventable [1] [1]<br>
16
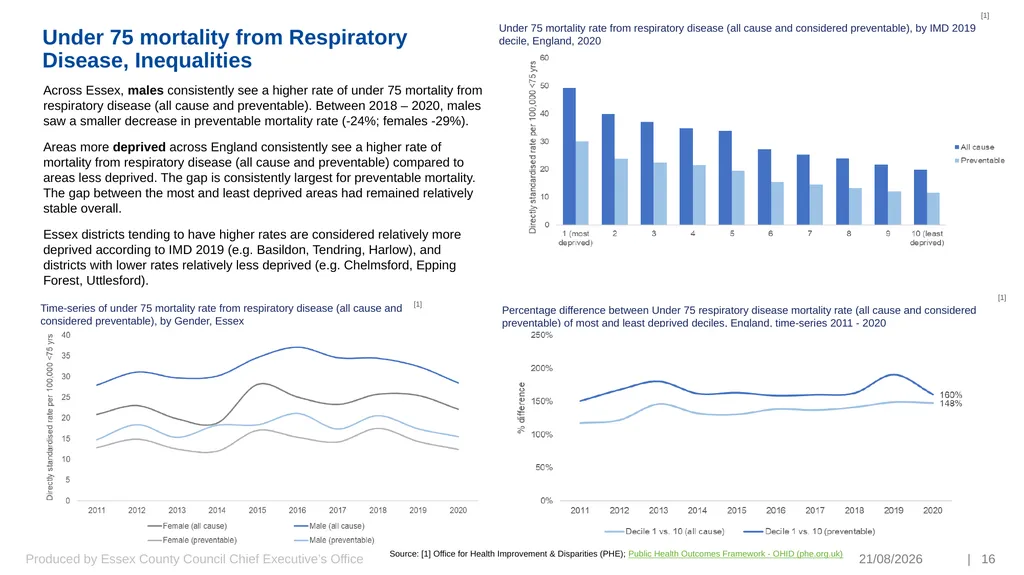
Time-series of under 75 mortality rate from respiratory disease (all cause and
considered preventable), by Gender, Essex Under 75 mortality rate from respiratory disease (all cause and considered preventable), by IMD 2019 decile, England, 2020 Across Essex, males consistently see a higher rate of under 75 mortality from respiratory disease (all cause and preventable). Between 2018 – 2020, males saw a smaller decrease in preventable mortality rate (-24%; females -29%).
Areas more deprived across England consistently see a higher rate of mortality from respiratory disease (all cause and preventable) compared to areas less deprived. The gap is consistently largest for preventable mortality. The gap between the most and least deprived areas had remained relatively stable overall.
Essex districts tending to have higher rates are considered relatively more deprived according to IMD 2019 (e.g. Basildon, Tendring, Harlow), and districts with lower rates relatively less deprived (e.g. Chelmsford, Epping Forest, Uttlesford). 06/06/2022 | 16 Produced by Essex County Council Chief Executive’s Office Source: [1] Office for Health Improvement & Disparities (PHE); Public Health Outcomes Framework - OHID (phe.org.uk) Under 75 mortality from Respiratory Disease, Inequalities [1] [1] [1] Percentage difference between Under 75 respiratory disease mortality rate (all cause and considered preventable) of most and least deprived deciles, England, time-series 2011 - 2020<br>
considered preventable), by Gender, Essex Under 75 mortality rate from respiratory disease (all cause and considered preventable), by IMD 2019 decile, England, 2020 Across Essex, males consistently see a higher rate of under 75 mortality from respiratory disease (all cause and preventable). Between 2018 – 2020, males saw a smaller decrease in preventable mortality rate (-24%; females -29%).
Areas more deprived across England consistently see a higher rate of mortality from respiratory disease (all cause and preventable) compared to areas less deprived. The gap is consistently largest for preventable mortality. The gap between the most and least deprived areas had remained relatively stable overall.
Essex districts tending to have higher rates are considered relatively more deprived according to IMD 2019 (e.g. Basildon, Tendring, Harlow), and districts with lower rates relatively less deprived (e.g. Chelmsford, Epping Forest, Uttlesford). 06/06/2022 | 16 Produced by Essex County Council Chief Executive’s Office Source: [1] Office for Health Improvement & Disparities (PHE); Public Health Outcomes Framework - OHID (phe.org.uk) Under 75 mortality from Respiratory Disease, Inequalities [1] [1] [1] Percentage difference between Under 75 respiratory disease mortality rate (all cause and considered preventable) of most and least deprived deciles, England, time-series 2011 - 2020<br>
17
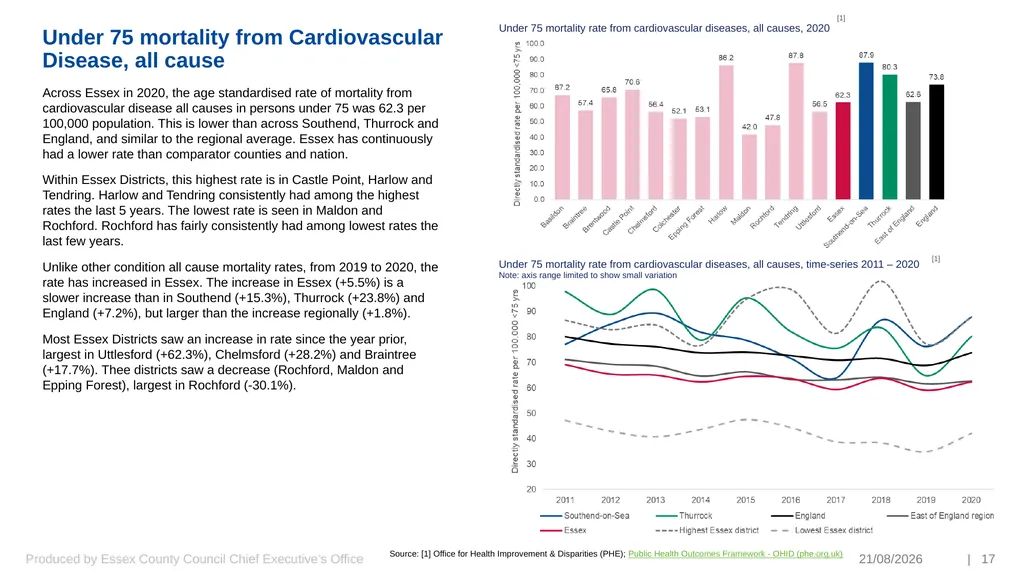
Under 75 mortality rate from cardiovascular diseases, all causes, 2020 Under 75 mortality rate from cardiovascular diseases, all causes, time-series 2011 – 2020
Note: axis range limited to show small variation Across Essex in 2020, the age standardised rate of mortality from cardiovascular disease all causes in persons under 75 was 62.3 per 100,000 population. This is lower than across Southend, Thurrock and England, and similar to the regional average. Essex has continuously had a lower rate than comparator counties and nation.
Within Essex Districts, this highest rate is in Castle Point, Harlow and Tendring. Harlow and Tendring consistently had among the highest rates the last 5 years. The lowest rate is seen in Maldon and Rochford. Rochford has fairly consistently had among lowest rates the last few years.
Unlike other condition all cause mortality rates, from 2019 to 2020, the rate has increased in Essex. The increase in Essex (+5.5%) is a slower increase than in Southend (+15.3%), Thurrock (+23.8%) and England (+7.2%), but larger than the increase regionally (+1.8%).
Most Essex Districts saw an increase in rate since the year prior, largest in Uttlesford (+62.3%), Chelmsford (+28.2%) and Braintree (+17.7%). Thee districts saw a decrease (Rochford, Maldon and Epping Forest), largest in Rochford (-30.1%). 06/06/2022 | 17 Produced by Essex County Council Chief Executive’s Office Source: [1] Office for Health Improvement & Disparities (PHE); Public Health Outcomes Framework - OHID (phe.org.uk) Under 75 mortality from Cardiovascular Disease, all cause [1] [1]<br>
Note: axis range limited to show small variation Across Essex in 2020, the age standardised rate of mortality from cardiovascular disease all causes in persons under 75 was 62.3 per 100,000 population. This is lower than across Southend, Thurrock and England, and similar to the regional average. Essex has continuously had a lower rate than comparator counties and nation.
Within Essex Districts, this highest rate is in Castle Point, Harlow and Tendring. Harlow and Tendring consistently had among the highest rates the last 5 years. The lowest rate is seen in Maldon and Rochford. Rochford has fairly consistently had among lowest rates the last few years.
Unlike other condition all cause mortality rates, from 2019 to 2020, the rate has increased in Essex. The increase in Essex (+5.5%) is a slower increase than in Southend (+15.3%), Thurrock (+23.8%) and England (+7.2%), but larger than the increase regionally (+1.8%).
Most Essex Districts saw an increase in rate since the year prior, largest in Uttlesford (+62.3%), Chelmsford (+28.2%) and Braintree (+17.7%). Thee districts saw a decrease (Rochford, Maldon and Epping Forest), largest in Rochford (-30.1%). 06/06/2022 | 17 Produced by Essex County Council Chief Executive’s Office Source: [1] Office for Health Improvement & Disparities (PHE); Public Health Outcomes Framework - OHID (phe.org.uk) Under 75 mortality from Cardiovascular Disease, all cause [1] [1]<br>
18
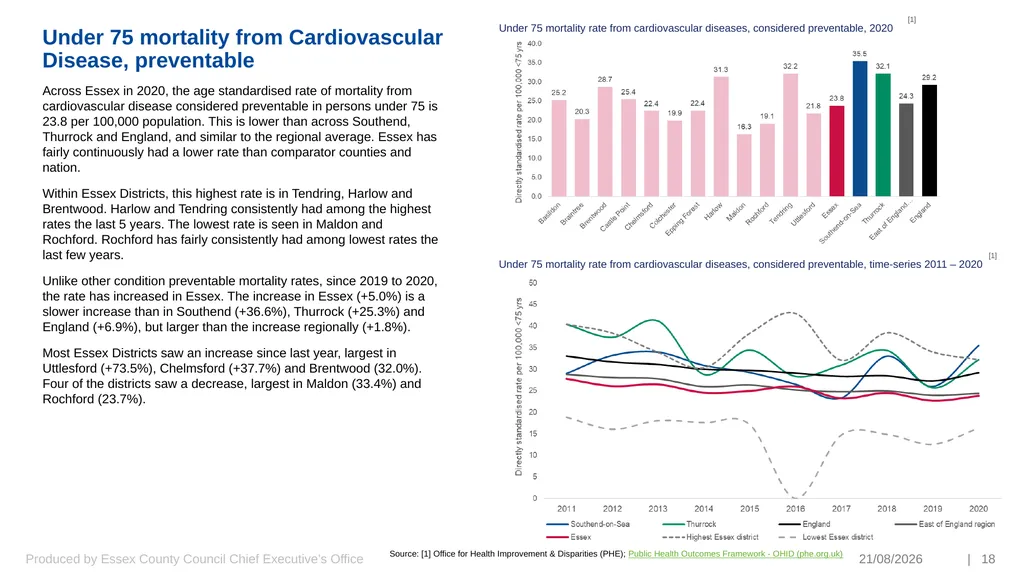
Under 75 mortality rate from cardiovascular diseases, considered preventable, time-series 2011 – 2020 Under 75 mortality rate from cardiovascular diseases, considered preventable, 2020 Across Essex in 2020, the age standardised rate of mortality from cardiovascular disease considered preventable in persons under 75 is 23.8 per 100,000 population. This is lower than across Southend, Thurrock and England, and similar to the regional average. Essex has fairly continuously had a lower rate than comparator counties and nation.
Within Essex Districts, this highest rate is in Tendring, Harlow and Brentwood. Harlow and Tendring consistently had among the highest rates the last 5 years. The lowest rate is seen in Maldon and Rochford. Rochford has fairly consistently had among lowest rates the last few years.
Unlike other condition preventable mortality rates, since 2019 to 2020, the rate has increased in Essex. The increase in Essex (+5.0%) is a slower increase than in Southend (+36.6%), Thurrock (+25.3%) and England (+6.9%), but larger than the increase regionally (+1.8%).
Most Essex Districts saw an increase since last year, largest in Uttlesford (+73.5%), Chelmsford (+37.7%) and Brentwood (32.0%). Four of the districts saw a decrease, largest in Maldon (33.4%) and Rochford (23.7%). 06/06/2022 | 18 Produced by Essex County Council Chief Executive’s Office Source: [1] Office for Health Improvement & Disparities (PHE); Public Health Outcomes Framework - OHID (phe.org.uk) Under 75 mortality from Cardiovascular Disease, preventable [1] [1]<br>
Within Essex Districts, this highest rate is in Tendring, Harlow and Brentwood. Harlow and Tendring consistently had among the highest rates the last 5 years. The lowest rate is seen in Maldon and Rochford. Rochford has fairly consistently had among lowest rates the last few years.
Unlike other condition preventable mortality rates, since 2019 to 2020, the rate has increased in Essex. The increase in Essex (+5.0%) is a slower increase than in Southend (+36.6%), Thurrock (+25.3%) and England (+6.9%), but larger than the increase regionally (+1.8%).
Most Essex Districts saw an increase since last year, largest in Uttlesford (+73.5%), Chelmsford (+37.7%) and Brentwood (32.0%). Four of the districts saw a decrease, largest in Maldon (33.4%) and Rochford (23.7%). 06/06/2022 | 18 Produced by Essex County Council Chief Executive’s Office Source: [1] Office for Health Improvement & Disparities (PHE); Public Health Outcomes Framework - OHID (phe.org.uk) Under 75 mortality from Cardiovascular Disease, preventable [1] [1]<br>
19
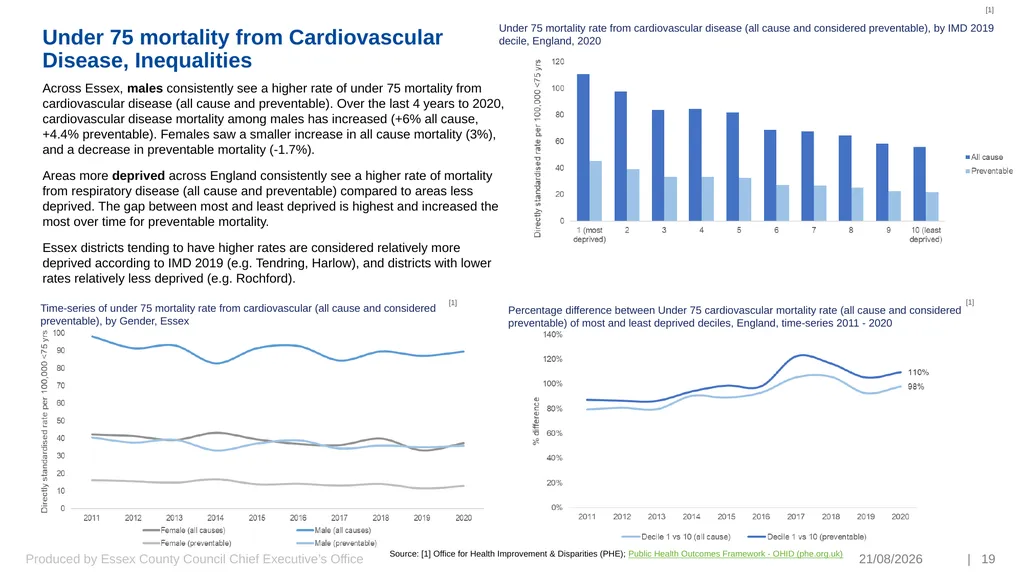
Across Essex, males consistently see a higher rate of under 75 mortality from cardiovascular disease (all cause and preventable). Over the last 4 years to 2020, cardiovascular disease mortality among males has increased (+6% all cause, +4.4% preventable). Females saw a smaller increase in all cause mortality (3%), and a decrease in preventable mortality (-1.7%).
Areas more deprived across England consistently see a higher rate of mortality from respiratory disease (all cause and preventable) compared to areas less deprived. The gap between most and least deprived is highest and increased the most over time for preventable mortality.
Essex districts tending to have higher rates are considered relatively more deprived according to IMD 2019 (e.g. Tendring, Harlow), and districts with lower rates relatively less deprived (e.g. Rochford). 06/06/2022 | 19 Produced by Essex County Council Chief Executive’s Office Source: [1] Office for Health Improvement & Disparities (PHE); Public Health Outcomes Framework - OHID (phe.org.uk) Under 75 mortality from Cardiovascular Disease, Inequalities [1] [1] [1] Time-series of under 75 mortality rate from cardiovascular (all cause and considered preventable), by Gender, Essex Percentage difference between Under 75 cardiovascular mortality rate (all cause and considered preventable) of most and least deprived deciles, England, time-series 2011 - 2020 Under 75 mortality rate from cardiovascular disease (all cause and considered preventable), by IMD 2019 decile, England, 2020<br>
Areas more deprived across England consistently see a higher rate of mortality from respiratory disease (all cause and preventable) compared to areas less deprived. The gap between most and least deprived is highest and increased the most over time for preventable mortality.
Essex districts tending to have higher rates are considered relatively more deprived according to IMD 2019 (e.g. Tendring, Harlow), and districts with lower rates relatively less deprived (e.g. Rochford). 06/06/2022 | 19 Produced by Essex County Council Chief Executive’s Office Source: [1] Office for Health Improvement & Disparities (PHE); Public Health Outcomes Framework - OHID (phe.org.uk) Under 75 mortality from Cardiovascular Disease, Inequalities [1] [1] [1] Time-series of under 75 mortality rate from cardiovascular (all cause and considered preventable), by Gender, Essex Percentage difference between Under 75 cardiovascular mortality rate (all cause and considered preventable) of most and least deprived deciles, England, time-series 2011 - 2020 Under 75 mortality rate from cardiovascular disease (all cause and considered preventable), by IMD 2019 decile, England, 2020<br>
20
Contact Us
This information is issued by:
Essex County Council
Strategy, Insight & Engagement
Research & Citizen Insight
You can contact us in the following ways:
By email:
research@essex.gov.uk
Alastair.Gordon@essex.gov.uk;
Visit our website:
www.essex.gov.uk
By telephone:
033301 30874
By post:
Essex County Council, Research & Citizen Insight (SIE)
E4, County Hall, Chelmsford, Essex CM1 1QH<br>
This information is issued by:
Essex County Council
Strategy, Insight & Engagement
Research & Citizen Insight
You can contact us in the following ways:
By email:
research@essex.gov.uk
Alastair.Gordon@essex.gov.uk;
Visit our website:
www.essex.gov.uk
By telephone:
033301 30874
By post:
Essex County Council, Research & Citizen Insight (SIE)
E4, County Hall, Chelmsford, Essex CM1 1QH<br>