01
Probability A Coin Toss Activity<br>
02
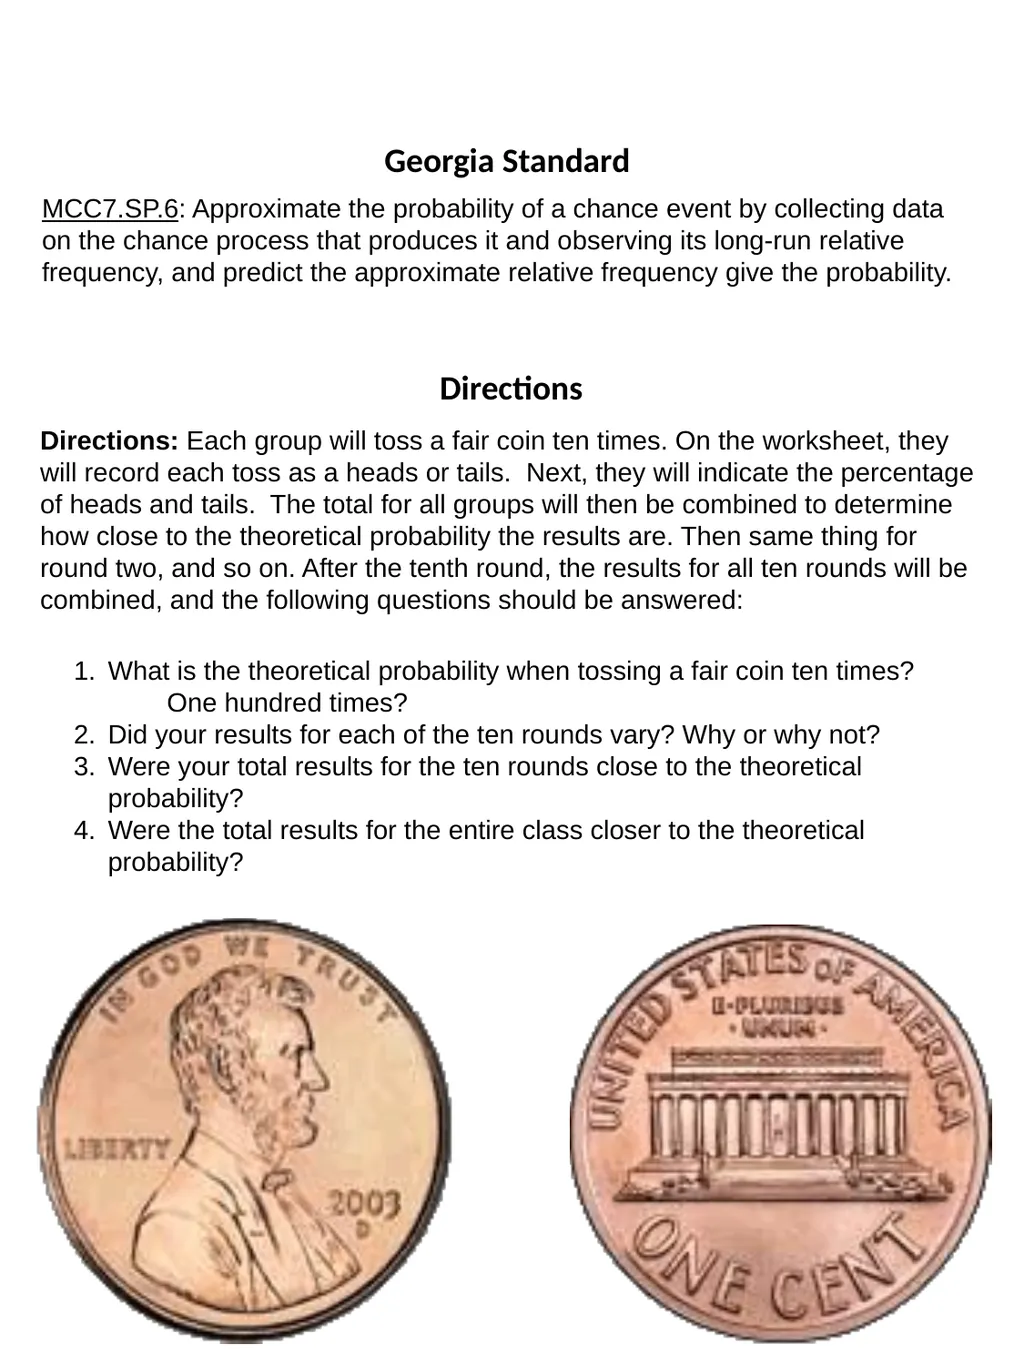
Directions: Each group will toss a fair coin ten times. On the worksheet, they will record each toss as a heads or tails. Next, they will indicate the percentage of heads and tails. The total for all groups will then be combined to determine how close to the theoretical probability the results are. Then same thing for round two, and so on. After the tenth round, the results for all ten rounds will be combined, and the following questions should be answered: MCC7.SP.6: Approximate the probability of a chance event by collecting data on the chance process that produces it and observing its long-run relative frequency, and predict the approximate relative frequency give the probability. What is the theoretical probability when tossing a fair coin ten times? One hundred times?
Did your results for each of the ten rounds vary? Why or why not?
Were your total results for the ten rounds close to the theoretical probability?
Were the total results for the entire class closer to the theoretical probability? Georgia Standard Directions<br>
03
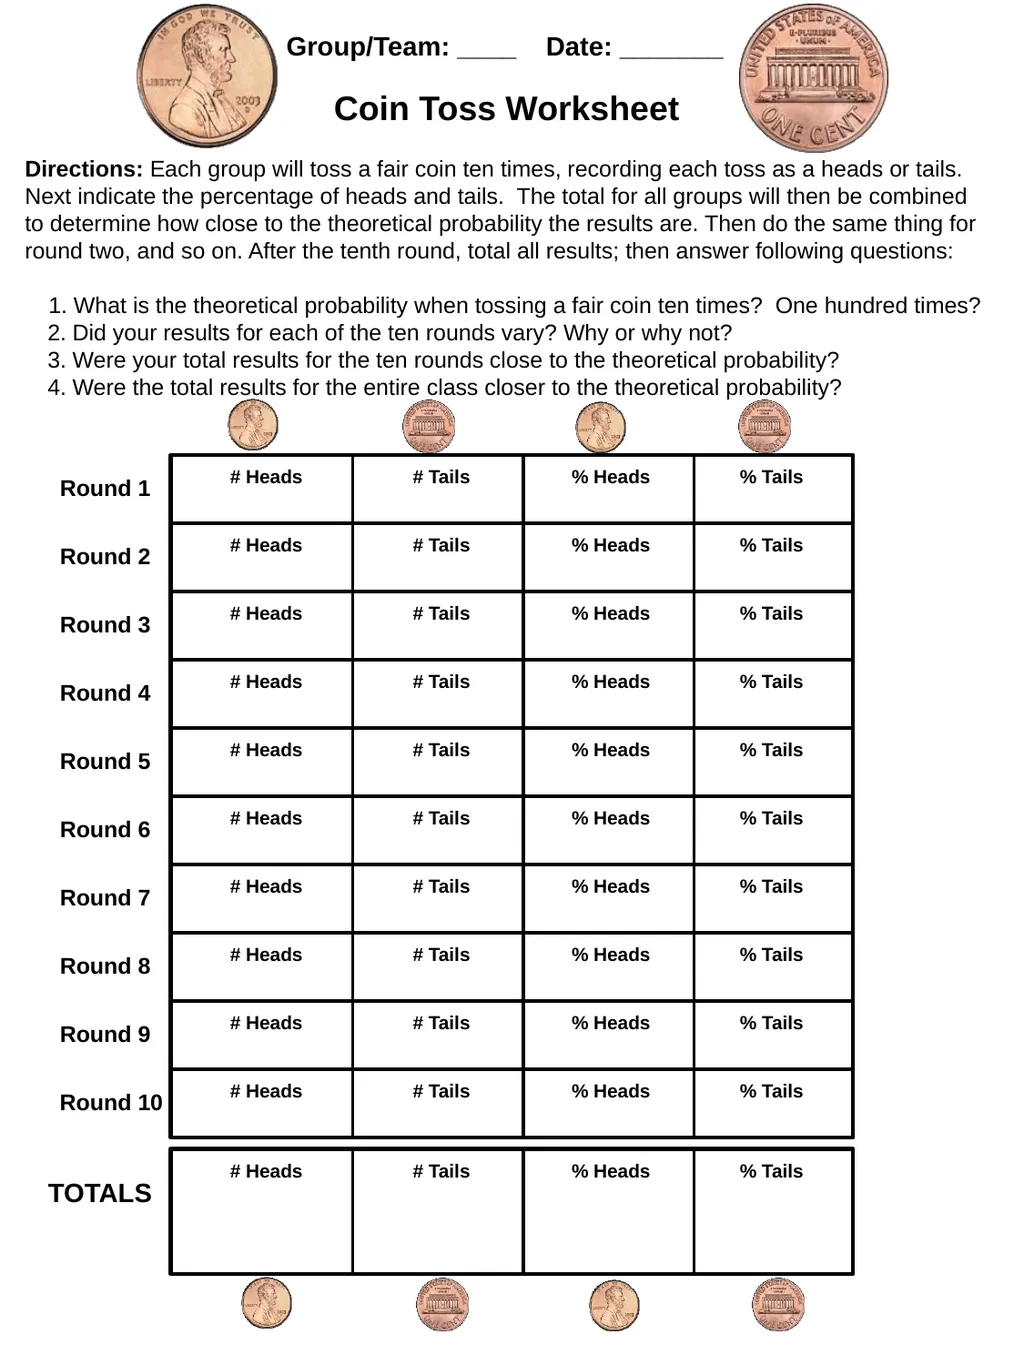
Round 1 Directions: Each group will toss a fair coin ten times, recording each toss as a heads or tails. Next indicate the percentage of heads and tails. The total for all groups will then be combined to determine how close to the theoretical probability the results are. Then do the same thing for round two, and so on. After the tenth round, total all results; then answer following questions: Coin Toss Worksheet What is the theoretical probability when tossing a fair coin ten times? One hundred times?
Did your results for each of the ten rounds vary? Why or why not?
Were your total results for the ten rounds close to the theoretical probability?
Were the total results for the entire class closer to the theoretical probability? Round 2 Round 3 Round 6 Round 10 Round 4 Round 5 Round 8 Round 7 Round 9 TOTALS # Heads # Tails % Heads % Tails Group/Team: ____ Date: _______<br>