
RECOMMENDATION: HOLD 1 Ticker: SXT Analyst:
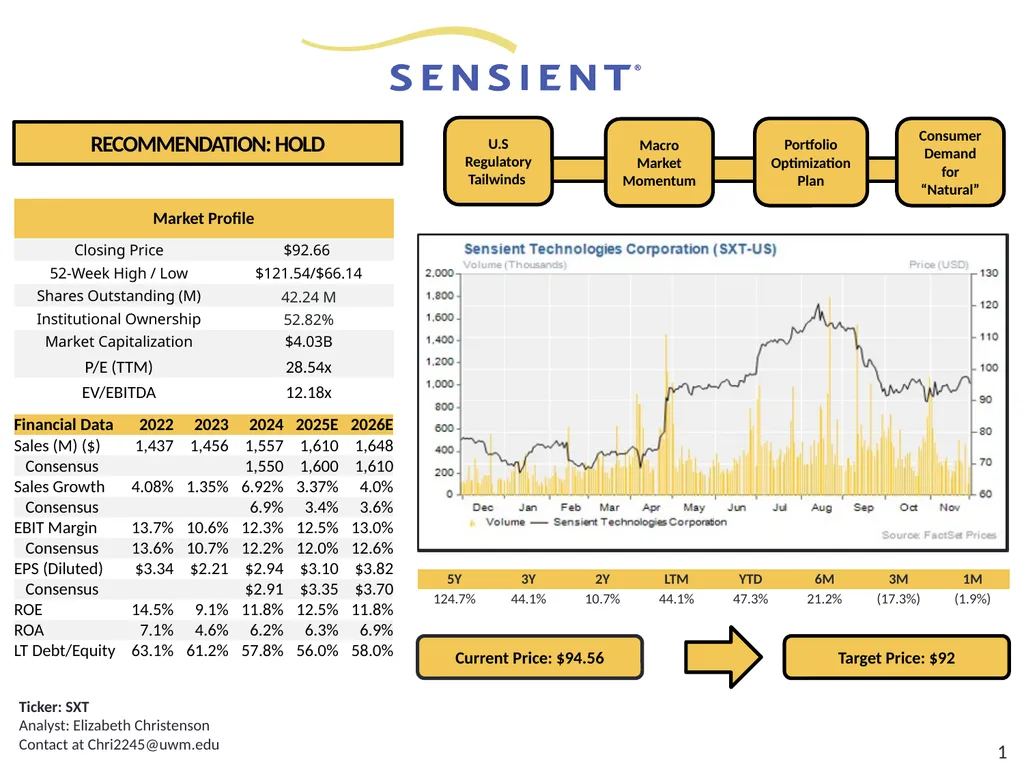












Description: RECOMMENDATION: HOLD 1 Ticker: SXT Analyst: Elizabeth Christenson Contact at Chri2245uwm.edu 2 2 Key Highlights Business Description Figure 1: Revenue by segment 3 Sensient Technologies Corporation (NYSE: SXT) is a global manufacturer of
Related Topics
Download Presentation
"RECOMMENDATION: HOLD 1 Ticker: SXT Analyst:" is the property of its rightful owner. Permission is granted to download and print the materials on this website for personal, non-commercial use only, and to display it on your personal computer provided you do not modify the materials and that you retain all copyright notices contained in the materials. By downloading content from our website, you accept the terms of this agreement.
Presentation Transcript
slide1. RECOMMENDATION: HOLD 1 Ticker: SXT
Analyst: Elizabeth Christenson
Contact at Chri2245@uwm.edu<br>
slide2. 2 2 Key Highlights<br>
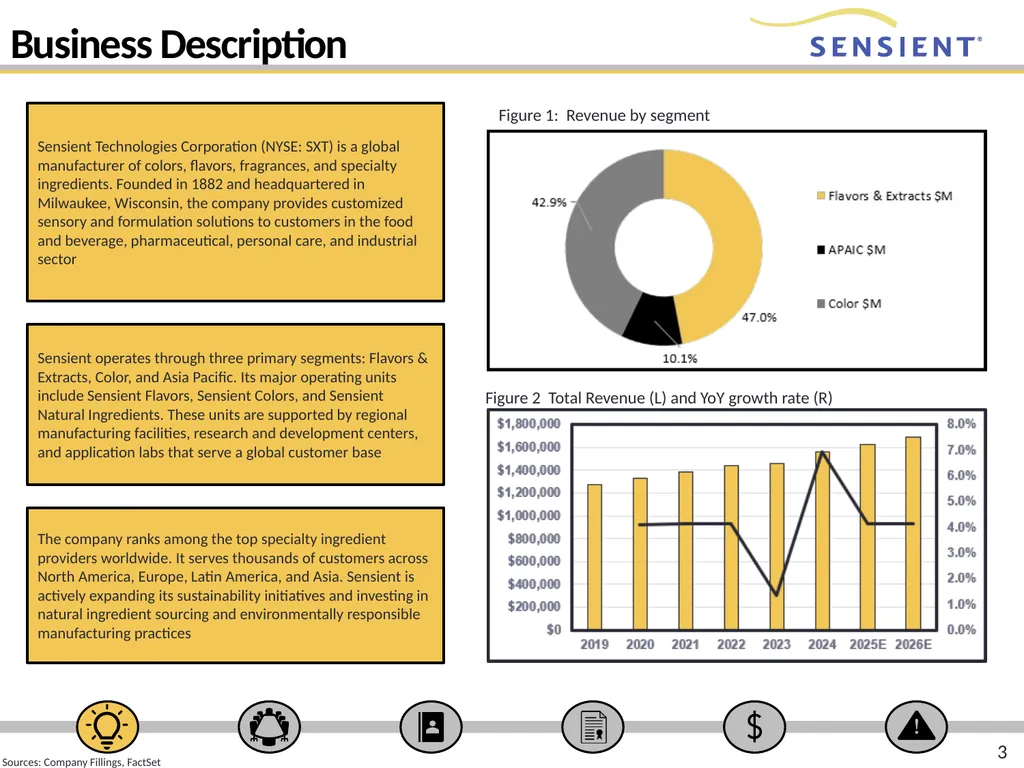
slide3. Business Description Figure 1: Revenue by segment 3 Sensient Technologies Corporation (NYSE: SXT) is a global manufacturer of colors, flavors, fragrances, and specialty ingredients. Founded in 1882 and headquartered in Milwaukee, Wisconsin, the company provides customized sensory and formulation solutions to customers in the food and beverage, pharmaceutical, personal care, and industrial sector Sensient operates through three primary segments: Flavors & Extracts, Color, and Asia Pacific. Its major operating units include Sensient Flavors, Sensient Colors, and Sensient Natural Ingredients. These units are supported by regional manufacturing facilities, research and development centers, and application labs that serve a global customer base Figure 2 Total Revenue (L) and YoY growth rate (R) The company ranks among the top specialty ingredient providers worldwide. It serves thousands of customers across North America, Europe, Latin America, and Asia. Sensient is actively expanding its sustainability initiatives and investing in natural ingredient sourcing and environmentally responsible manufacturing practices Sources: Company Fillings, FactSet<br>
slide4. Revenue Segments Color Group Flavors & Extracts Group 4 Asia Pacific Group The color segment contributes (42.9%) of total revenue. Performance is heavily influenced by the Food & Beverage and Personal care line. Recent restructuring aims to improve margins despite lower volumes The Asia Pacific group represents the smallest revenue portion (10.1%) but offers higher growth potential. Focus remains on expanding local sales execution and technical service capabilities in the region. The Flavors & Extracts segment accounts for approximately (49.5%) total revenue. Growth is primarily driven by pricing actions to offset raw material inflation and volume recovery in the savory and natural ingredients categories Figure 3: 2025 Total Operating Sales by Geography (millions) Sources: Company Fillings, FactSet<br>
slide5. 5 Key Highlights 5<br>
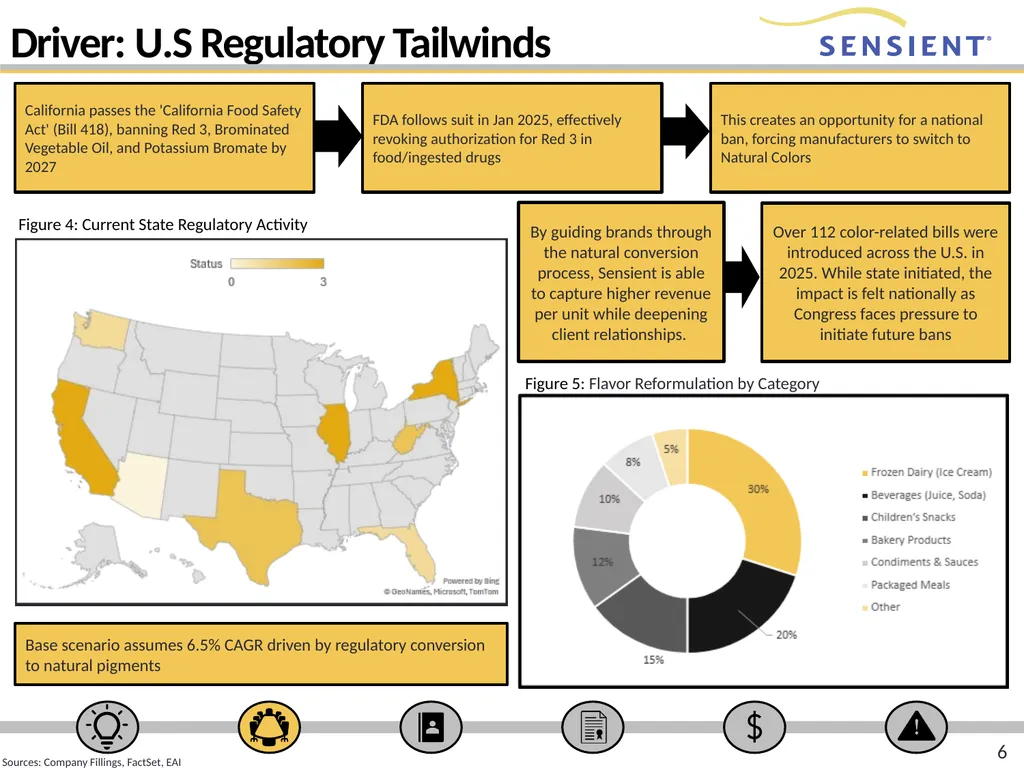
slide6. Driver: U.S Regulatory Tailwinds California passes the 'California Food Safety Act' (Bill 418), banning Red 3, Brominated Vegetable Oil, and Potassium Bromate by 2027 FDA follows suit in Jan 2025, effectively revoking authorization for Red 3 in food/ingested drugs This creates an opportunity for a national ban, forcing manufacturers to switch to Natural Colors By guiding brands through the natural conversion process, Sensient is able to capture higher revenue per unit while deepening client relationships. Over 112 color-related bills were introduced across the U.S. in 2025. While state initiated, the impact is felt nationally as Congress faces pressure to initiate future bans 6 Figure 4: Current State Regulatory Activity Figure 5: Flavor Reformulation by Category Base scenario assumes 6.5% CAGR driven by regulatory conversion to natural pigments Sources: Company Fillings, FactSet, EAI<br>
slide7. Driver: Portfolio Optimization Plan Figure 6: Cost Savings & Restructuring (In Millions) Figure 8: Added EPS 2025 Figure 7: EPS Percent Impact 7 This savings flows directly into Sensient's operating income (EBIT). Assuming a stable sales environment, these are projected to contribute approximately $0.18 to annual EPS by 2026, reducing risks associate with raw material inflation Figure 9: Added EPS 2026 Sensient is executing a 'Portfolio Optimization Plan' involving the closure of underperforming manufacturing facilities and the elimination of redundant operational roles. This trades one-time restructuring charges in 2024 for permanent structural cost reductions Removing $10M of fixed costs gives Sensient more operational leverage and every dollar of sales going forward will have a higher marginal profit, boosting EPS and ROE Sources: Company Fillings, FactSet, IMCP, EAI<br>
slide8. Driver: Portfolio Optimization Plan Figure 10: Project Impact of Optimization Figure 11: SXT P/S vs Net Margin 8 Figure 12: SXT Gross Margin Over Time or Gross Margin and EBITDA Margin chart In Q4 2023, Sensient initiated a 'Portfolio Optimization Plan' to structurally lower its fixed cost base. By eliminating redundant manufacturing capacity and streamlining administrative roles, the initiative targets Gross Margin expansion and SG&A reduction. Sources: Company Fillings, FactSet, IMCP, EAI<br>
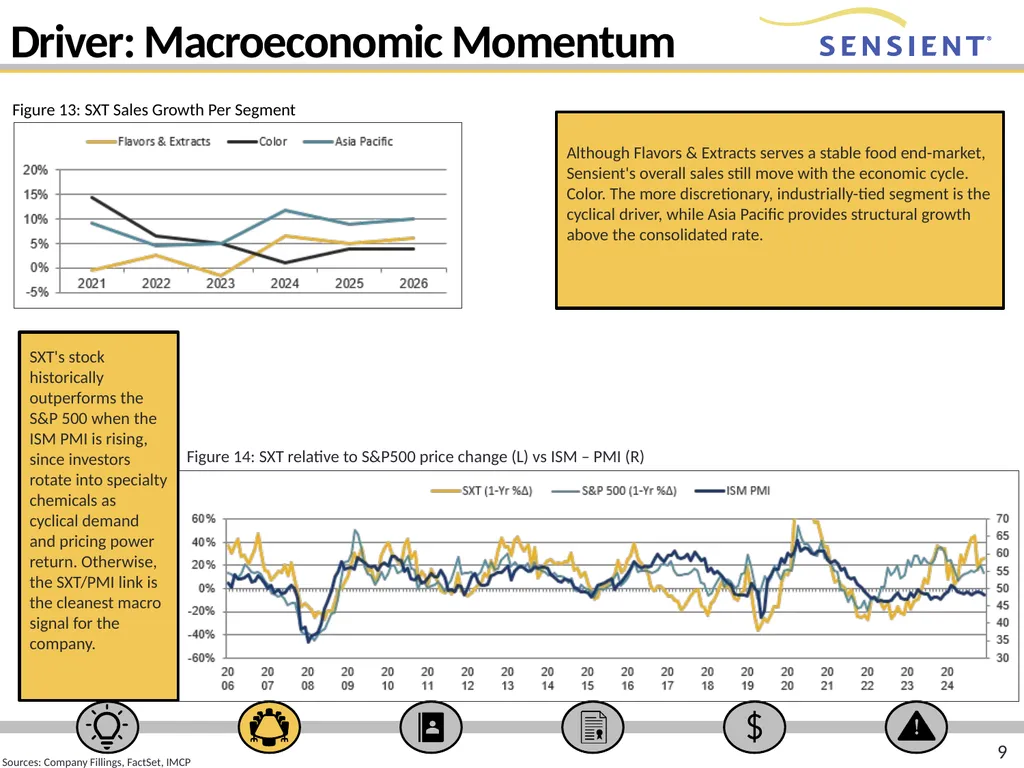
slide9. Driver: Macroeconomic Momentum Figure 13: SXT Sales Growth Per Segment Although Flavors & Extracts serves a stable food end-market, Sensient's overall sales still move with the economic cycle. Color. The more discretionary, industrially-tied segment is the cyclical driver, while Asia Pacific provides structural growth above the consolidated rate. 9 SXT's stock historically outperforms the S&P 500 when the ISM PMI is rising, since investors rotate into specialty chemicals as cyclical demand and pricing power return. Otherwise, the SXT/PMI link is the cleanest macro signal for the company. Figure 14: SXT relative to S&P500 price change (L) vs ISM – PMI (R) Sources: Company Fillings, FactSet, IMCP<br>
slide10. Driver: Consumer Demand for “Natural” Consumers are increasingly scrutinizing product labels, with 72% defining 'Clean Label' as free from synthetic ingredients. This has forced major CPG brands to reformulate legacy brands with natural alternatives to maintain market share Figure 15: Natural Color Conversion Breakdown Sensient is capitalizing on this by expanding its 'Certasure™' natural supply chain. The company is investing around $90M annually in CapEx, primarily to increase natural color capacity to meet this structural demand shift Figure 16: Natural Conversion" Opportunity by Category 10 While reformulation of old products is steady, 90% of new product launches in North America now launch with natural colors by default. Natural colors are technically difficult to stabilize and have a price premium (4x-10x) over synthetics. Because Sensient provides the R&D to stabilize these formulas, they capture both margin percentage expansion and significantly higher dollars per unit produced. Sources: Company Fillings, FactSet, IMCP<br>
slide11. 11 Key Highlights 11<br>
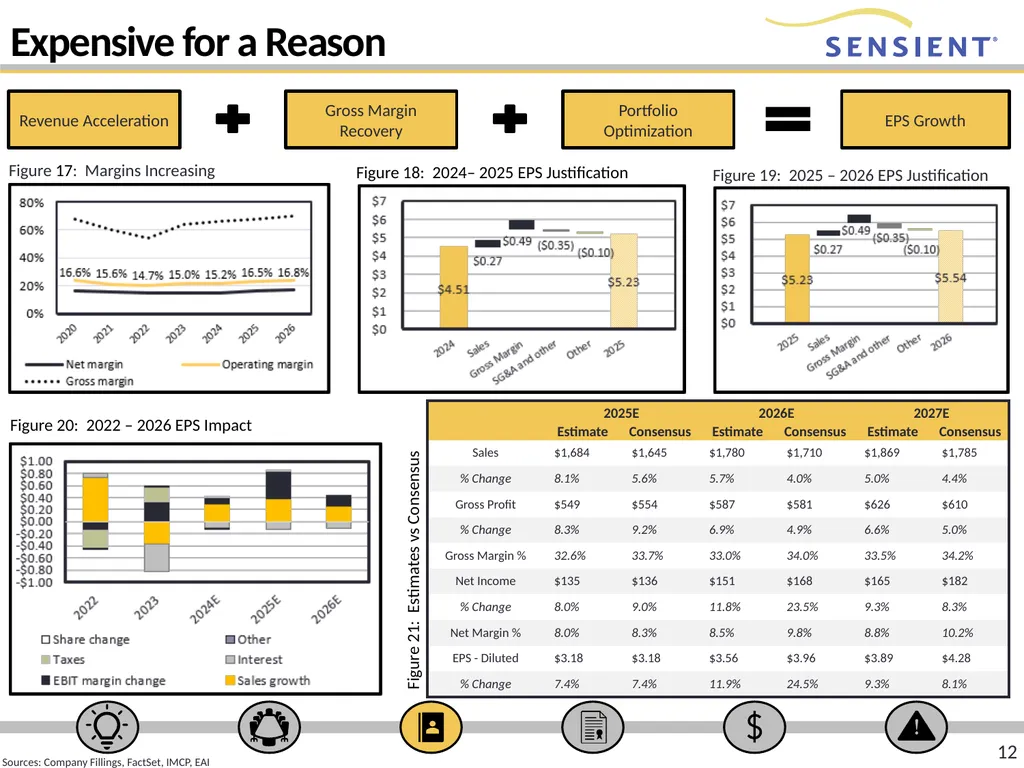
slide12. Expensive for a Reason Figure 17: Margins Increasing Figure 18: 2024– 2025 EPS Justification Figure 19: 2025 – 2026 EPS Justification 12 Figure 21: Estimates vs Consensus Figure 20: 2022 – 2026 EPS Impact Sources: Company Fillings, FactSet, IMCP, EAI<br>
slide13. Operational Efficiency Driving Cash Flow Recovery Figure 23: Use of Free Cash Flow Figure 22: Free Cash Flow Per Share 13 As Sensient becomes more efficient with its use of working capital, the business requires less to grow, converting a higher percentage of earnings into cash now being used for dividends (2024+). Figure 25: Dividend vs Net income Figure 24: FCFE Sources: Company Fillings, FactSet, IMCP, EAI<br>
slide14. ROE, Leverage, and Profitability Analysis Figure 26: Leverage and Profitability Metrics SXT’s ROE is expected to remain stable from 2023 through 2026, reflecting consistent asset efficiency. EBIT margins are projected to improve modestly, while asset turnover is expected to hold steady. ROE rises as leverage declines, so its ROE is higher quality. Figure 27: SXT Price vs S&P Chemicals vs Food Products 14 Figure 28: 5 Stage DuPont Analysis Sources: Company Fillings, FactSet, IMCP, EAI<br>
slide15. 15 15 Key Highlights<br>
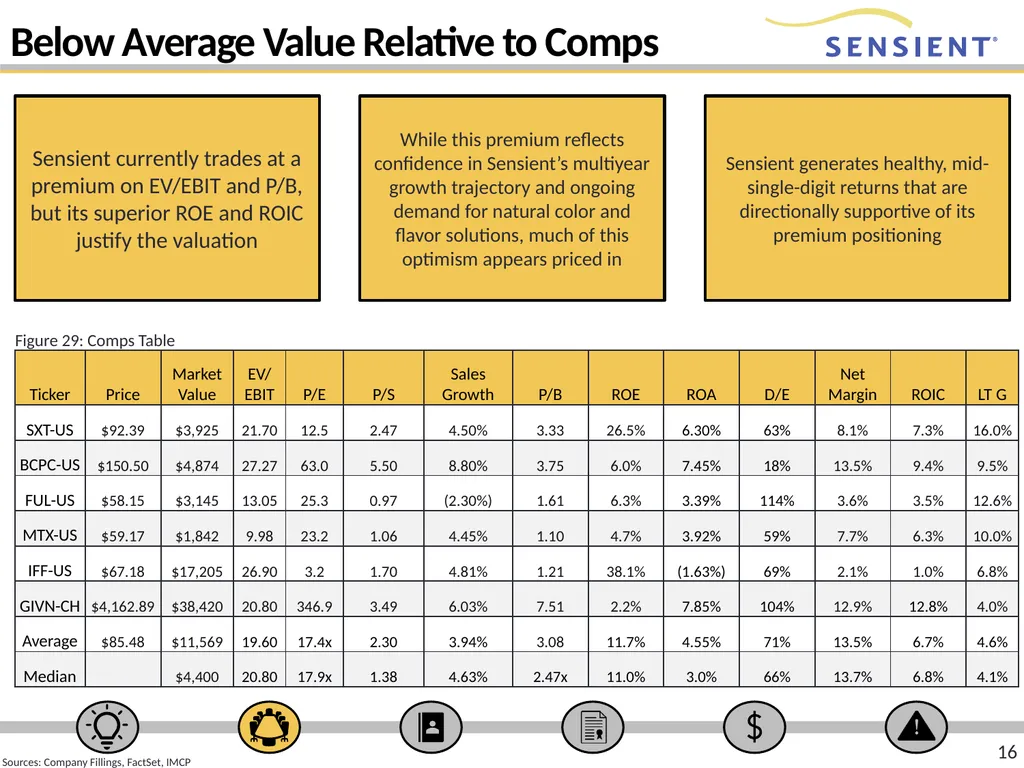
slide16. Below Average Value Relative to Comps While this premium reflects confidence in Sensient’s multiyear growth trajectory and ongoing demand for natural color and flavor solutions, much of this optimism appears priced in 16 Sensient currently trades at a premium on EV/EBIT and P/B, but its superior ROE and ROIC justify the valuation Sensient generates healthy, mid-single-digit returns that are directionally supportive of its premium positioning Figure 29: Comps Table Sources: Company Fillings, FactSet, IMCP<br>
slide17. Fairly Valued (All Things Considered) Figure 30: Composite relative valuation 17 Fundamental Factors
ROE (50%)
NPM 2024 (45th Percentile)
NTM sales growth (80th Percentile%)
Valuation
P/S (75%)
EV/EBIT (65th percentile) 19x EV/EBIT multiple, striking a balance between its premium 'Natural Color' moat and its exposure to generic raw material inflation Figure 31: Comparable fundamental & valuation weights Several fundamental metrics are important to valuation. To compare a composite of fundamental factors to a composite of valuation factors, the raw data was first converted to percentiles based on the maximum value for each factor in the comp group. Then, the percentile for each factor was weighted according to perceived importance to create the final composites. Sources: Company Fillings, FactSet, IMCP<br>
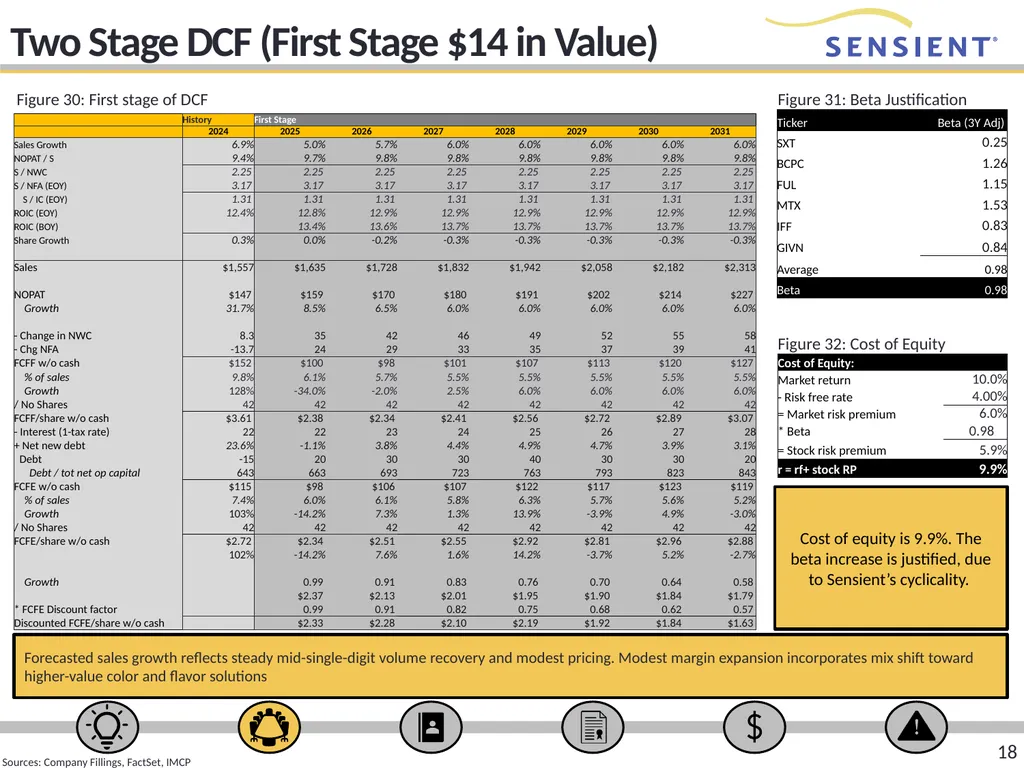
slide18. Two Stage DCF (First Stage $14 in Value) 18 Figure 30: First stage of DCF Figure 31: Beta Justification Figure 32: Cost of Equity Cost of equity is 9.9%. The beta increase is justified, due to Sensient’s cyclicality. Forecasted sales growth reflects steady mid-single-digit volume recovery and modest pricing. Modest margin expansion incorporates mix shift toward higher-value color and flavor solutions Sources: Company Fillings, FactSet, IMCP<br>
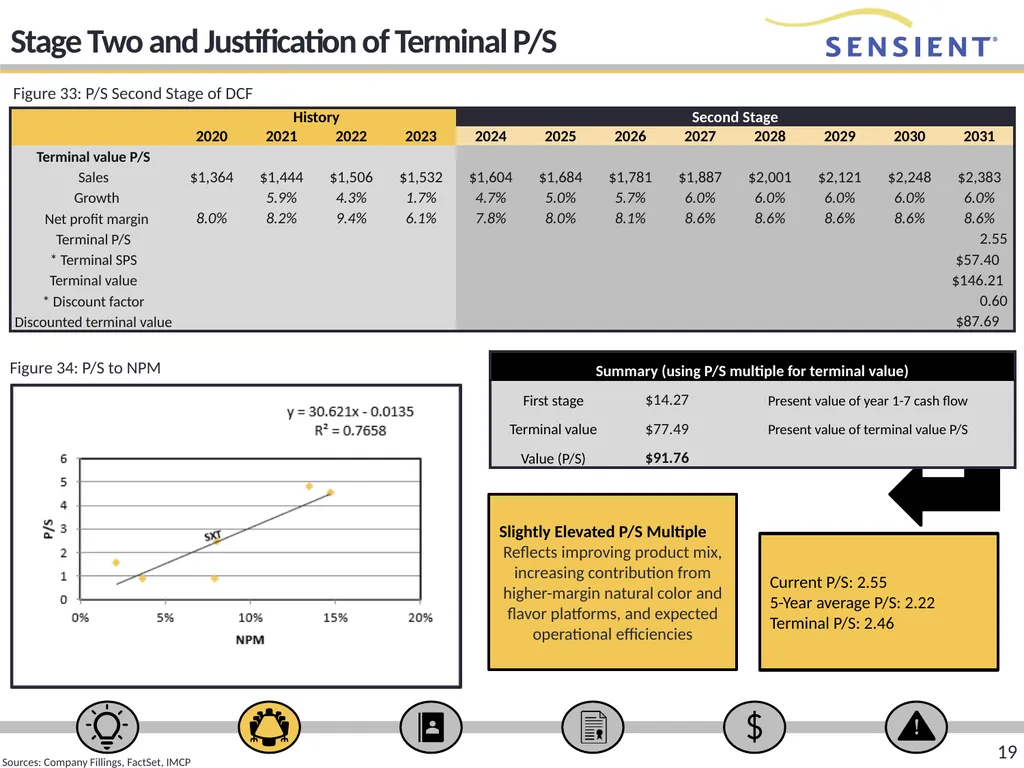
slide19. Stage Two and Justification of Terminal P/S 19 Figure 33: P/S Second Stage of DCF Figure 34: P/S to NPM Slightly Elevated P/S Multiple
Reflects improving product mix, increasing contribution from higher-margin natural color and flavor platforms, and expected operational efficiencies Current P/S: 2.55
5-Year average P/S: 2.22
Terminal P/S: 2.46 Sources: Company Fillings, FactSet, IMCP<br>
slide20. 20 Key Highlights Risks, SWOT Analysis, and Porter’s Five Forces 20<br>
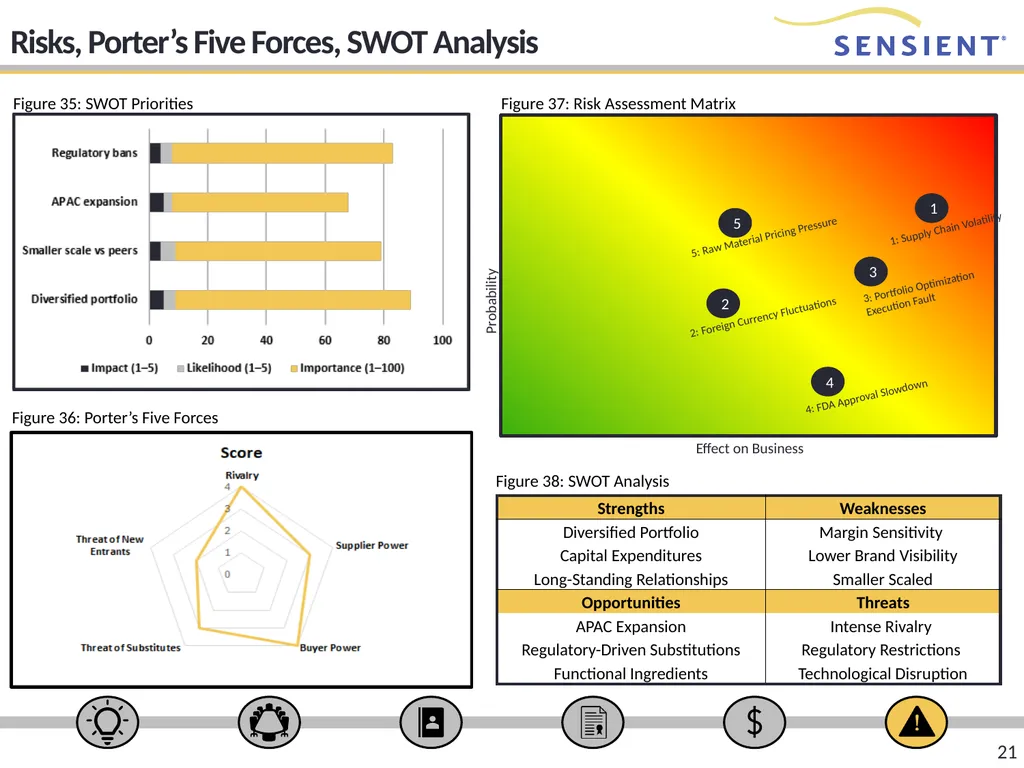
slide21. Risks, Porter’s Five Forces, SWOT Analysis Figure 35: SWOT Priorities Figure 37: Risk Assessment Matrix 21 1: Supply Chain Volatility 3: Portfolio Optimization Execution Fault 2: Foreign Currency Fluctuations 4: FDA Approval Slowdown 5: Raw Material Pricing Pressure Figure 36: Porter’s Five Forces Figure 38: SWOT Analysis<br>
slide22. Summary 22 RECOMMENDATION: HOLD Sensient Technologies presents a neutral downside for investors, from its current price of $94.56 to a target price of $92. While much of its growth potential already priced in, the company remains well‑positioned for steady expansion supported by favorable macroeconomic trends, regulatory momentum in natural colors, and ongoing portfolio optimization. Despite risks related to raw material costs, supply chain constraints, and regulatory challenges, Sensient’s ability to navigate industry headwinds make it a reliable Hold for investors seeking exposure to specialty chemicals with moderate growth prospects<br>
Analyst: Elizabeth Christenson
Contact at Chri2245@uwm.edu<br>
slide2. 2 2 Key Highlights<br>
slide3. Business Description Figure 1: Revenue by segment 3 Sensient Technologies Corporation (NYSE: SXT) is a global manufacturer of colors, flavors, fragrances, and specialty ingredients. Founded in 1882 and headquartered in Milwaukee, Wisconsin, the company provides customized sensory and formulation solutions to customers in the food and beverage, pharmaceutical, personal care, and industrial sector Sensient operates through three primary segments: Flavors & Extracts, Color, and Asia Pacific. Its major operating units include Sensient Flavors, Sensient Colors, and Sensient Natural Ingredients. These units are supported by regional manufacturing facilities, research and development centers, and application labs that serve a global customer base Figure 2 Total Revenue (L) and YoY growth rate (R) The company ranks among the top specialty ingredient providers worldwide. It serves thousands of customers across North America, Europe, Latin America, and Asia. Sensient is actively expanding its sustainability initiatives and investing in natural ingredient sourcing and environmentally responsible manufacturing practices Sources: Company Fillings, FactSet<br>
slide4. Revenue Segments Color Group Flavors & Extracts Group 4 Asia Pacific Group The color segment contributes (42.9%) of total revenue. Performance is heavily influenced by the Food & Beverage and Personal care line. Recent restructuring aims to improve margins despite lower volumes The Asia Pacific group represents the smallest revenue portion (10.1%) but offers higher growth potential. Focus remains on expanding local sales execution and technical service capabilities in the region. The Flavors & Extracts segment accounts for approximately (49.5%) total revenue. Growth is primarily driven by pricing actions to offset raw material inflation and volume recovery in the savory and natural ingredients categories Figure 3: 2025 Total Operating Sales by Geography (millions) Sources: Company Fillings, FactSet<br>
slide5. 5 Key Highlights 5<br>
slide6. Driver: U.S Regulatory Tailwinds California passes the 'California Food Safety Act' (Bill 418), banning Red 3, Brominated Vegetable Oil, and Potassium Bromate by 2027 FDA follows suit in Jan 2025, effectively revoking authorization for Red 3 in food/ingested drugs This creates an opportunity for a national ban, forcing manufacturers to switch to Natural Colors By guiding brands through the natural conversion process, Sensient is able to capture higher revenue per unit while deepening client relationships. Over 112 color-related bills were introduced across the U.S. in 2025. While state initiated, the impact is felt nationally as Congress faces pressure to initiate future bans 6 Figure 4: Current State Regulatory Activity Figure 5: Flavor Reformulation by Category Base scenario assumes 6.5% CAGR driven by regulatory conversion to natural pigments Sources: Company Fillings, FactSet, EAI<br>
slide7. Driver: Portfolio Optimization Plan Figure 6: Cost Savings & Restructuring (In Millions) Figure 8: Added EPS 2025 Figure 7: EPS Percent Impact 7 This savings flows directly into Sensient's operating income (EBIT). Assuming a stable sales environment, these are projected to contribute approximately $0.18 to annual EPS by 2026, reducing risks associate with raw material inflation Figure 9: Added EPS 2026 Sensient is executing a 'Portfolio Optimization Plan' involving the closure of underperforming manufacturing facilities and the elimination of redundant operational roles. This trades one-time restructuring charges in 2024 for permanent structural cost reductions Removing $10M of fixed costs gives Sensient more operational leverage and every dollar of sales going forward will have a higher marginal profit, boosting EPS and ROE Sources: Company Fillings, FactSet, IMCP, EAI<br>
slide8. Driver: Portfolio Optimization Plan Figure 10: Project Impact of Optimization Figure 11: SXT P/S vs Net Margin 8 Figure 12: SXT Gross Margin Over Time or Gross Margin and EBITDA Margin chart In Q4 2023, Sensient initiated a 'Portfolio Optimization Plan' to structurally lower its fixed cost base. By eliminating redundant manufacturing capacity and streamlining administrative roles, the initiative targets Gross Margin expansion and SG&A reduction. Sources: Company Fillings, FactSet, IMCP, EAI<br>
slide9. Driver: Macroeconomic Momentum Figure 13: SXT Sales Growth Per Segment Although Flavors & Extracts serves a stable food end-market, Sensient's overall sales still move with the economic cycle. Color. The more discretionary, industrially-tied segment is the cyclical driver, while Asia Pacific provides structural growth above the consolidated rate. 9 SXT's stock historically outperforms the S&P 500 when the ISM PMI is rising, since investors rotate into specialty chemicals as cyclical demand and pricing power return. Otherwise, the SXT/PMI link is the cleanest macro signal for the company. Figure 14: SXT relative to S&P500 price change (L) vs ISM – PMI (R) Sources: Company Fillings, FactSet, IMCP<br>
slide10. Driver: Consumer Demand for “Natural” Consumers are increasingly scrutinizing product labels, with 72% defining 'Clean Label' as free from synthetic ingredients. This has forced major CPG brands to reformulate legacy brands with natural alternatives to maintain market share Figure 15: Natural Color Conversion Breakdown Sensient is capitalizing on this by expanding its 'Certasure™' natural supply chain. The company is investing around $90M annually in CapEx, primarily to increase natural color capacity to meet this structural demand shift Figure 16: Natural Conversion" Opportunity by Category 10 While reformulation of old products is steady, 90% of new product launches in North America now launch with natural colors by default. Natural colors are technically difficult to stabilize and have a price premium (4x-10x) over synthetics. Because Sensient provides the R&D to stabilize these formulas, they capture both margin percentage expansion and significantly higher dollars per unit produced. Sources: Company Fillings, FactSet, IMCP<br>
slide11. 11 Key Highlights 11<br>
slide12. Expensive for a Reason Figure 17: Margins Increasing Figure 18: 2024– 2025 EPS Justification Figure 19: 2025 – 2026 EPS Justification 12 Figure 21: Estimates vs Consensus Figure 20: 2022 – 2026 EPS Impact Sources: Company Fillings, FactSet, IMCP, EAI<br>
slide13. Operational Efficiency Driving Cash Flow Recovery Figure 23: Use of Free Cash Flow Figure 22: Free Cash Flow Per Share 13 As Sensient becomes more efficient with its use of working capital, the business requires less to grow, converting a higher percentage of earnings into cash now being used for dividends (2024+). Figure 25: Dividend vs Net income Figure 24: FCFE Sources: Company Fillings, FactSet, IMCP, EAI<br>
slide14. ROE, Leverage, and Profitability Analysis Figure 26: Leverage and Profitability Metrics SXT’s ROE is expected to remain stable from 2023 through 2026, reflecting consistent asset efficiency. EBIT margins are projected to improve modestly, while asset turnover is expected to hold steady. ROE rises as leverage declines, so its ROE is higher quality. Figure 27: SXT Price vs S&P Chemicals vs Food Products 14 Figure 28: 5 Stage DuPont Analysis Sources: Company Fillings, FactSet, IMCP, EAI<br>
slide15. 15 15 Key Highlights<br>
slide16. Below Average Value Relative to Comps While this premium reflects confidence in Sensient’s multiyear growth trajectory and ongoing demand for natural color and flavor solutions, much of this optimism appears priced in 16 Sensient currently trades at a premium on EV/EBIT and P/B, but its superior ROE and ROIC justify the valuation Sensient generates healthy, mid-single-digit returns that are directionally supportive of its premium positioning Figure 29: Comps Table Sources: Company Fillings, FactSet, IMCP<br>
slide17. Fairly Valued (All Things Considered) Figure 30: Composite relative valuation 17 Fundamental Factors
ROE (50%)
NPM 2024 (45th Percentile)
NTM sales growth (80th Percentile%)
Valuation
P/S (75%)
EV/EBIT (65th percentile) 19x EV/EBIT multiple, striking a balance between its premium 'Natural Color' moat and its exposure to generic raw material inflation Figure 31: Comparable fundamental & valuation weights Several fundamental metrics are important to valuation. To compare a composite of fundamental factors to a composite of valuation factors, the raw data was first converted to percentiles based on the maximum value for each factor in the comp group. Then, the percentile for each factor was weighted according to perceived importance to create the final composites. Sources: Company Fillings, FactSet, IMCP<br>
slide18. Two Stage DCF (First Stage $14 in Value) 18 Figure 30: First stage of DCF Figure 31: Beta Justification Figure 32: Cost of Equity Cost of equity is 9.9%. The beta increase is justified, due to Sensient’s cyclicality. Forecasted sales growth reflects steady mid-single-digit volume recovery and modest pricing. Modest margin expansion incorporates mix shift toward higher-value color and flavor solutions Sources: Company Fillings, FactSet, IMCP<br>
slide19. Stage Two and Justification of Terminal P/S 19 Figure 33: P/S Second Stage of DCF Figure 34: P/S to NPM Slightly Elevated P/S Multiple
Reflects improving product mix, increasing contribution from higher-margin natural color and flavor platforms, and expected operational efficiencies Current P/S: 2.55
5-Year average P/S: 2.22
Terminal P/S: 2.46 Sources: Company Fillings, FactSet, IMCP<br>
slide20. 20 Key Highlights Risks, SWOT Analysis, and Porter’s Five Forces 20<br>
slide21. Risks, Porter’s Five Forces, SWOT Analysis Figure 35: SWOT Priorities Figure 37: Risk Assessment Matrix 21 1: Supply Chain Volatility 3: Portfolio Optimization Execution Fault 2: Foreign Currency Fluctuations 4: FDA Approval Slowdown 5: Raw Material Pricing Pressure Figure 36: Porter’s Five Forces Figure 38: SWOT Analysis<br>
slide22. Summary 22 RECOMMENDATION: HOLD Sensient Technologies presents a neutral downside for investors, from its current price of $94.56 to a target price of $92. While much of its growth potential already priced in, the company remains well‑positioned for steady expansion supported by favorable macroeconomic trends, regulatory momentum in natural colors, and ongoing portfolio optimization. Despite risks related to raw material costs, supply chain constraints, and regulatory challenges, Sensient’s ability to navigate industry headwinds make it a reliable Hold for investors seeking exposure to specialty chemicals with moderate growth prospects<br>