
Research Methods in the Sciences Prof. Anthony A.
SN
Published · 41 slides · 0 views
1 / 1


Description
Research Methods in the Sciences Prof. Anthony A. Attama Drug Delivery and Nanomedicines Research Group Department of Pharmaceutics, University of Nigeria, Nsukka University of Nigeria Postgraduate Workshop, October 12-13, 2017 Outline
Related Topics
Share
Embed code
Download this presentation From Below
"Research Methods in the Sciences Prof. Anthony A." is the property of its rightful owner. Permission is granted to download and print the materials on this website for personal, non-commercial use only, and to display it on your personal computer provided you do not modify the materials and that you retain all copyright notices contained in the materials. By downloading content from our website, you accept the terms of this agreement.
Presentation Transcript
01
Research Methods in the Sciences Prof. Anthony A. Attama
Drug Delivery and Nanomedicines Research Group
Department of Pharmaceutics, University of Nigeria, Nsukka University of Nigeria Postgraduate Workshop, October 12-13, 2017<br>
Drug Delivery and Nanomedicines Research Group
Department of Pharmaceutics, University of Nigeria, Nsukka University of Nigeria Postgraduate Workshop, October 12-13, 2017<br>
02
Outline Introduction
Skills
Research methods
Data collection
Research designs
Design of experiment
Choosing the method
Conclusion<br>
Skills
Research methods
Data collection
Research designs
Design of experiment
Choosing the method
Conclusion<br>
03
INTRODUCTION: Research A systematic investigation of a subject in order to find something new1- to create new knowledge!
The systematic and rigorous search for appropriate information on a specific subject.
Involves enunciation of the problem, developing a hypothesis, collecting and analyzing data and drawing conclusions, based on the facts and data collected2.<br>
The systematic and rigorous search for appropriate information on a specific subject.
Involves enunciation of the problem, developing a hypothesis, collecting and analyzing data and drawing conclusions, based on the facts and data collected2.<br>
04
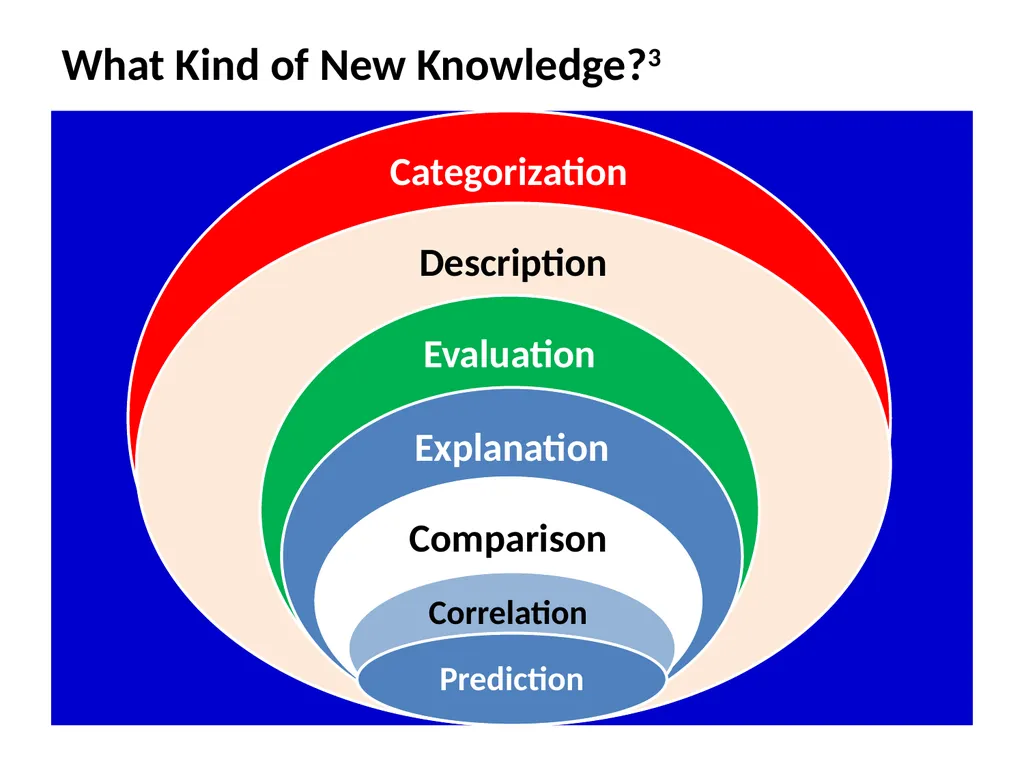
What Kind of New Knowledge?3<br>
05
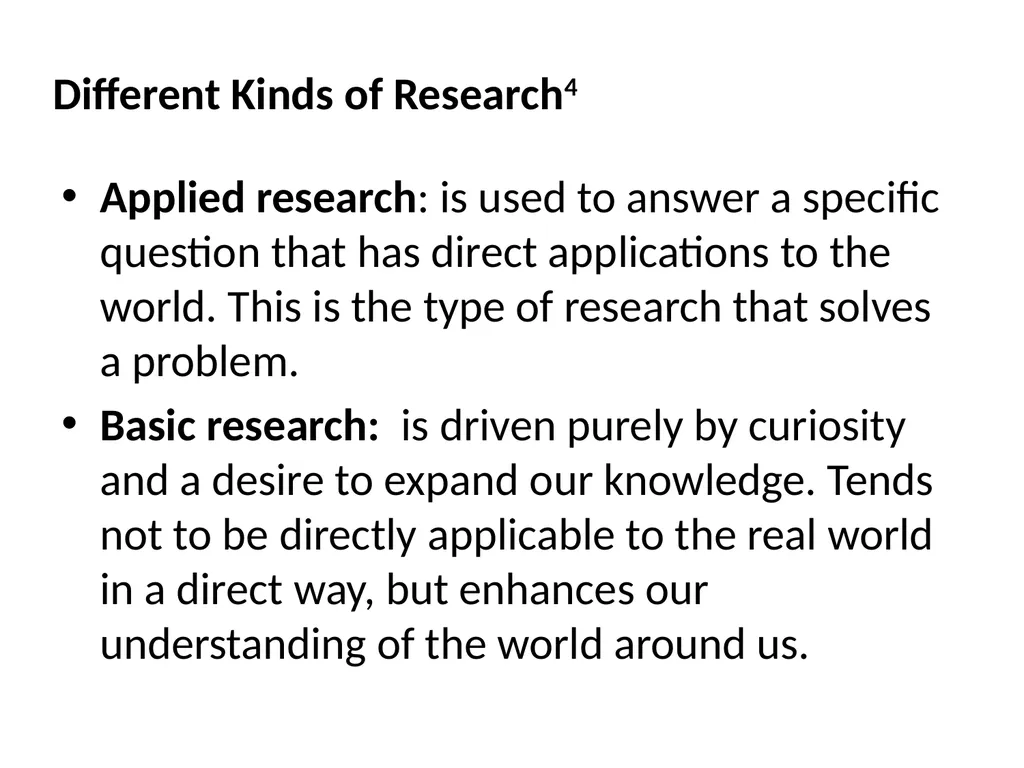
Different Kinds of Research4 Applied research: is used to answer a specific question that has direct applications to the world. This is the type of research that solves a problem.
Basic research: is driven purely by curiosity and a desire to expand our knowledge. Tends not to be directly applicable to the real world in a direct way, but enhances our understanding of the world around us.<br>
Basic research: is driven purely by curiosity and a desire to expand our knowledge. Tends not to be directly applicable to the real world in a direct way, but enhances our understanding of the world around us.<br>
06
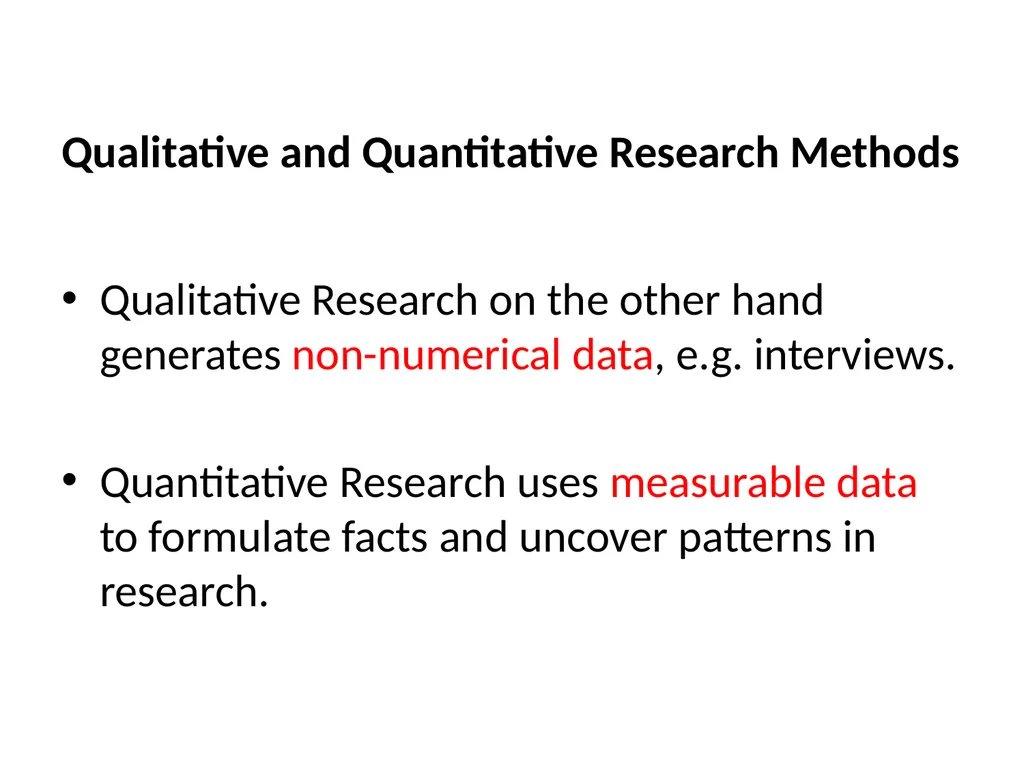
Qualitative and Quantitative Research Methods Qualitative Research on the other hand generates non-numerical data, e.g. interviews.
Quantitative Research uses measurable data to formulate facts and uncover patterns in research.<br>
Quantitative Research uses measurable data to formulate facts and uncover patterns in research.<br>
07
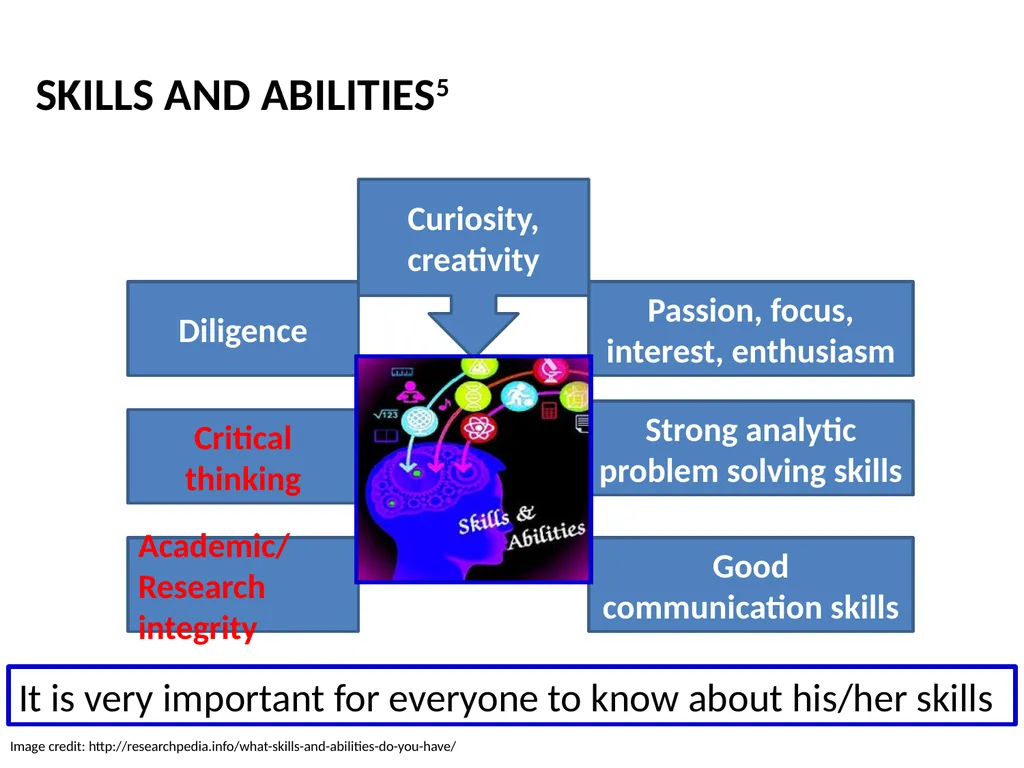
SKILLS AND ABILITIES5 Passion, focus, interest, enthusiasm Strong analytic problem solving skills Good communication skills Diligence Critical thinking Academic/Research integrity Curiosity, creativity Image credit: http://researchpedia.info/what-skills-and-abilities-do-you-have/ It is very important for everyone to know about his/her skills<br>
08
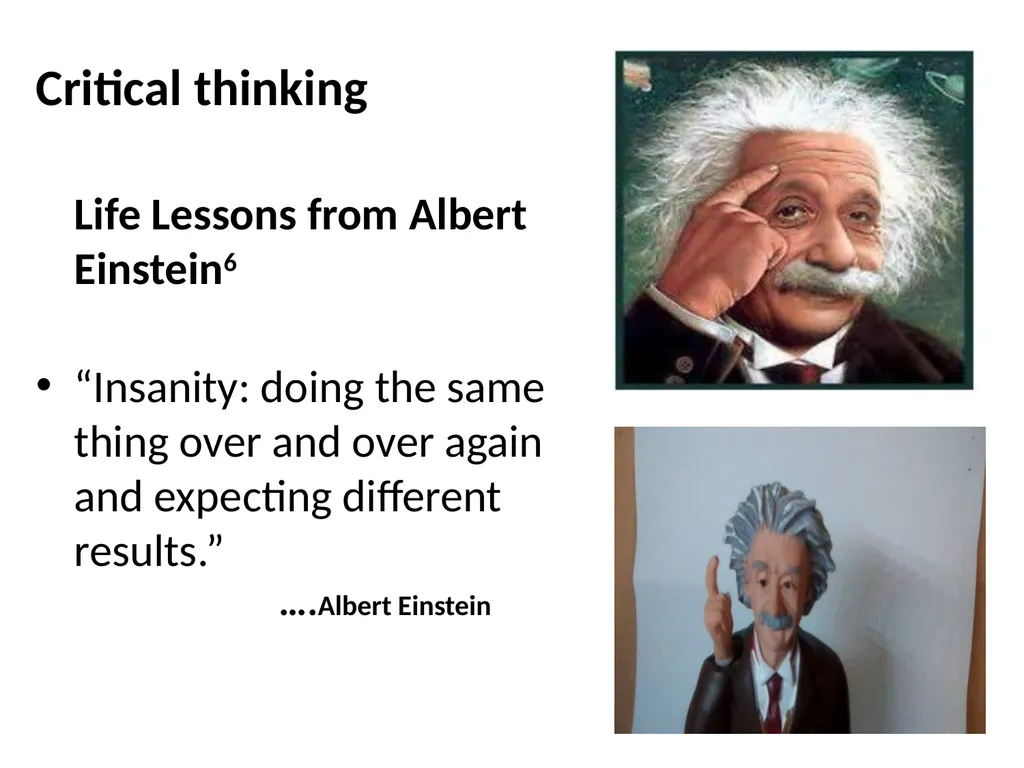
Critical thinking Life Lessons from Albert Einstein6
“Insanity: doing the same thing over and over again and expecting different results.” ….Albert Einstein<br>
“Insanity: doing the same thing over and over again and expecting different results.” ….Albert Einstein<br>
09
Research methodology vs methods Methodology is the study of how research is done, how we find out about things, and how knowledge is gained7. It is about the principles that guide our research practices.
Research method is the 'WHAT did the researchers use for their study' part.<br>
Research method is the 'WHAT did the researchers use for their study' part.<br>
10
Getting started8 – basic questions! What should I research?
Where should I research?
Who can do research? – involving others!
How should I research?
Planning the research – timelines!<br>
Where should I research?
Who can do research? – involving others!
How should I research?
Planning the research – timelines!<br>
11
Research methods Comprise of the tools, strategies or techniques that are used in research.9
Could be perturbations, questionnaires, surveys, interviews, photovoice, etc.
Different scientific disciplines utilize different kinds of methods.<br>
Could be perturbations, questionnaires, surveys, interviews, photovoice, etc.
Different scientific disciplines utilize different kinds of methods.<br>
12
Research Methods in the Sciences Many and varied but some questions are used to frame the exploration of each method10:
What is this method?
Who normally uses it and for what kinds of projects?
What sorts of data are collected using this method and how is it analysed?
How is knowledge made/created using this method?
What counts as ‘evidence’ and ‘rigour’ and how should these be interpreted?<br>
What is this method?
Who normally uses it and for what kinds of projects?
What sorts of data are collected using this method and how is it analysed?
How is knowledge made/created using this method?
What counts as ‘evidence’ and ‘rigour’ and how should these be interpreted?<br>
13
In addition one has to explore how to10: Plan and scope a research project and write a research proposal.
Select the appropriate method(s) to use in the research project.
Search and select literature to support the research project.
Frame appropriate research questions
Use appropriate technology to support the collection and storage of research data and any relevant references.<br>
Select the appropriate method(s) to use in the research project.
Search and select literature to support the research project.
Frame appropriate research questions
Use appropriate technology to support the collection and storage of research data and any relevant references.<br>
14
Defining a Research Problem10 The fuel that drives the scientific process, and is the foundation of any research method and experimental design.
Is one of the first statements made in any research paper and, as well as defining the research area, should include a quick synopsis of how the hypothesis was arrived at.
In a scientific paper, the research problem is written almost like a statement of intent.<br>
Is one of the first statements made in any research paper and, as well as defining the research area, should include a quick synopsis of how the hypothesis was arrived at.
In a scientific paper, the research problem is written almost like a statement of intent.<br>
15
Defining a Research Problem11 Formulating the research problem begins during the first steps of the scientific process.
Many scientific researchers look at an area where a previous researcher generated some interesting results, but never followed up.<br>
Many scientific researchers look at an area where a previous researcher generated some interesting results, but never followed up.<br>
16
A literature review and a study of previous experiments, and research, might throw up some vague areas of interest.
A scientist may even review a successful experiment, disagree with the results, the tests used, or the methodology, and decide to refine the research process, retesting the hypothesis.11<br>
A scientist may even review a successful experiment, disagree with the results, the tests used, or the methodology, and decide to refine the research process, retesting the hypothesis.11<br>
17
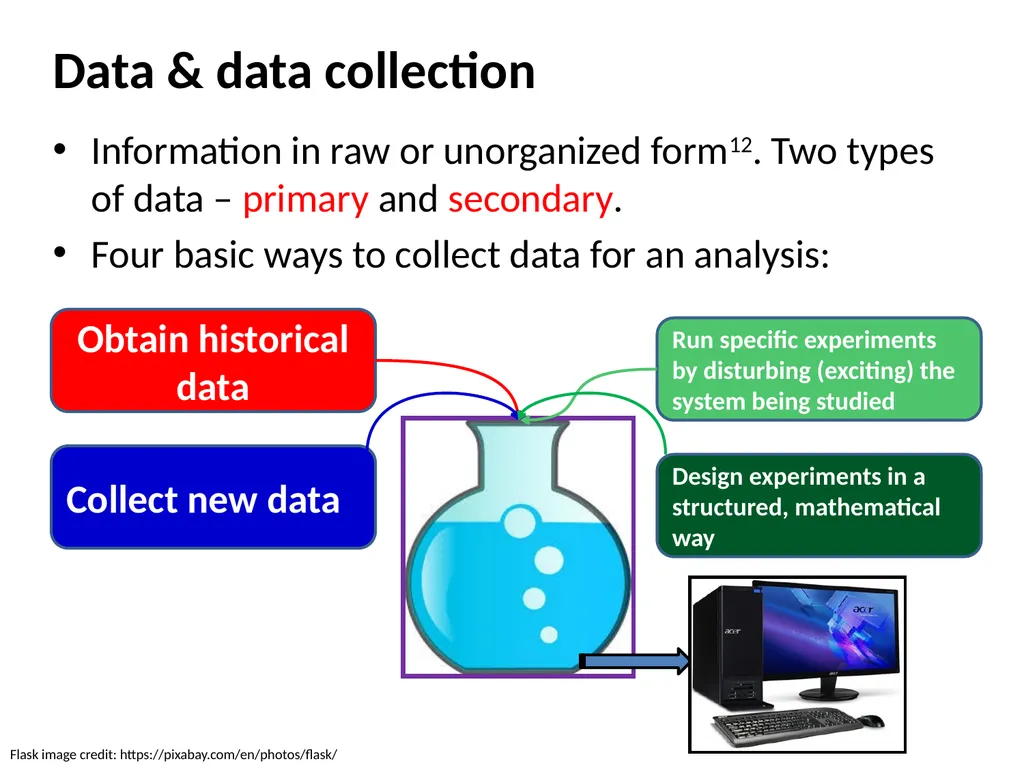
Data & data collection Information in raw or unorganized form12. Two types of data – primary and secondary.
Four basic ways to collect data for an analysis: Collect new data Obtain historical data Run specific experiments by disturbing (exciting) the system being studied Design experiments in a structured, mathematical way Flask image credit: https://pixabay.com/en/photos/flask/<br>
Four basic ways to collect data for an analysis: Collect new data Obtain historical data Run specific experiments by disturbing (exciting) the system being studied Design experiments in a structured, mathematical way Flask image credit: https://pixabay.com/en/photos/flask/<br>
18
Research Design13 Refers to the overall strategy that integrates the different components of the study in a coherent and logical way to effectively address the research problem.
It constitutes the blueprint for the collection, measurement, and analysis of data.
Choice depends on the aim(s) of the study and the nature of the phenomenon. The function of a research design is to ensure that the evidence obtained enables you to effectively address the research problem logically and as unambiguously as possible.<br>
It constitutes the blueprint for the collection, measurement, and analysis of data.
Choice depends on the aim(s) of the study and the nature of the phenomenon. The function of a research design is to ensure that the evidence obtained enables you to effectively address the research problem logically and as unambiguously as possible.<br>
19
Typical Experimental Designs14 To figure out an experimental design, one has to identify the variables, or measures that change.
Two main types of variables:
independent variables (also called factors), are variables whose values do not depend on the value of another variable; and
dependent variables are variables whose values depend on the independent variables.<br>
Two main types of variables:
independent variables (also called factors), are variables whose values do not depend on the value of another variable; and
dependent variables are variables whose values depend on the independent variables.<br>
20
Why experimental design?15 Efficiency - Get more information from fewer experiments.
Focusing - Collect only the information that is really needed.
reduce time to design/develop new products & processes
improve performance of existing processes
improve reliability and performance of products
achieve product & process robustness, etc. A well-designed experiment is as simple as possible - obtaining the required information in a cost effective and reproducible manner.<br>
Focusing - Collect only the information that is really needed.
reduce time to design/develop new products & processes
improve performance of existing processes
improve reliability and performance of products
achieve product & process robustness, etc. A well-designed experiment is as simple as possible - obtaining the required information in a cost effective and reproducible manner.<br>
21
Factorial Design16 When you have multiple independent variables in a single study, it is called factorial design.
A factorial design can have more than two independent variables - as many as you want, but…...
Is often used by scientists wishing to understand the effect of two or more independent variables upon a single dependent variable.<br>
A factorial design can have more than two independent variables - as many as you want, but…...
Is often used by scientists wishing to understand the effect of two or more independent variables upon a single dependent variable.<br>
22
Factorial design17,18 Traditional research methods generally study the effect of one variable at a time - easier to manipulate statistically.
In many cases, two factors may be interdependent, and it is impractical to analyze them in the traditional way.
Factorial experiments allow subtle manipulations of a larger number of interdependent variables - powerful statistical methods highlight any correlations.<br>
In many cases, two factors may be interdependent, and it is impractical to analyze them in the traditional way.
Factorial experiments allow subtle manipulations of a larger number of interdependent variables - powerful statistical methods highlight any correlations.<br>
23
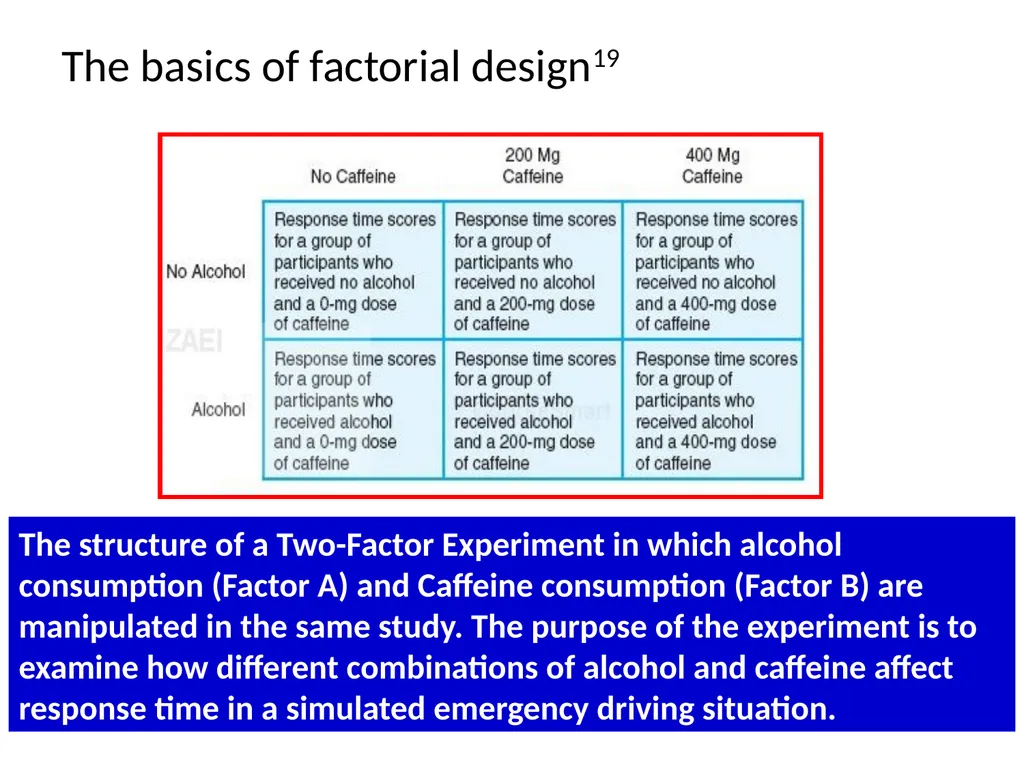
The basics of factorial design19 The structure of a Two-Factor Experiment in which alcohol consumption (Factor A) and Caffeine consumption (Factor B) are manipulated in the same study. The purpose of the experiment is to examine how different combinations of alcohol and caffeine affect response time in a simulated emergency driving situation.<br>
24
This example has two levels for the alcohol factor ( factor A) and three levels for the caffeine factor ( factor B), and can be described as a 2X3 ( read as “ two by three”) factorial design
The total number of treatment conditions can be determined by multiplying the levels for each factor.<br>
The total number of treatment conditions can be determined by multiplying the levels for each factor.<br>
25
Design of experiments (DOE)20 DOE is a systematic method to determine the relationship between factors affecting a process and the output of that process.
Gives information needed to manage process inputs in order to optimize the output.
Main concerns in experimental design include the establishment of validity, reliability, and replicability.<br>
Gives information needed to manage process inputs in order to optimize the output.
Main concerns in experimental design include the establishment of validity, reliability, and replicability.<br>
26
DOE21 DOE) generates “structured” data tables, i.e. data tables that contain an important amount of structured variation.
When one has the possibility to actively perturb the system (experiment with the variables), chances of generating data tables become greater.<br>
When one has the possibility to actively perturb the system (experiment with the variables), chances of generating data tables become greater.<br>
27
DOE In an experiment, we deliberately change one or more process variables (or factors) in order to observe the effect the changes have on one or more response variables.22
The critical part is to decide which variables to change, the intervals for this variation, and the pattern of the experimental points.
Factorial DOE software is a notable tool that scientists, rely upon.<br>
The critical part is to decide which variables to change, the intervals for this variation, and the pattern of the experimental points.
Factorial DOE software is a notable tool that scientists, rely upon.<br>
28
DOE Software Design Expert®
JMP® software
Unscrambler® X<br>
JMP® software
Unscrambler® X<br>
29
Which Method to Choose?23 Choice depends on different factors:
What information do you want? The aim(s) of the study.
The nature of the phenomenon - Is it feasible to collect the data, and if so, would it be valid/reliable?
Is it ethical to conduct the study?
The cost of the design
Is there little or much current scientific theory and literature on the topic?<br>
What information do you want? The aim(s) of the study.
The nature of the phenomenon - Is it feasible to collect the data, and if so, would it be valid/reliable?
Is it ethical to conduct the study?
The cost of the design
Is there little or much current scientific theory and literature on the topic?<br>
30
Choosing the Research Method24 The selection of the research method is crucial for what conclusions you can make about a phenomenon.
It is very important to choose a research method which is within the limits of what the researcher can do.
Time, money, feasibility, ethics and availability to measure the phenomenon correctly are other issues. Some measurements might not reflect the real world, because they do not measure the phenomenon as it should.<br>
It is very important to choose a research method which is within the limits of what the researcher can do.
Time, money, feasibility, ethics and availability to measure the phenomenon correctly are other issues. Some measurements might not reflect the real world, because they do not measure the phenomenon as it should.<br>
31
Results24 Analysis
Significance Test – t-test (Student’s T-Test)
To test a hypothesis, quantitative research uses significance tests to determine which hypothesis is right.
The significance test can show whether the null hypothesis is more likely correct than the research hypothesis.<br>
Significance Test – t-test (Student’s T-Test)
To test a hypothesis, quantitative research uses significance tests to determine which hypothesis is right.
The significance test can show whether the null hypothesis is more likely correct than the research hypothesis.<br>
32
Drawing Conclusions24 Drawing a conclusion is based on several factors of the research process, not just because the researcher got the expected result.
It has to be based on the validity and reliability of the measurement; how good the measurement was to reflect the real world and what more could have affected the results.
A common error is to think that correlation implies a causal relationship. This is not necessarily true.<br>
It has to be based on the validity and reliability of the measurement; how good the measurement was to reflect the real world and what more could have affected the results.
A common error is to think that correlation implies a causal relationship. This is not necessarily true.<br>
33
Generalization24 Generalization is to which extent the research and the conclusions of the research apply to the real world.
It is not always so that good research will reflect the real world, since we can only measure a small portion of the population at a time.<br>
It is not always so that good research will reflect the real world, since we can only measure a small portion of the population at a time.<br>
34
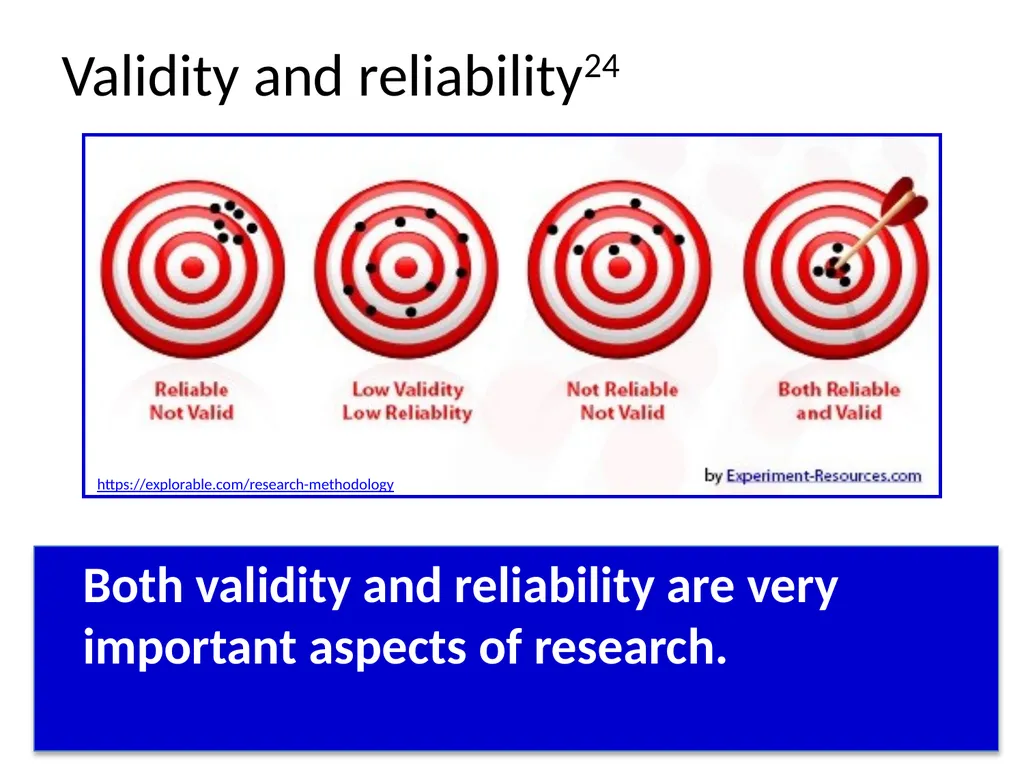
Validity and Reliability24 Validity refers to what degree the research reflects the given research problem, while Reliability refers to how consistent a set of measurements are.
Research method(ology) lacking reliability cannot be trusted. Replication studies are a way to test reliability.<br>
Research method(ology) lacking reliability cannot be trusted. Replication studies are a way to test reliability.<br>
35
Validity and reliability24 Both validity and reliability are very important aspects of research. https://explorable.com/research-methodology<br>
36
Research Integrity25 Active adherence to the ethical principles and professional standards essential for the responsible practice of research.<br>
37
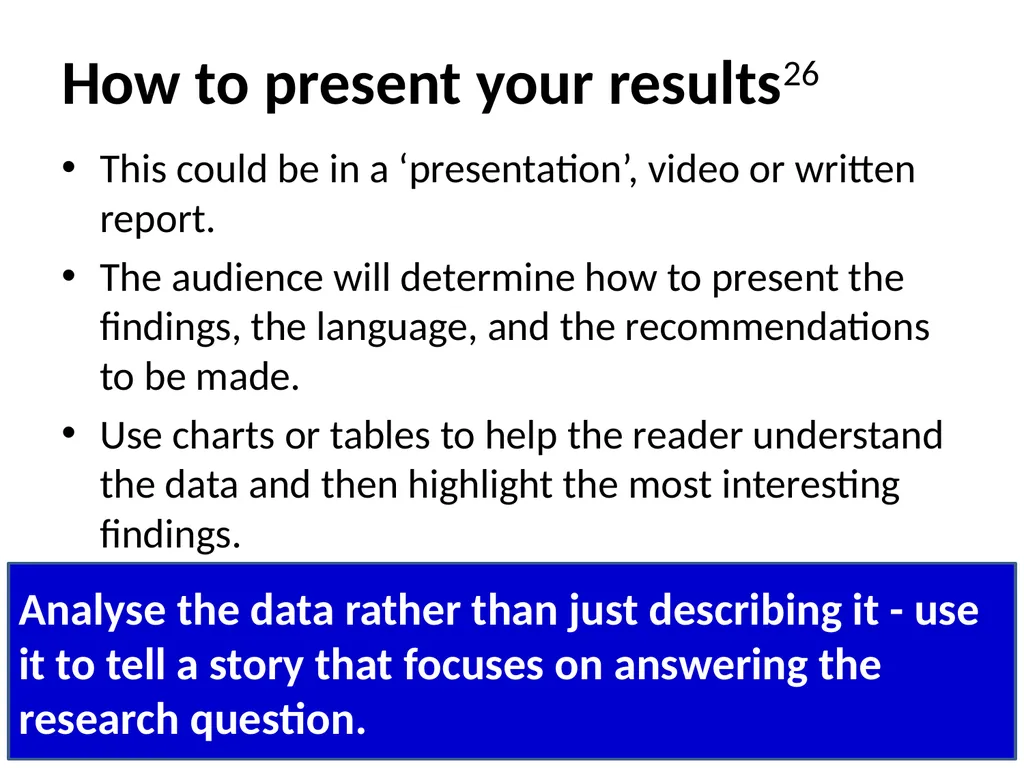
How to present your results26 This could be in a ‘presentation’, video or written report.
The audience will determine how to present the findings, the language, and the recommendations to be made.
Use charts or tables to help the reader understand the data and then highlight the most interesting findings.
Comment on the research findings across different methods used. Analyse the data rather than just describing it - use it to tell a story that focuses on answering the research question.<br>
The audience will determine how to present the findings, the language, and the recommendations to be made.
Use charts or tables to help the reader understand the data and then highlight the most interesting findings.
Comment on the research findings across different methods used. Analyse the data rather than just describing it - use it to tell a story that focuses on answering the research question.<br>
38
There are endless ways of presenting research findings – be as innovative as you like! But follow established guidelines if available.<br>
39
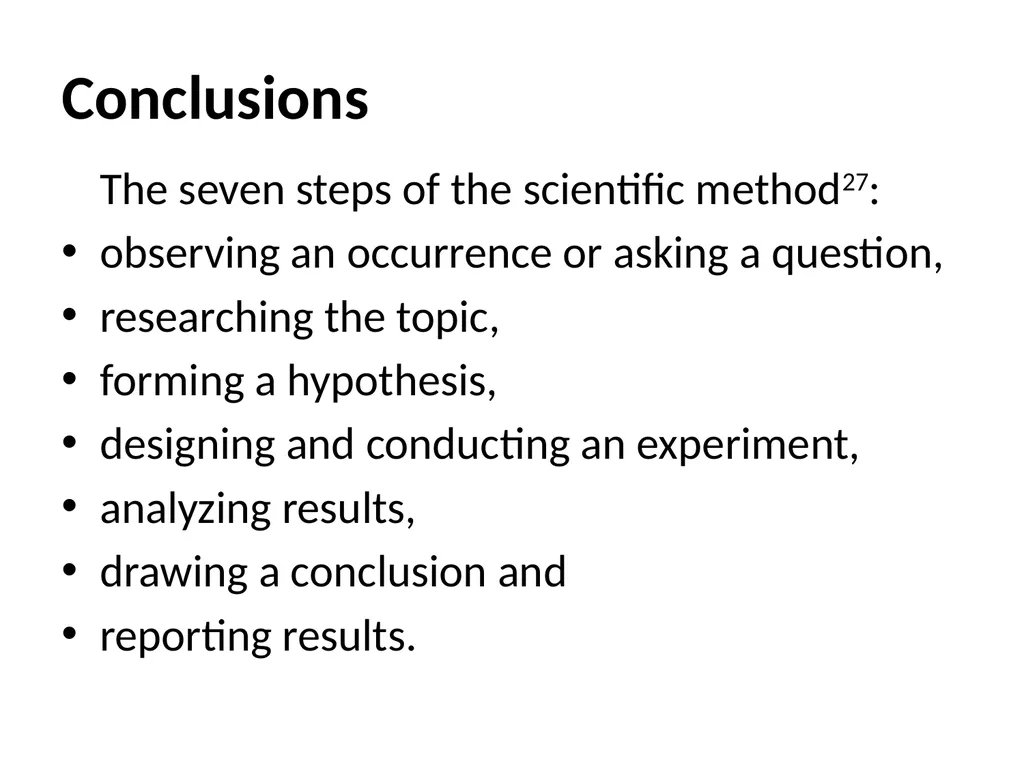
Conclusions The seven steps of the scientific method27:
observing an occurrence or asking a question,
researching the topic,
forming a hypothesis,
designing and conducting an experiment,
analyzing results,
drawing a conclusion and
reporting results.<br>
observing an occurrence or asking a question,
researching the topic,
forming a hypothesis,
designing and conducting an experiment,
analyzing results,
drawing a conclusion and
reporting results.<br>
40
References 1. http://guides.library.ucla.edu/research-methods
2. http://keydifferences.com/difference-between-research-method-and-research-methodology.html
3. Based on Nicholas Walliman: Research Methods: the Basics. Routledge, 2011
4. http://study.com/academy/lesson/basic-research-and-applied-research-definitions-and-differences.html
5. http://whanauoraresearch.co.nz/news/method-or-methodology-whats-the-difference/
6. https://www.kaieteurnewsonline.com/2012/07/01/life-lessons-from-albert-einstein/
7. McGregor, S. L., & Murname, J. A. (2010). Paradigm, methodology and method: Intellectual integrity in consumer scholarship. International Journal of Consumer Studies, 34 (4), 419-427.
8. https://www.nfer.ac.uk/schools/research-in-schools/what-should-i-research/
9. https://www.quora.com/What-is-the-difference-between-method-and-methodology-in-research
10. http://www1.rmit.edu.au/courses/049658
11. https://explorable.com/defining-a-research-problem
12. http://www.businessdictionary.com/definition/data.html
13. http://libguides.usc.edu/writingguide/researchdesigns
14. http://study.com/academy/lesson/what-is-factorial-design-definition-example.html
15. http://www.camo.com/rt/Resources/design_of_experiment.html
16. http://study.com/academy/lesson/what-is-factorial-design-definition-example.html
17. https://explorable.com/factorial-design
18. Martyn Shuttleworth (Aug 10, 2009). Factorial Design. Retrieved Sep 29, 2017 from Explorable.com: https://explorable.com/factorial-design
19. www.csulb.edu/~arezaei/EDP520/powerpoint/11-%20Factorial%20Designs-short.pptx
20. https://www.isixsigma.com/tools-templates/design-of-experiments-doe/design-experiments-%E2%90%93-primer/
21. http://www.camo.com/rt/Resources/design_of_experiment.html
22. http://www.itl.nist.gov/div898/handbook/pri/section1/pri11.htm
23. https://explorable.com/research-designs
24. https://explorable.com/research-methodology
25. http://www2.le.ac.uk/offices/red/rd/research-environment-and-governance-1
26. https://www.nfer.ac.uk/schools/developing-young-researchers/how-to-present-your-results/
27. https://www.reference.com/science/seven-steps-scientific-method-740191e340239175<br>
2. http://keydifferences.com/difference-between-research-method-and-research-methodology.html
3. Based on Nicholas Walliman: Research Methods: the Basics. Routledge, 2011
4. http://study.com/academy/lesson/basic-research-and-applied-research-definitions-and-differences.html
5. http://whanauoraresearch.co.nz/news/method-or-methodology-whats-the-difference/
6. https://www.kaieteurnewsonline.com/2012/07/01/life-lessons-from-albert-einstein/
7. McGregor, S. L., & Murname, J. A. (2010). Paradigm, methodology and method: Intellectual integrity in consumer scholarship. International Journal of Consumer Studies, 34 (4), 419-427.
8. https://www.nfer.ac.uk/schools/research-in-schools/what-should-i-research/
9. https://www.quora.com/What-is-the-difference-between-method-and-methodology-in-research
10. http://www1.rmit.edu.au/courses/049658
11. https://explorable.com/defining-a-research-problem
12. http://www.businessdictionary.com/definition/data.html
13. http://libguides.usc.edu/writingguide/researchdesigns
14. http://study.com/academy/lesson/what-is-factorial-design-definition-example.html
15. http://www.camo.com/rt/Resources/design_of_experiment.html
16. http://study.com/academy/lesson/what-is-factorial-design-definition-example.html
17. https://explorable.com/factorial-design
18. Martyn Shuttleworth (Aug 10, 2009). Factorial Design. Retrieved Sep 29, 2017 from Explorable.com: https://explorable.com/factorial-design
19. www.csulb.edu/~arezaei/EDP520/powerpoint/11-%20Factorial%20Designs-short.pptx
20. https://www.isixsigma.com/tools-templates/design-of-experiments-doe/design-experiments-%E2%90%93-primer/
21. http://www.camo.com/rt/Resources/design_of_experiment.html
22. http://www.itl.nist.gov/div898/handbook/pri/section1/pri11.htm
23. https://explorable.com/research-designs
24. https://explorable.com/research-methodology
25. http://www2.le.ac.uk/offices/red/rd/research-environment-and-governance-1
26. https://www.nfer.ac.uk/schools/developing-young-researchers/how-to-present-your-results/
27. https://www.reference.com/science/seven-steps-scientific-method-740191e340239175<br>
41
Thank you for your attention<br>