
Segmentation and Targeting STP (Segmentation,
AM
Published · 133 slides · 0 views

1 / 1

Description
Segmentation and Targeting STP (Segmentation, Targeting, and Positioning) Needs-based segmentation Cluster Analysis Discriminant Analysis Market Segmentation Market segmentation is the subdividing of a market into distinct subsets of
Related Topics
Share
Embed code
Download this presentation From Below
"Segmentation and Targeting STP (Segmentation," is the property of its rightful owner. Permission is granted to download and print the materials on this website for personal, non-commercial use only, and to display it on your personal computer provided you do not modify the materials and that you retain all copyright notices contained in the materials. By downloading content from our website, you accept the terms of this agreement.
Presentation Transcript
01
Segmentation and Targeting STP (Segmentation, Targeting, and Positioning)
Needs-based segmentation
Cluster Analysis
Discriminant Analysis<br>
Needs-based segmentation
Cluster Analysis
Discriminant Analysis<br>
02
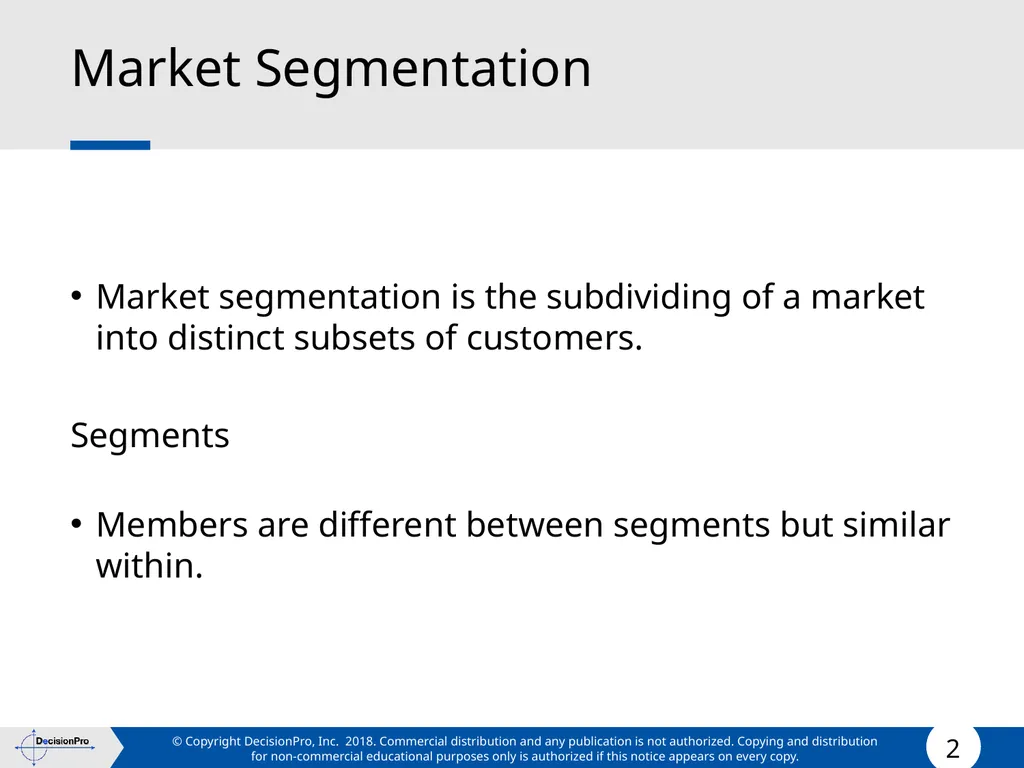
Market Segmentation Market segmentation is the subdividing of a market into distinct subsets of customers.
Segments
Members are different between segments but similar within.<br>
Segments
Members are different between segments but similar within.<br>
03
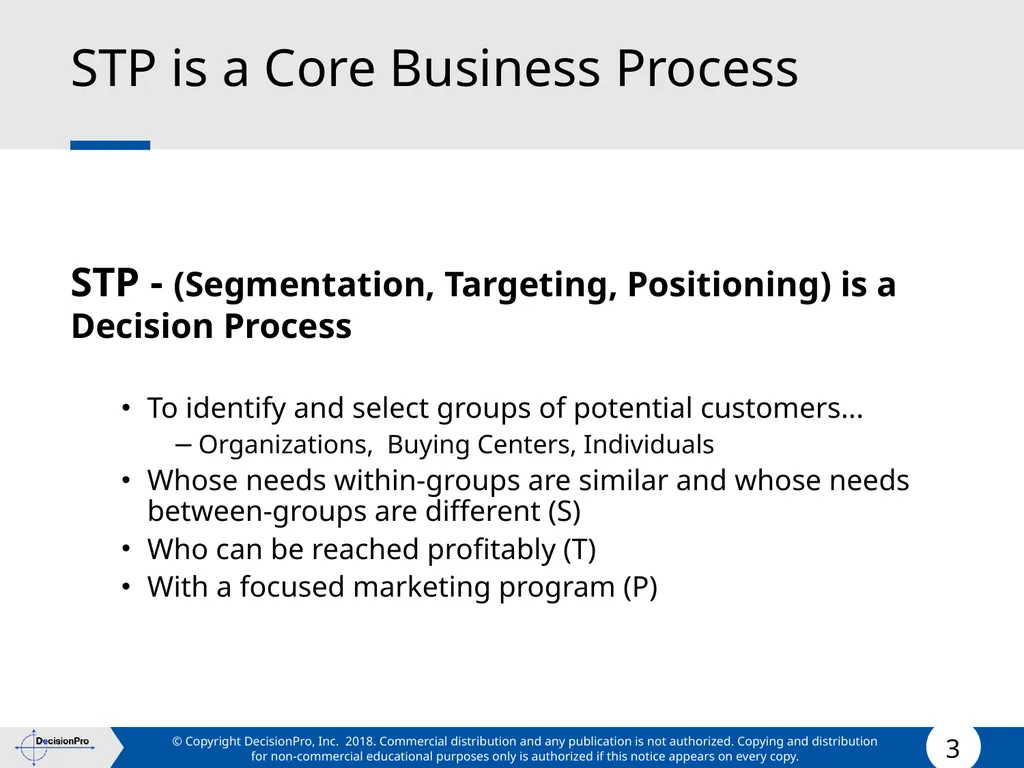
STP is a Core Business Process STP - (Segmentation, Targeting, Positioning) is a Decision Process
To identify and select groups of potential customers...
Organizations, Buying Centers, Individuals
Whose needs within-groups are similar and whose needs between-groups are different (S)
Who can be reached profitably (T)
With a focused marketing program (P)<br>
To identify and select groups of potential customers...
Organizations, Buying Centers, Individuals
Whose needs within-groups are similar and whose needs between-groups are different (S)
Who can be reached profitably (T)
With a focused marketing program (P)<br>
04
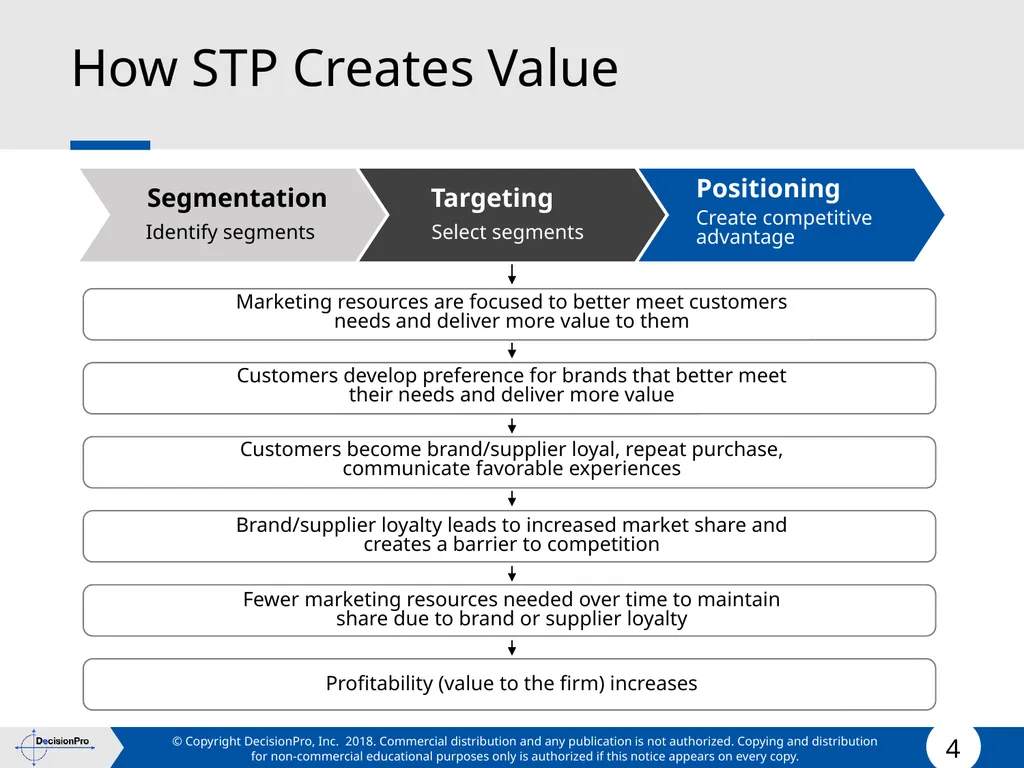
How STP Creates Value Segmentation Identify segments Targeting Select segments Positioning Create competitive advantage Marketing resources are focused to better meet customers needs and deliver more value to them Customers develop preference for brands that better meet their needs and deliver more value Customers become brand/supplier loyal, repeat purchase, communicate favorable experiences Brand/supplier loyalty leads to increased market share and creates a barrier to competition Fewer marketing resources needed over time to maintain share due to brand or supplier loyalty Profitability (value to the firm) increases<br>
05
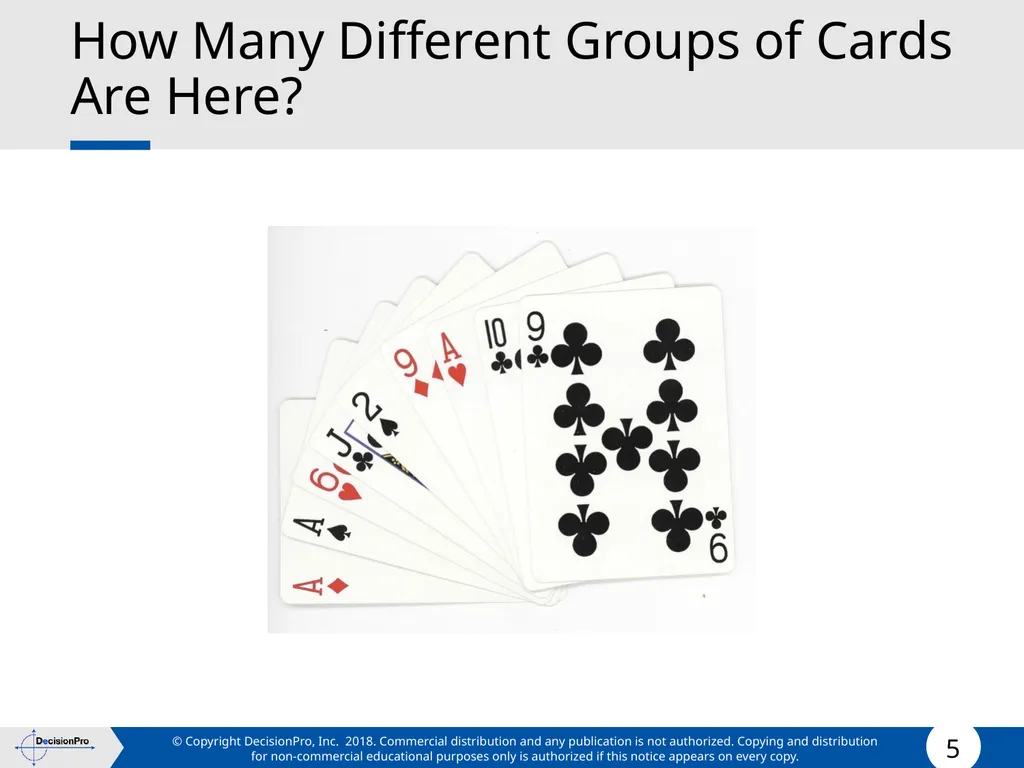
How Many Different Groups of Cards Are Here?<br>
06
The Many Uses of Segmentation Short term segmentation applications:
Salesforce allocation/call planning
Channel assignment
Communication program
Pricing
Today’s competitors and my current relative advantage to the customer<br>
Salesforce allocation/call planning
Channel assignment
Communication program
Pricing
Today’s competitors and my current relative advantage to the customer<br>
07
The Many Uses of Segmentation Longer term:
Emerging needs
New and evolving market segments to serve
Planning for segment development/growth
Not in kind competition/threats (satisfying customer needs in different ways)
Lead user identification and management
Market driving (vs. customer focused)<br>
Emerging needs
New and evolving market segments to serve
Planning for segment development/growth
Not in kind competition/threats (satisfying customer needs in different ways)
Lead user identification and management
Market driving (vs. customer focused)<br>
08
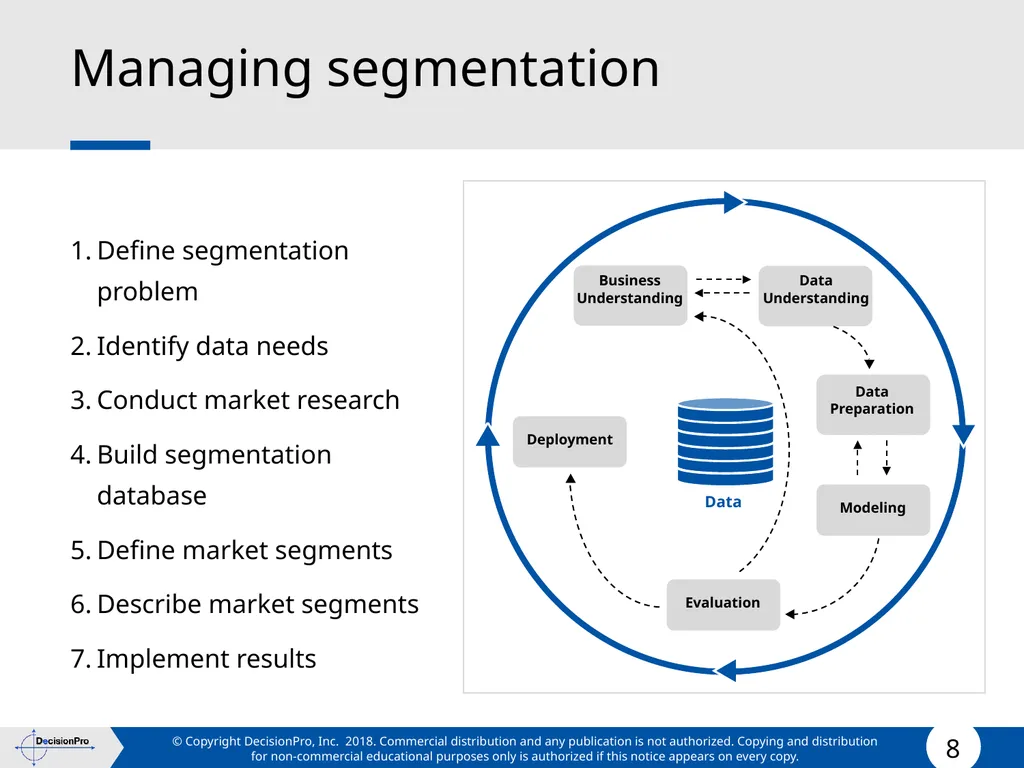
Managing segmentation Define segmentation problem
Identify data needs
Conduct market research
Build segmentation database
Define market segments
Describe market segments
Implement results Business Understanding Data Understanding Data Data Preparation Modeling Evaluation Deployment<br>
Identify data needs
Conduct market research
Build segmentation database
Define market segments
Describe market segments
Implement results Business Understanding Data Understanding Data Data Preparation Modeling Evaluation Deployment<br>
09
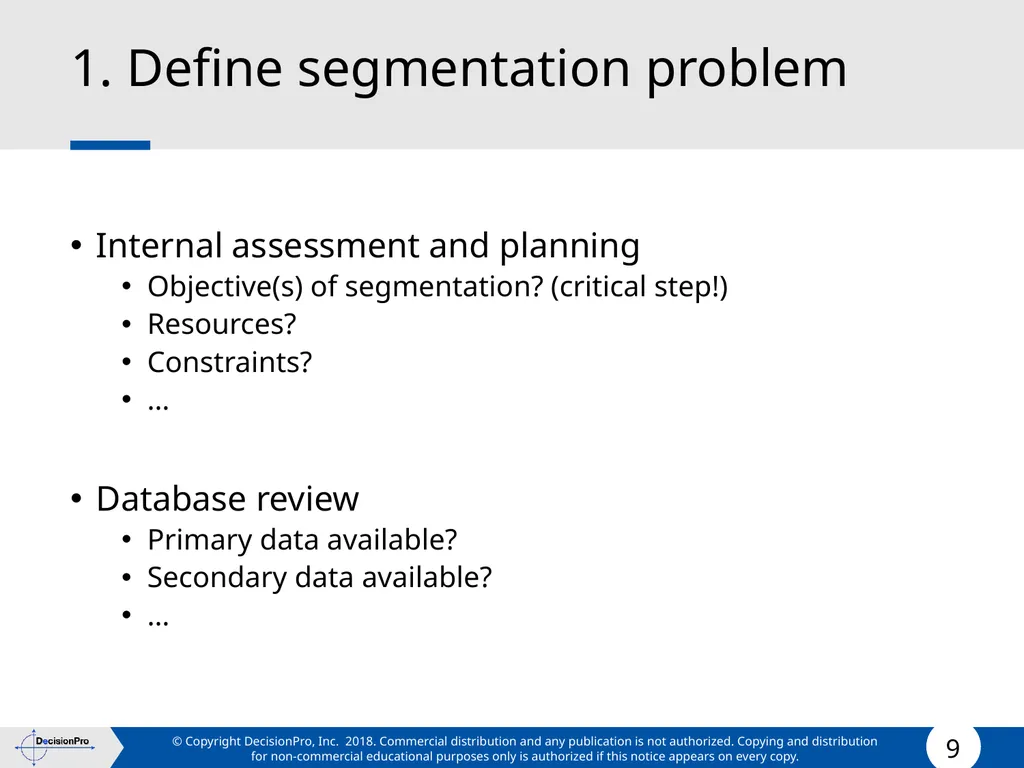
1. Define segmentation problem Internal assessment and planning
Objective(s) of segmentation? (critical step!)
Resources?
Constraints?
…
Database review
Primary data available?
Secondary data available?
…<br>
Objective(s) of segmentation? (critical step!)
Resources?
Constraints?
…
Database review
Primary data available?
Secondary data available?
…<br>
10
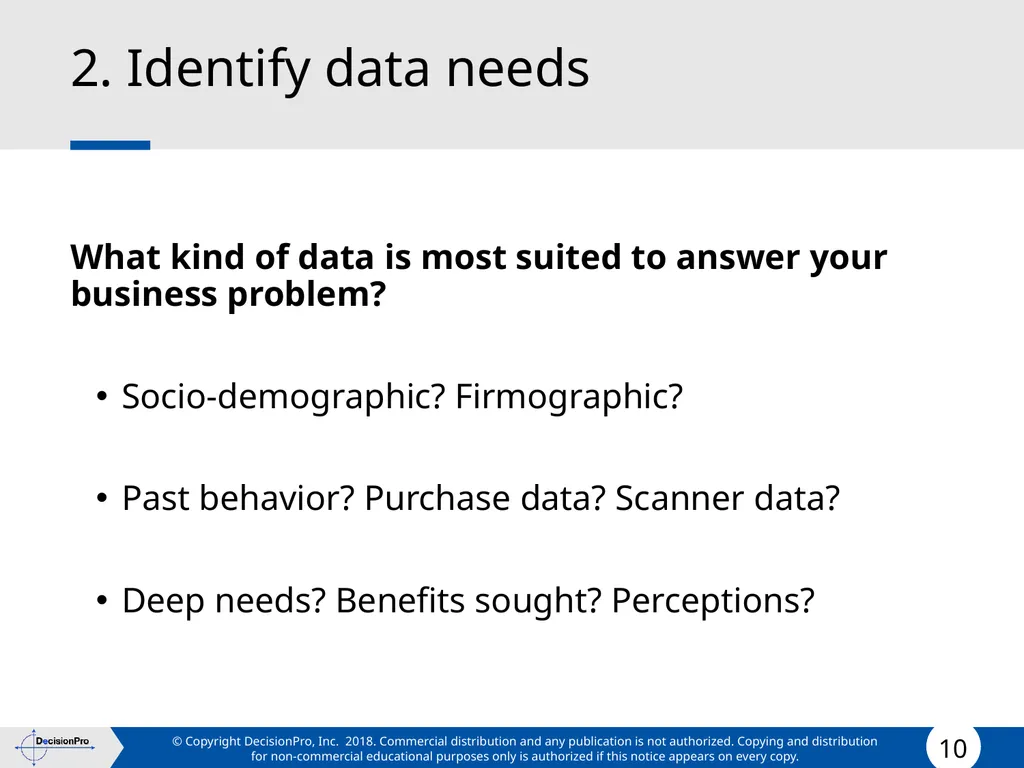
2. Identify data needs What kind of data is most suited to answer your business problem?
Socio-demographic? Firmographic?
Past behavior? Purchase data? Scanner data?
Deep needs? Benefits sought? Perceptions?<br>
Socio-demographic? Firmographic?
Past behavior? Purchase data? Scanner data?
Deep needs? Benefits sought? Perceptions?<br>
11
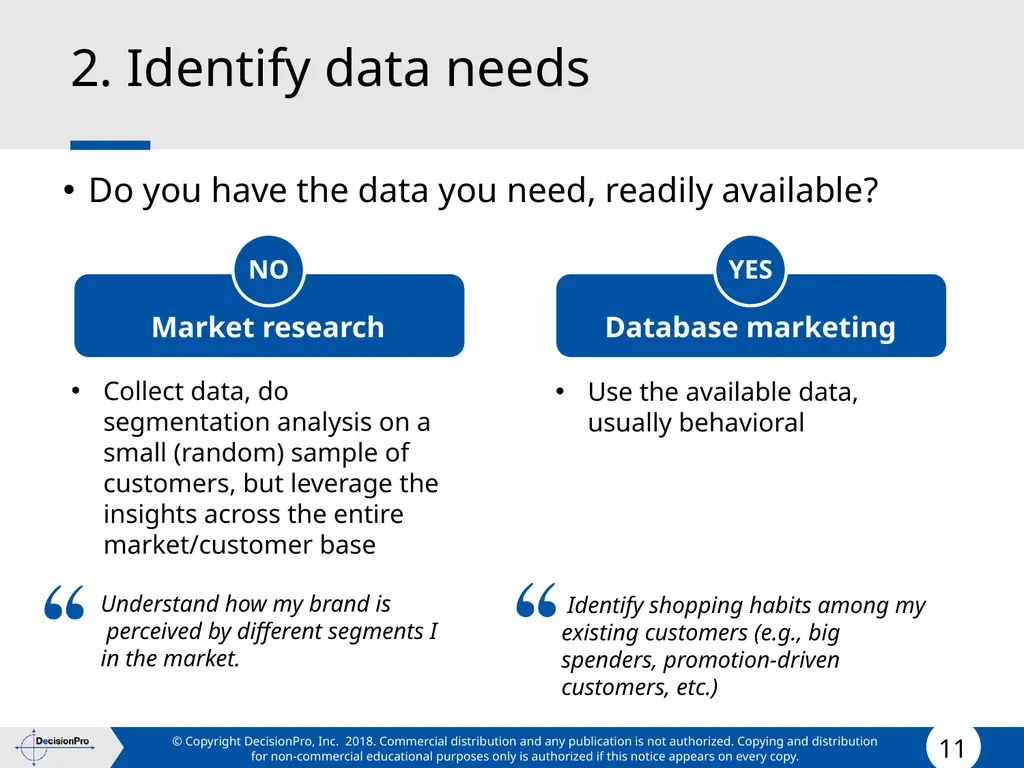
2. Identify data needs Do you have the data you need, readily available? Collect data, do segmentation analysis on a small (random) sample of customers, but leverage the insights across the entire market/customer base
Understand how my brand is perceived by different segments I in the market. Use the available data, usually behavioral
Identify shopping habits among my
existing customers (e.g., big
spenders, promotion-driven
customers, etc.)<br>
Understand how my brand is perceived by different segments I in the market. Use the available data, usually behavioral
Identify shopping habits among my
existing customers (e.g., big
spenders, promotion-driven
customers, etc.)<br>
12
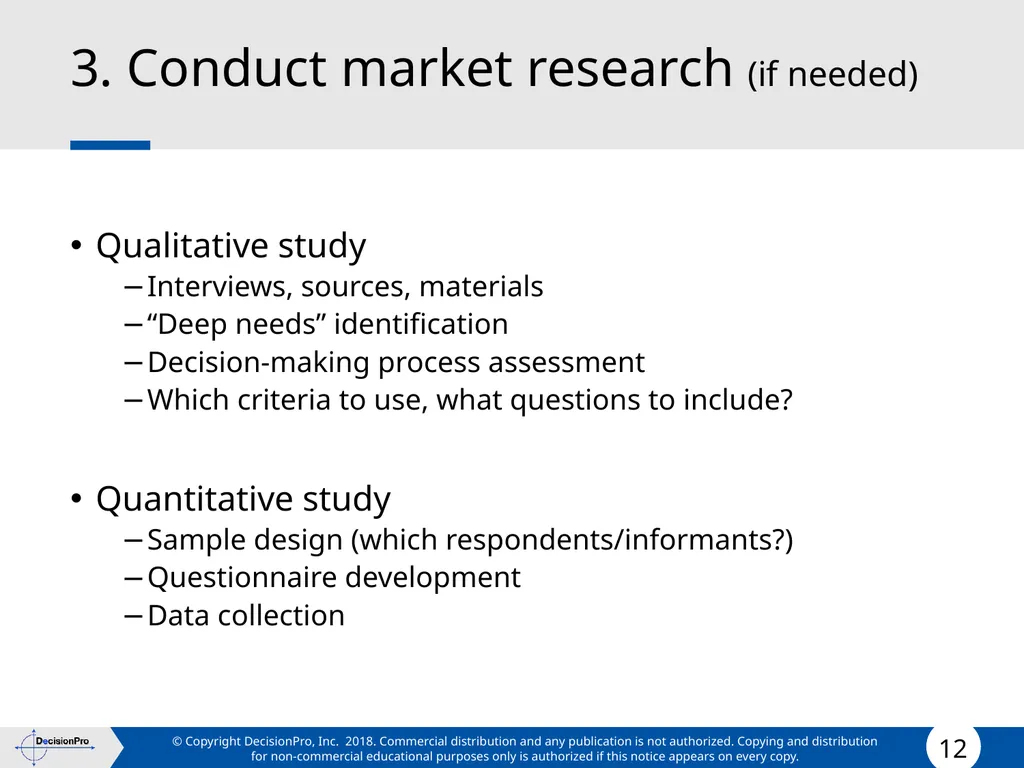
3. Conduct market research (if needed) Qualitative study
Interviews, sources, materials
“Deep needs” identification
Decision-making process assessment
Which criteria to use, what questions to include?
Quantitative study
Sample design (which respondents/informants?)
Questionnaire development
Data collection<br>
Interviews, sources, materials
“Deep needs” identification
Decision-making process assessment
Which criteria to use, what questions to include?
Quantitative study
Sample design (which respondents/informants?)
Questionnaire development
Data collection<br>
13
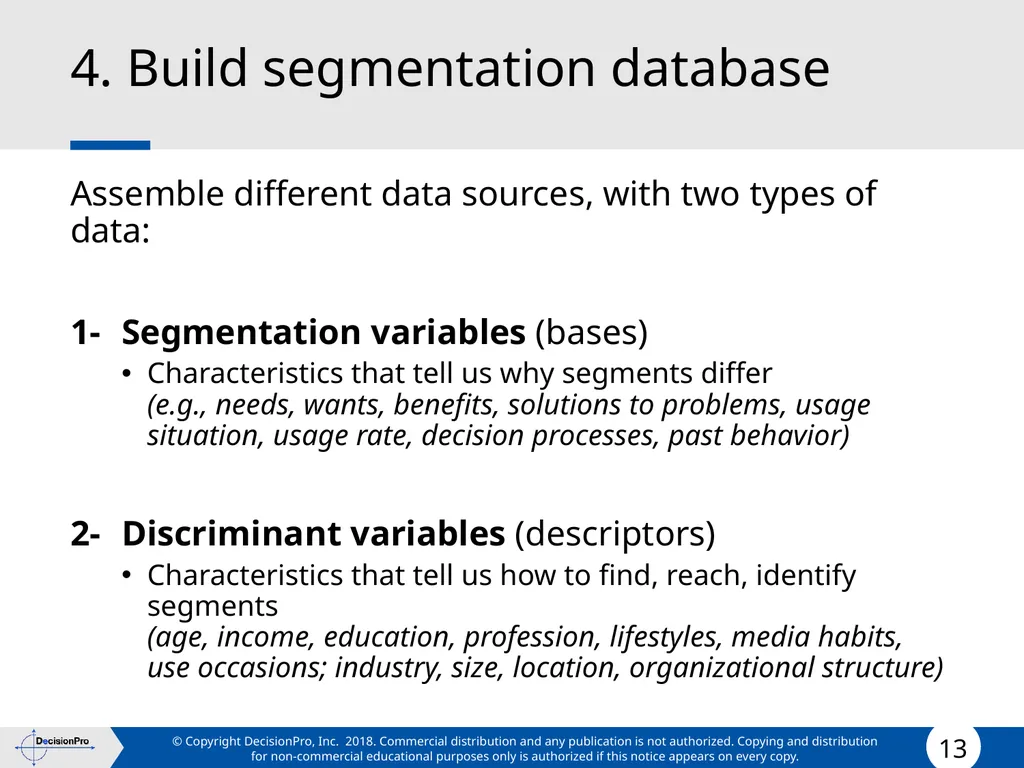
4. Build segmentation database Assemble different data sources, with two types of data:
1- Segmentation variables (bases)
Characteristics that tell us why segments differ (e.g., needs, wants, benefits, solutions to problems, usage situation, usage rate, decision processes, past behavior)
2- Discriminant variables (descriptors)
Characteristics that tell us how to find, reach, identify segments (age, income, education, profession, lifestyles, media habits, use occasions; industry, size, location, organizational structure)<br>
1- Segmentation variables (bases)
Characteristics that tell us why segments differ (e.g., needs, wants, benefits, solutions to problems, usage situation, usage rate, decision processes, past behavior)
2- Discriminant variables (descriptors)
Characteristics that tell us how to find, reach, identify segments (age, income, education, profession, lifestyles, media habits, use occasions; industry, size, location, organizational structure)<br>
14
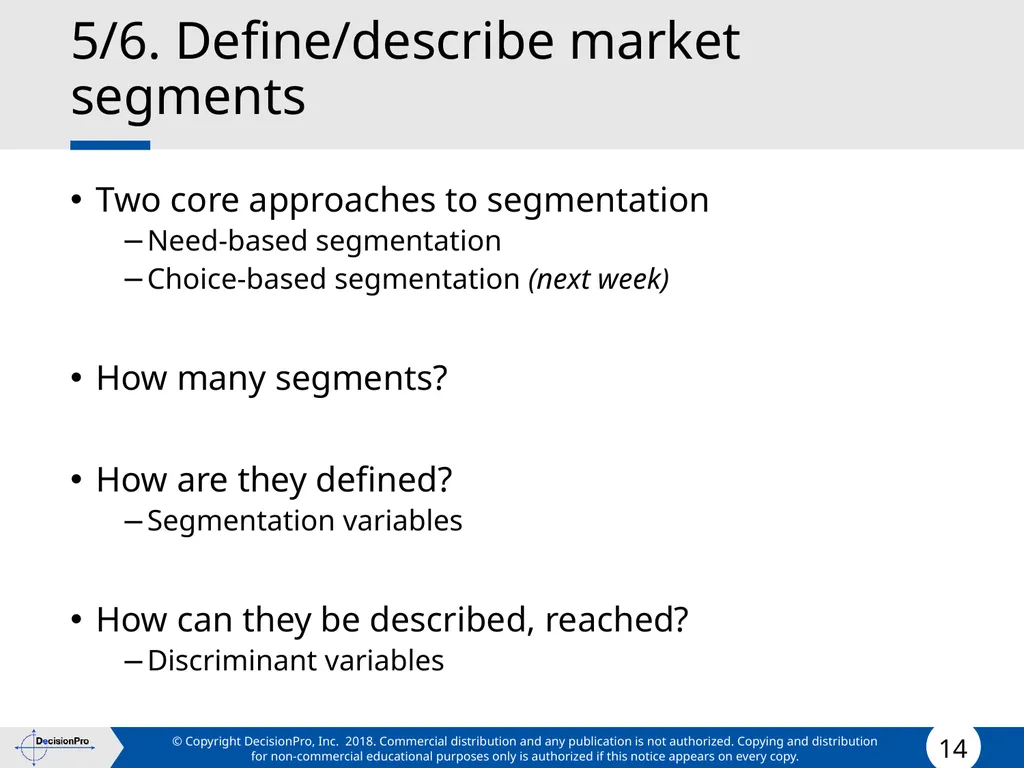
5/6. Define/describe market segments Two core approaches to segmentation
Need-based segmentation
Choice-based segmentation (next week)
How many segments?
How are they defined?
Segmentation variables
How can they be described, reached?
Discriminant variables<br>
Need-based segmentation
Choice-based segmentation (next week)
How many segments?
How are they defined?
Segmentation variables
How can they be described, reached?
Discriminant variables<br>
15
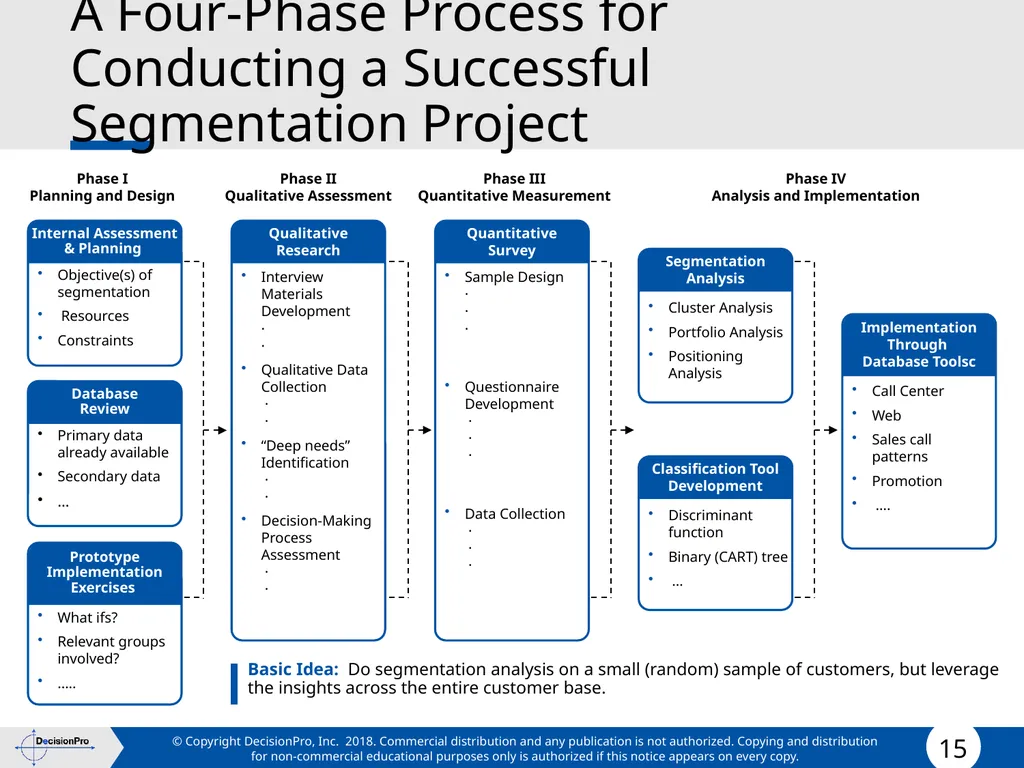
A Four-Phase Process for Conducting a Successful Segmentation Project Phase I
Planning and Design Objective(s) of segmentation
Resources
Constraints Internal Assessment
& Planning Database
Review Prototype
Implementation
Exercises What ifs?
Relevant groups involved?
….. Phase II
Qualitative Assessment Interview Materials Development · ·
Qualitative Data Collection · ·
“Deep needs” Identification · ·
Decision-Making Process Assessment · · Qualitative
Research Phase III
Quantitative Measurement Sample Design · · ·
Questionnaire Development · · ·
Data Collection · · · Quantitative
Survey Cluster Analysis
Portfolio Analysis
Positioning Analysis Segmentation
Analysis Discriminant function
Binary (CART) tree
… Classification Tool
Development Implementation
Through
Database Toolsc Call Center
Web
Sales call patterns
Promotion
…. Phase IV
Analysis and Implementation Basic Idea: Do segmentation analysis on a small (random) sample of customers, but leverage the insights across the entire customer base. Primary data already available
Secondary data
…<br>
Planning and Design Objective(s) of segmentation
Resources
Constraints Internal Assessment
& Planning Database
Review Prototype
Implementation
Exercises What ifs?
Relevant groups involved?
….. Phase II
Qualitative Assessment Interview Materials Development · ·
Qualitative Data Collection · ·
“Deep needs” Identification · ·
Decision-Making Process Assessment · · Qualitative
Research Phase III
Quantitative Measurement Sample Design · · ·
Questionnaire Development · · ·
Data Collection · · · Quantitative
Survey Cluster Analysis
Portfolio Analysis
Positioning Analysis Segmentation
Analysis Discriminant function
Binary (CART) tree
… Classification Tool
Development Implementation
Through
Database Toolsc Call Center
Web
Sales call patterns
Promotion
…. Phase IV
Analysis and Implementation Basic Idea: Do segmentation analysis on a small (random) sample of customers, but leverage the insights across the entire customer base. Primary data already available
Secondary data
…<br>
16
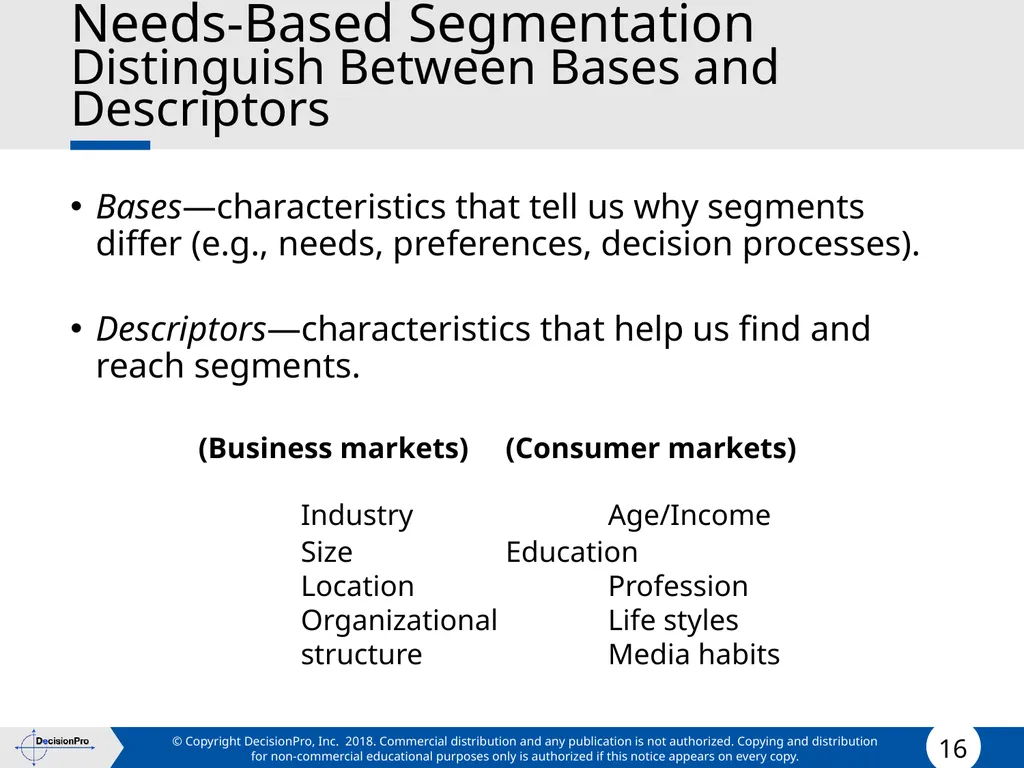
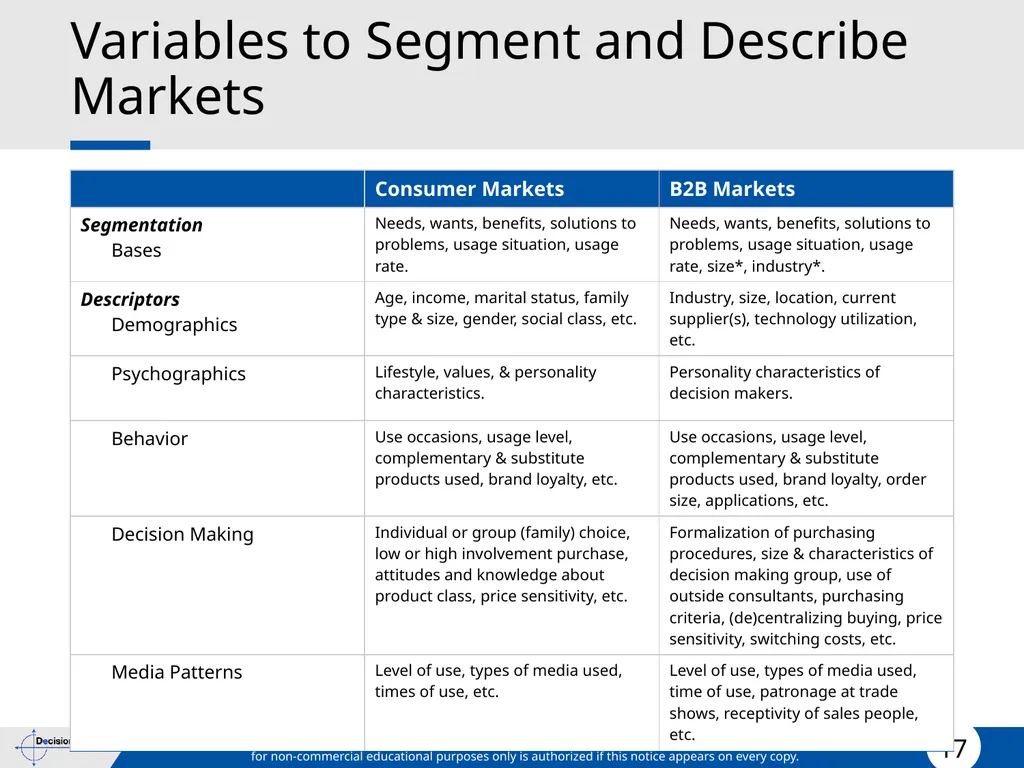
Needs-Based Segmentation Distinguish Between Bases and Descriptors Bases—characteristics that tell us why segments differ (e.g., needs, preferences, decision processes).
Descriptors—characteristics that help us find and reach segments.
(Business markets) (Consumer markets)
Industry Age/Income Size Education Location Profession Organizational Life styles structure Media habits<br>
Descriptors—characteristics that help us find and reach segments.
(Business markets) (Consumer markets)
Industry Age/Income Size Education Location Profession Organizational Life styles structure Media habits<br>
17
Variables to Segment and Describe Markets<br>
18
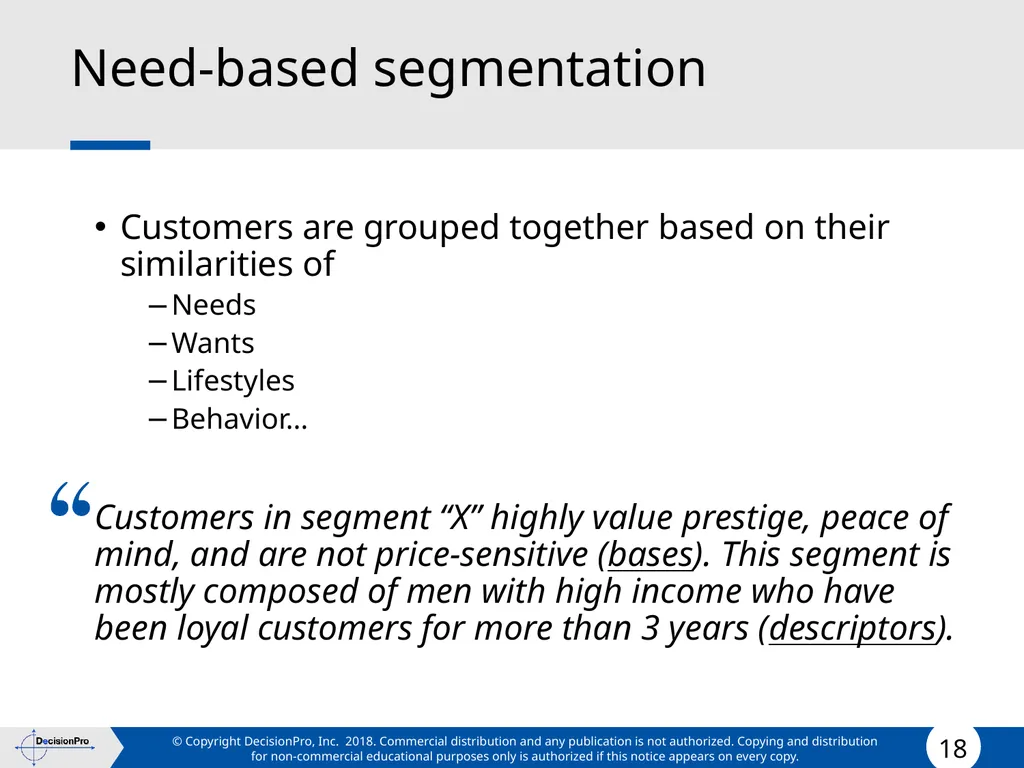
Need-based segmentation Customers are grouped together based on their similarities of
Needs
Wants
Lifestyles
Behavior…
Customers in segment “X” highly value prestige, peace of mind, and are not price-sensitive (bases). This segment is mostly composed of men with high income who have been loyal customers for more than 3 years (descriptors).<br>
Needs
Wants
Lifestyles
Behavior…
Customers in segment “X” highly value prestige, peace of mind, and are not price-sensitive (bases). This segment is mostly composed of men with high income who have been loyal customers for more than 3 years (descriptors).<br>
19
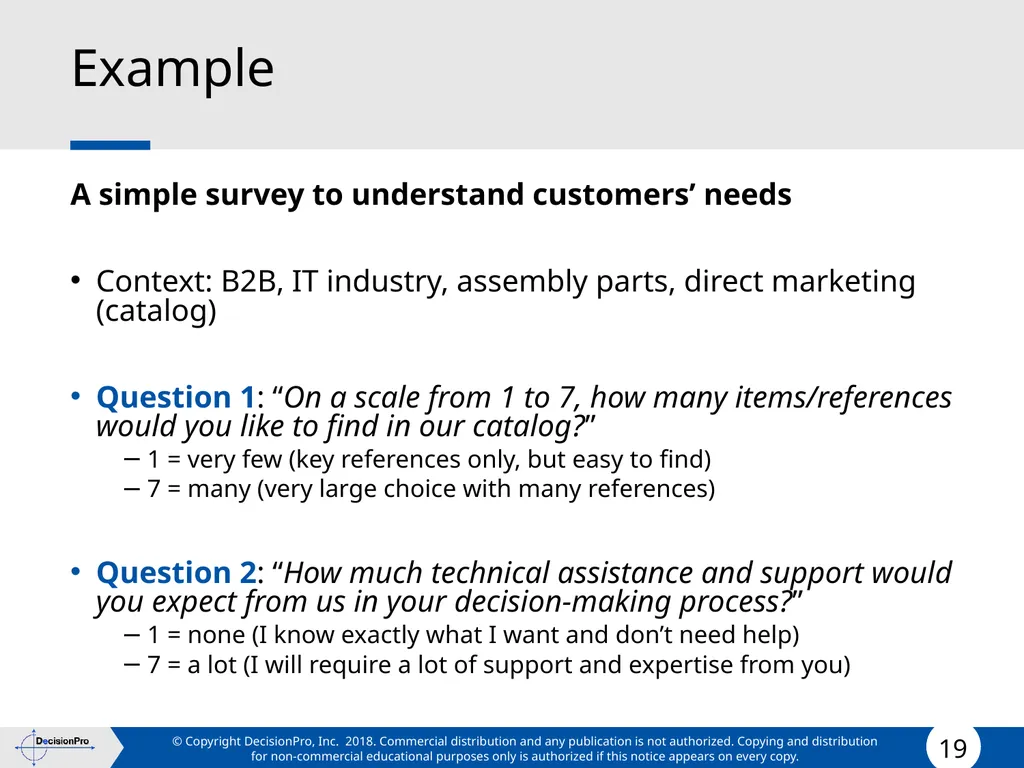
Example A simple survey to understand customers’ needs
Context: B2B, IT industry, assembly parts, direct marketing (catalog)
Question 1: “On a scale from 1 to 7, how many items/references would you like to find in our catalog?”
1 = very few (key references only, but easy to find)
7 = many (very large choice with many references)
Question 2: “How much technical assistance and support would you expect from us in your decision-making process?”
1 = none (I know exactly what I want and don’t need help)
7 = a lot (I will require a lot of support and expertise from you)<br>
Context: B2B, IT industry, assembly parts, direct marketing (catalog)
Question 1: “On a scale from 1 to 7, how many items/references would you like to find in our catalog?”
1 = very few (key references only, but easy to find)
7 = many (very large choice with many references)
Question 2: “How much technical assistance and support would you expect from us in your decision-making process?”
1 = none (I know exactly what I want and don’t need help)
7 = a lot (I will require a lot of support and expertise from you)<br>
20
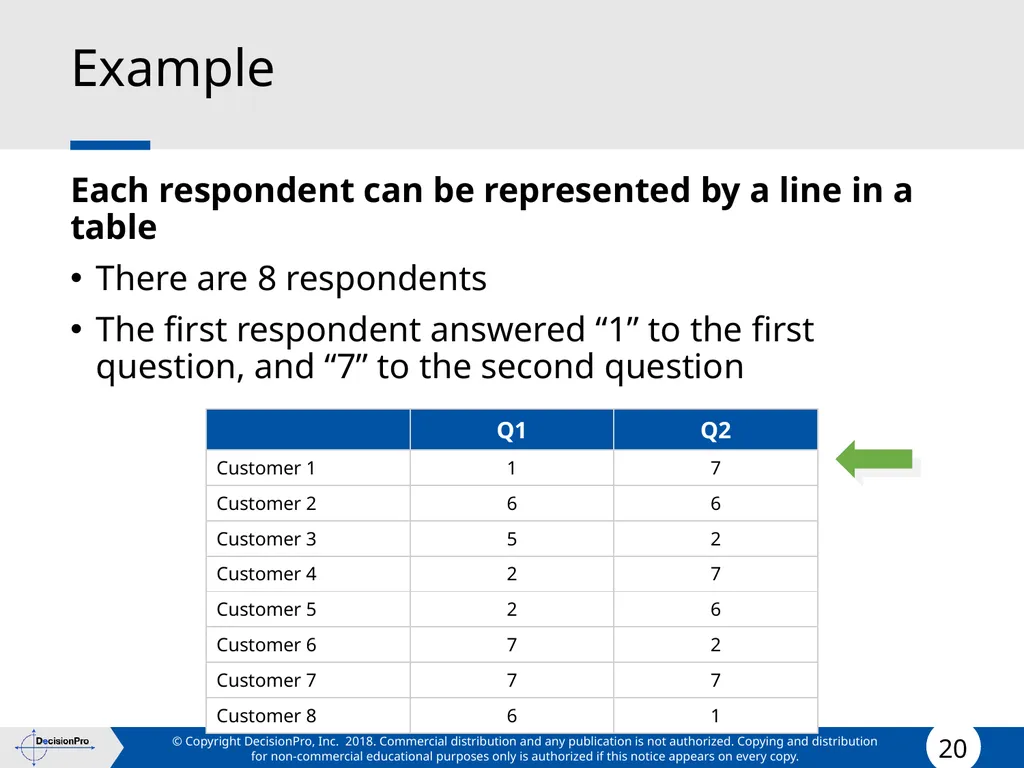
Example Each respondent can be represented by a line in a table
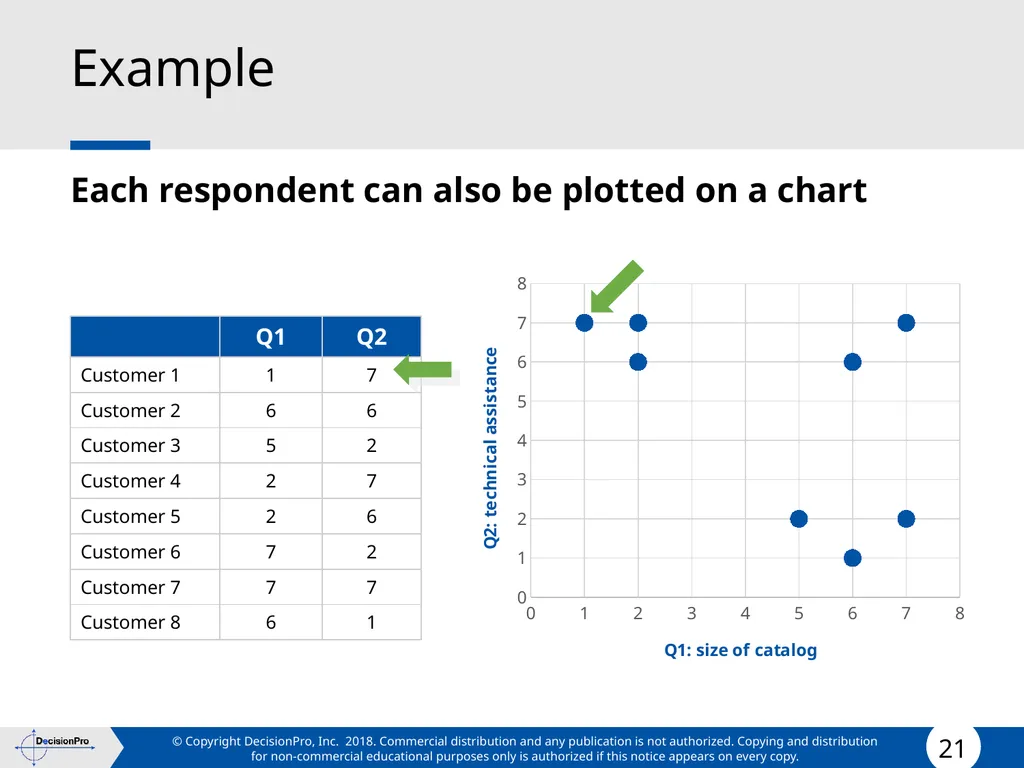
There are 8 respondents
The first respondent answered “1” to the first question, and “7” to the second question<br>
There are 8 respondents
The first respondent answered “1” to the first question, and “7” to the second question<br>
21
Example Each respondent can also be plotted on a chart<br>
22
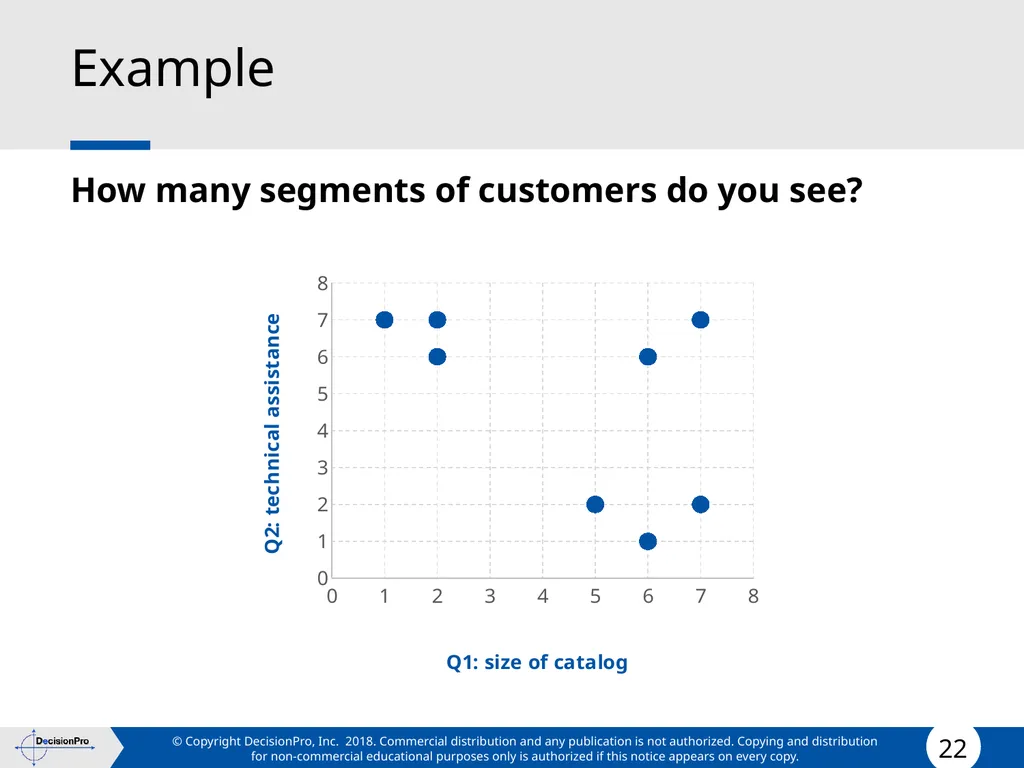
Example How many segments of customers do you see?<br>
23
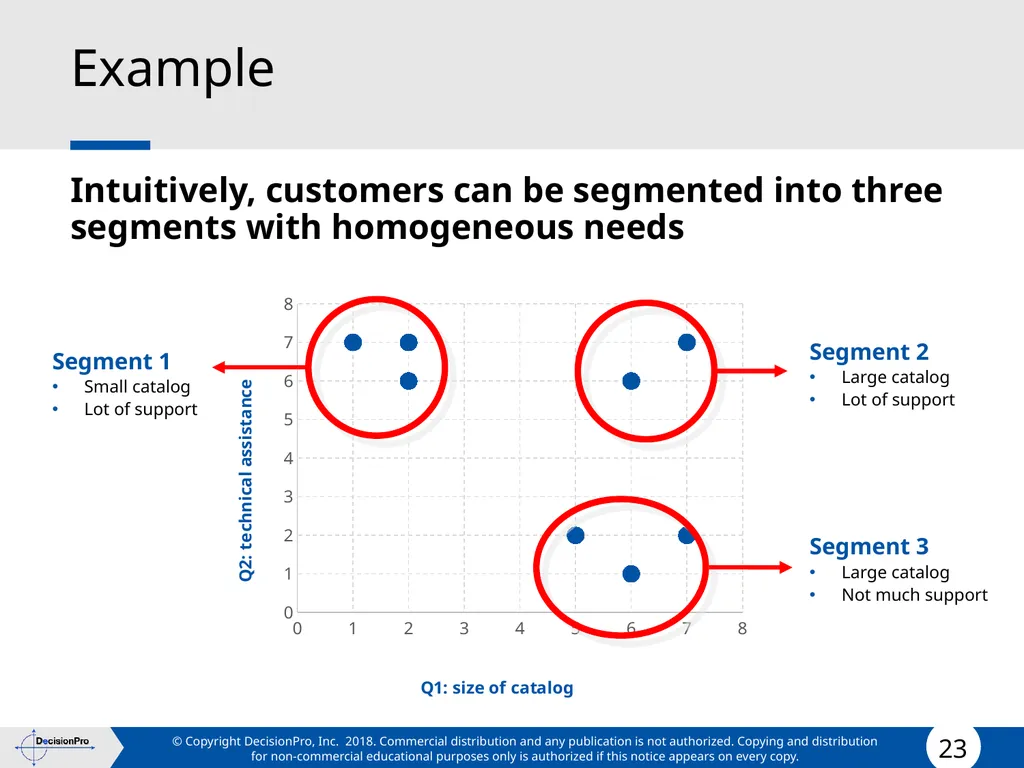
Example Intuitively, customers can be segmented into three segments with homogeneous needs Segment 2
Large catalog
Lot of support Segment 3
Large catalog
Not much support Segment 1
Small catalog
Lot of support<br>
Large catalog
Lot of support Segment 3
Large catalog
Not much support Segment 1
Small catalog
Lot of support<br>
24
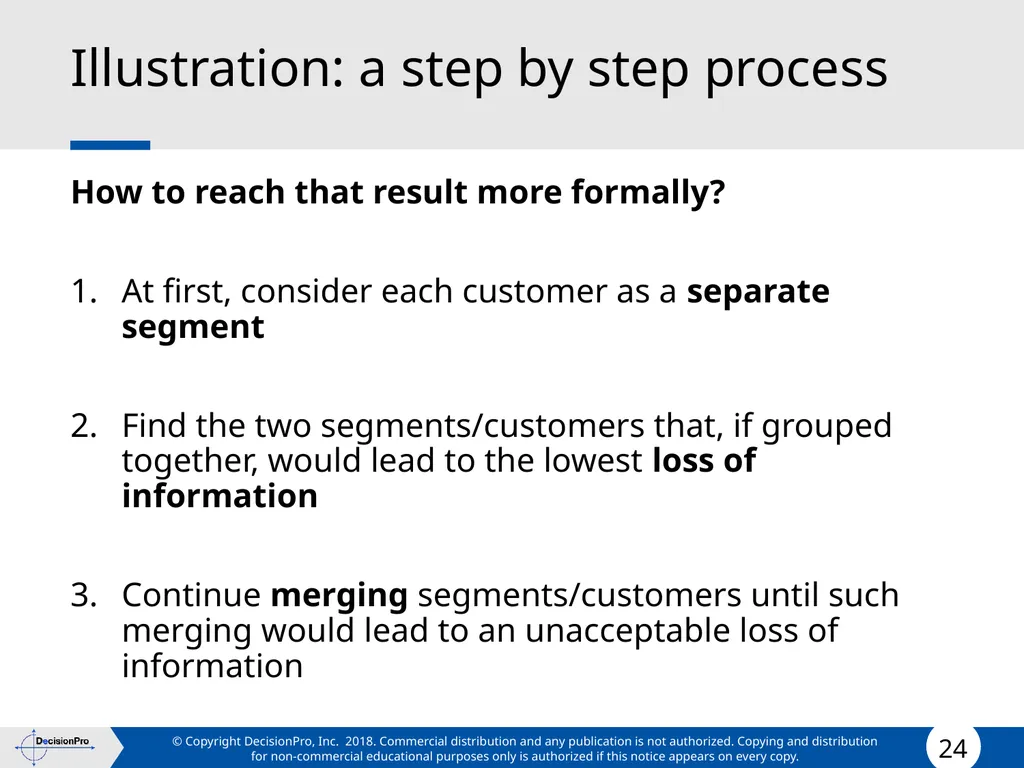
Illustration: a step by step process How to reach that result more formally?
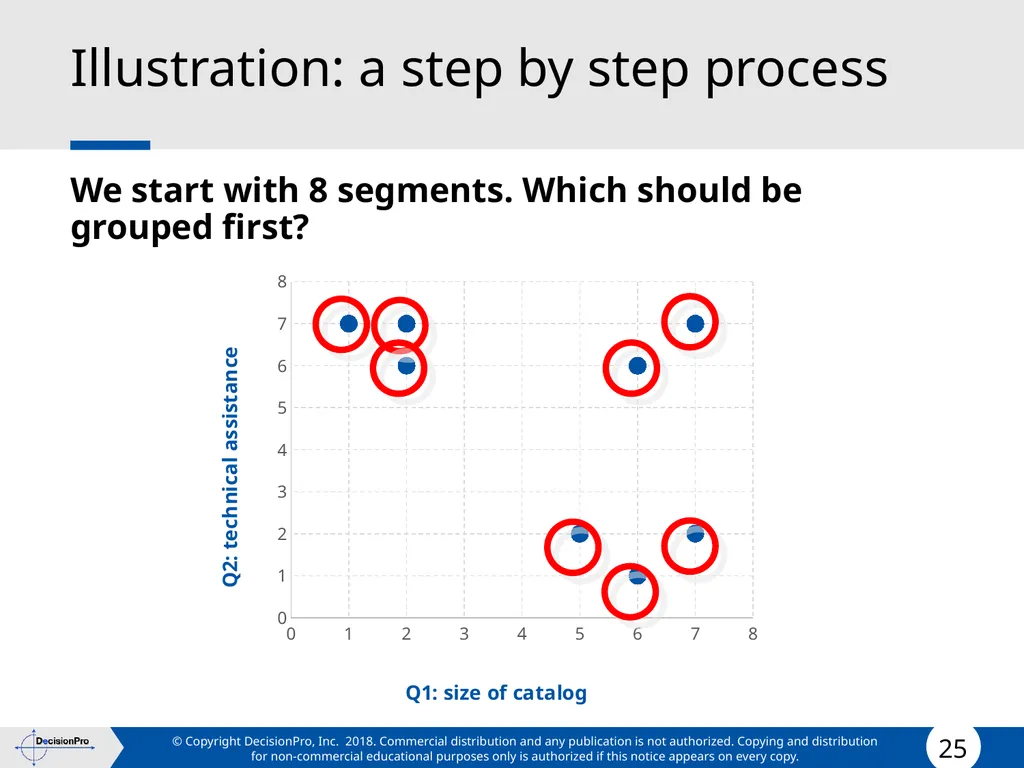
At first, consider each customer as a separate segment
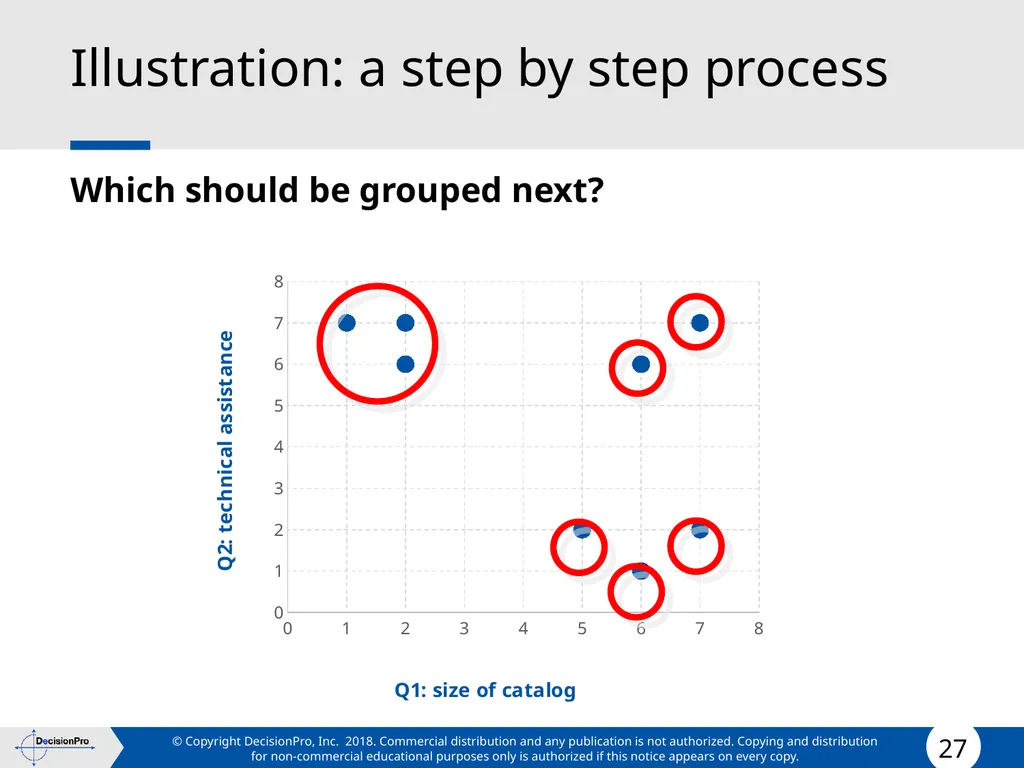
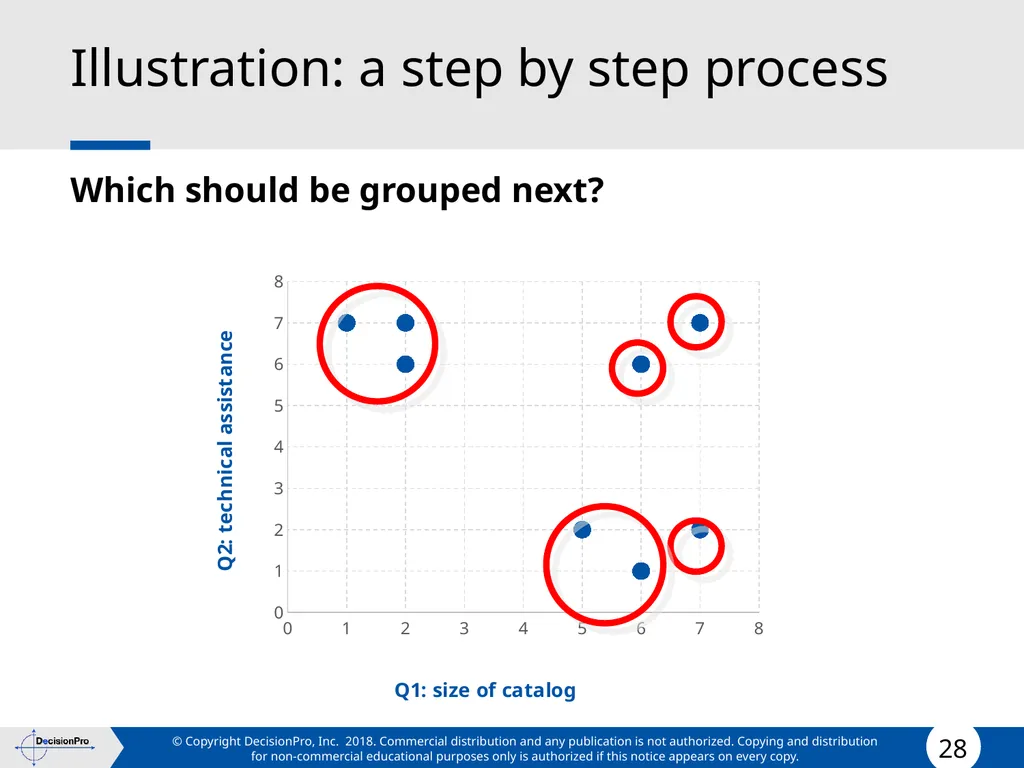
Find the two segments/customers that, if grouped together, would lead to the lowest loss of information
Continue merging segments/customers until such merging would lead to an unacceptable loss of information<br>
At first, consider each customer as a separate segment
Find the two segments/customers that, if grouped together, would lead to the lowest loss of information
Continue merging segments/customers until such merging would lead to an unacceptable loss of information<br>
25
Illustration: a step by step process We start with 8 segments. Which should be grouped first?<br>
26
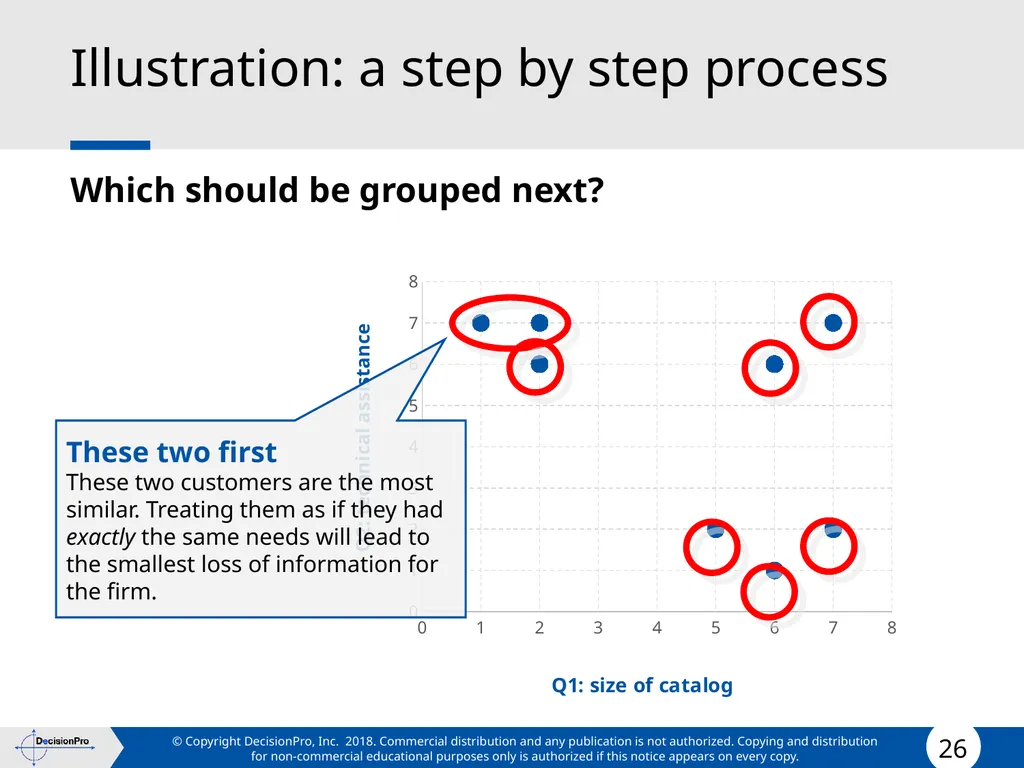
Illustration: a step by step process Which should be grouped next? These two first
These two customers are the most similar. Treating them as if they had exactly the same needs will lead to the smallest loss of information for the firm.<br>
These two customers are the most similar. Treating them as if they had exactly the same needs will lead to the smallest loss of information for the firm.<br>
27
Illustration: a step by step process Which should be grouped next?<br>
28
Illustration: a step by step process Which should be grouped next?<br>
29
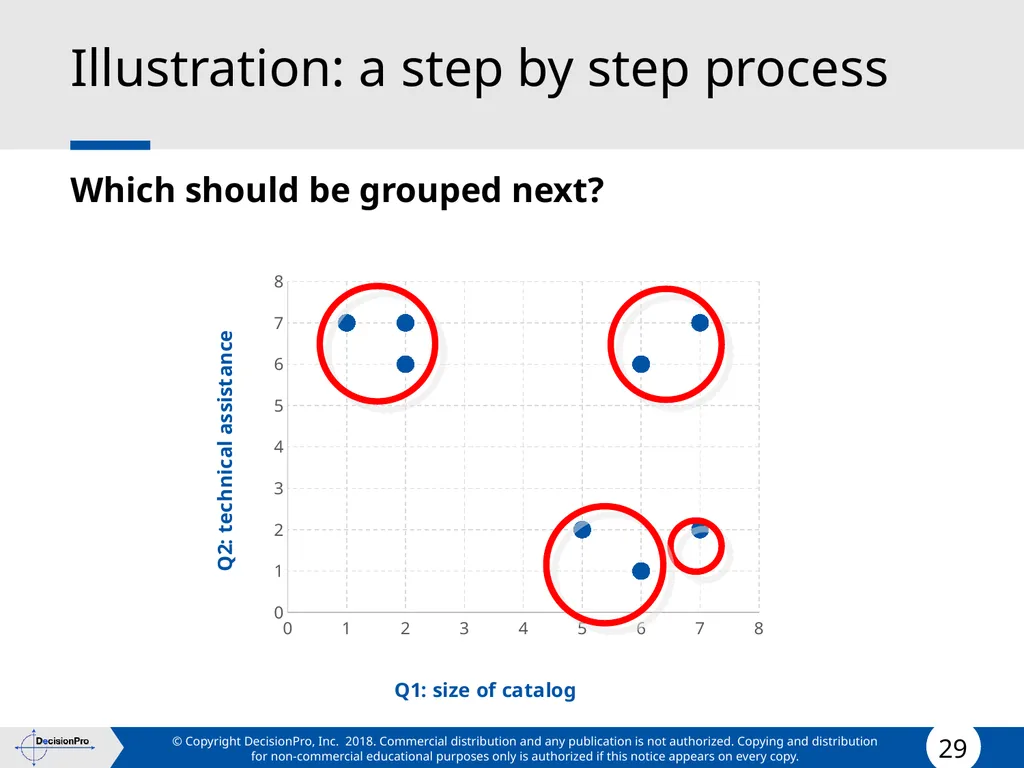
Illustration: a step by step process Which should be grouped next?<br>
30
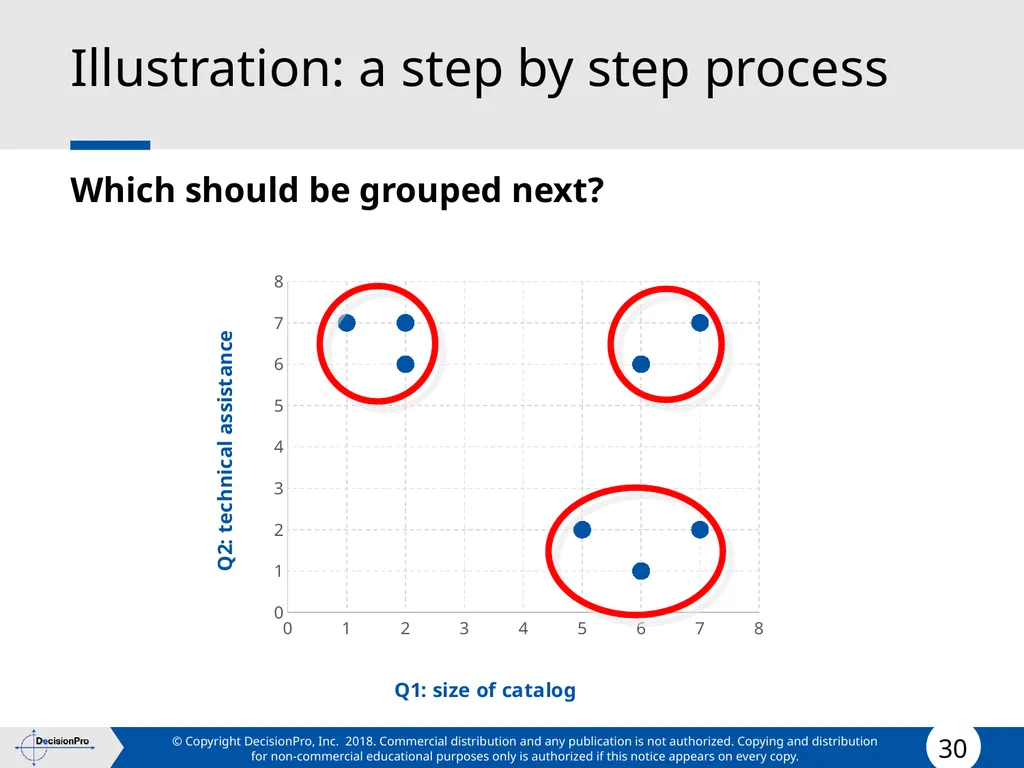
Illustration: a step by step process Which should be grouped next?<br>
31
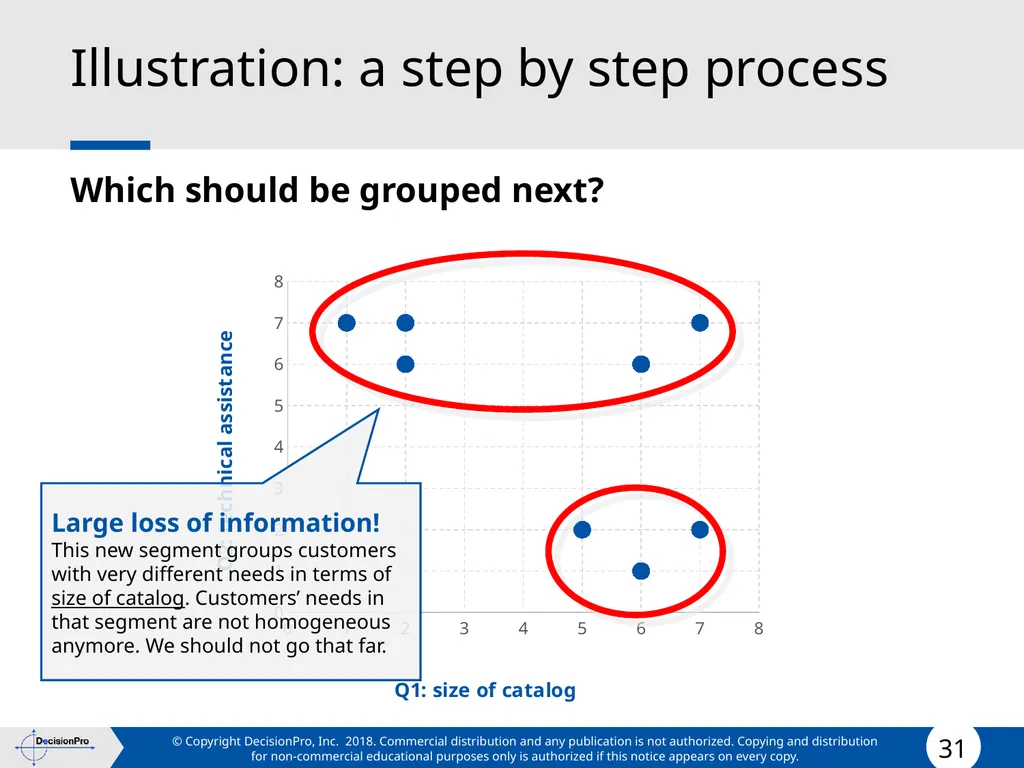
Illustration: a step by step process Which should be grouped next? Large loss of information!
This new segment groups customers with very different needs in terms of size of catalog. Customers’ needs in that segment are not homogeneous anymore. We should not go that far.<br>
This new segment groups customers with very different needs in terms of size of catalog. Customers’ needs in that segment are not homogeneous anymore. We should not go that far.<br>
32
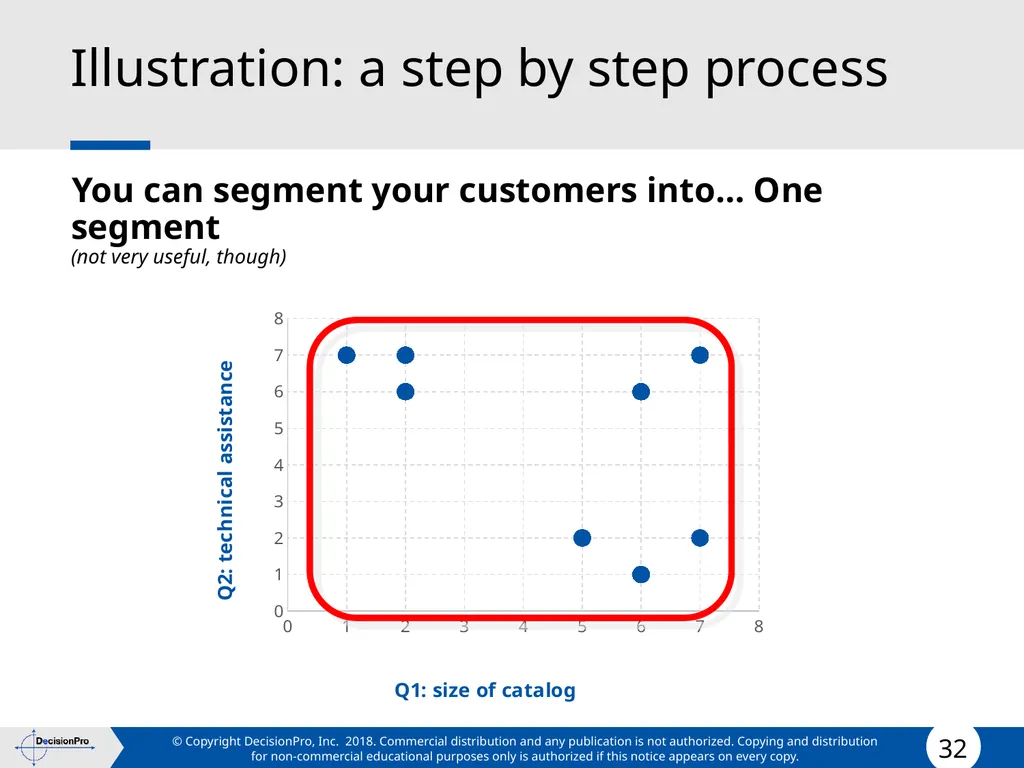
Illustration: a step by step process You can segment your customers into… One segment
(not very useful, though)<br>
33
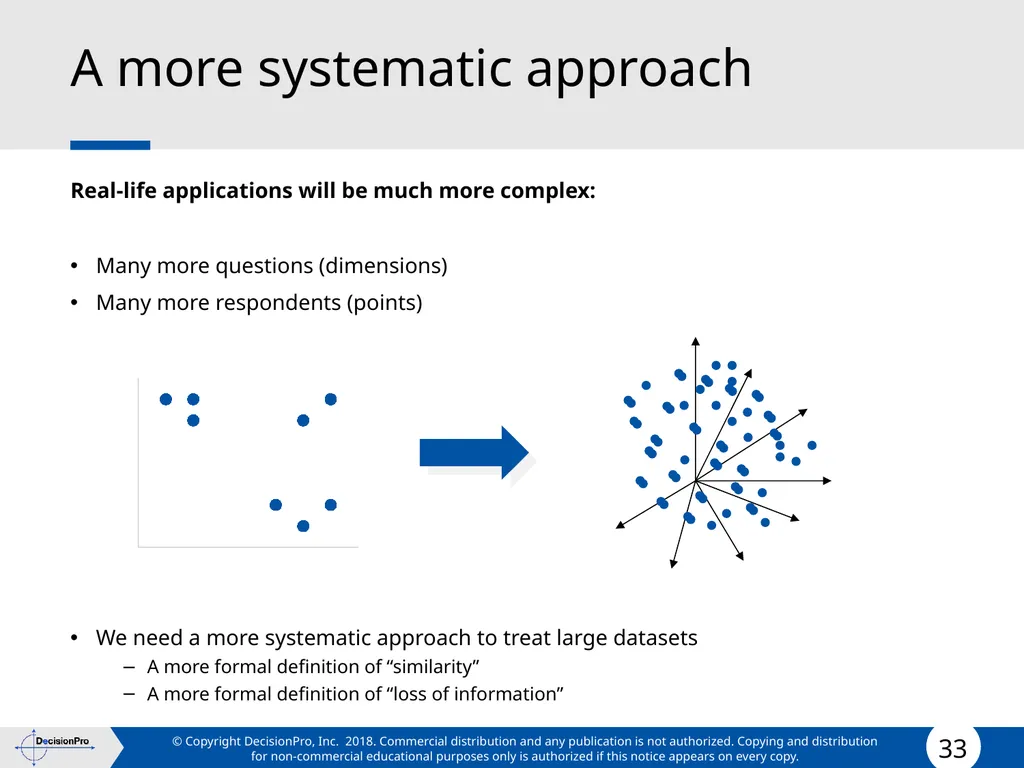
A more systematic approach Real-life applications will be much more complex:
Many more questions (dimensions)
Many more respondents (points)
We need a more systematic approach to treat large datasets
A more formal definition of “similarity”
A more formal definition of “loss of information”<br>
Many more questions (dimensions)
Many more respondents (points)
We need a more systematic approach to treat large datasets
A more formal definition of “similarity”
A more formal definition of “loss of information”<br>
34
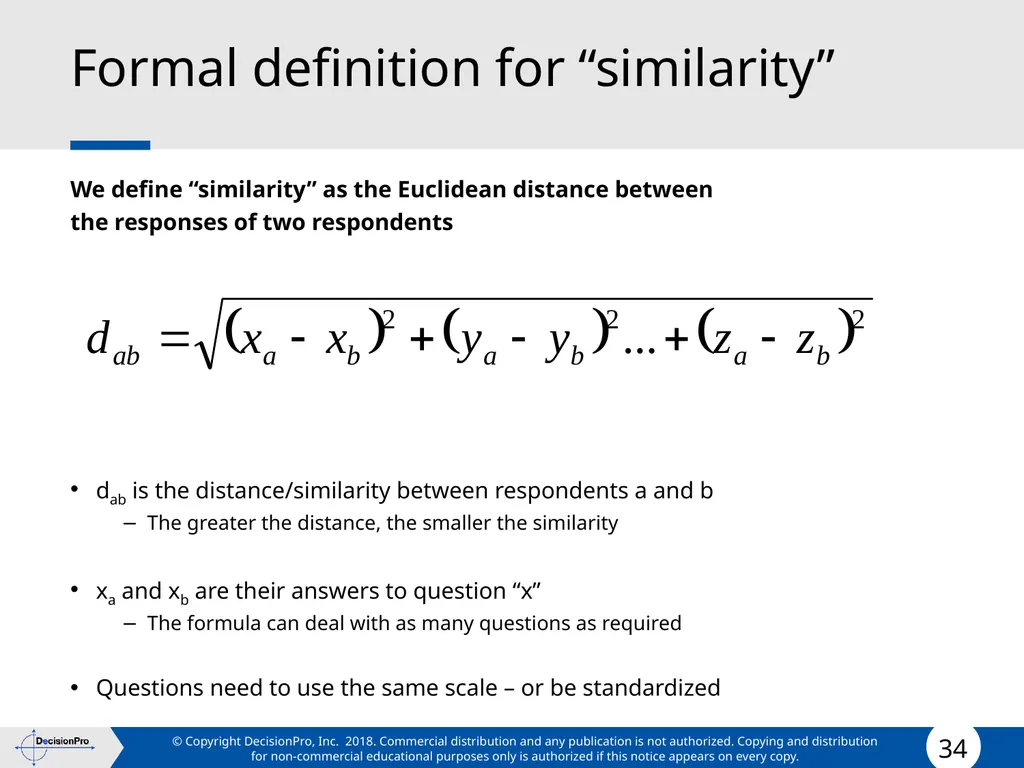
Formal definition for “similarity” We define “similarity” as the Euclidean distance between
the responses of two respondents
dab is the distance/similarity between respondents a and b
The greater the distance, the smaller the similarity
xa and xb are their answers to question “x”
The formula can deal with as many questions as required
Questions need to use the same scale – or be standardized<br>
the responses of two respondents
dab is the distance/similarity between respondents a and b
The greater the distance, the smaller the similarity
xa and xb are their answers to question “x”
The formula can deal with as many questions as required
Questions need to use the same scale – or be standardized<br>
35
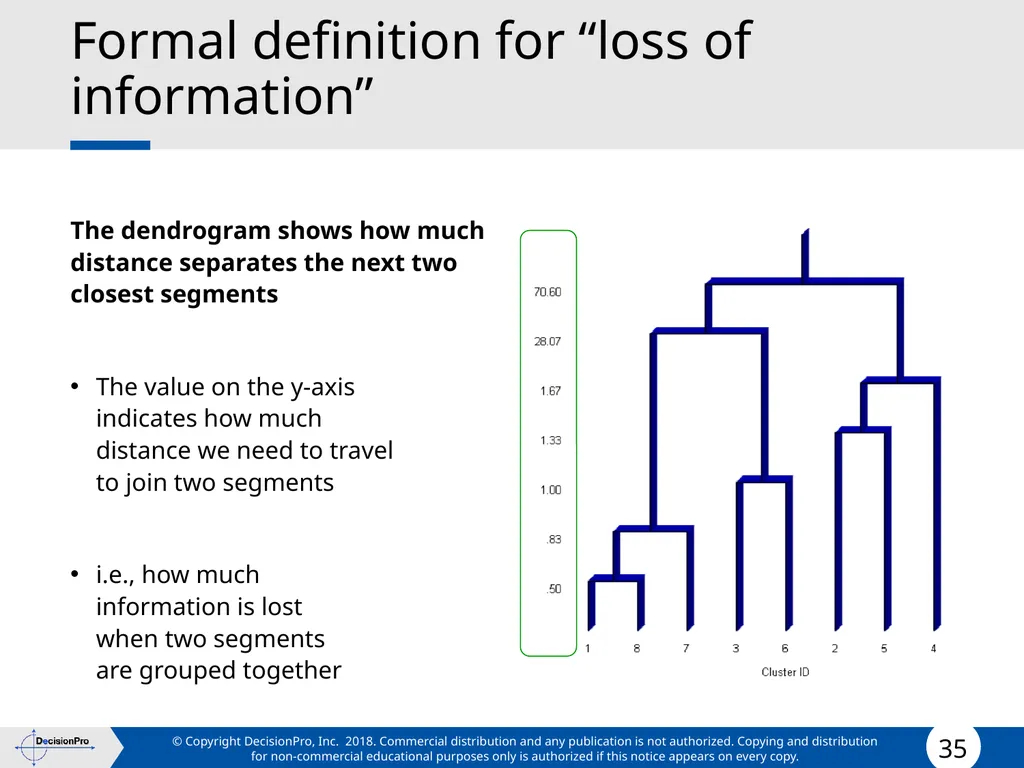
Formal definition for “loss of information” The dendrogram shows how much distance separates the next two closest segments
The value on the y-axis indicates how much distance we need to travel to join two segments
i.e., how much information is lost when two segments are grouped together<br>
The value on the y-axis indicates how much distance we need to travel to join two segments
i.e., how much information is lost when two segments are grouped together<br>
36
Formal definition for “loss of information” The dendrogram shows how much distance separates the next two closest segments
If there is a sudden jump, stop
(here 3 segments)<br>
If there is a sudden jump, stop
(here 3 segments)<br>
37
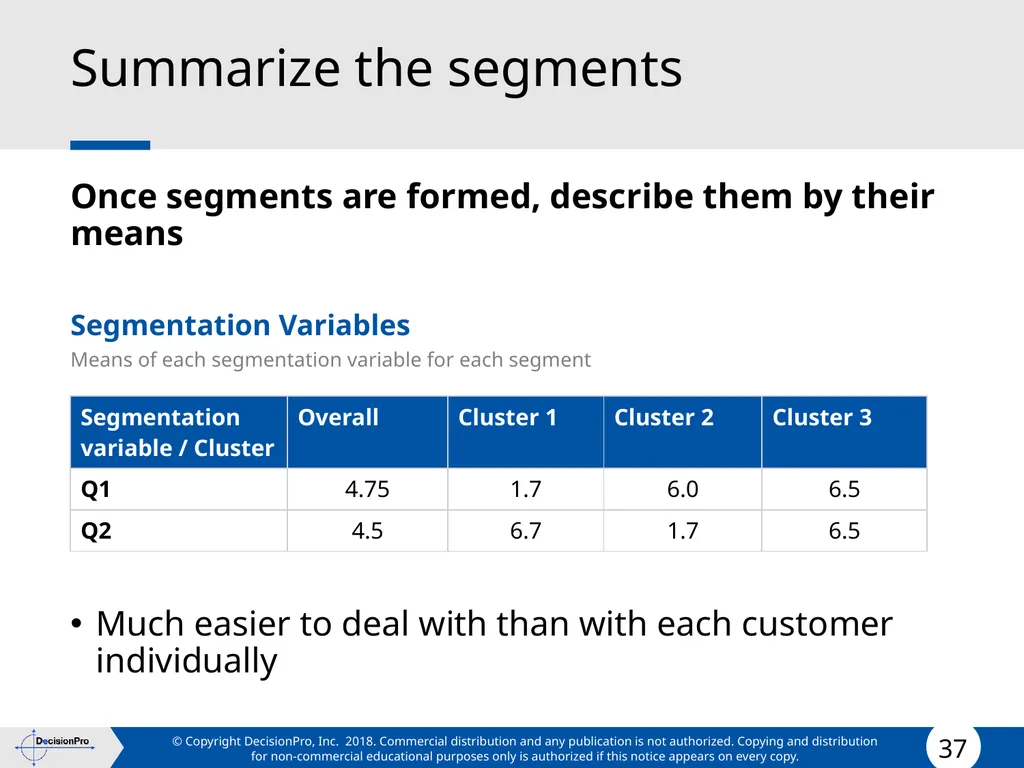
Summarize the segments Once segments are formed, describe them by their means
Segmentation Variables
Means of each segmentation variable for each segment
Much easier to deal with than with each customer individually<br>
Segmentation Variables
Means of each segmentation variable for each segment
Much easier to deal with than with each customer individually<br>
38
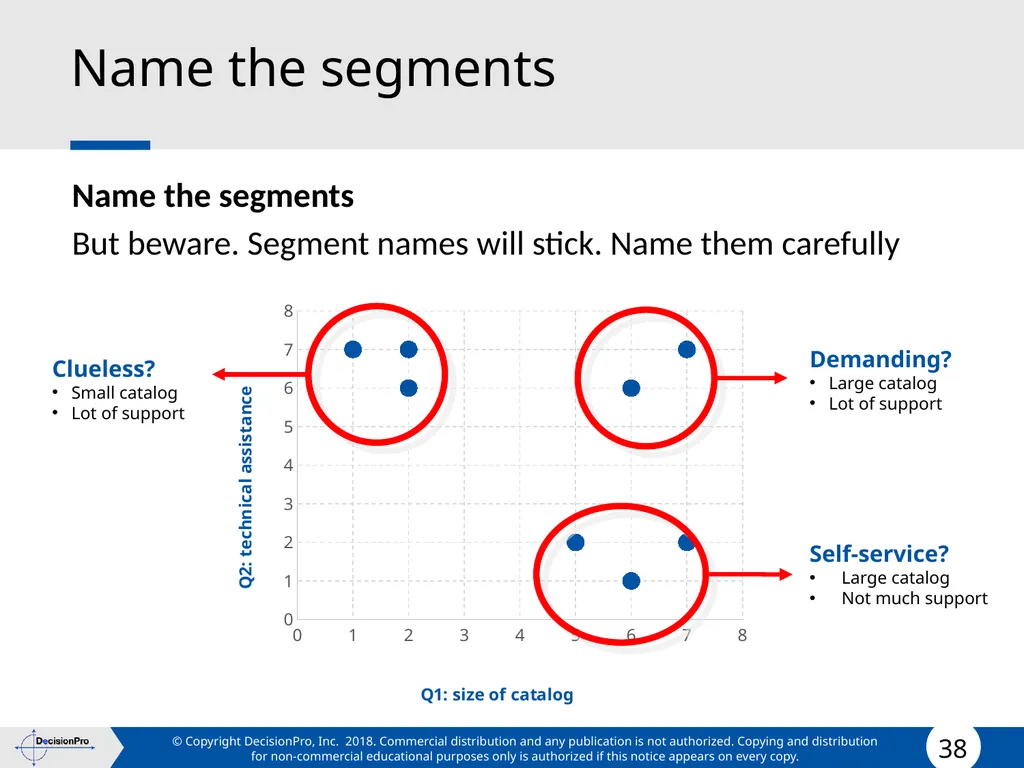
Name the segments Name the segments
But beware. Segment names will stick. Name them carefully Demanding?
Large catalog
Lot of support Self-service?
Large catalog
Not much support Clueless?
Small catalog
Lot of support<br>
But beware. Segment names will stick. Name them carefully Demanding?
Large catalog
Lot of support Self-service?
Large catalog
Not much support Clueless?
Small catalog
Lot of support<br>
39
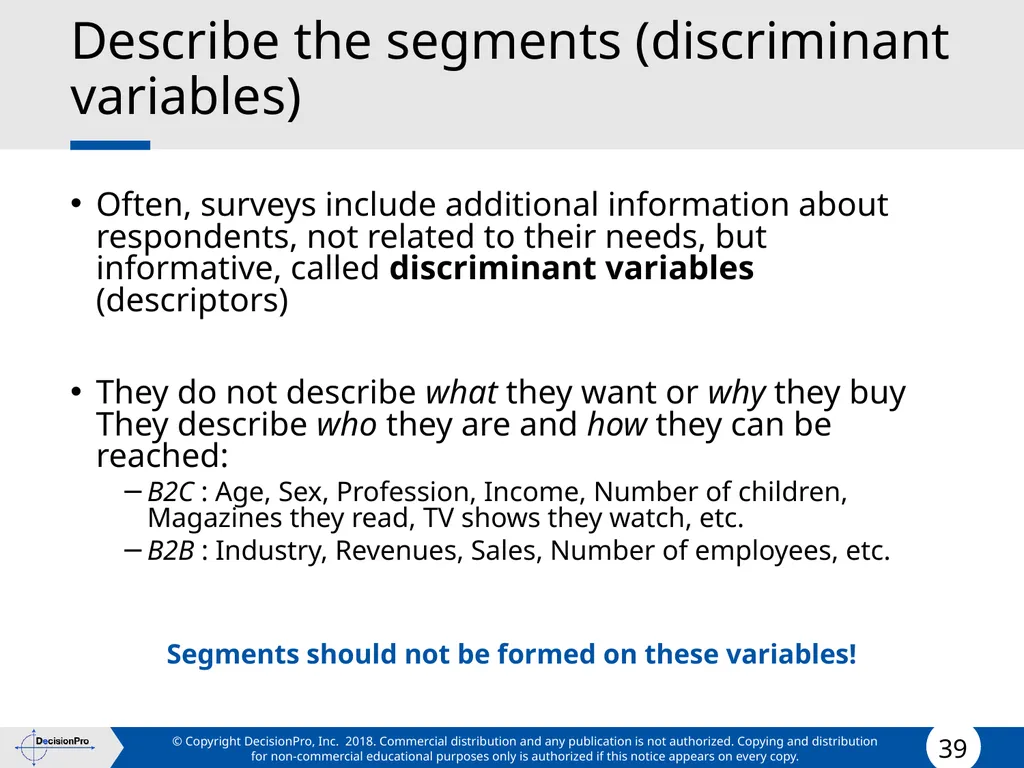
Describe the segments (discriminant variables) Often, surveys include additional information about respondents, not related to their needs, but informative, called discriminant variables (descriptors)
They do not describe what they want or why they buy They describe who they are and how they can be reached:
B2C : Age, Sex, Profession, Income, Number of children, Magazines they read, TV shows they watch, etc.
B2B : Industry, Revenues, Sales, Number of employees, etc.
Segments should not be formed on these variables!<br>
They do not describe what they want or why they buy They describe who they are and how they can be reached:
B2C : Age, Sex, Profession, Income, Number of children, Magazines they read, TV shows they watch, etc.
B2B : Industry, Revenues, Sales, Number of employees, etc.
Segments should not be formed on these variables!<br>
40
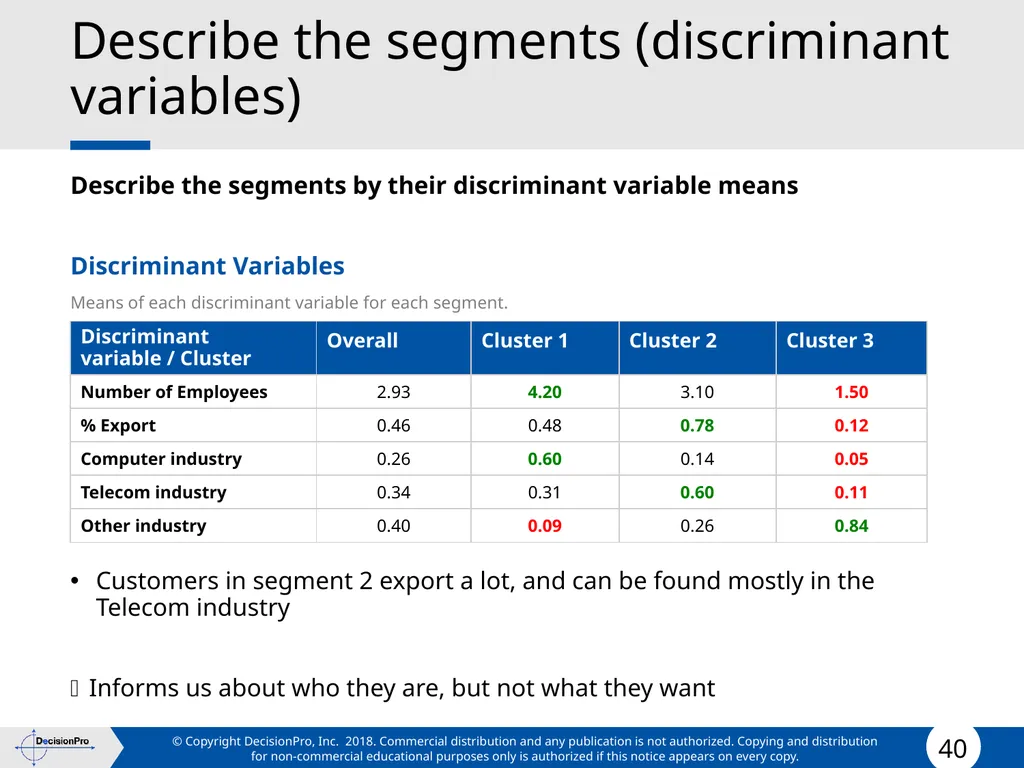
Describe the segments (discriminant variables) Describe the segments by their discriminant variable means
Discriminant Variables
Means of each discriminant variable for each segment.
Customers in segment 2 export a lot, and can be found mostly in the Telecom industry
Informs us about who they are, but not what they want<br>
Discriminant Variables
Means of each discriminant variable for each segment.
Customers in segment 2 export a lot, and can be found mostly in the Telecom industry
Informs us about who they are, but not what they want<br>
41
Finding customers/prospects How can we assign all customers/prospects to the right segment?
If they replied to the survey, that’s easy…
But most have not<br>
If they replied to the survey, that’s easy…
But most have not<br>
42
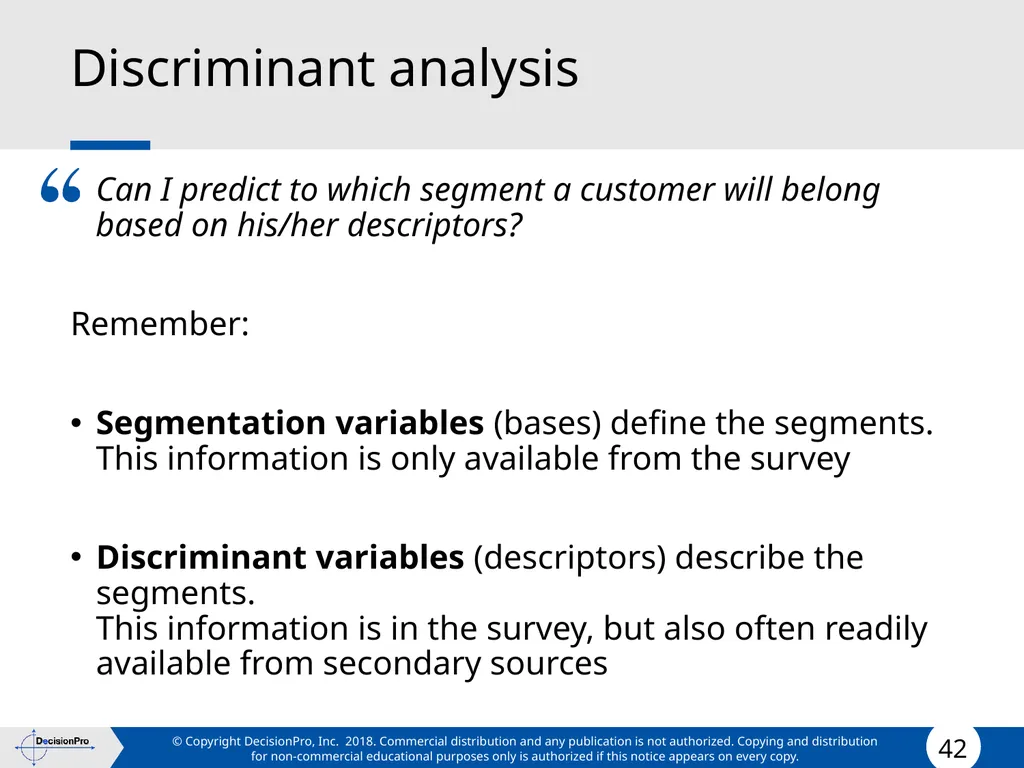
Discriminant analysis Can I predict to which segment a customer will belong
based on his/her descriptors?
Remember:
Segmentation variables (bases) define the segments. This information is only available from the survey
Discriminant variables (descriptors) describe the segments. This information is in the survey, but also often readily available from secondary sources<br>
Remember:
Segmentation variables (bases) define the segments. This information is only available from the survey
Discriminant variables (descriptors) describe the segments. This information is in the survey, but also often readily available from secondary sources<br>
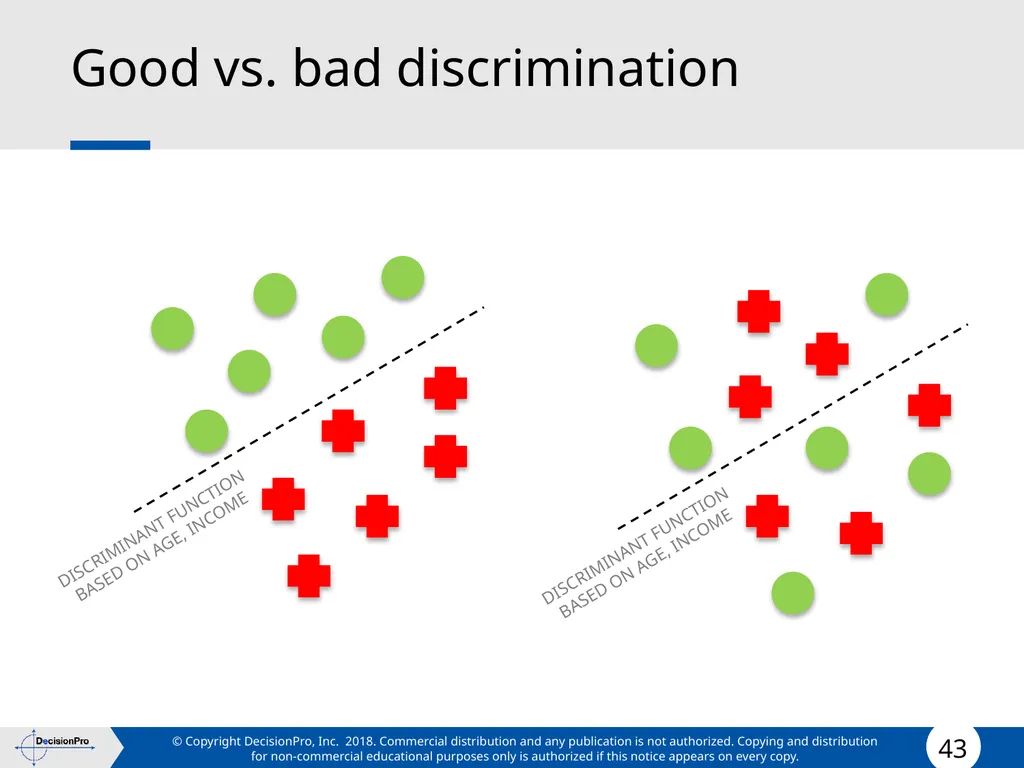
43
Good vs. bad discrimination DISCRIMINANT FUNCTION
BASED ON AGE, INCOME DISCRIMINANT FUNCTION
BASED ON AGE, INCOME<br>
44
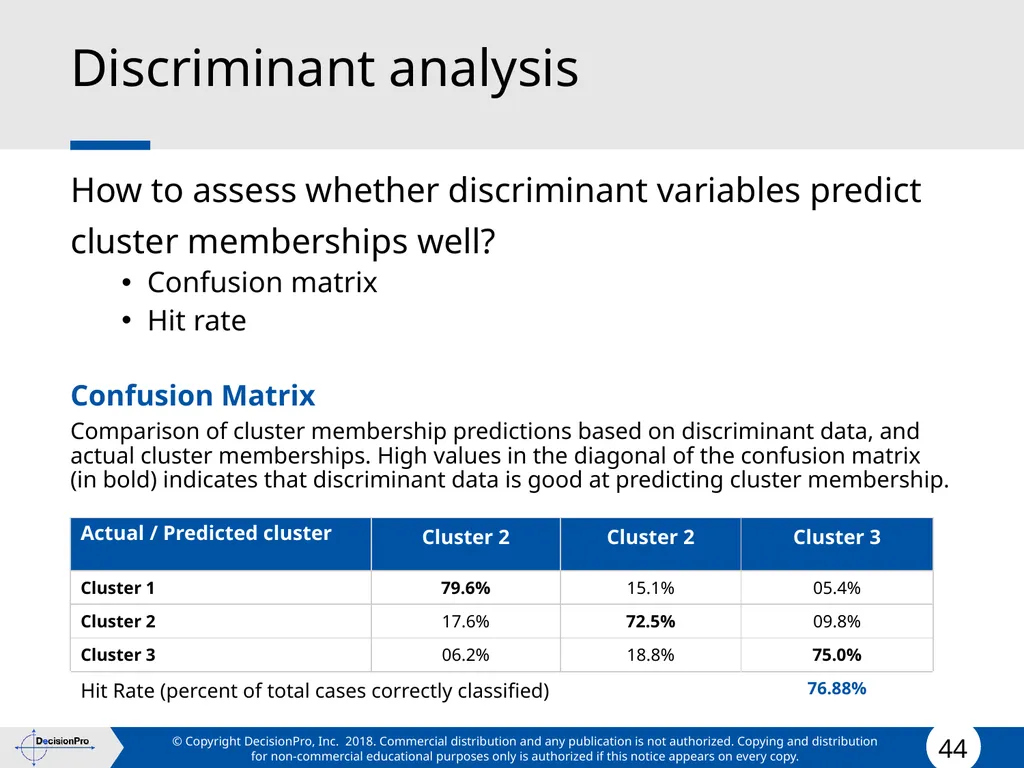
Discriminant analysis How to assess whether discriminant variables predict
cluster memberships well?
Confusion matrix
Hit rate
Confusion Matrix
Comparison of cluster membership predictions based on discriminant data, and actual cluster memberships. High values in the diagonal of the confusion matrix (in bold) indicates that discriminant data is good at predicting cluster membership.<br>
cluster memberships well?
Confusion matrix
Hit rate
Confusion Matrix
Comparison of cluster membership predictions based on discriminant data, and actual cluster memberships. High values in the diagonal of the confusion matrix (in bold) indicates that discriminant data is good at predicting cluster membership.<br>
45
Targeting<br>
46
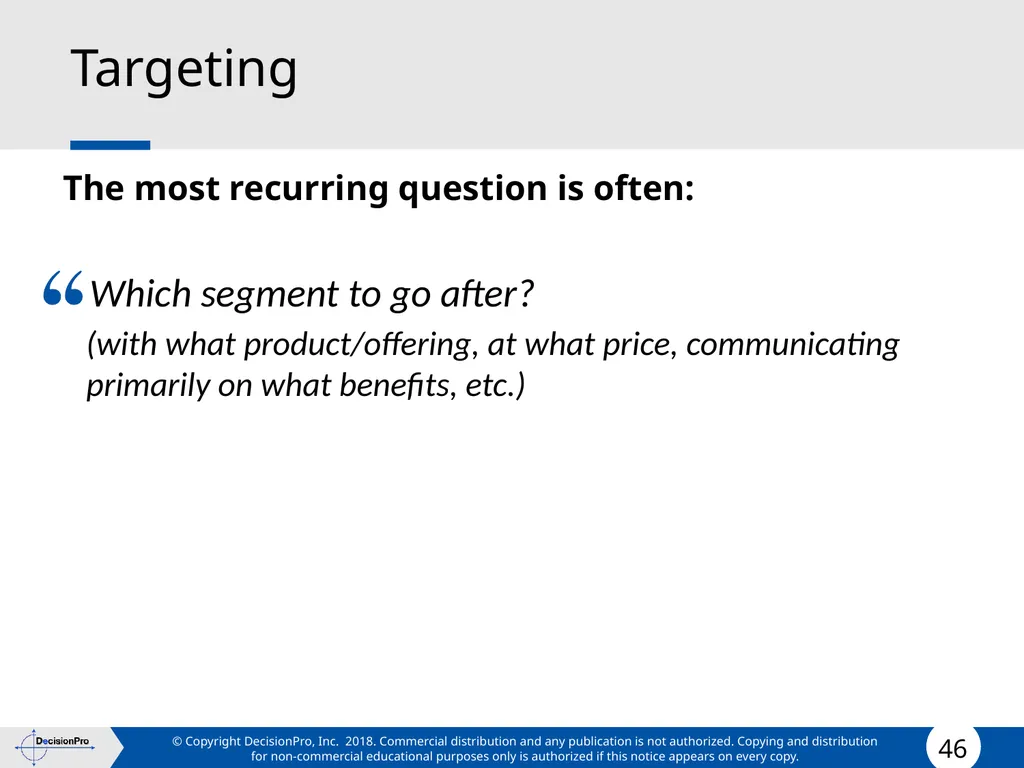
Targeting The most recurring question is often:
Which segment to go after?
(with what product/offering, at what price, communicating primarily on what benefits, etc.)<br>
Which segment to go after?
(with what product/offering, at what price, communicating primarily on what benefits, etc.)<br>
47
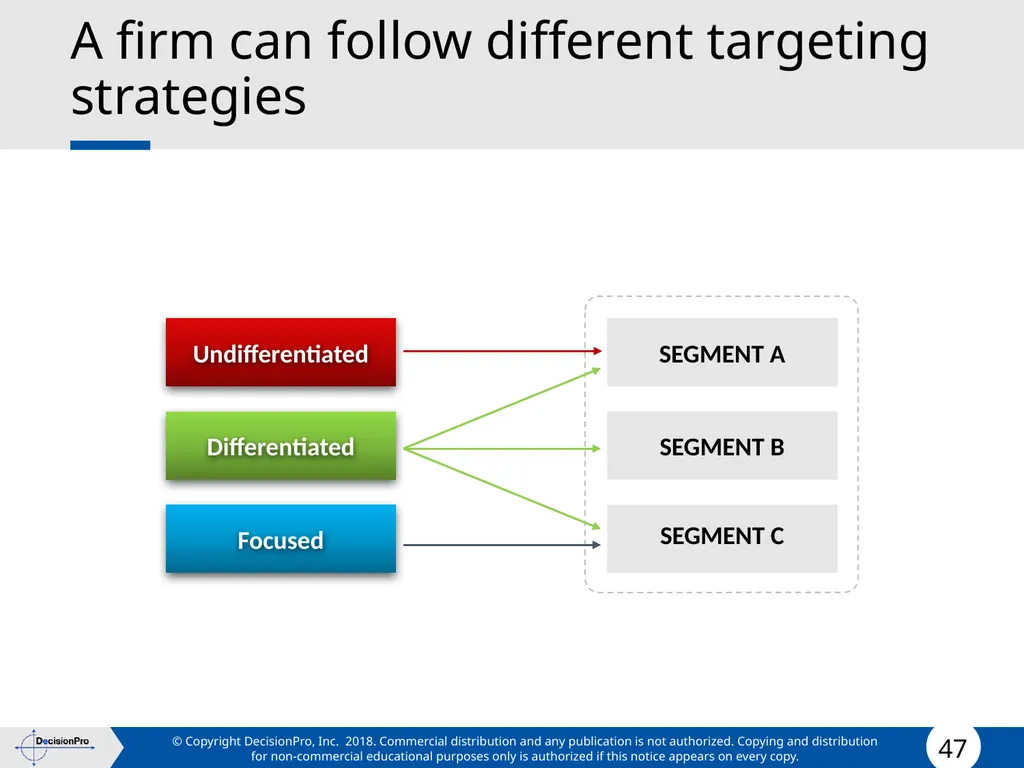
A firm can follow different targeting strategies Undifferentiated Focused Differentiated SEGMENT A SEGMENT C SEGMENT B<br>
48
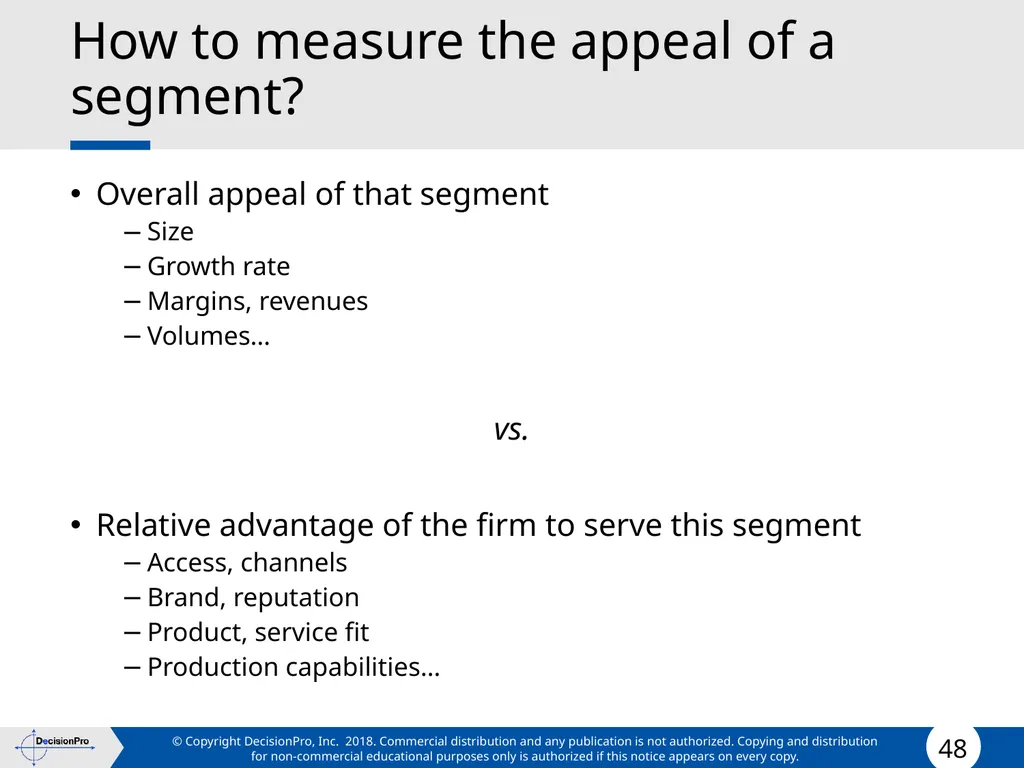
How to measure the appeal of a segment? Overall appeal of that segment
Size
Growth rate
Margins, revenues
Volumes…
vs.
Relative advantage of the firm to serve this segment
Access, channels
Brand, reputation
Product, service fit
Production capabilities…<br>
Size
Growth rate
Margins, revenues
Volumes…
vs.
Relative advantage of the firm to serve this segment
Access, channels
Brand, reputation
Product, service fit
Production capabilities…<br>
49
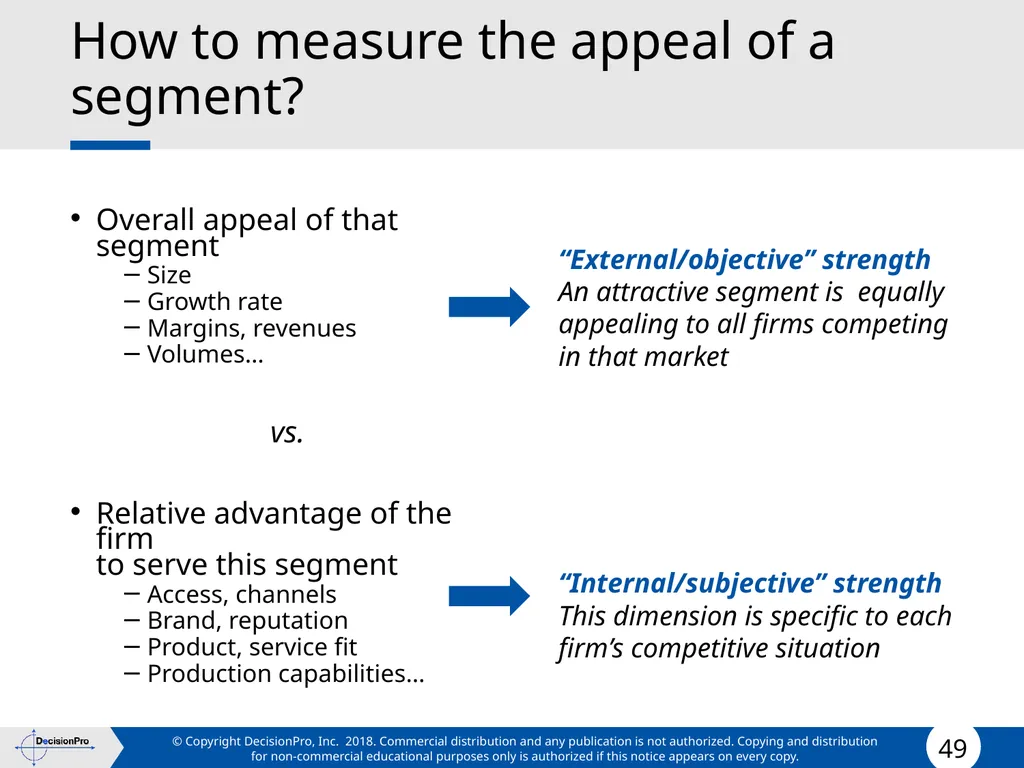
How to measure the appeal of a segment? Overall appeal of that segment
Size
Growth rate
Margins, revenues
Volumes…
vs.
Relative advantage of the firm to serve this segment
Access, channels
Brand, reputation
Product, service fit
Production capabilities… “External/objective” strength
An attractive segment is equally appealing to all firms competing in that market
“Internal/subjective” strength
This dimension is specific to each firm’s competitive situation<br>
Size
Growth rate
Margins, revenues
Volumes…
vs.
Relative advantage of the firm to serve this segment
Access, channels
Brand, reputation
Product, service fit
Production capabilities… “External/objective” strength
An attractive segment is equally appealing to all firms competing in that market
“Internal/subjective” strength
This dimension is specific to each firm’s competitive situation<br>
50
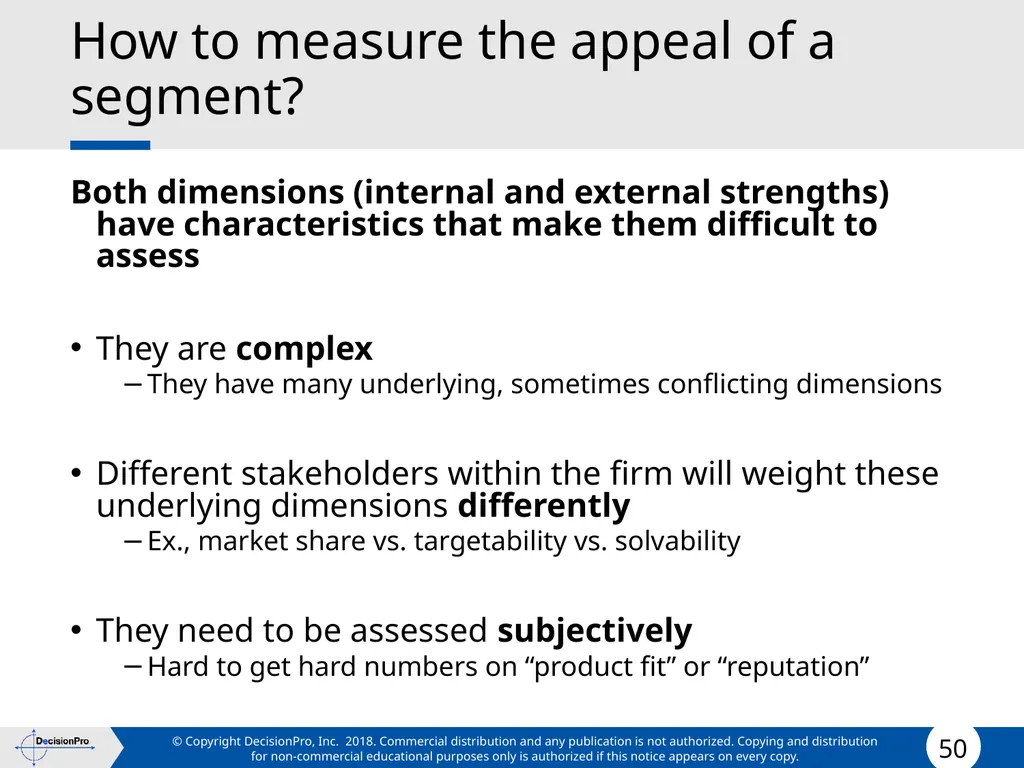
How to measure the appeal of a segment? Both dimensions (internal and external strengths) have characteristics that make them difficult to assess
They are complex
They have many underlying, sometimes conflicting dimensions
Different stakeholders within the firm will weight these underlying dimensions differently
Ex., market share vs. targetability vs. solvability
They need to be assessed subjectively
Hard to get hard numbers on “product fit” or “reputation”<br>
They are complex
They have many underlying, sometimes conflicting dimensions
Different stakeholders within the firm will weight these underlying dimensions differently
Ex., market share vs. targetability vs. solvability
They need to be assessed subjectively
Hard to get hard numbers on “product fit” or “reputation”<br>
51
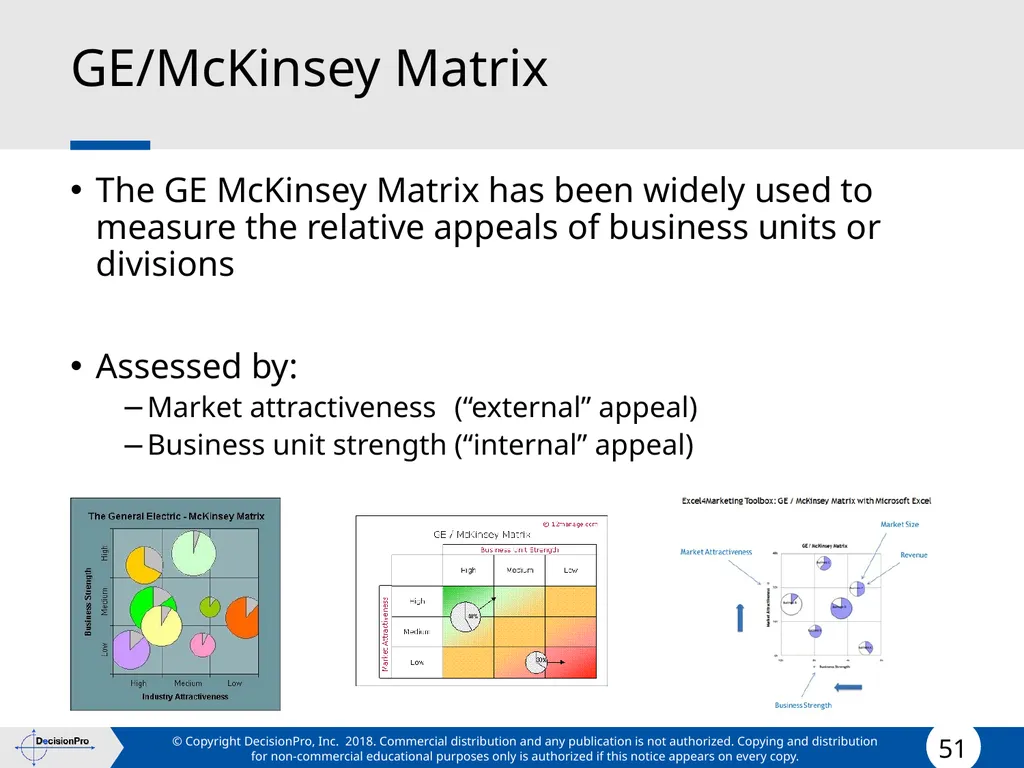
GE/McKinsey Matrix The GE McKinsey Matrix has been widely used to measure the relative appeals of business units or divisions
Assessed by:
Market attractiveness (“external” appeal)
Business unit strength (“internal” appeal)<br>
Assessed by:
Market attractiveness (“external” appeal)
Business unit strength (“internal” appeal)<br>
52
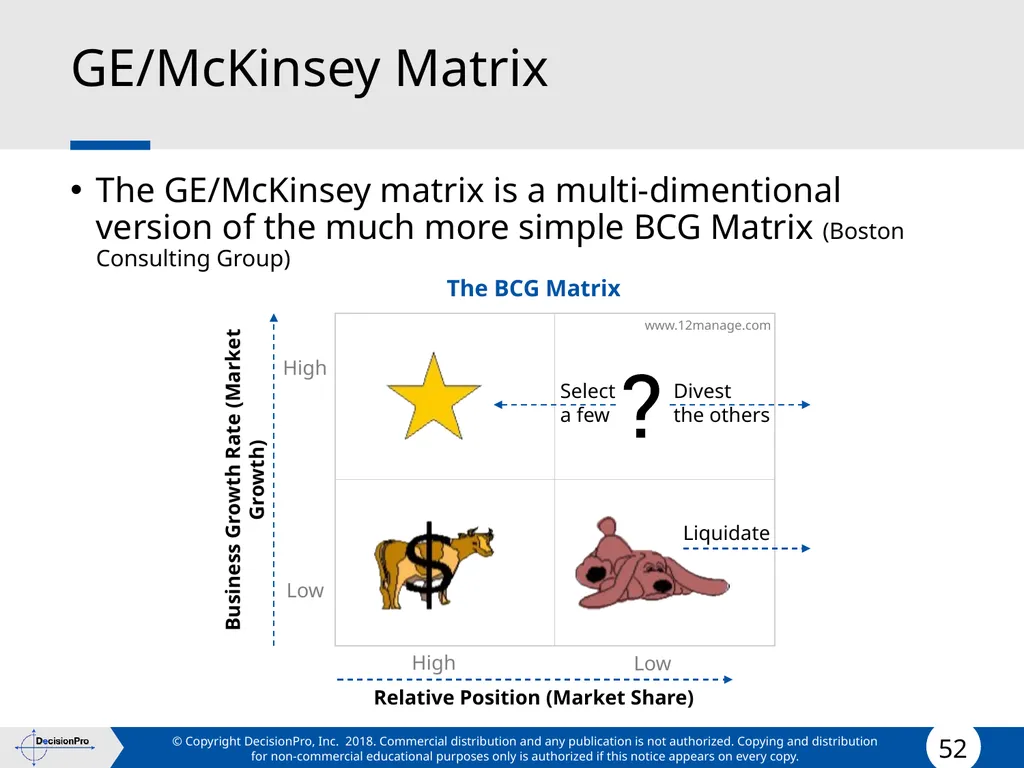
GE/McKinsey Matrix The GE/McKinsey matrix is a multi-dimentional version of the much more simple BCG Matrix (Boston Consulting Group)<br>
53
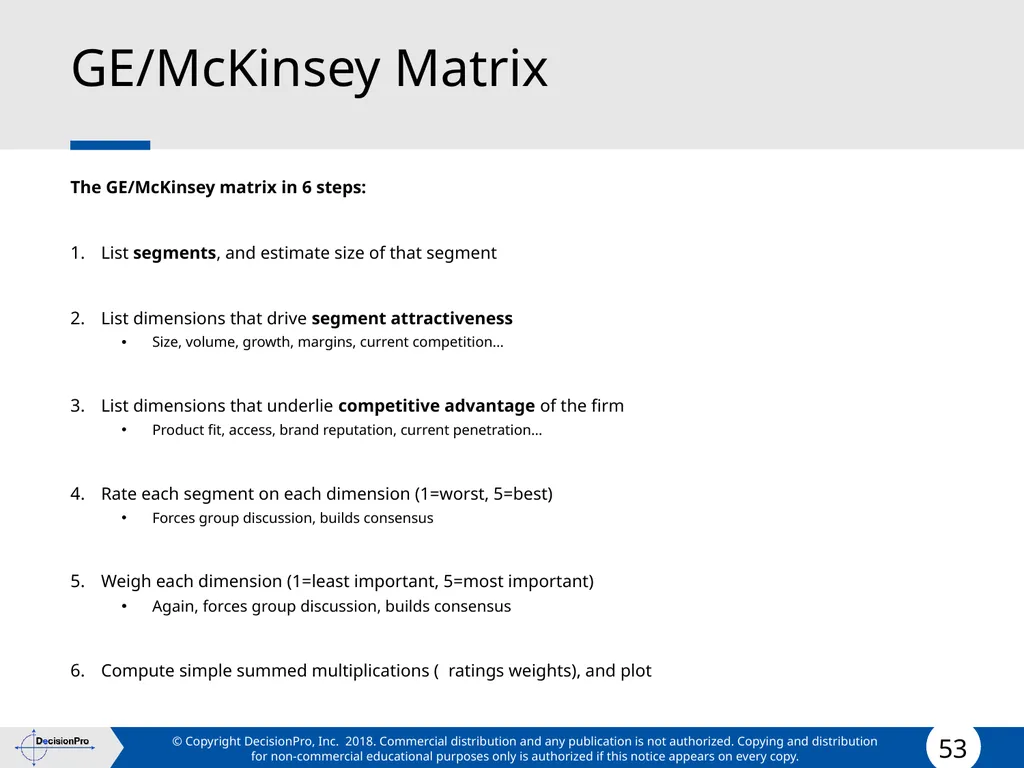
GE/McKinsey Matrix The GE/McKinsey matrix in 6 steps:
List segments, and estimate size of that segment
List dimensions that drive segment attractiveness
Size, volume, growth, margins, current competition…
List dimensions that underlie competitive advantage of the firm
Product fit, access, brand reputation, current penetration…
Rate each segment on each dimension (1=worst, 5=best)
Forces group discussion, builds consensus
Weigh each dimension (1=least important, 5=most important)
Again, forces group discussion, builds consensus
Compute simple summed multiplications ( ratingsweights), and plot<br>
List segments, and estimate size of that segment
List dimensions that drive segment attractiveness
Size, volume, growth, margins, current competition…
List dimensions that underlie competitive advantage of the firm
Product fit, access, brand reputation, current penetration…
Rate each segment on each dimension (1=worst, 5=best)
Forces group discussion, builds consensus
Weigh each dimension (1=least important, 5=most important)
Again, forces group discussion, builds consensus
Compute simple summed multiplications ( ratingsweights), and plot<br>
54
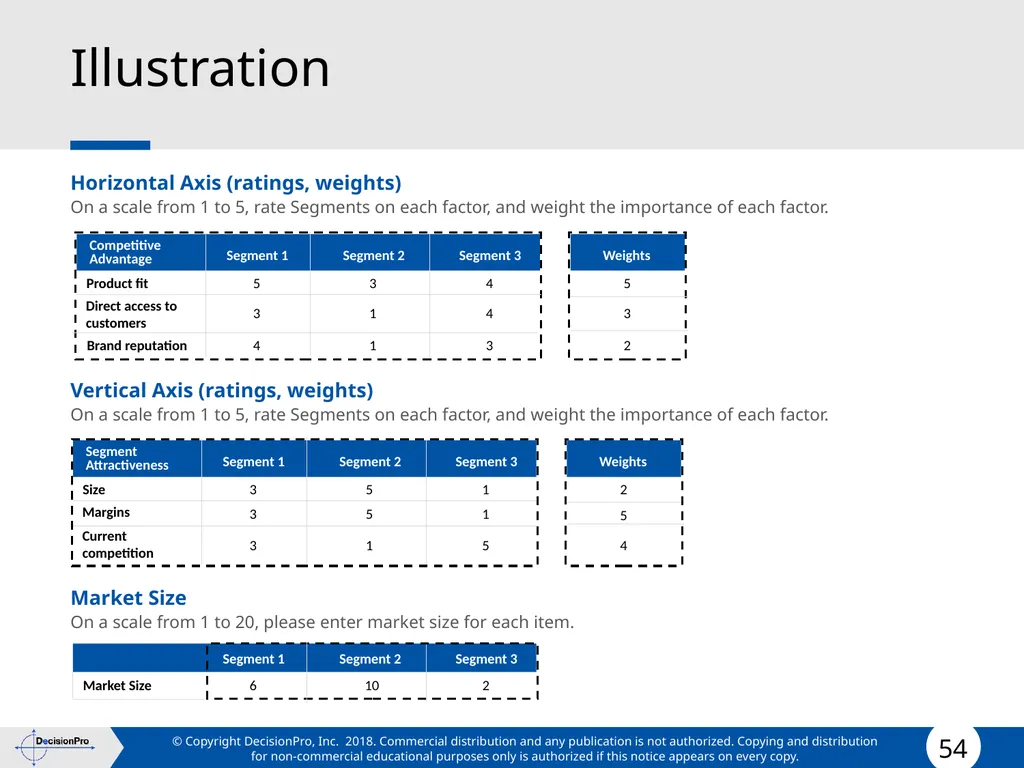
Illustration Horizontal Axis (ratings, weights)
On a scale from 1 to 5, rate Segments on each factor, and weight the importance of each factor.
Vertical Axis (ratings, weights)
On a scale from 1 to 5, rate Segments on each factor, and weight the importance of each factor.
Market Size
On a scale from 1 to 20, please enter market size for each item.<br>
On a scale from 1 to 5, rate Segments on each factor, and weight the importance of each factor.
Vertical Axis (ratings, weights)
On a scale from 1 to 5, rate Segments on each factor, and weight the importance of each factor.
Market Size
On a scale from 1 to 20, please enter market size for each item.<br>
55
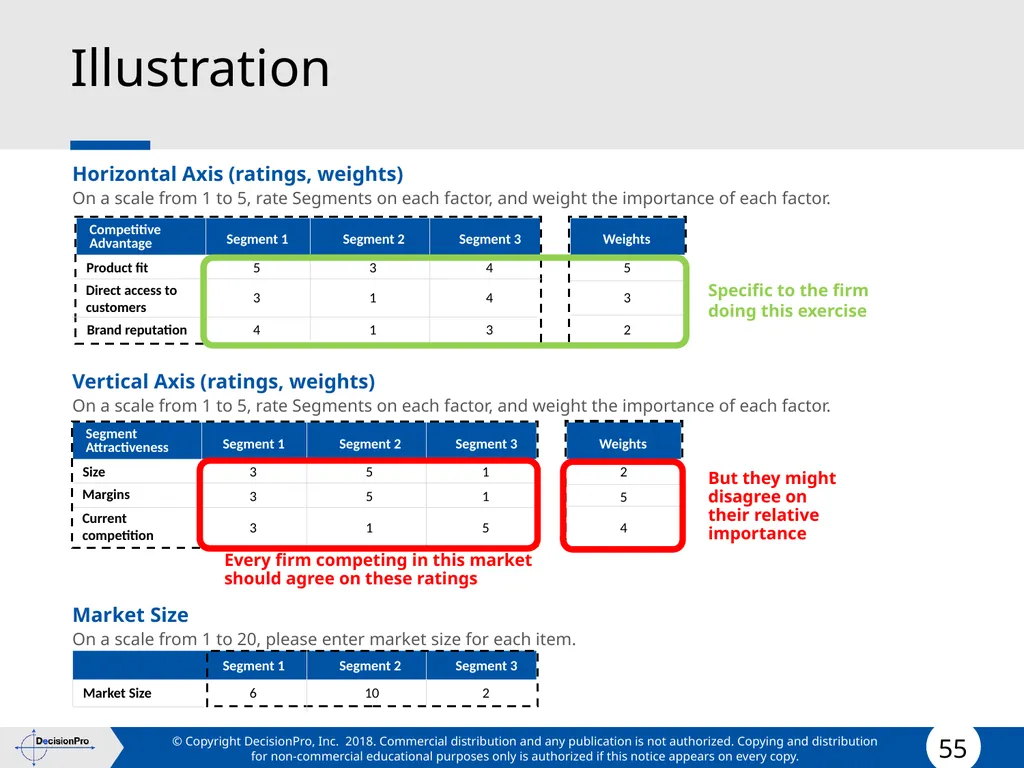
Illustration Horizontal Axis (ratings, weights)
On a scale from 1 to 5, rate Segments on each factor, and weight the importance of each factor.
Vertical Axis (ratings, weights)
On a scale from 1 to 5, rate Segments on each factor, and weight the importance of each factor.
Market Size
On a scale from 1 to 20, please enter market size for each item. Specific to the firm doing this exercise Every firm competing in this market should agree on these ratings But they might disagree on their relative importance<br>
On a scale from 1 to 5, rate Segments on each factor, and weight the importance of each factor.
Vertical Axis (ratings, weights)
On a scale from 1 to 5, rate Segments on each factor, and weight the importance of each factor.
Market Size
On a scale from 1 to 20, please enter market size for each item. Specific to the firm doing this exercise Every firm competing in this market should agree on these ratings But they might disagree on their relative importance<br>
56
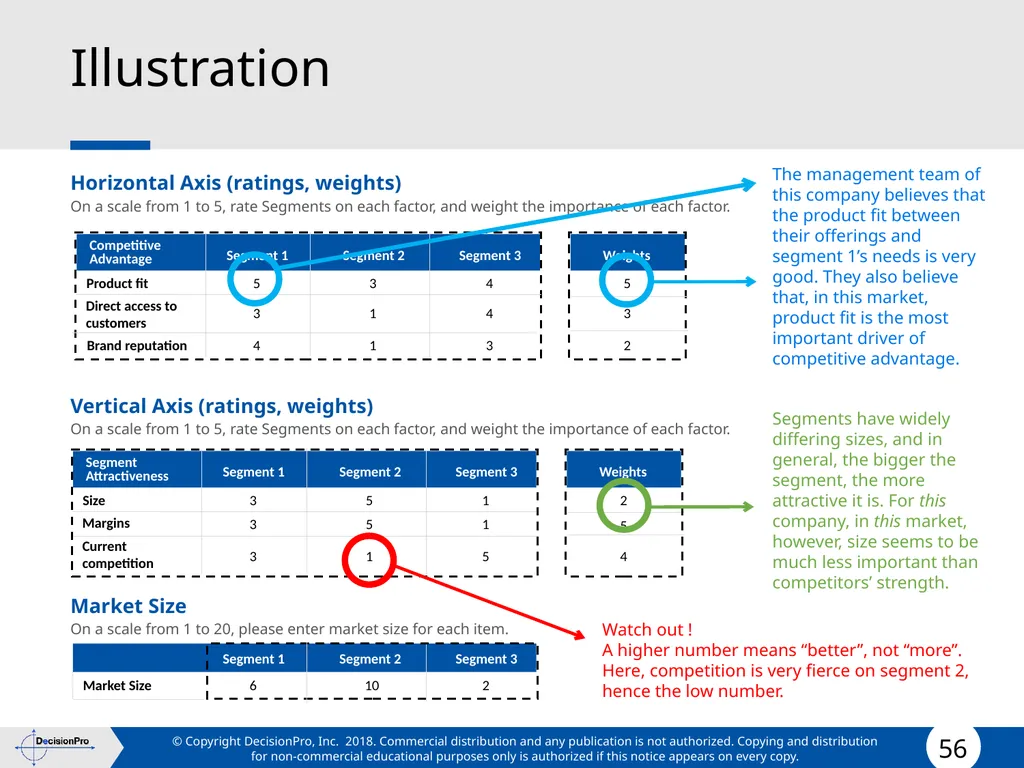
Illustration Horizontal Axis (ratings, weights)
On a scale from 1 to 5, rate Segments on each factor, and weight the importance of each factor.
Vertical Axis (ratings, weights)
On a scale from 1 to 5, rate Segments on each factor, and weight the importance of each factor.
Market Size
On a scale from 1 to 20, please enter market size for each item. The management team of this company believes that the product fit between their offerings and segment 1’s needs is very good. They also believe that, in this market, product fit is the most important driver of competitive advantage. Segments have widely differing sizes, and in general, the bigger the segment, the more attractive it is. For this company, in this market, however, size seems to be much less important than competitors’ strength. Watch out !
A higher number means “better”, not “more”. Here, competition is very fierce on segment 2, hence the low number.<br>
On a scale from 1 to 5, rate Segments on each factor, and weight the importance of each factor.
Vertical Axis (ratings, weights)
On a scale from 1 to 5, rate Segments on each factor, and weight the importance of each factor.
Market Size
On a scale from 1 to 20, please enter market size for each item. The management team of this company believes that the product fit between their offerings and segment 1’s needs is very good. They also believe that, in this market, product fit is the most important driver of competitive advantage. Segments have widely differing sizes, and in general, the bigger the segment, the more attractive it is. For this company, in this market, however, size seems to be much less important than competitors’ strength. Watch out !
A higher number means “better”, not “more”. Here, competition is very fierce on segment 2, hence the low number.<br>
57
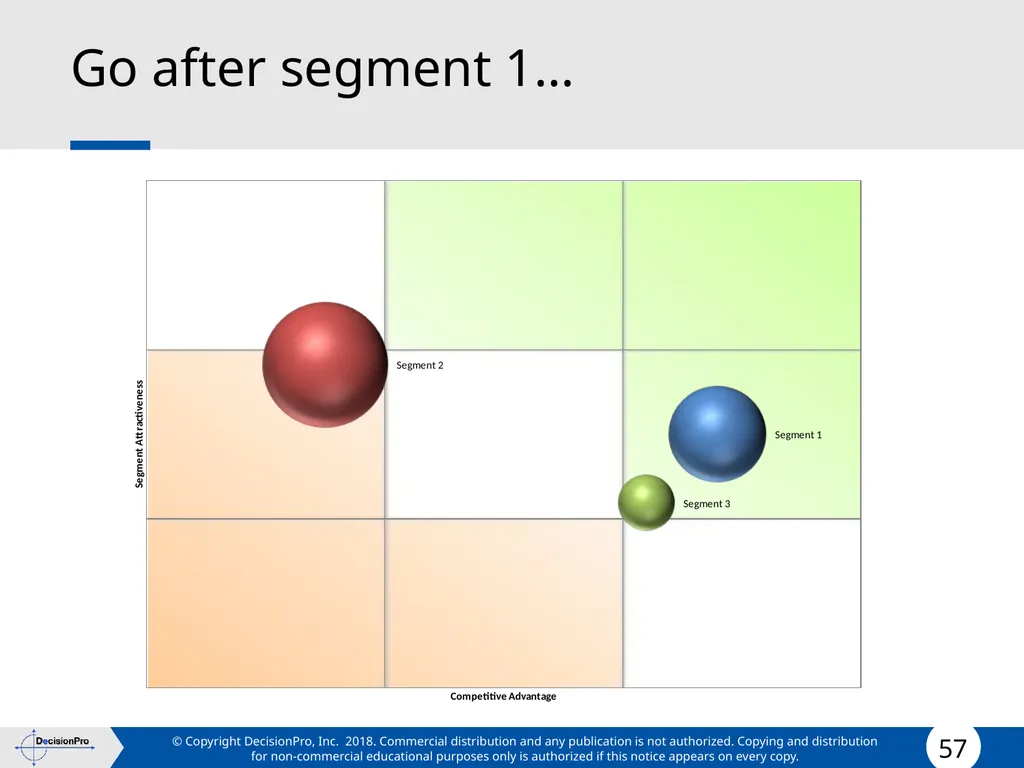
Go after segment 1…<br>
58
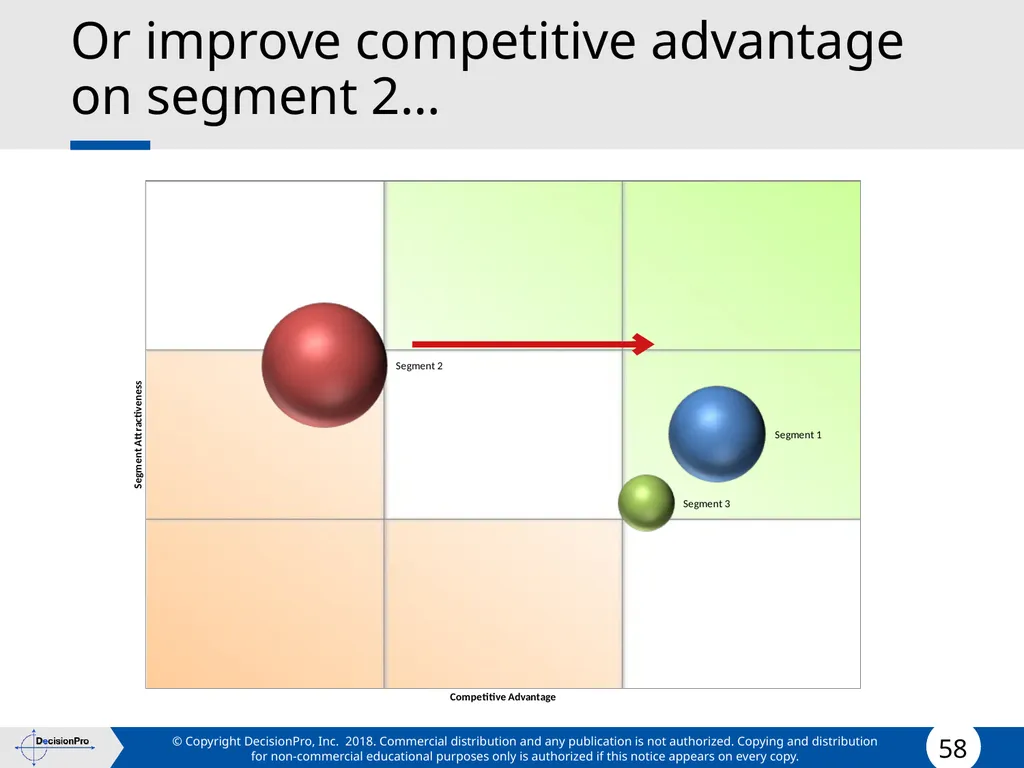
Or improve competitive advantage on segment 2…<br>
59
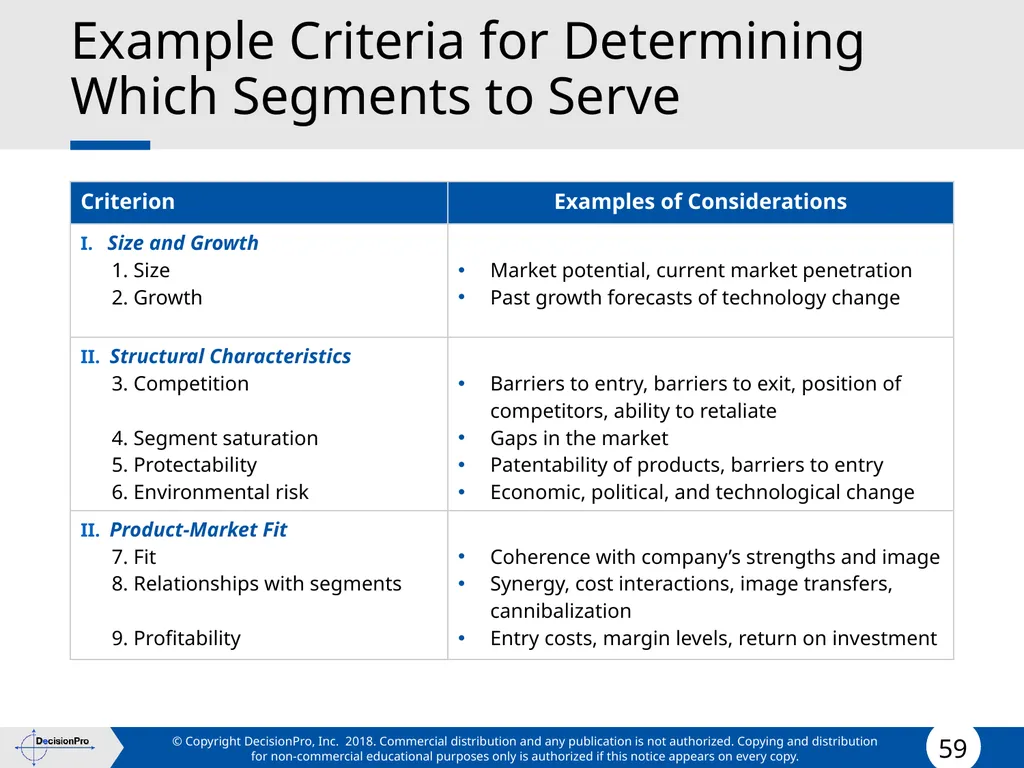
Example Criteria for Determining Which Segments to Serve<br>
60
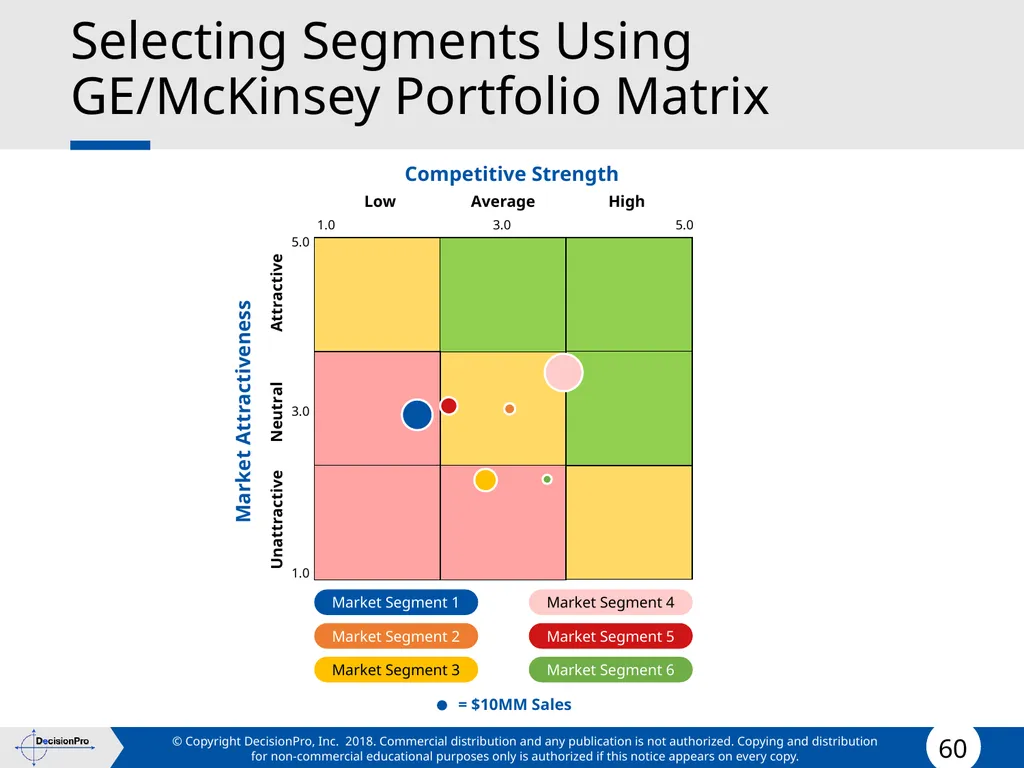
Selecting Segments Using GE/McKinsey Portfolio Matrix Competitive Strength Market Attractiveness 1.0 3.0 5.0 1.0 3.0 5.0 Low Average High Unattractive Neutral Attractive Market Segment 1 Market Segment 2 Market Segment 3 Market Segment 4 Market Segment 5 Market Segment 6 = $10MM Sales<br>
61
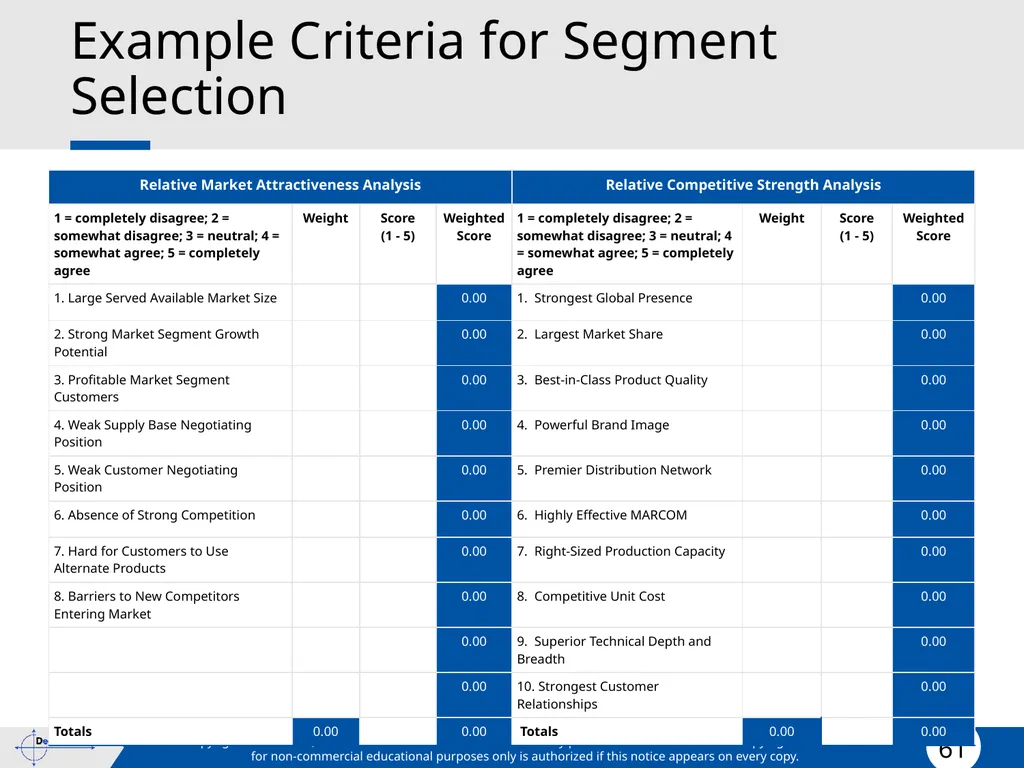
Example Criteria for Segment Selection<br>
62
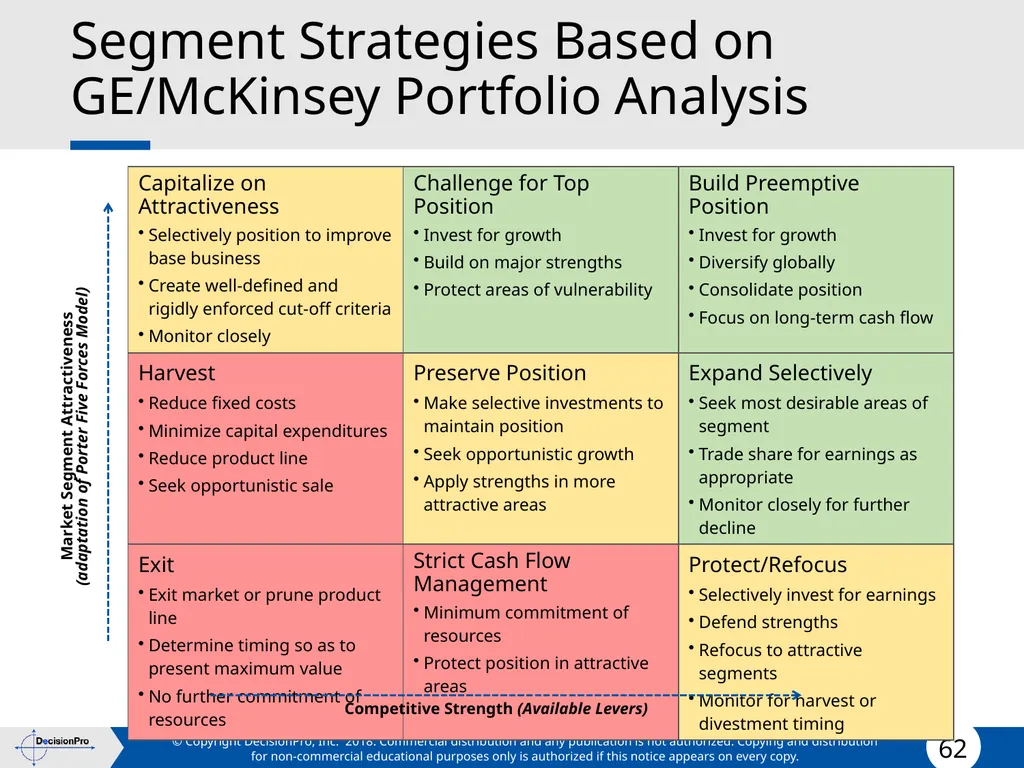
Segment Strategies Based on GE/McKinsey Portfolio Analysis Market Segment Attractiveness
(adaptation of Porter Five Forces Model) Competitive Strength (Available Levers)<br>
(adaptation of Porter Five Forces Model) Competitive Strength (Available Levers)<br>
63
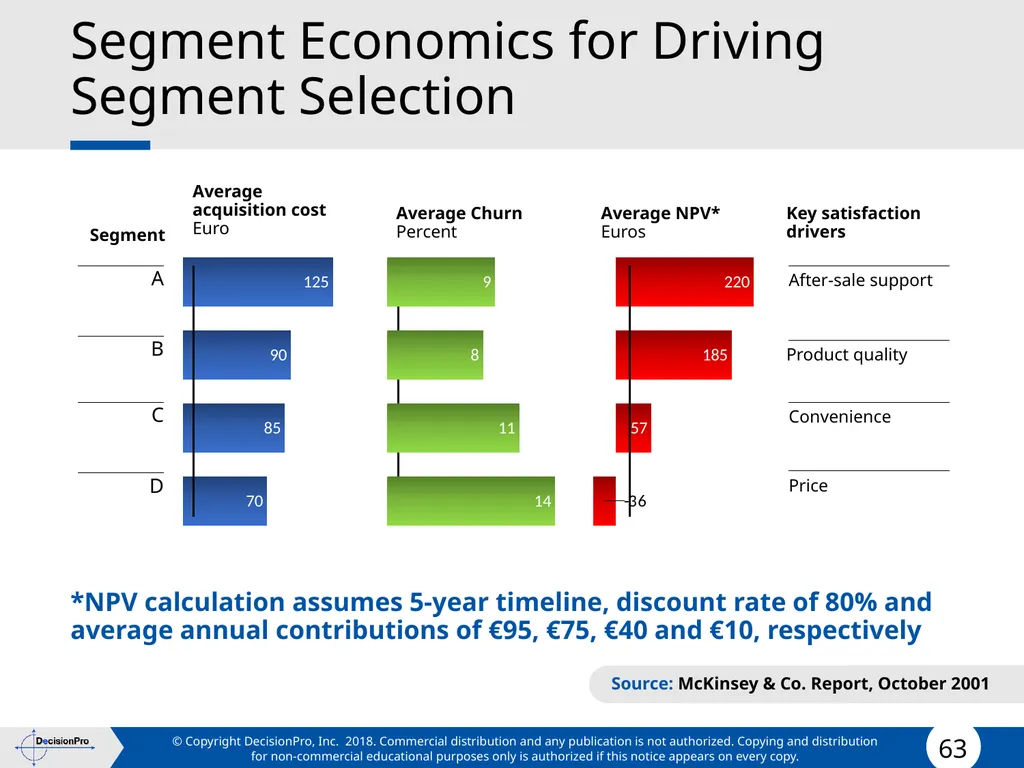
Segment Economics for Driving Segment Selection *NPV calculation assumes 5-year timeline, discount rate of 80% and average annual contributions of €95, €75, €40 and €10, respectively Source: McKinsey & Co. Report, October 2001 Segment Average acquisition cost
Euro Average Churn
Percent Average NPV*
Euros Key satisfaction drivers A B C D After-sale support Product quality Convenience Price<br>
Euro Average Churn
Percent Average NPV*
Euros Key satisfaction drivers A B C D After-sale support Product quality Convenience Price<br>
64
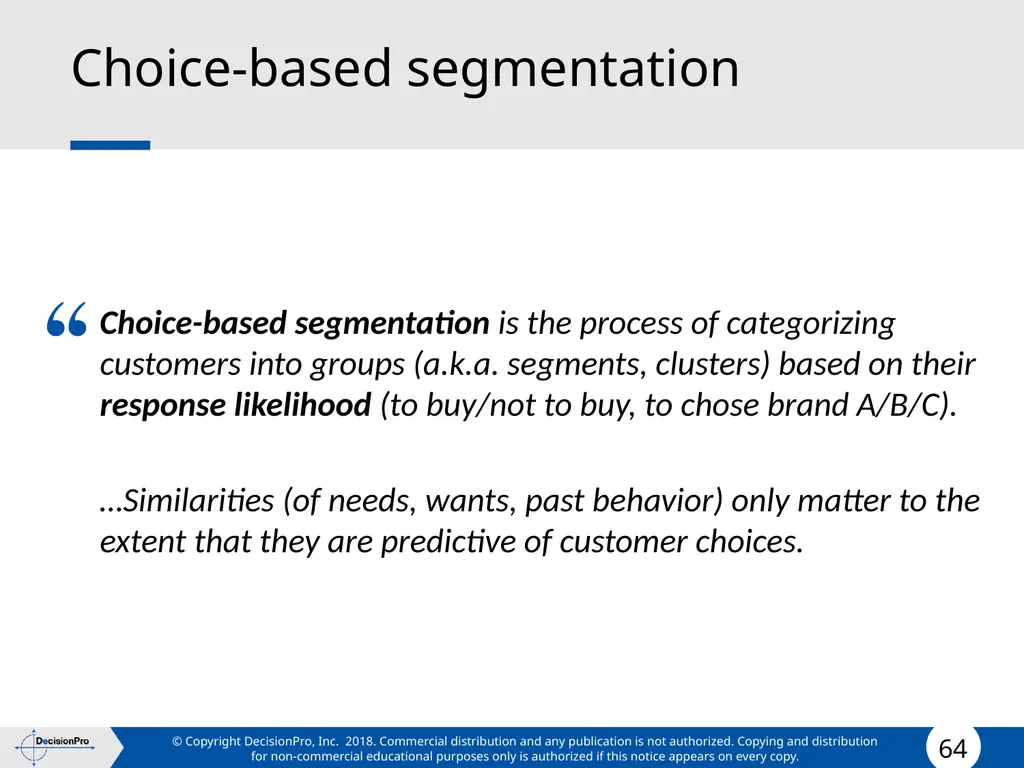
Choice-based segmentation Choice-based segmentation is the process of categorizing customers into groups (a.k.a. segments, clusters) based on their response likelihood (to buy/not to buy, to chose brand A/B/C).
…Similarities (of needs, wants, past behavior) only matter to the extent that they are predictive of customer choices.<br>
…Similarities (of needs, wants, past behavior) only matter to the extent that they are predictive of customer choices.<br>
65
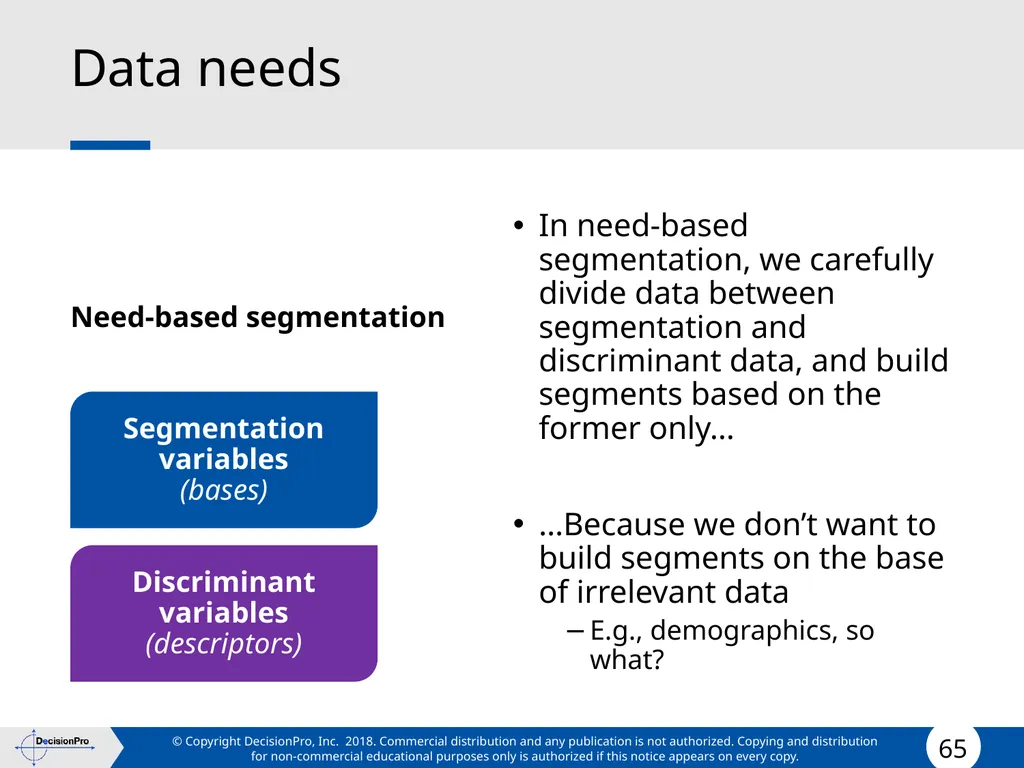
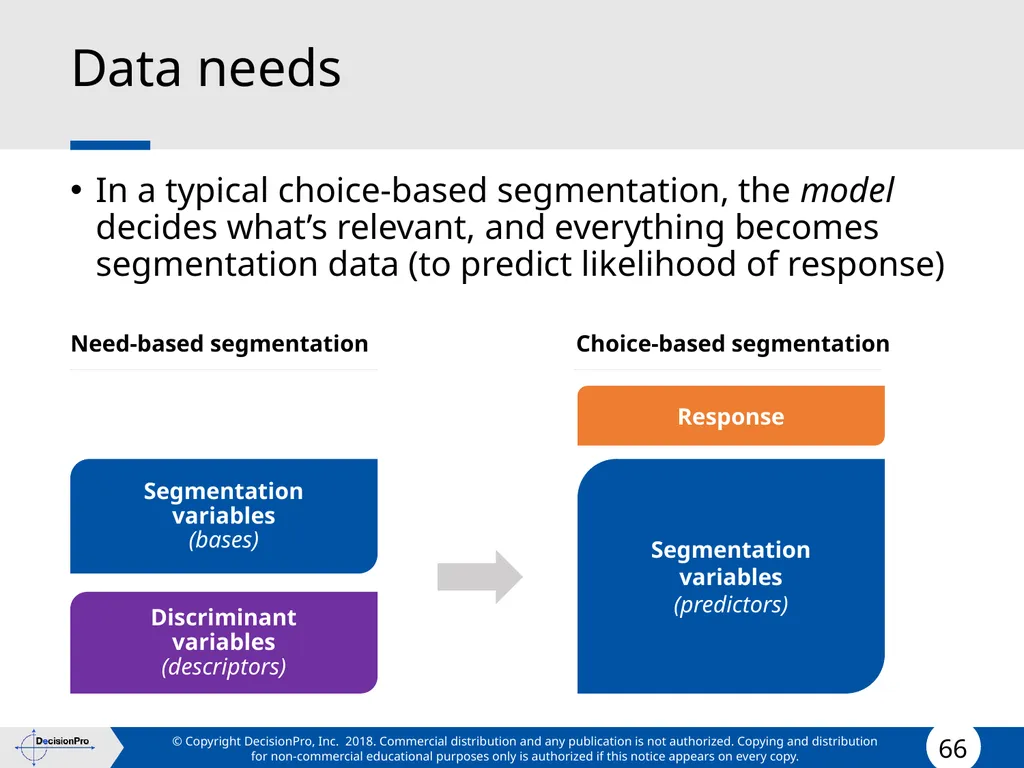
Data needs Need-based segmentation In need-based segmentation, we carefully divide data between segmentation and discriminant data, and build segments based on the former only…
…Because we don’t want to build segments on the base of irrelevant data
E.g., demographics, so what? Segmentation variables
(bases) Discriminant variables
(descriptors)<br>
…Because we don’t want to build segments on the base of irrelevant data
E.g., demographics, so what? Segmentation variables
(bases) Discriminant variables
(descriptors)<br>
66
Data needs In a typical choice-based segmentation, the model decides what’s relevant, and everything becomes segmentation data (to predict likelihood of response) Need-based segmentation Segmentation
variables
(bases) Discriminant variables
(descriptors) Choice-based segmentation Segmentation variables
(predictors) Response<br>
(bases) Discriminant variables
(descriptors) Choice-based segmentation Segmentation variables
(predictors) Response<br>
67
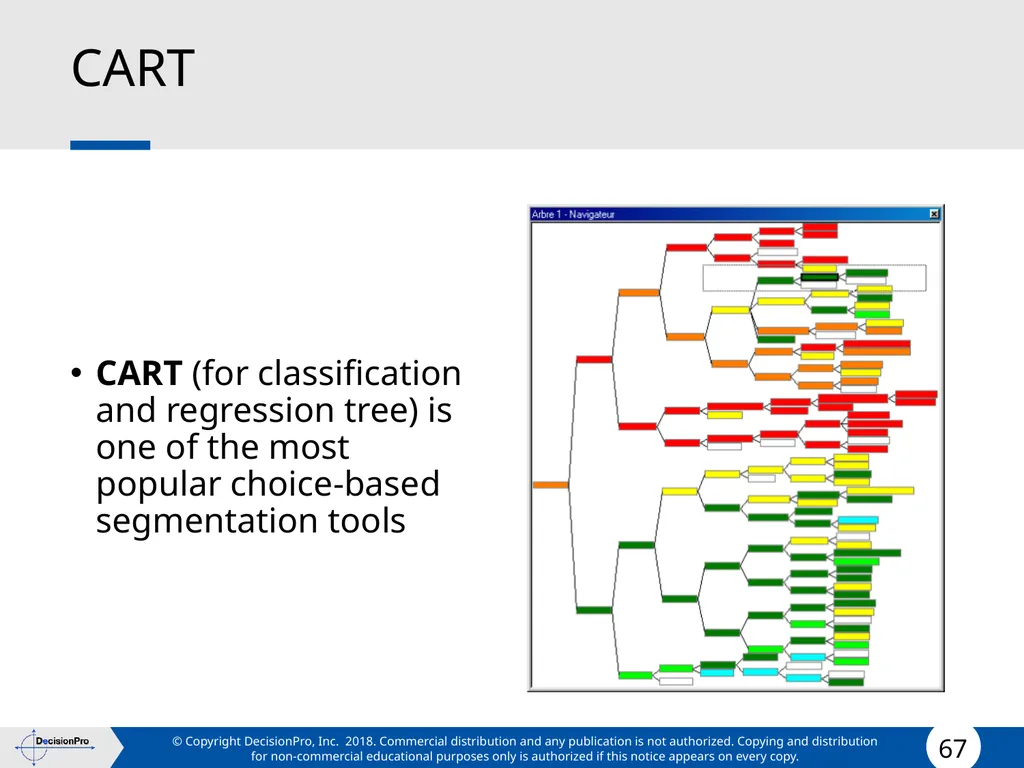
CART CART (for classification and regression tree) is one of the most popular choice-based segmentation tools<br>
68
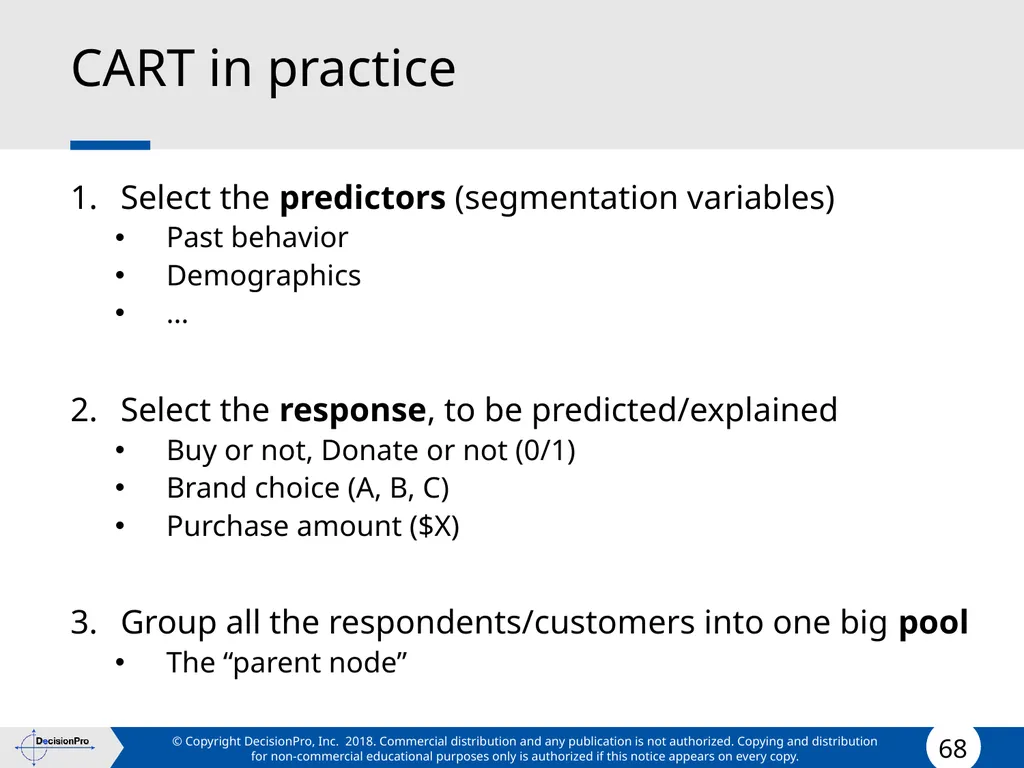
CART in practice 1. Select the predictors (segmentation variables)
Past behavior
Demographics
…
2. Select the response, to be predicted/explained
Buy or not, Donate or not (0/1)
Brand choice (A, B, C)
Purchase amount ($X)
3. Group all the respondents/customers into one big pool
The “parent node”<br>
Past behavior
Demographics
…
2. Select the response, to be predicted/explained
Buy or not, Donate or not (0/1)
Brand choice (A, B, C)
Purchase amount ($X)
3. Group all the respondents/customers into one big pool
The “parent node”<br>
69
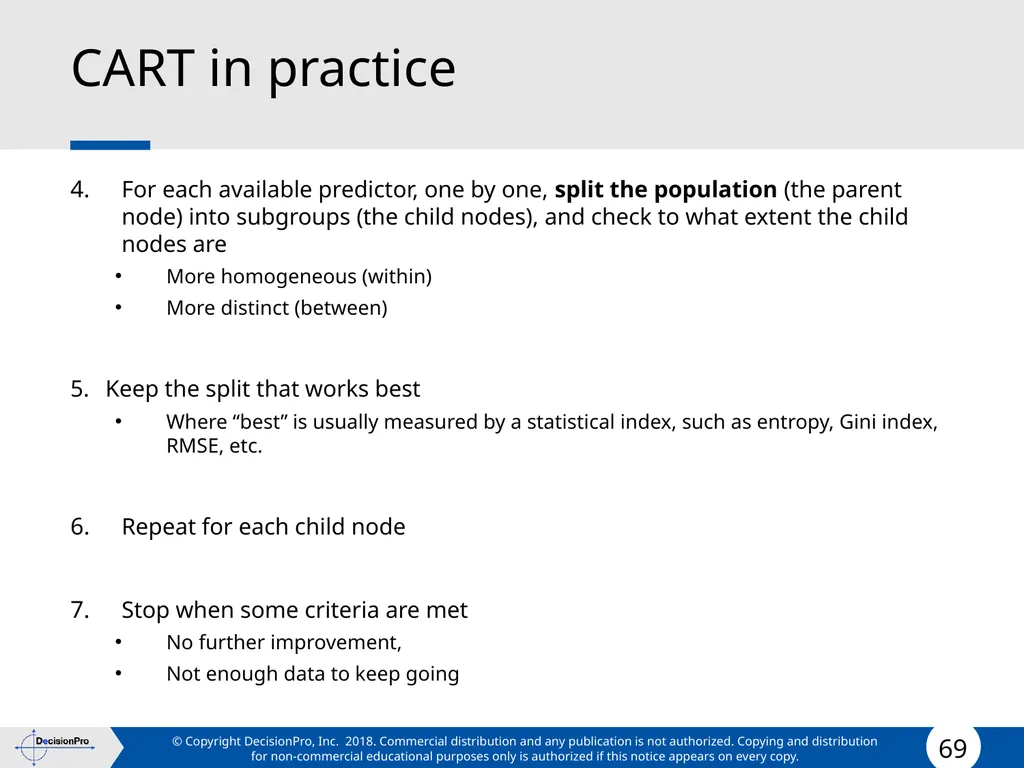
CART in practice For each available predictor, one by one, split the population (the parent node) into subgroups (the child nodes), and check to what extent the child nodes are
More homogeneous (within)
More distinct (between)
5. Keep the split that works best
Where “best” is usually measured by a statistical index, such as entropy, Gini index, RMSE, etc.
Repeat for each child node
Stop when some criteria are met
No further improvement,
Not enough data to keep going<br>
More homogeneous (within)
More distinct (between)
5. Keep the split that works best
Where “best” is usually measured by a statistical index, such as entropy, Gini index, RMSE, etc.
Repeat for each child node
Stop when some criteria are met
No further improvement,
Not enough data to keep going<br>
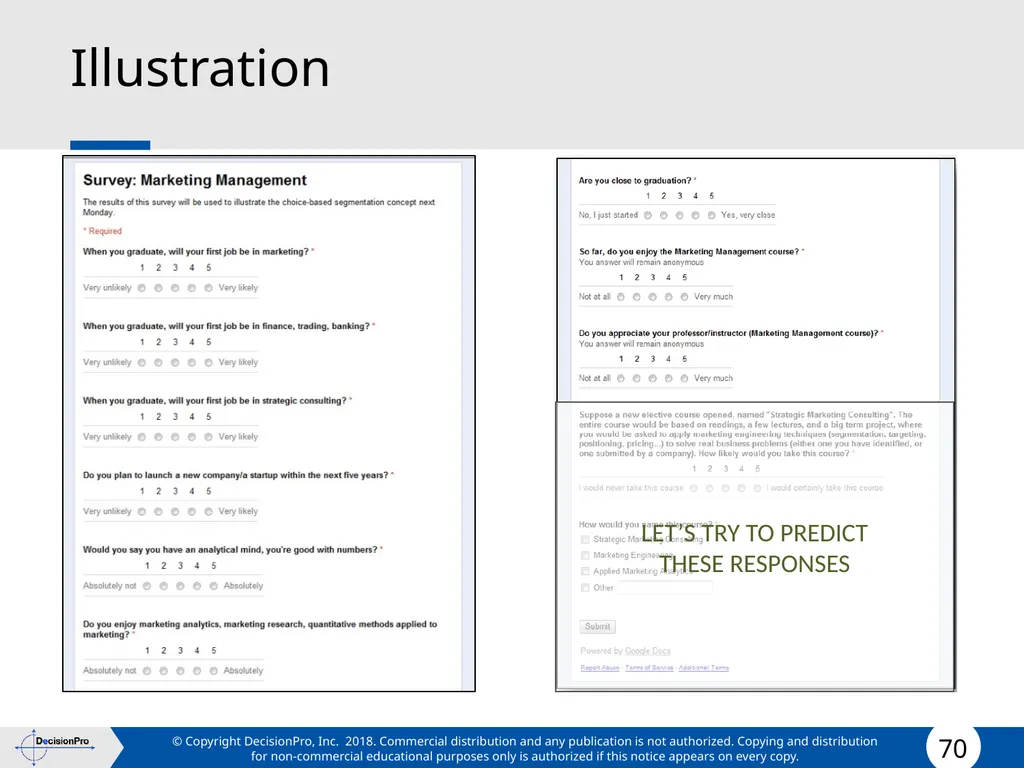
70
Illustration LET’S TRY TO PREDICT
THESE RESPONSES<br>
THESE RESPONSES<br>
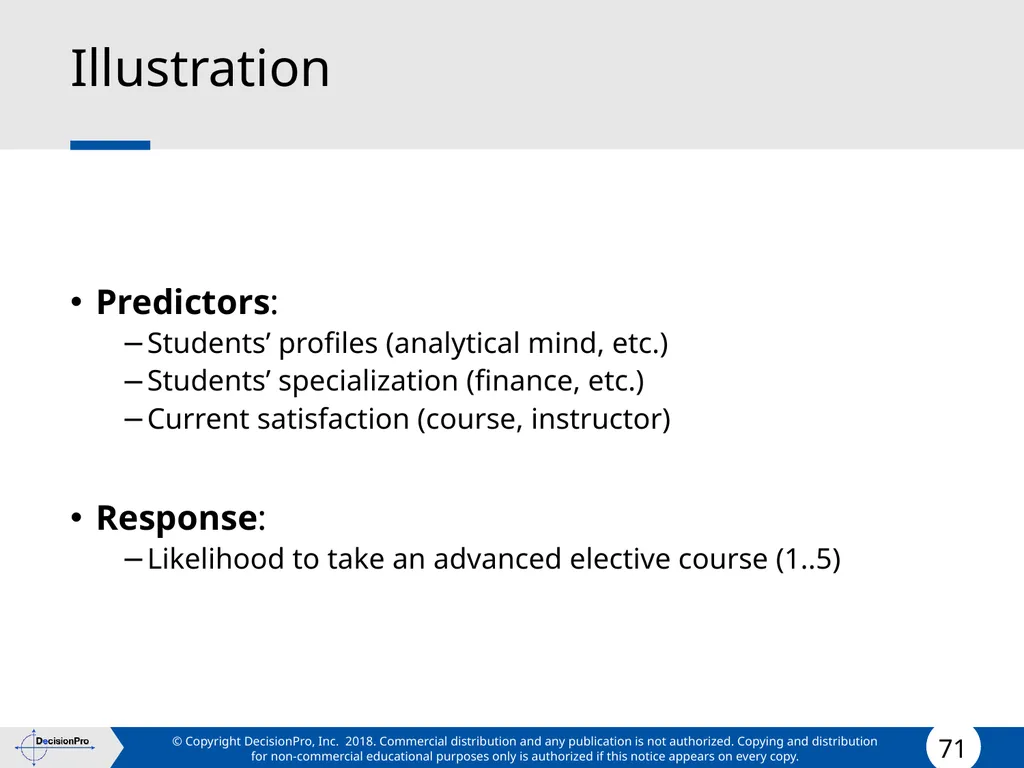
71
Illustration Predictors:
Students’ profiles (analytical mind, etc.)
Students’ specialization (finance, etc.)
Current satisfaction (course, instructor)
Response:
Likelihood to take an advanced elective course (1..5)<br>
Students’ profiles (analytical mind, etc.)
Students’ specialization (finance, etc.)
Current satisfaction (course, instructor)
Response:
Likelihood to take an advanced elective course (1..5)<br>
72
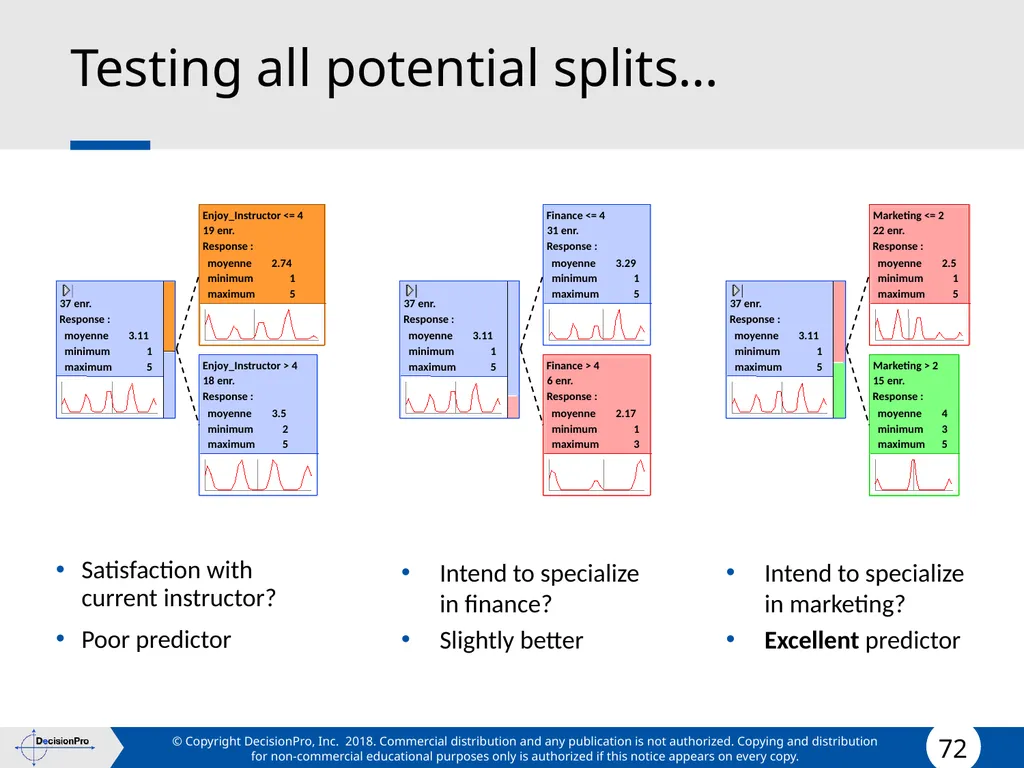
Testing all potential splits… Enjoy_Instructor <= 4 19 enr. Response : moyenne 2.74 minimum 1 maximum 5 Enjoy_Instructor > 4 18 enr. Response : moyenne 3.5 minimum 2 maximum 5 37 enr. Response : moyenne 3.11 minimum 1 maximum 5 Finance <= 4 31 enr. Response : moyenne 3.29 minimum 1 maximum 5 Finance > 4 6 enr. Response : moyenne 2.17 minimum 1 maximum 3 37 enr. Response : moyenne 3.11 minimum 1 maximum 5 Marketing <= 2 22 enr. Response : moyenne 2.5 minimum 1 maximum 5 Marketing > 2 15 enr. Response : moyenne 4 minimum 3 maximum 5 37 enr. Response : moyenne 3.11 minimum 1 maximum 5 Satisfaction with current instructor?
Poor predictor Intend to specialize in finance?
Slightly better Intend to specialize in marketing?
Excellent predictor<br>
Poor predictor Intend to specialize in finance?
Slightly better Intend to specialize in marketing?
Excellent predictor<br>
73
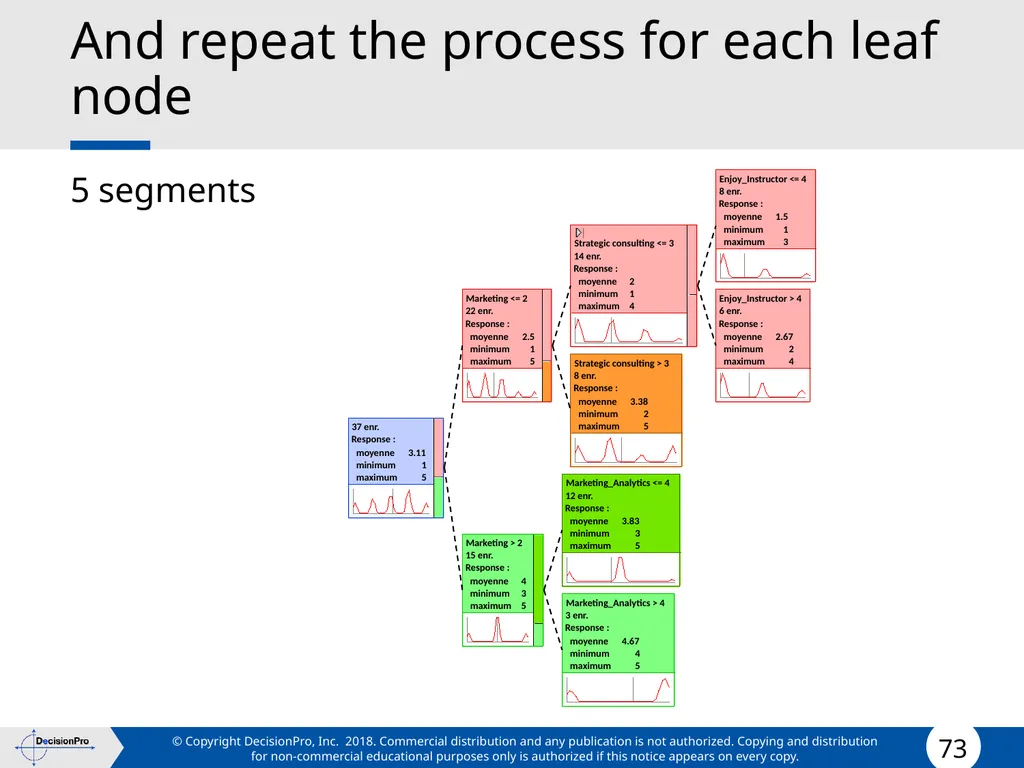
And repeat the process for each leaf node 5 segments Enjoy_Instructor <= 4 8 enr. Response : moyenne 1.5 minimum 1 maximum 3 Enjoy_Instructor > 4 6 enr. Response : moyenne 2.67 minimum 2 maximum 4 Strategic consulting <= 3 14 enr. Response : moyenne 2 minimum 1 maximum 4 Strategic consulting > 3 8 enr. Response : moyenne 3.38 minimum 2 maximum 5 Marketing <= 2 22 enr. Response : moyenne 2.5 minimum 1 maximum 5 Marketing_Analytics <= 4 12 enr. Response : moyenne 3.83 minimum 3 maximum 5 Marketing_Analytics > 4 3 enr. Response : moyenne 4.67 minimum 4 maximum 5 Marketing > 2 15 enr. Response : moyenne 4 minimum 3 maximum 5 37 enr. Response : moyenne 3.11 minimum 1 maximum 5<br>
74
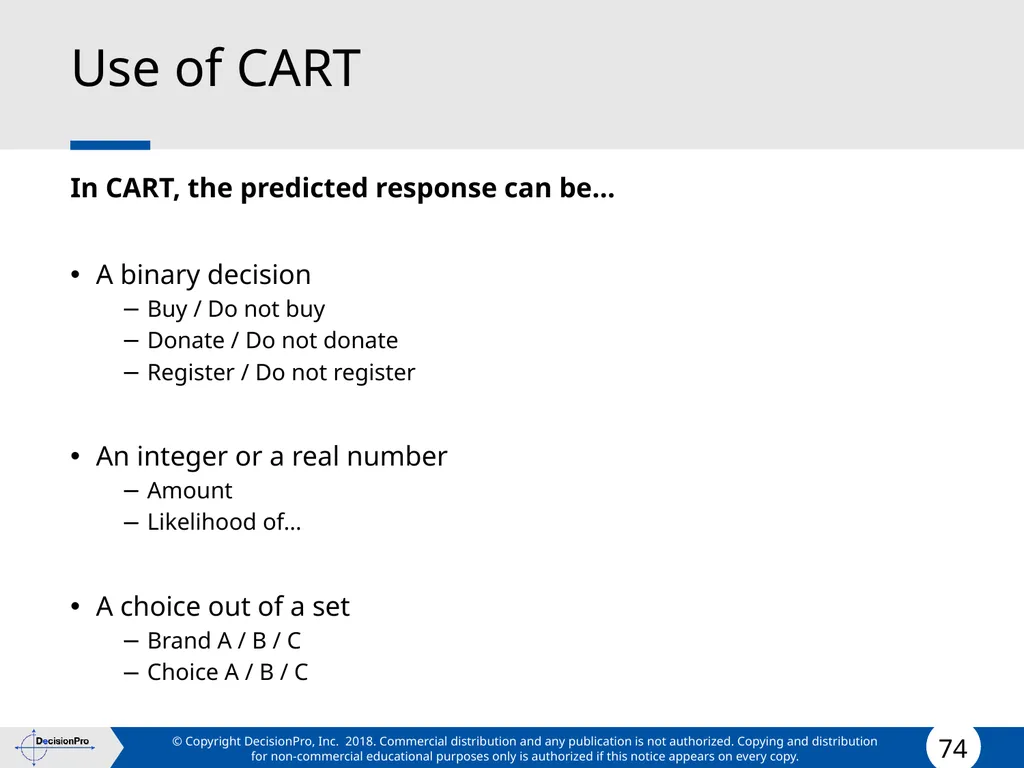
Use of CART In CART, the predicted response can be…
A binary decision
Buy / Do not buy
Donate / Do not donate
Register / Do not register
An integer or a real number
Amount
Likelihood of…
A choice out of a set
Brand A / B / C
Choice A / B / C<br>
A binary decision
Buy / Do not buy
Donate / Do not donate
Register / Do not register
An integer or a real number
Amount
Likelihood of…
A choice out of a set
Brand A / B / C
Choice A / B / C<br>
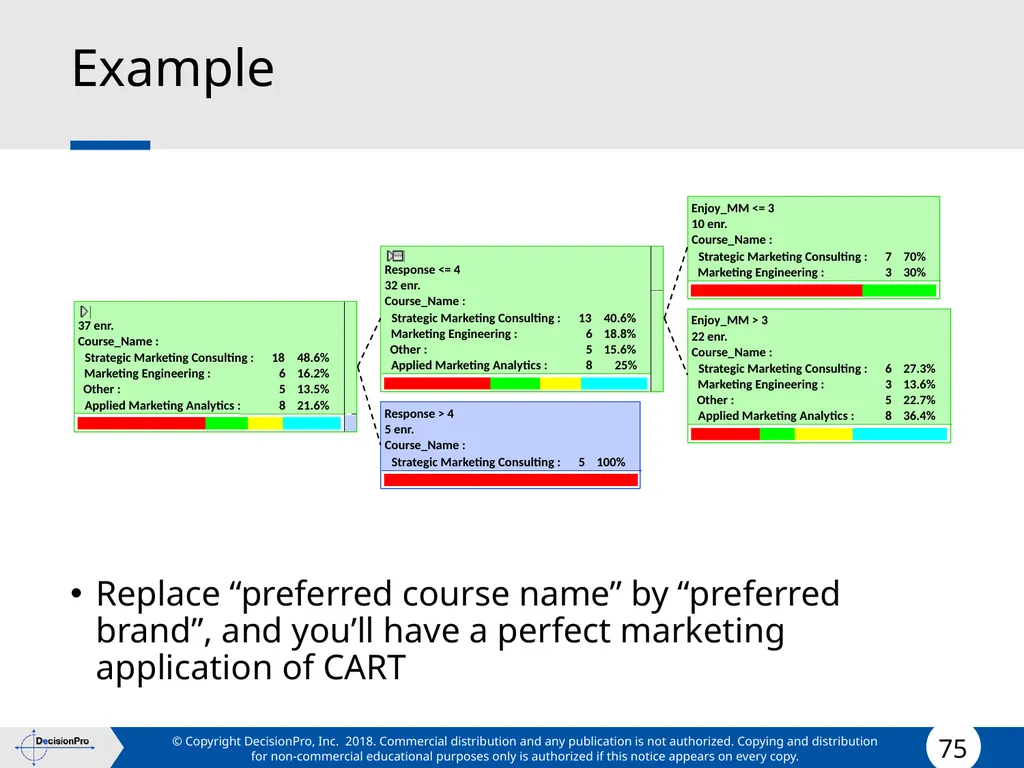
75
Example Replace “preferred course name” by “preferred brand”, and you’ll have a perfect marketing application of CART Enjoy_MM <= 3 10 enr. Course_Name : Strategic Marketing Consulting : 7 70% Marketing Engineering : 3 30% Enjoy_MM > 3 22 enr. Course_Name : Strategic Marketing Consulting : 6 27.3% Marketing Engineering : 3 13.6% Other : 5 22.7% Applied Marketing Analytics : 8 36.4% Response <= 4 32 enr. Course_Name : Strategic Marketing Consulting : 13 40.6% Marketing Engineering : 6 18.8% Other : 5 15.6% Applied Marketing Analytics : 8 25% Response > 4 5 enr. Course_Name : Strategic Marketing Consulting : 5 100% 37 enr. Course_Name : Strategic Marketing Consulting : 18 48.6% Marketing Engineering : 6 16.2% Other : 5 13.5% Applied Marketing Analytics : 8 21.6%<br>
76
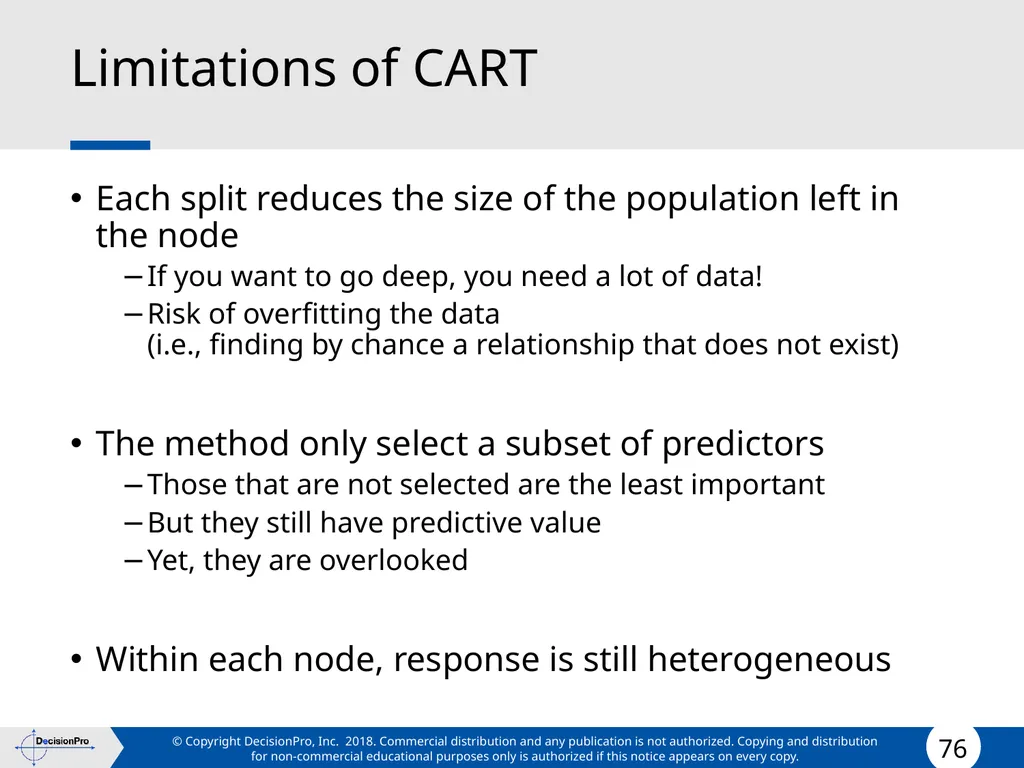
Limitations of CART Each split reduces the size of the population left in the node
If you want to go deep, you need a lot of data!
Risk of overfitting the data (i.e., finding by chance a relationship that does not exist)
The method only select a subset of predictors
Those that are not selected are the least important
But they still have predictive value
Yet, they are overlooked
Within each node, response is still heterogeneous<br>
If you want to go deep, you need a lot of data!
Risk of overfitting the data (i.e., finding by chance a relationship that does not exist)
The method only select a subset of predictors
Those that are not selected are the least important
But they still have predictive value
Yet, they are overlooked
Within each node, response is still heterogeneous<br>
77
Choice models, scoring, and score classes<br>
78
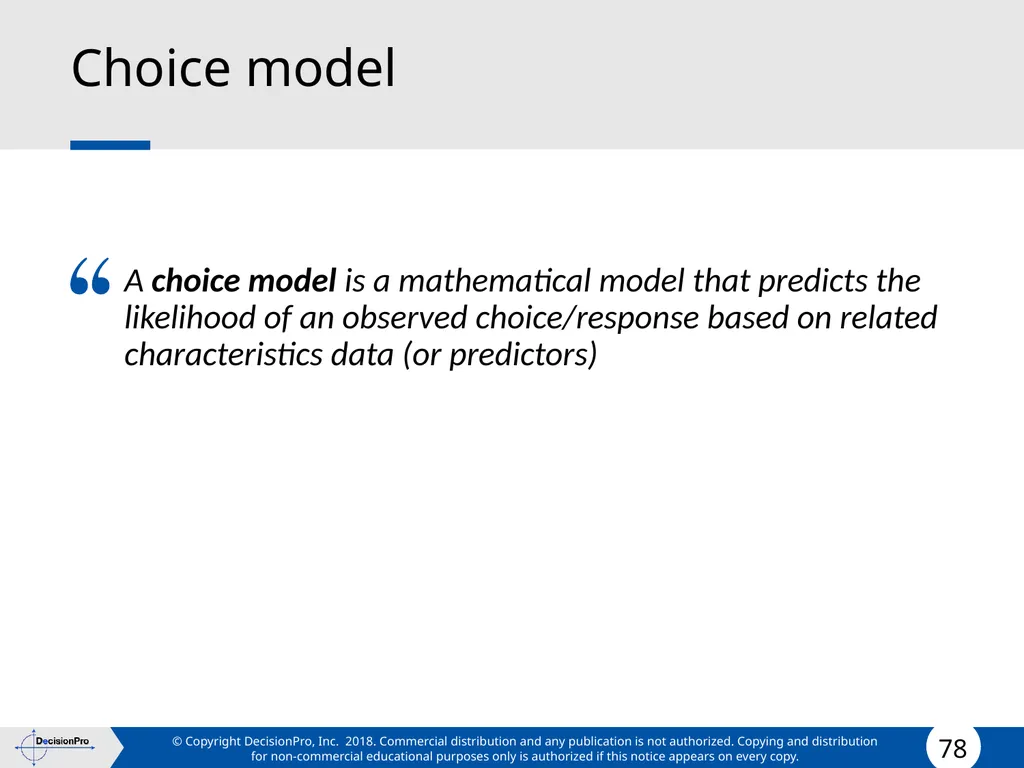
Choice model A choice model is a mathematical model that predicts the likelihood of an observed choice/response based on related characteristics data (or predictors)<br>
79
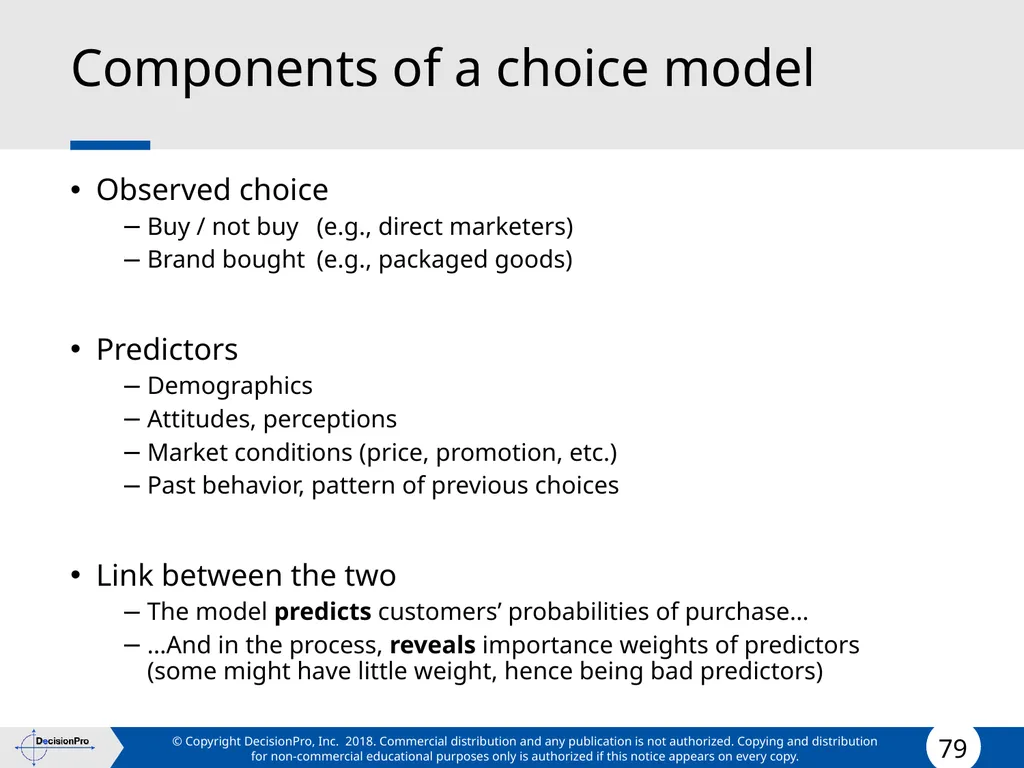
Components of a choice model Observed choice
Buy / not buy (e.g., direct marketers)
Brand bought (e.g., packaged goods)
Predictors
Demographics
Attitudes, perceptions
Market conditions (price, promotion, etc.)
Past behavior, pattern of previous choices
Link between the two
The model predicts customers’ probabilities of purchase…
…And in the process, reveals importance weights of predictors (some might have little weight, hence being bad predictors)<br>
Buy / not buy (e.g., direct marketers)
Brand bought (e.g., packaged goods)
Predictors
Demographics
Attitudes, perceptions
Market conditions (price, promotion, etc.)
Past behavior, pattern of previous choices
Link between the two
The model predicts customers’ probabilities of purchase…
…And in the process, reveals importance weights of predictors (some might have little weight, hence being bad predictors)<br>
80
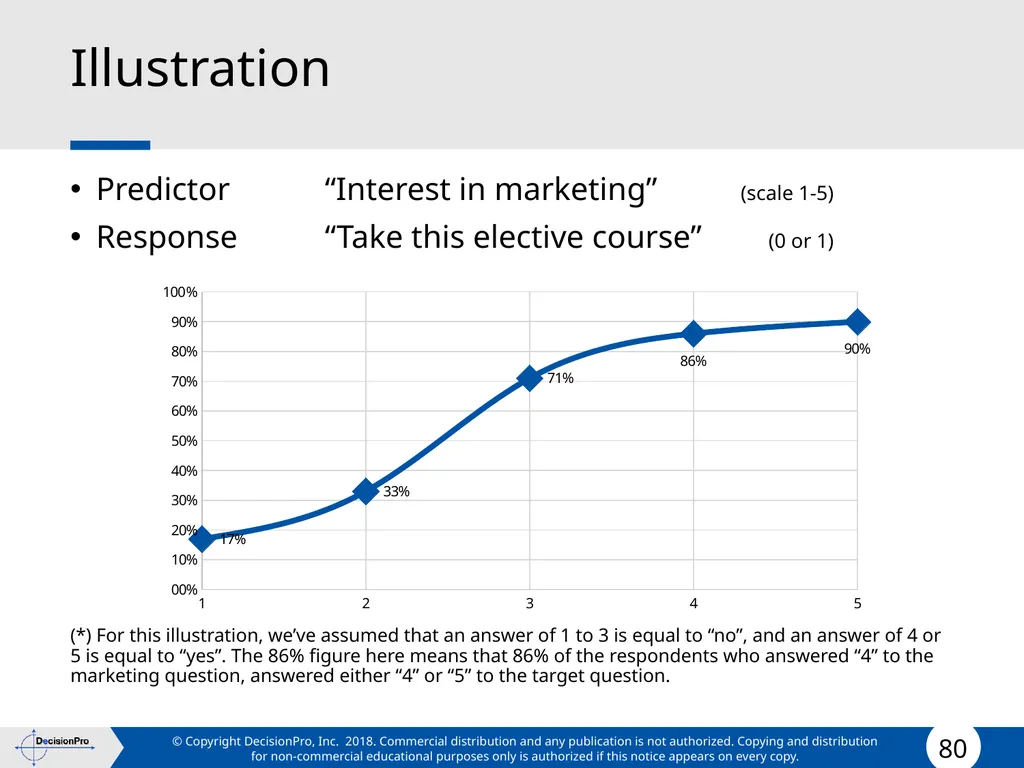
Illustration Predictor “Interest in marketing” (scale 1-5)
Response “Take this elective course” (0 or 1)
(*) For this illustration, we’ve assumed that an answer of 1 to 3 is equal to “no”, and an answer of 4 or 5 is equal to “yes”. The 86% figure here means that 86% of the respondents who answered “4” to the marketing question, answered either “4” or “5” to the target question.<br>
Response “Take this elective course” (0 or 1)
(*) For this illustration, we’ve assumed that an answer of 1 to 3 is equal to “no”, and an answer of 4 or 5 is equal to “yes”. The 86% figure here means that 86% of the respondents who answered “4” to the marketing question, answered either “4” or “5” to the target question.<br>
81
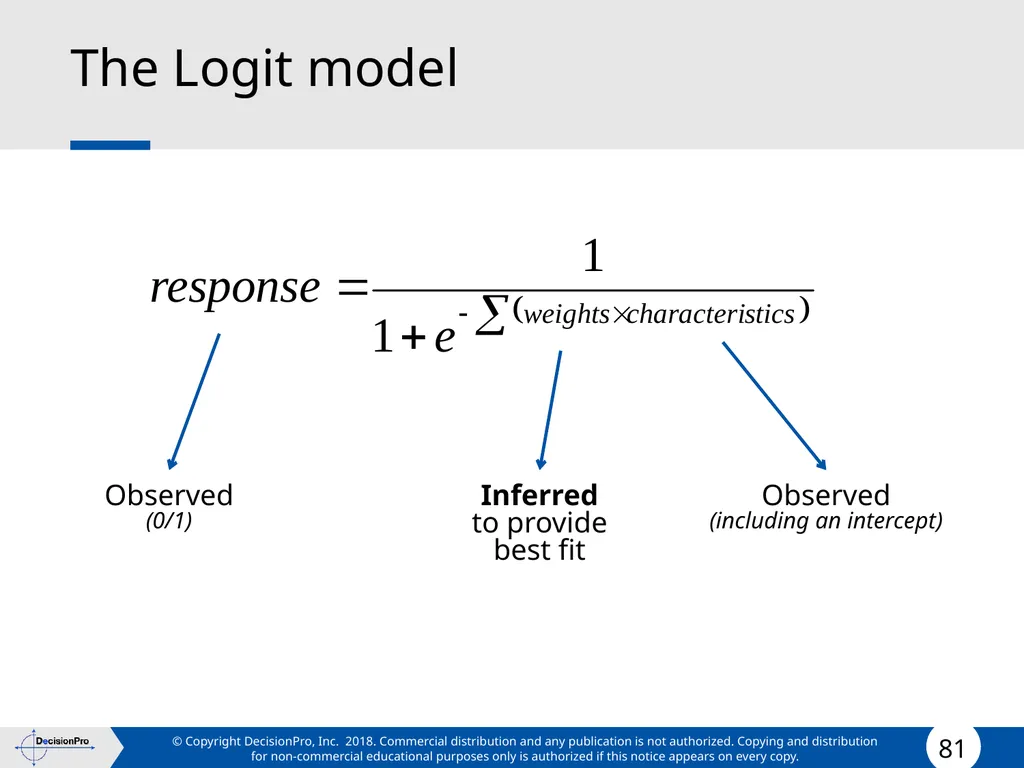
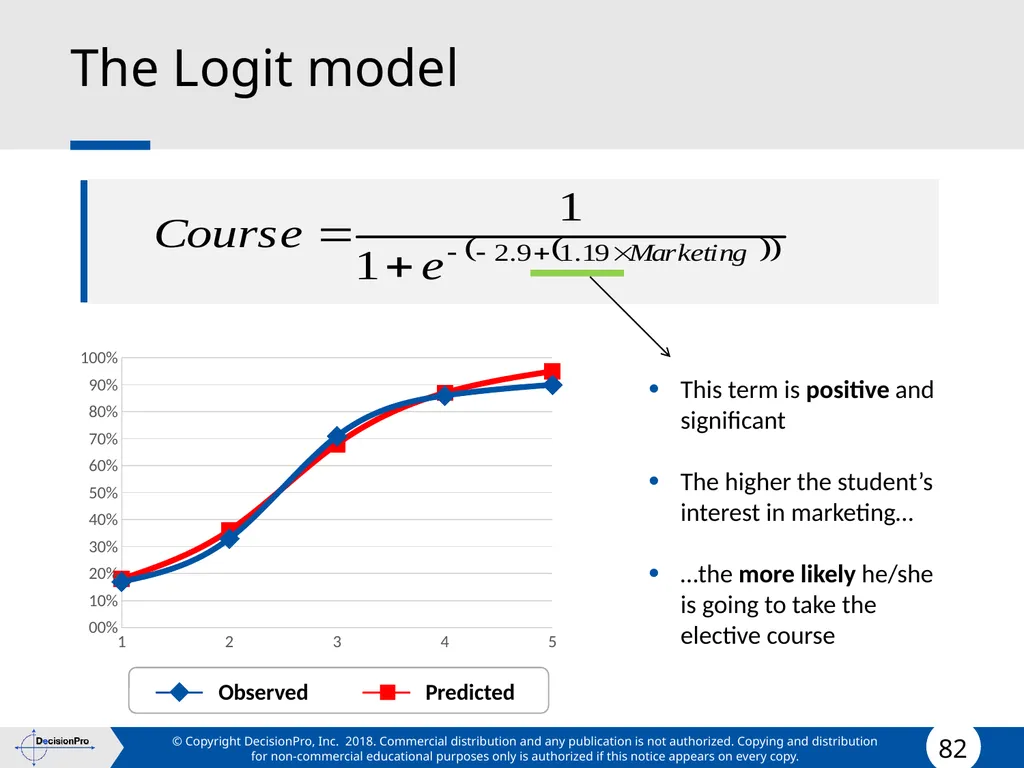
The Logit model Observed
(including an intercept) Observed
(0/1) Inferred to provide best fit<br>
(including an intercept) Observed
(0/1) Inferred to provide best fit<br>
82
The Logit model Observed Predicted This term is positive and significant
The higher the student’s interest in marketing…
…the more likely he/she is going to take the elective course<br>
The higher the student’s interest in marketing…
…the more likely he/she is going to take the elective course<br>
83
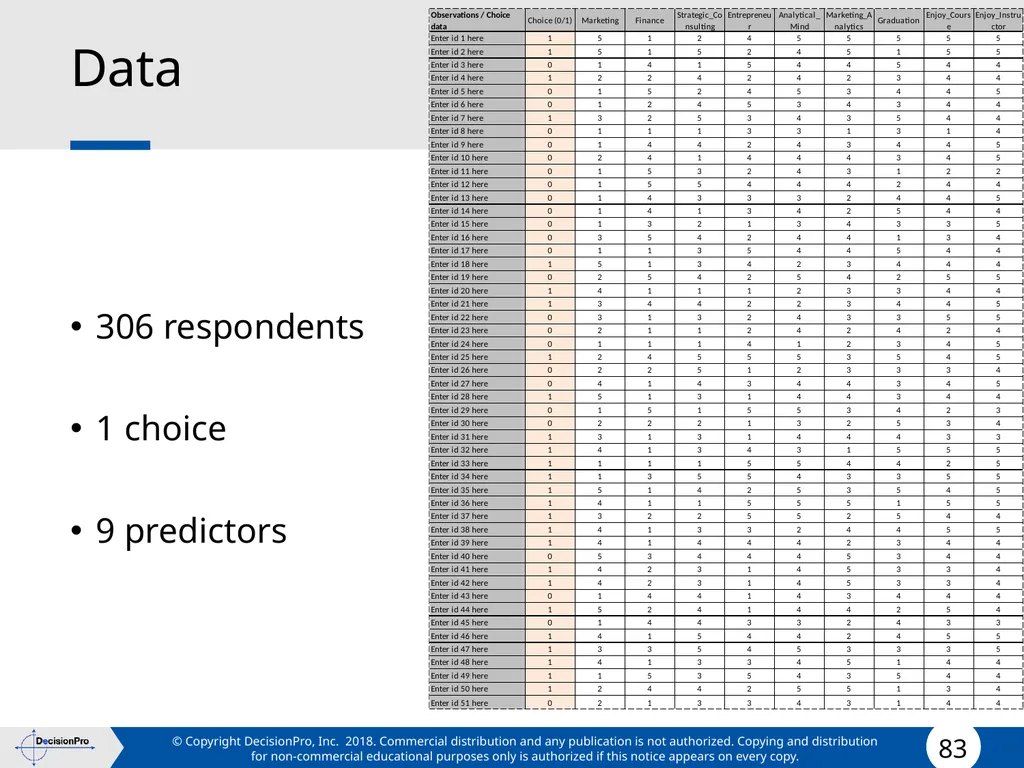
Data 306 respondents
1 choice
9 predictors<br>
1 choice
9 predictors<br>
84
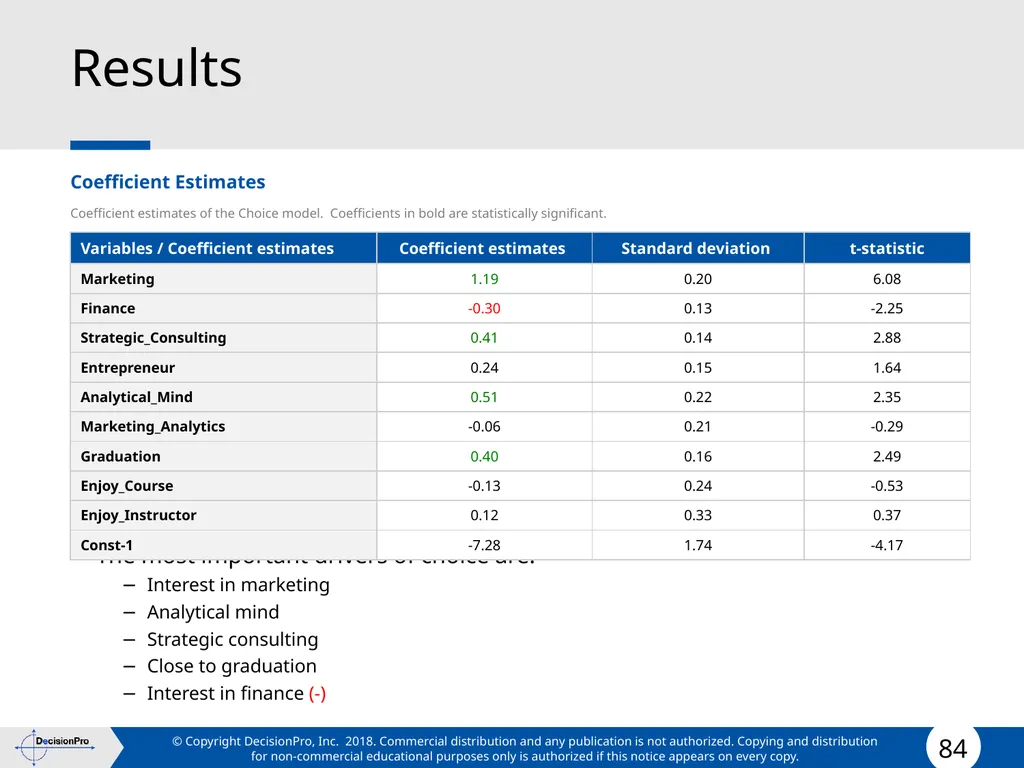
Results Coefficient Estimates
Coefficient estimates of the Choice model. Coefficients in bold are statistically significant.
The most important drivers of choice are:
Interest in marketing
Analytical mind
Strategic consulting
Close to graduation
Interest in finance (-)<br>
Coefficient estimates of the Choice model. Coefficients in bold are statistically significant.
The most important drivers of choice are:
Interest in marketing
Analytical mind
Strategic consulting
Close to graduation
Interest in finance (-)<br>
85
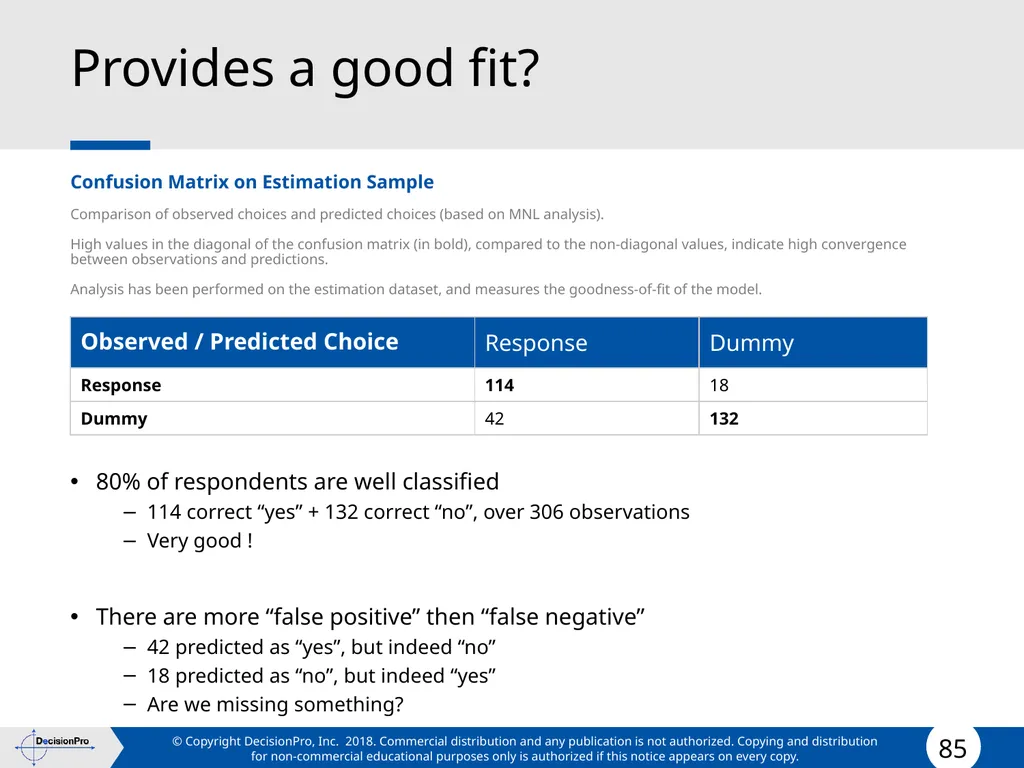
Provides a good fit? Confusion Matrix on Estimation Sample
Comparison of observed choices and predicted choices (based on MNL analysis).
High values in the diagonal of the confusion matrix (in bold), compared to the non-diagonal values, indicate high convergence between observations and predictions.
Analysis has been performed on the estimation dataset, and measures the goodness-of-fit of the model.
80% of respondents are well classified
114 correct “yes” + 132 correct “no”, over 306 observations
Very good !
There are more “false positive” then “false negative”
42 predicted as “yes”, but indeed “no”
18 predicted as “no”, but indeed “yes”
Are we missing something?<br>
Comparison of observed choices and predicted choices (based on MNL analysis).
High values in the diagonal of the confusion matrix (in bold), compared to the non-diagonal values, indicate high convergence between observations and predictions.
Analysis has been performed on the estimation dataset, and measures the goodness-of-fit of the model.
80% of respondents are well classified
114 correct “yes” + 132 correct “no”, over 306 observations
Very good !
There are more “false positive” then “false negative”
42 predicted as “yes”, but indeed “no”
18 predicted as “no”, but indeed “yes”
Are we missing something?<br>
86
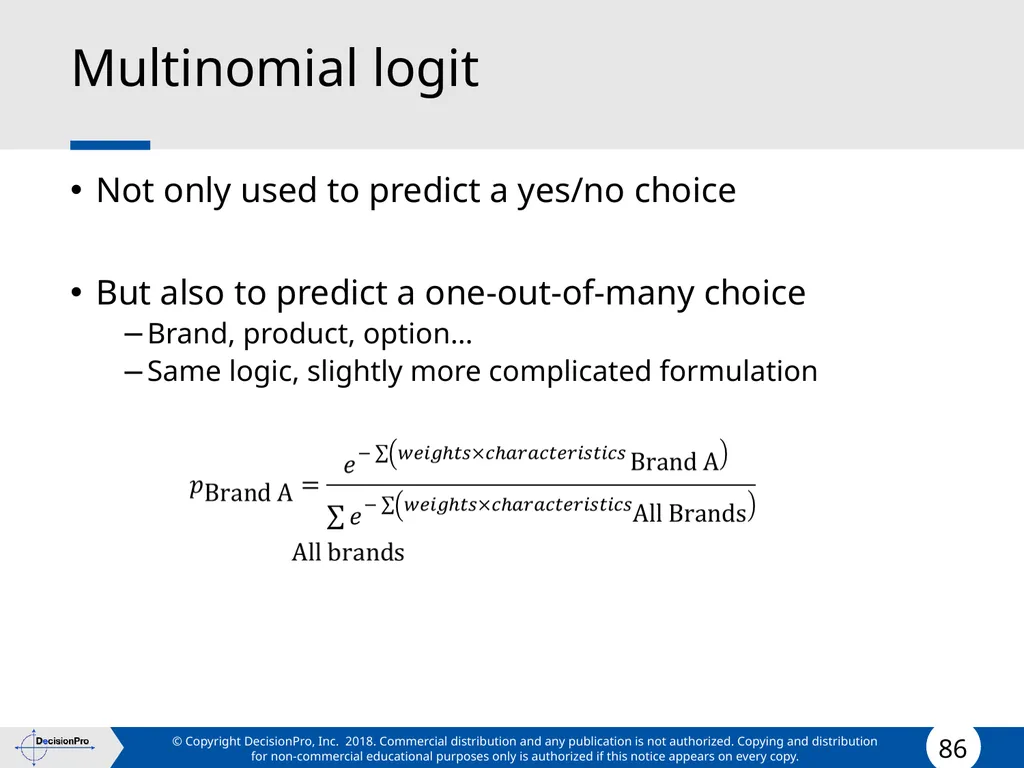
Multinomial logit Not only used to predict a yes/no choice
But also to predict a one-out-of-many choice
Brand, product, option…
Same logic, slightly more complicated formulation<br>
But also to predict a one-out-of-many choice
Brand, product, option…
Same logic, slightly more complicated formulation<br>
87
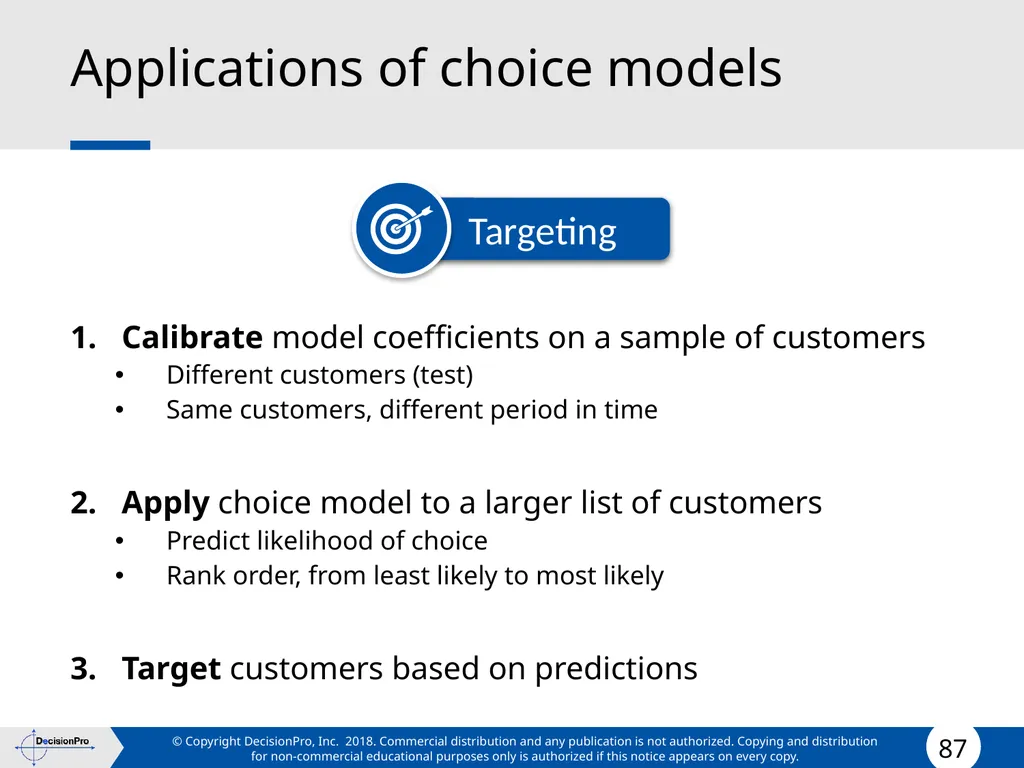
Applications of choice models Calibrate model coefficients on a sample of customers
Different customers (test)
Same customers, different period in time
Apply choice model to a larger list of customers
Predict likelihood of choice
Rank order, from least likely to most likely
Target customers based on predictions<br>
Different customers (test)
Same customers, different period in time
Apply choice model to a larger list of customers
Predict likelihood of choice
Rank order, from least likely to most likely
Target customers based on predictions<br>
88
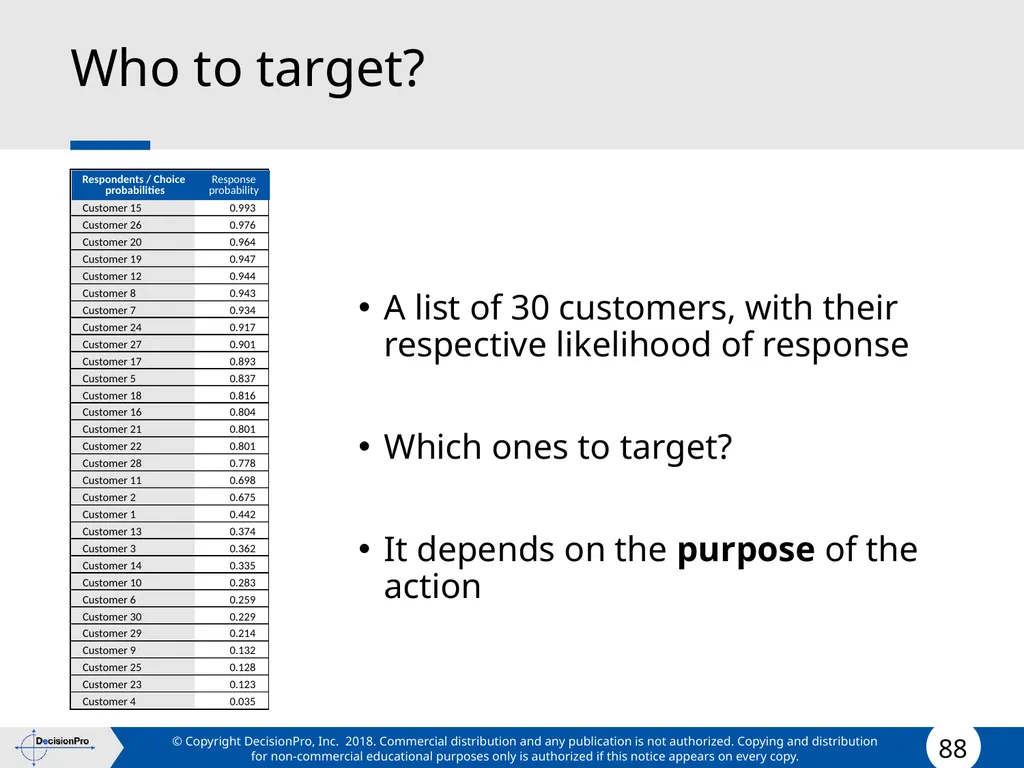
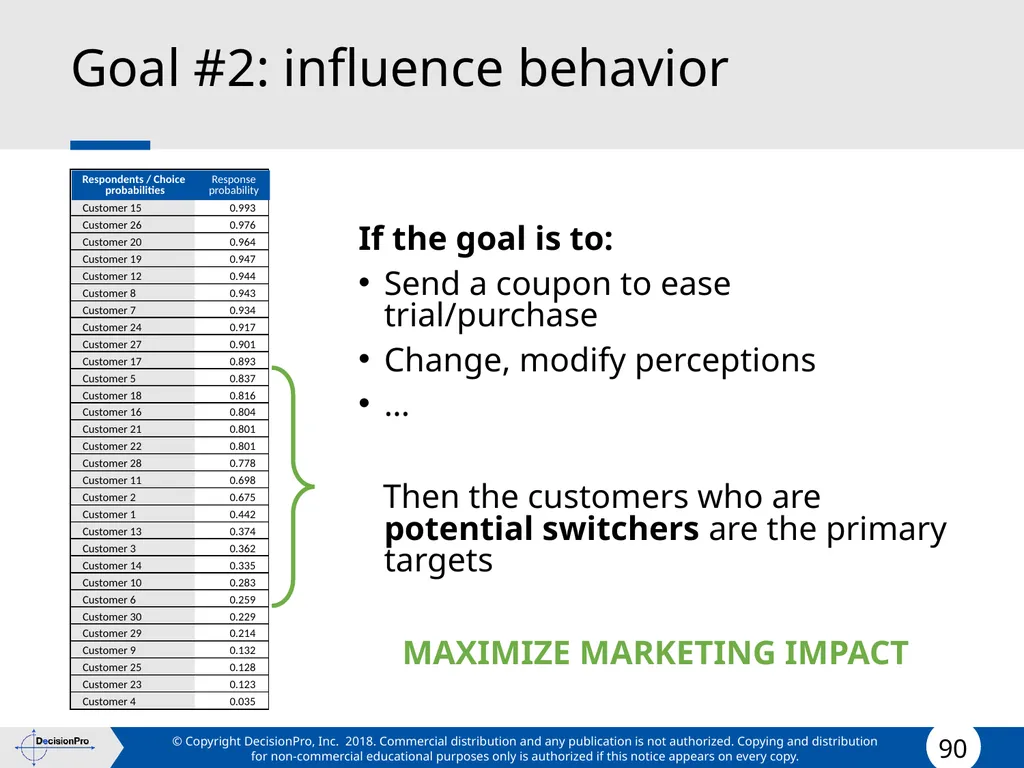
Who to target? A list of 30 customers, with their respective likelihood of response
Which ones to target?
It depends on the purpose of the action<br>
Which ones to target?
It depends on the purpose of the action<br>
89
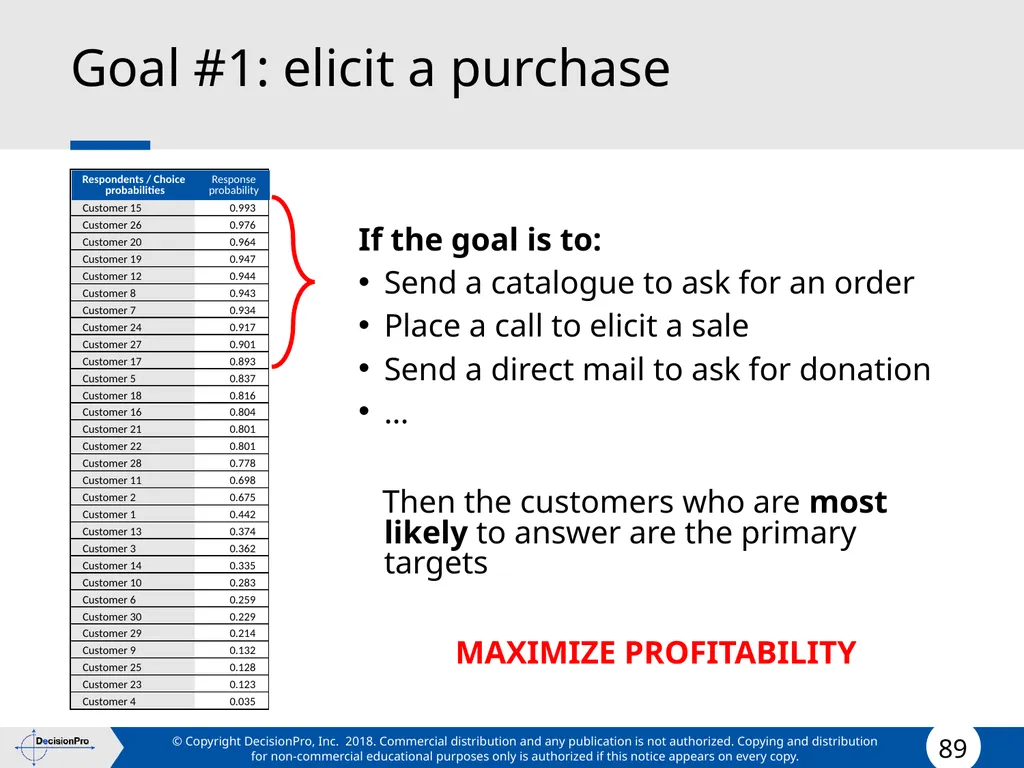
Goal #1: elicit a purchase If the goal is to:
Send a catalogue to ask for an order
Place a call to elicit a sale
Send a direct mail to ask for donation
…
Then the customers who are most likely to answer are the primary targets
MAXIMIZE PROFITABILITY<br>
Send a catalogue to ask for an order
Place a call to elicit a sale
Send a direct mail to ask for donation
…
Then the customers who are most likely to answer are the primary targets
MAXIMIZE PROFITABILITY<br>
90
Goal #2: influence behavior If the goal is to:
Send a coupon to ease trial/purchase
Change, modify perceptions
…
Then the customers who are potential switchers are the primary targets
MAXIMIZE MARKETING IMPACT<br>
Send a coupon to ease trial/purchase
Change, modify perceptions
…
Then the customers who are potential switchers are the primary targets
MAXIMIZE MARKETING IMPACT<br>
91
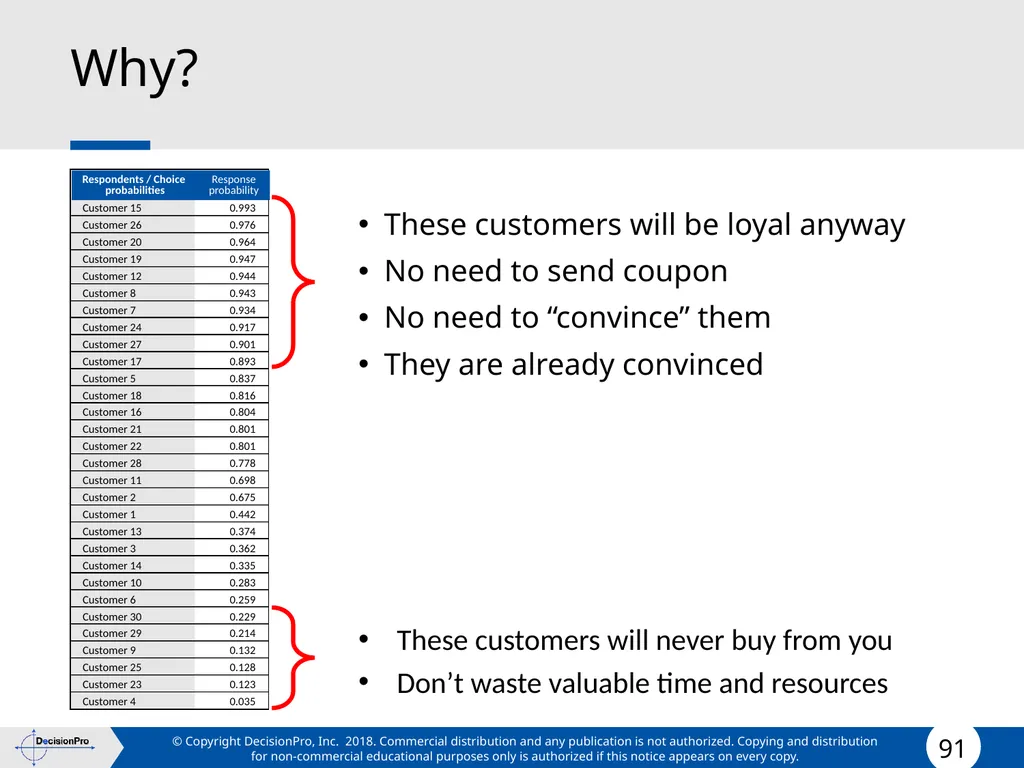
Why? These customers will be loyal anyway
No need to send coupon
No need to “convince” them
They are already convinced
These customers will never buy from you
Don’t waste valuable time and resources<br>
No need to send coupon
No need to “convince” them
They are already convinced
These customers will never buy from you
Don’t waste valuable time and resources<br>
92
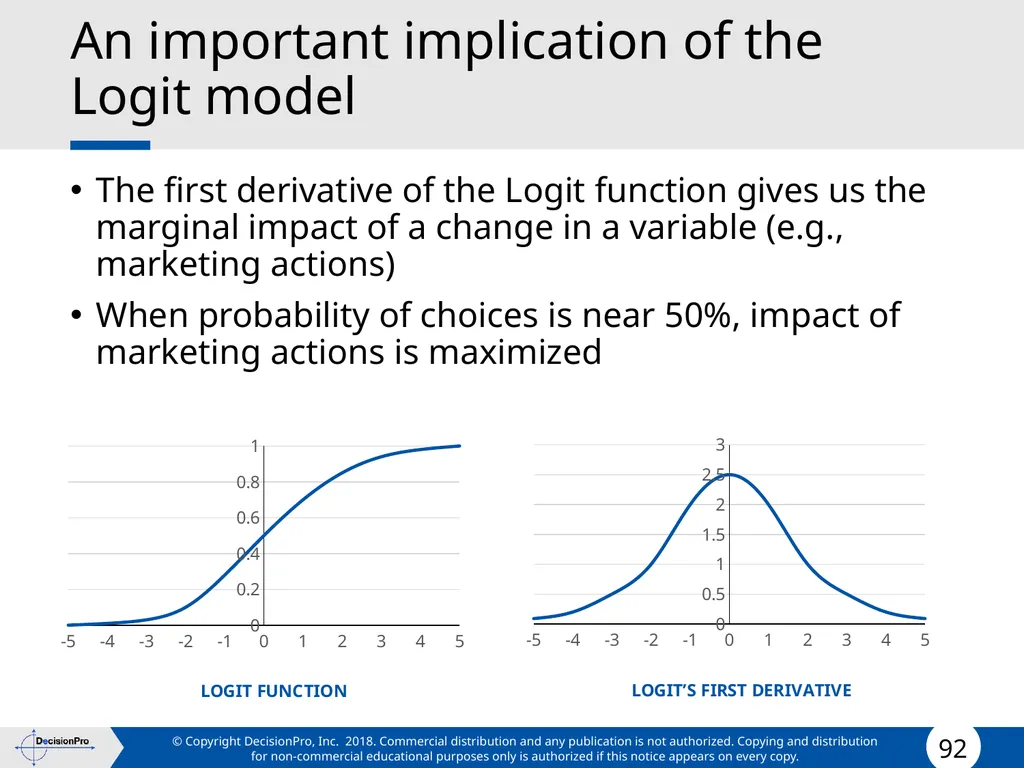
An important implication of the Logit model The first derivative of the Logit function gives us the marginal impact of a change in a variable (e.g., marketing actions)
When probability of choices is near 50%, impact of marketing actions is maximized<br>
When probability of choices is near 50%, impact of marketing actions is maximized<br>
93
Score A score is a characterization of a customer’s most likely behavior or potential.
In the most simple case, a score is simply the result of a choice model (e.g., likelihood of purchase).
In more complex cases, a score can be the result of a combination of choice and predictive models<br>
In the most simple case, a score is simply the result of a choice model (e.g., likelihood of purchase).
In more complex cases, a score can be the result of a combination of choice and predictive models<br>
94
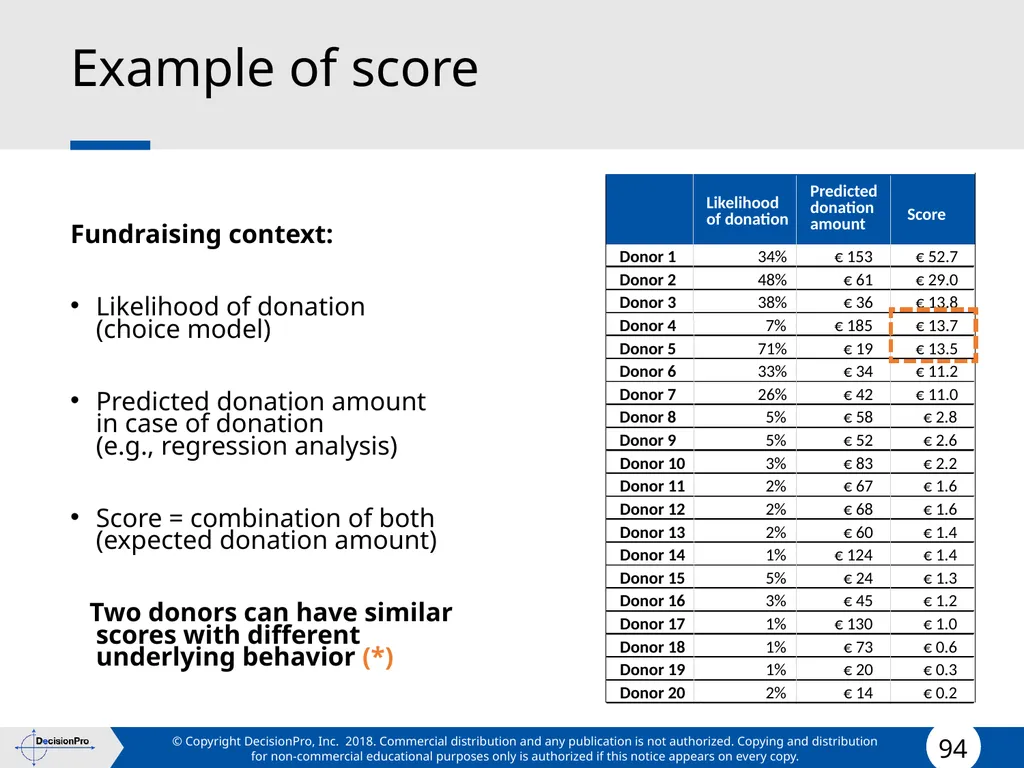
Example of score Fundraising context:
Likelihood of donation (choice model)
Predicted donation amount in case of donation (e.g., regression analysis)
Score = combination of both (expected donation amount)
Two donors can have similar scores with different underlying behavior (*)<br>
Likelihood of donation (choice model)
Predicted donation amount in case of donation (e.g., regression analysis)
Score = combination of both (expected donation amount)
Two donors can have similar scores with different underlying behavior (*)<br>
95
Score class A score class is a grouping of customers whose scores fall within a given range.<br>
96
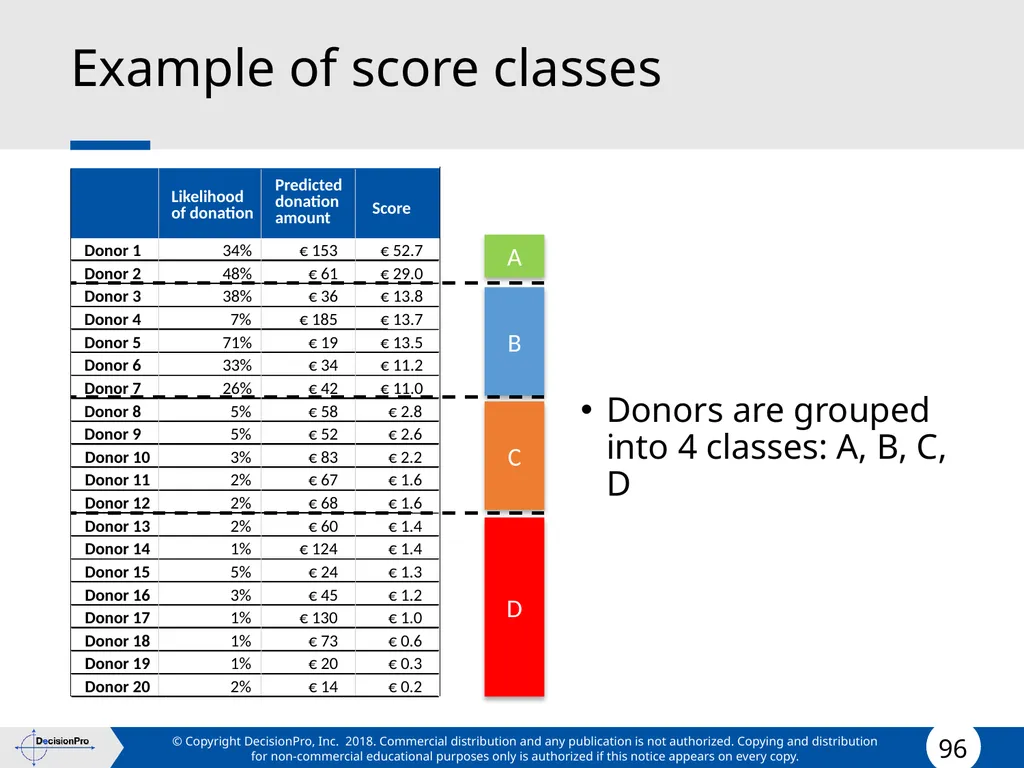
Example of score classes Donors are grouped into 4 classes: A, B, C, D A B C D<br>
97
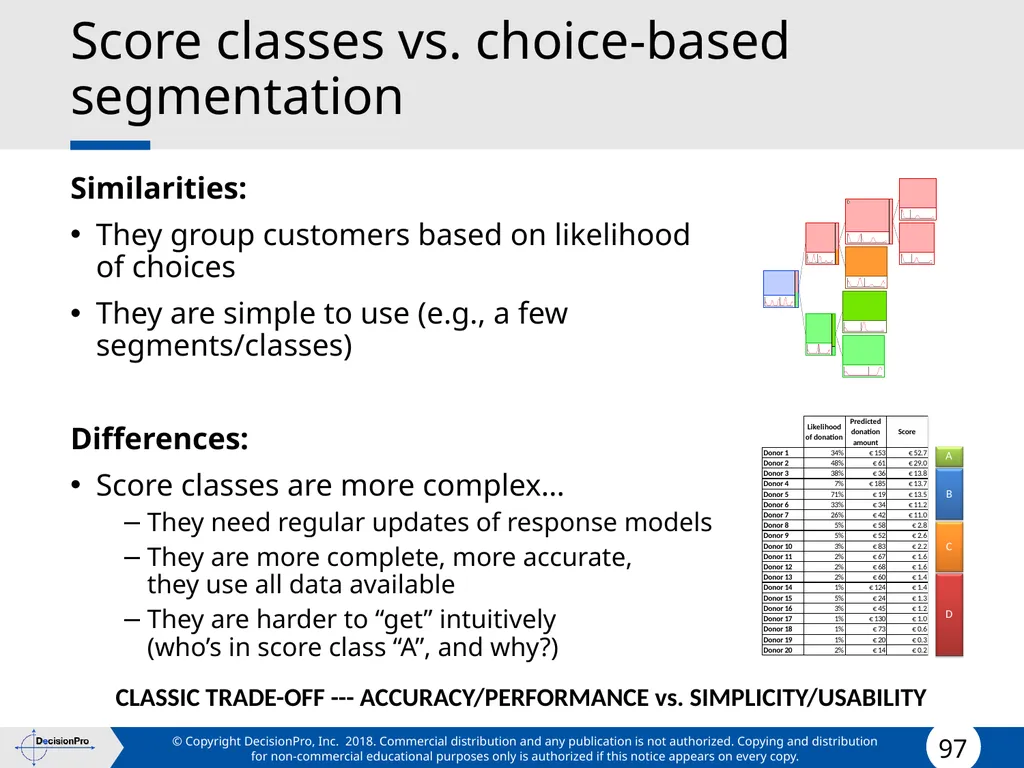
Score classes vs. choice-based segmentation Similarities:
They group customers based on likelihood of choices
They are simple to use (e.g., a few segments/classes)
Differences:
Score classes are more complex…
They need regular updates of response models
They are more complete, more accurate, they use all data available
They are harder to “get” intuitively (who’s in score class “A”, and why?) CLASSIC TRADE-OFF --- ACCURACY/PERFORMANCE vs. SIMPLICITY/USABILITY<br>
They group customers based on likelihood of choices
They are simple to use (e.g., a few segments/classes)
Differences:
Score classes are more complex…
They need regular updates of response models
They are more complete, more accurate, they use all data available
They are harder to “get” intuitively (who’s in score class “A”, and why?) CLASSIC TRADE-OFF --- ACCURACY/PERFORMANCE vs. SIMPLICITY/USABILITY<br>
98
To summarize…<br>
99
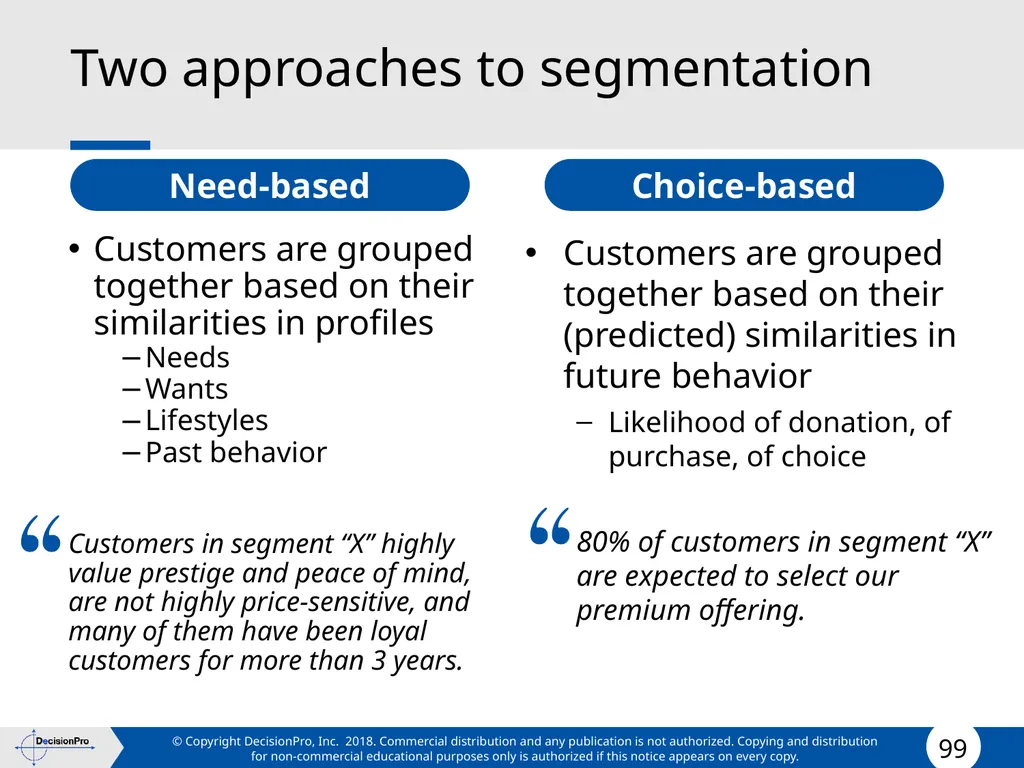
Two approaches to segmentation Customers are grouped together based on their similarities in profiles
Needs
Wants
Lifestyles
Past behavior
Customers in segment “X” highly value prestige and peace of mind, are not highly price-sensitive, and many of them have been loyal customers for more than 3 years. Customers are grouped together based on their (predicted) similarities in future behavior
Likelihood of donation, of purchase, of choice
80% of customers in segment “X” are expected to select our premium offering. Need-based Choice-based<br>
Needs
Wants
Lifestyles
Past behavior
Customers in segment “X” highly value prestige and peace of mind, are not highly price-sensitive, and many of them have been loyal customers for more than 3 years. Customers are grouped together based on their (predicted) similarities in future behavior
Likelihood of donation, of purchase, of choice
80% of customers in segment “X” are expected to select our premium offering. Need-based Choice-based<br>
100
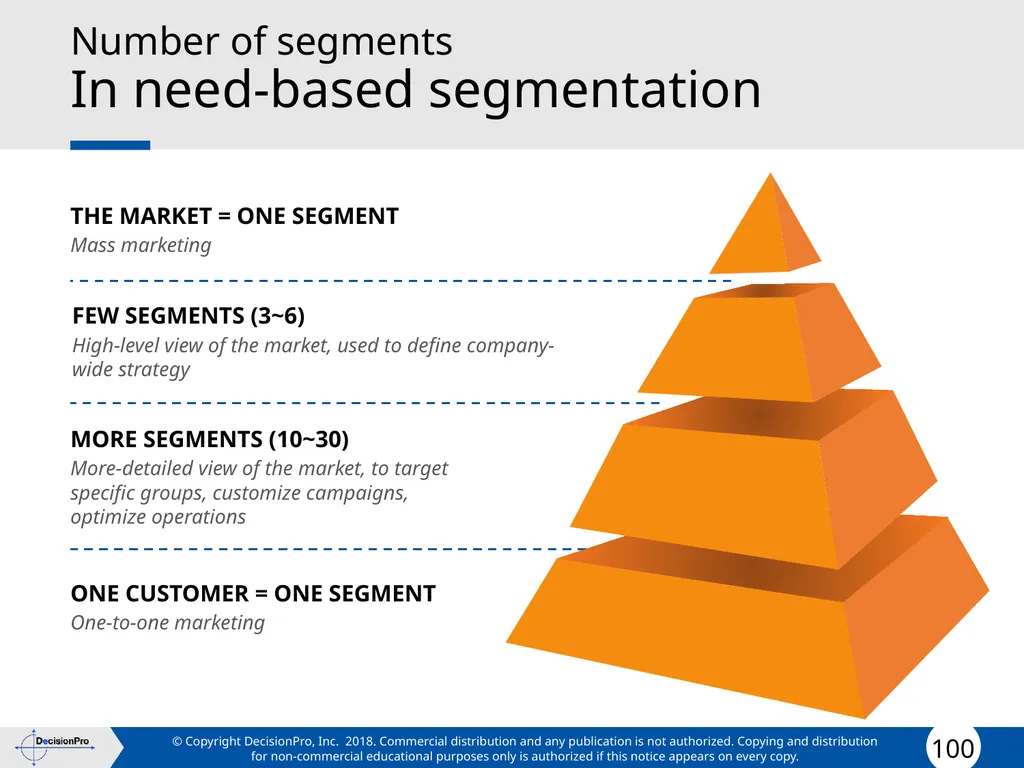
Number of segments
In need-based segmentation FEW SEGMENTS (3~6)
High-level view of the market, used to define company-wide strategy MORE SEGMENTS (10~30)
More-detailed view of the market, to target specific groups, customize campaigns, optimize operations THE MARKET = ONE SEGMENT
Mass marketing ONE CUSTOMER = ONE SEGMENT
One-to-one marketing<br>
High-level view of the market, used to define company-wide strategy MORE SEGMENTS (10~30)
More-detailed view of the market, to target specific groups, customize campaigns, optimize operations THE MARKET = ONE SEGMENT
Mass marketing ONE CUSTOMER = ONE SEGMENT
One-to-one marketing<br>
101
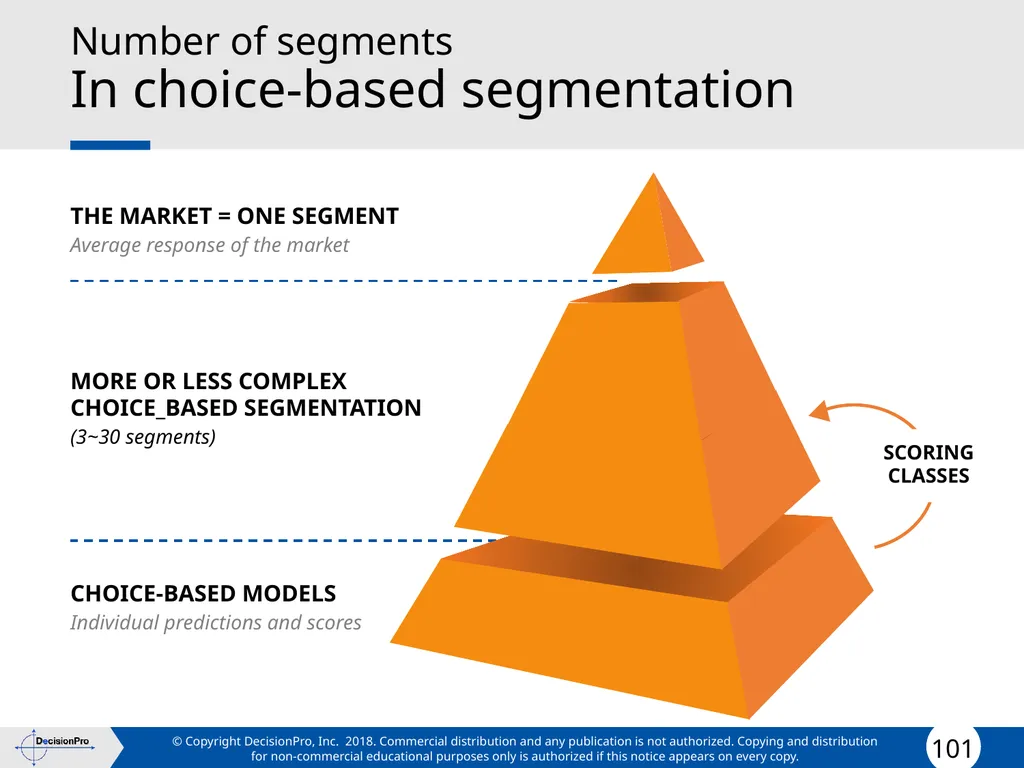
Number of segments
In choice-based segmentation MORE OR LESS COMPLEX
CHOICE_BASED SEGMENTATION
(3~30 segments) THE MARKET = ONE SEGMENT
Average response of the market CHOICE-BASED MODELS
Individual predictions and scores SCORING
CLASSES<br>
CHOICE_BASED SEGMENTATION
(3~30 segments) THE MARKET = ONE SEGMENT
Average response of the market CHOICE-BASED MODELS
Individual predictions and scores SCORING
CLASSES<br>
102
ILLUSTRATION 1 How scoring is used in direct marketing fundraising<br>
103
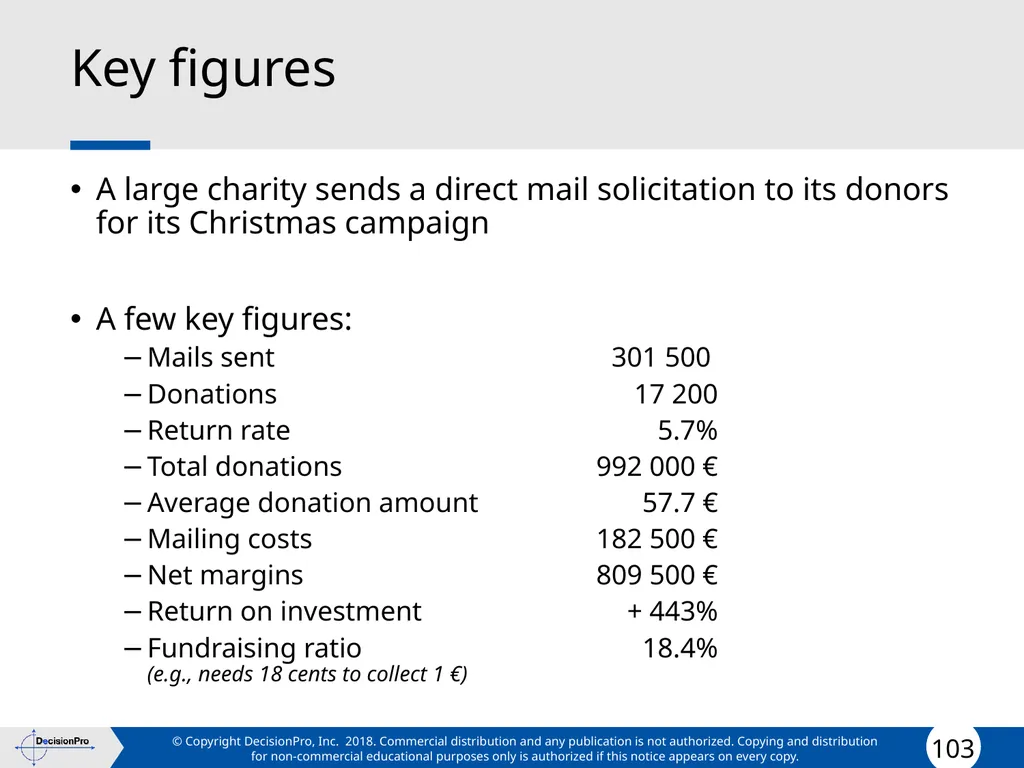
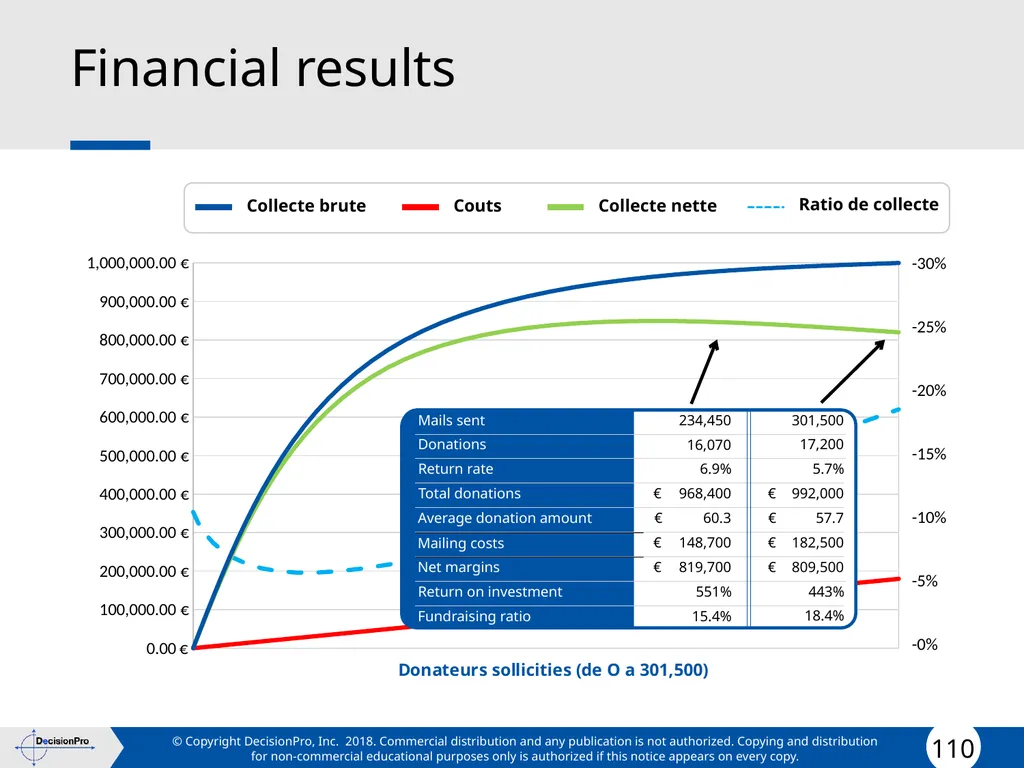
Key figures A large charity sends a direct mail solicitation to its donors for its Christmas campaign
A few key figures:
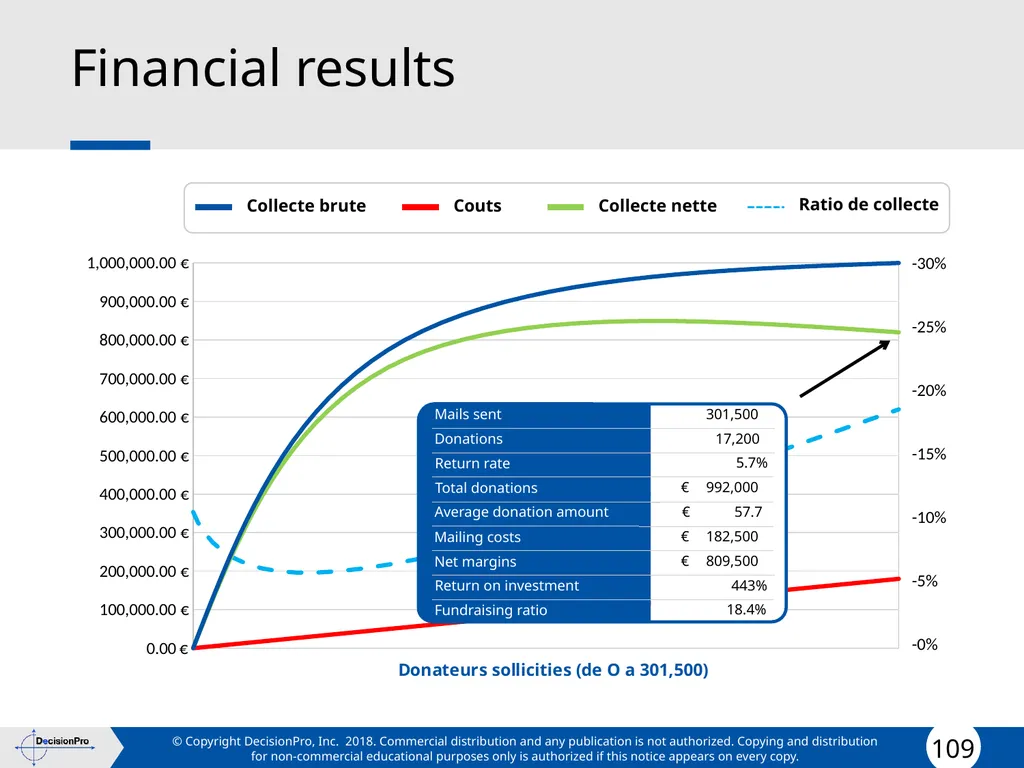
Mails sent 301 500
Donations 17 200
Return rate 5.7%
Total donations 992 000 €
Average donation amount 57.7 €
Mailing costs 182 500 €
Net margins 809 500 €
Return on investment + 443%
Fundraising ratio 18.4% (e.g., needs 18 cents to collect 1 €)<br>
A few key figures:
Mails sent 301 500
Donations 17 200
Return rate 5.7%
Total donations 992 000 €
Average donation amount 57.7 €
Mailing costs 182 500 €
Net margins 809 500 €
Return on investment + 443%
Fundraising ratio 18.4% (e.g., needs 18 cents to collect 1 €)<br>
104
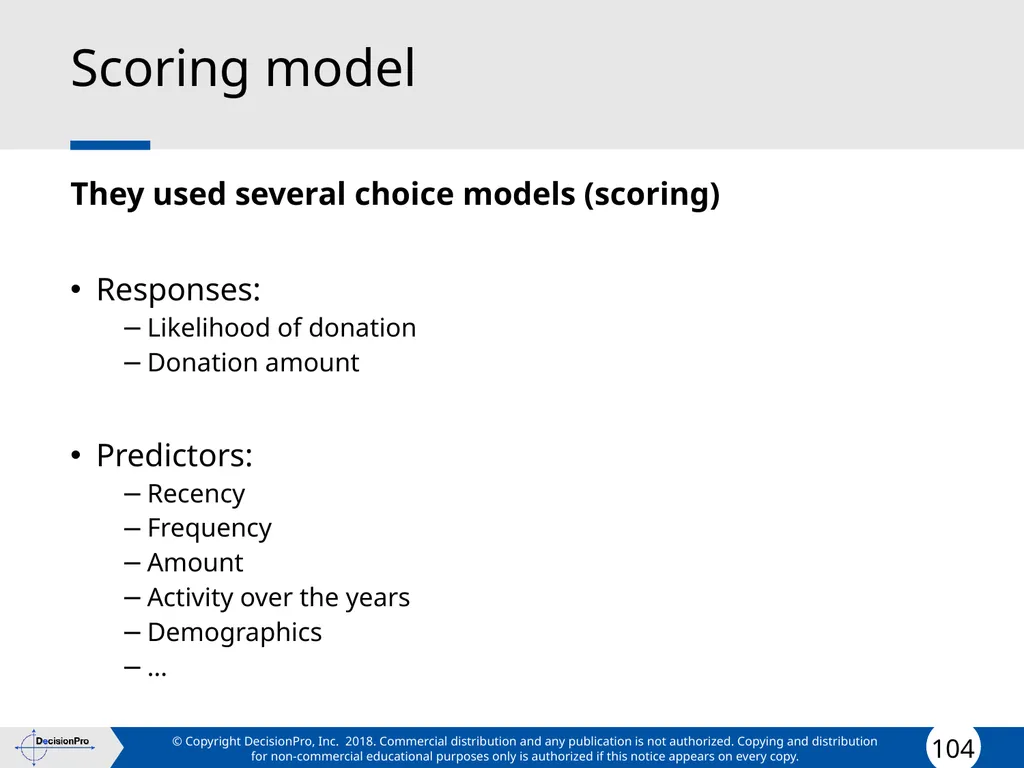
Scoring model They used several choice models (scoring)
Responses:
Likelihood of donation
Donation amount
Predictors:
Recency
Frequency
Amount
Activity over the years
Demographics
…<br>
Responses:
Likelihood of donation
Donation amount
Predictors:
Recency
Frequency
Amount
Activity over the years
Demographics
…<br>
105
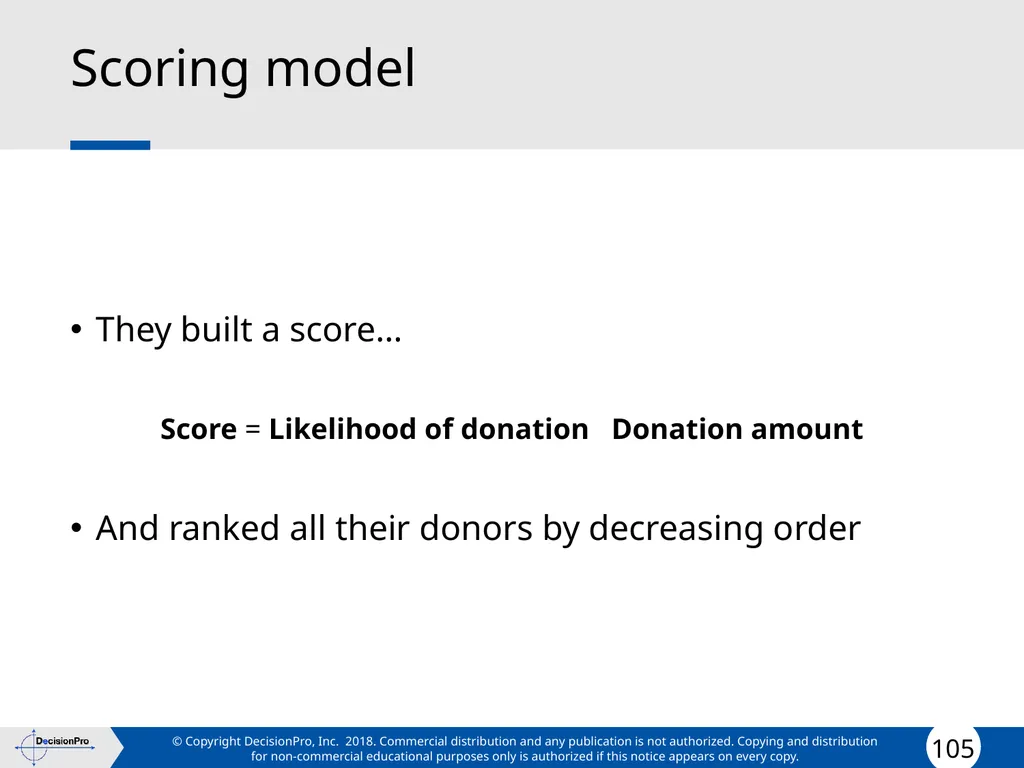
Scoring model They built a score…
Score = Likelihood of donation Donation amount
And ranked all their donors by decreasing order<br>
Score = Likelihood of donation Donation amount
And ranked all their donors by decreasing order<br>
106
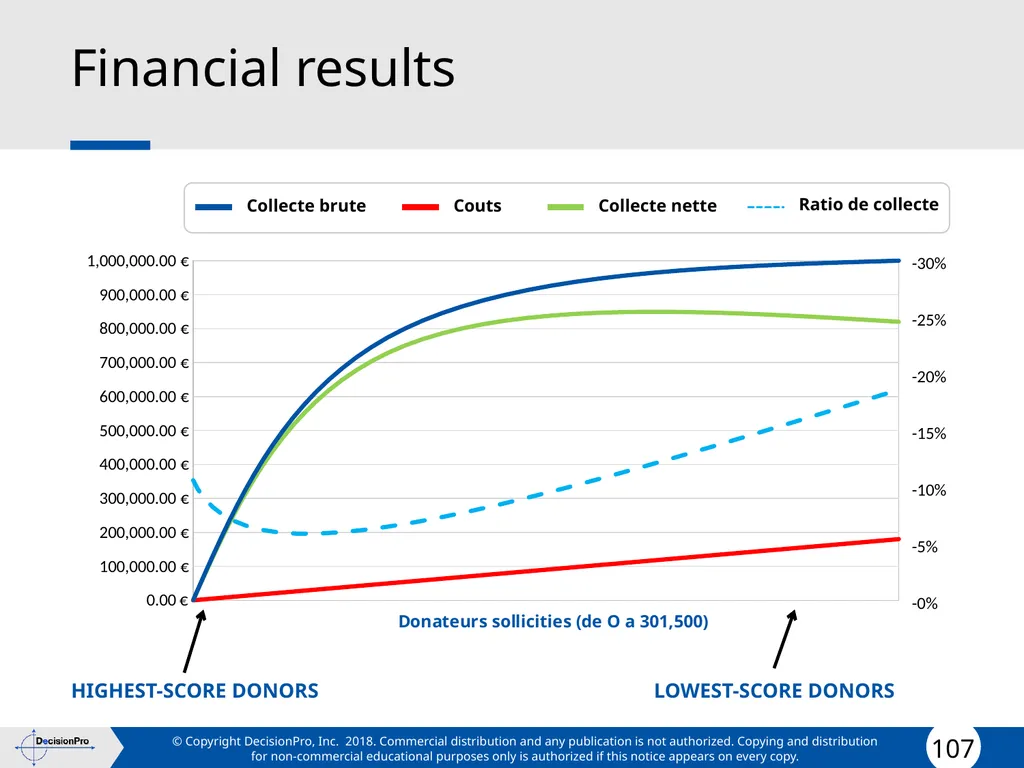
Managerial question What would have been the financial results, had we only solicited the top [X]% of our donors?
(e.g., the 10% of our donors who received the highest scores, the top-50%, etc.)<br>
(e.g., the 10% of our donors who received the highest scores, the top-50%, etc.)<br>
107
Financial results Collecte brute Couts Collecte nette Ratio de collecte HIGHEST-SCORE DONORS LOWEST-SCORE DONORS<br>
108
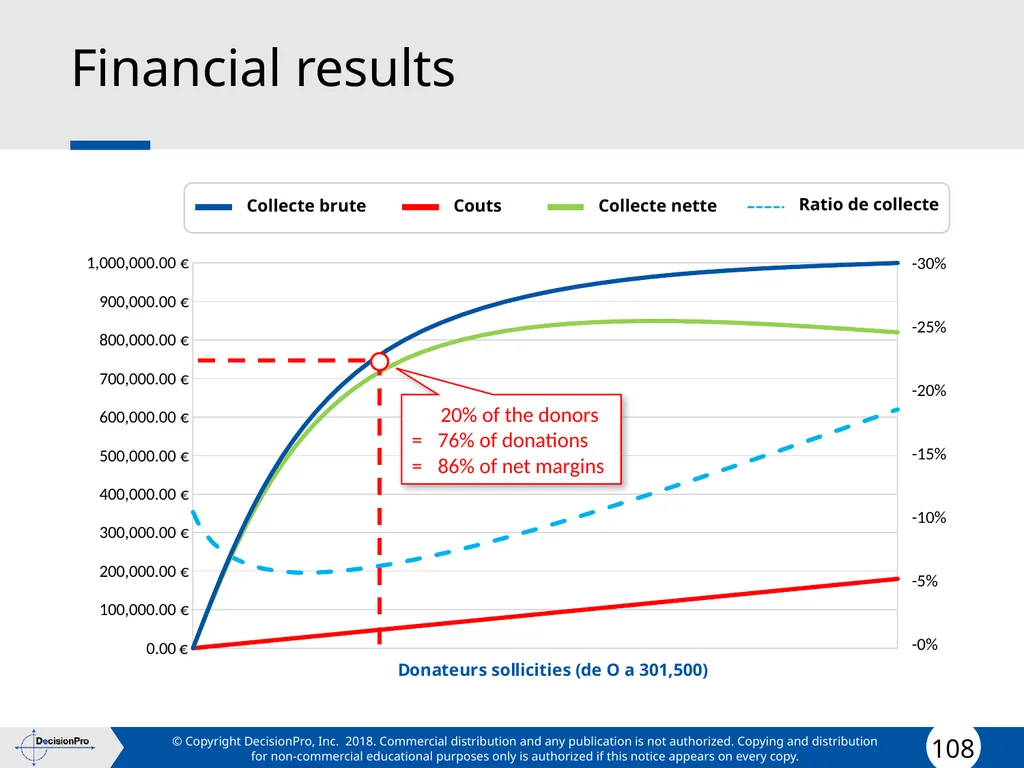
Financial results Collecte brute Couts Collecte nette Ratio de collecte 20% of the donors
= 76% of donations
= 86% of net margins<br>
= 76% of donations
= 86% of net margins<br>
109
Financial results Collecte brute Couts Collecte nette Ratio de collecte<br>
110
Financial results Collecte brute Couts Collecte nette Ratio de collecte<br>
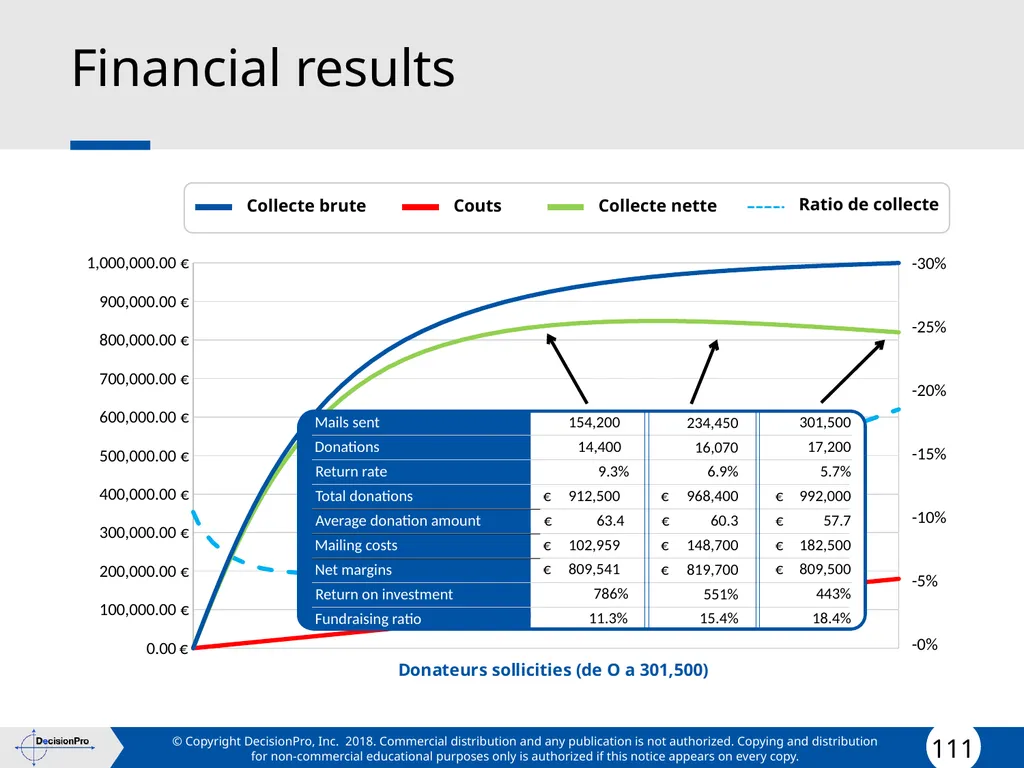
111
Financial results Collecte brute Couts Collecte nette Ratio de collecte<br>
112
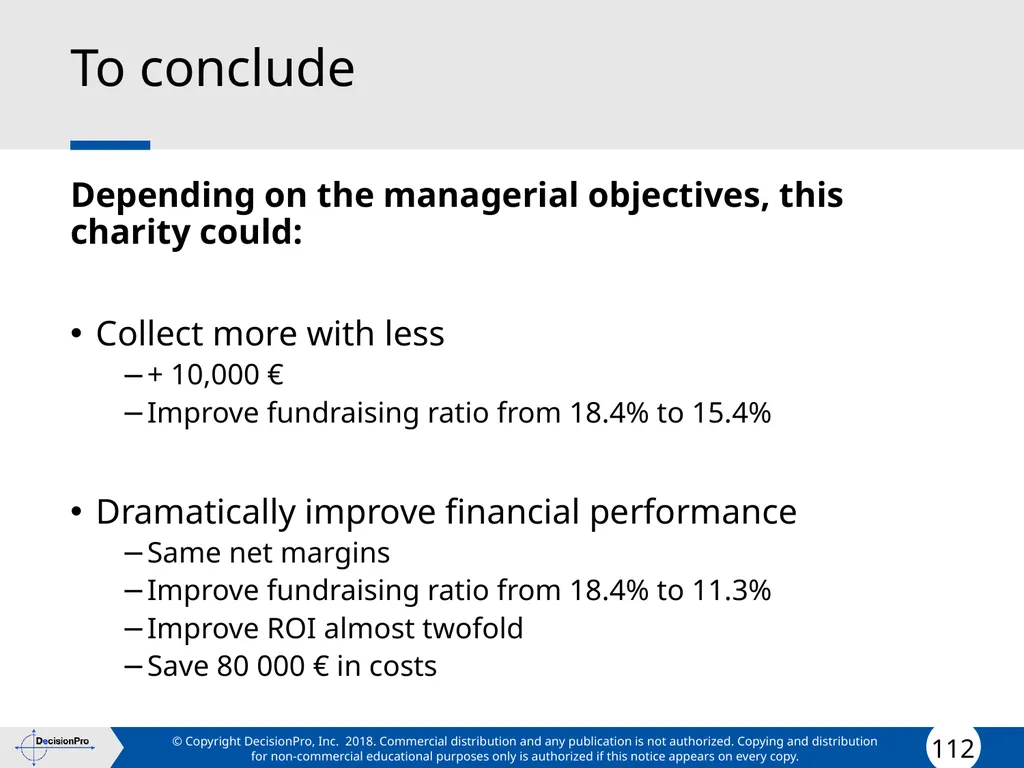
To conclude Depending on the managerial objectives, this charity could:
Collect more with less
+ 10,000 €
Improve fundraising ratio from 18.4% to 15.4%
Dramatically improve financial performance
Same net margins
Improve fundraising ratio from 18.4% to 11.3%
Improve ROI almost twofold
Save 80 000 € in costs<br>
Collect more with less
+ 10,000 €
Improve fundraising ratio from 18.4% to 15.4%
Dramatically improve financial performance
Same net margins
Improve fundraising ratio from 18.4% to 11.3%
Improve ROI almost twofold
Save 80 000 € in costs<br>
113
ILLUSTRATION 2 How Obama used micro-segmentation to target swing voters<br>
114
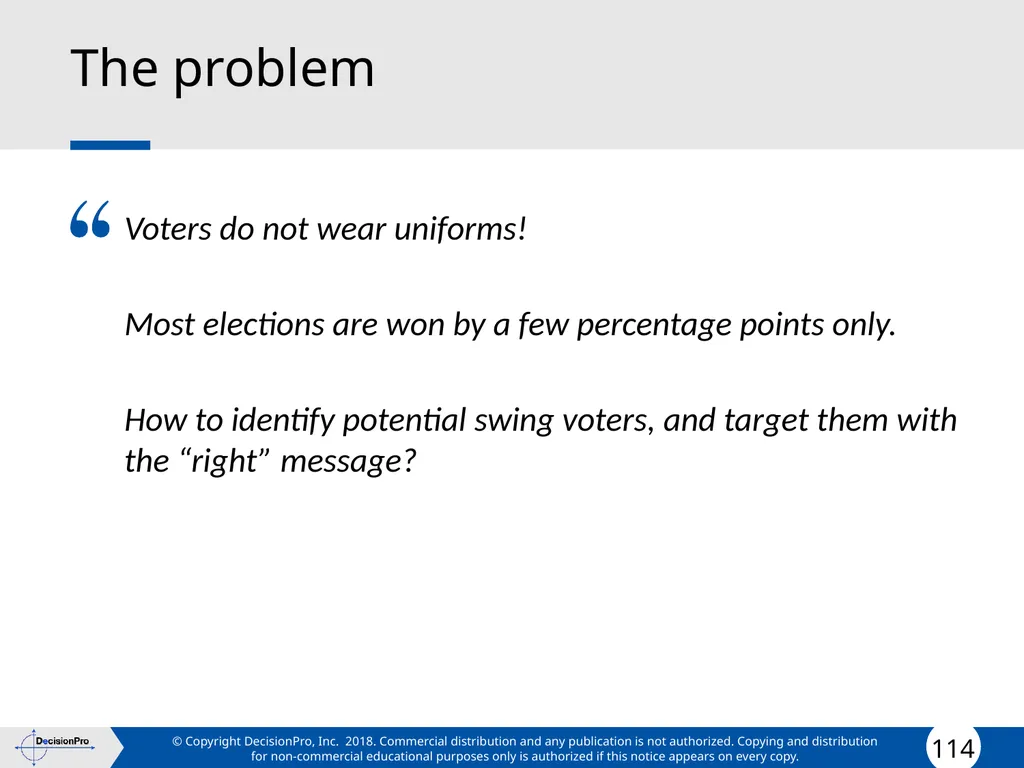
The problem Voters do not wear uniforms!
Most elections are won by a few percentage points only.
How to identify potential swing voters, and target them with the “right” message?<br>
Most elections are won by a few percentage points only.
How to identify potential swing voters, and target them with the “right” message?<br>
115
Step 1
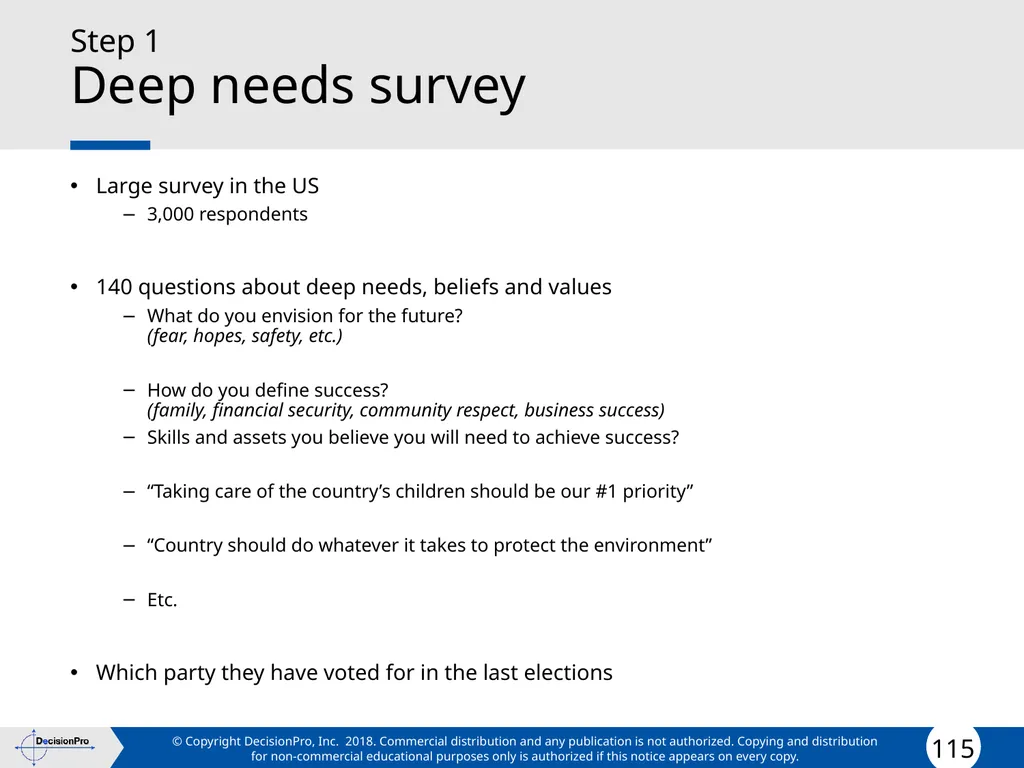
Deep needs survey Large survey in the US
3,000 respondents
140 questions about deep needs, beliefs and values
What do you envision for the future? (fear, hopes, safety, etc.)
How do you define success? (family, financial security, community respect, business success)
Skills and assets you believe you will need to achieve success?
“Taking care of the country’s children should be our #1 priority”
“Country should do whatever it takes to protect the environment”
Etc.
Which party they have voted for in the last elections<br>
3,000 respondents
140 questions about deep needs, beliefs and values
What do you envision for the future? (fear, hopes, safety, etc.)
How do you define success? (family, financial security, community respect, business success)
Skills and assets you believe you will need to achieve success?
“Taking care of the country’s children should be our #1 priority”
“Country should do whatever it takes to protect the environment”
Etc.
Which party they have voted for in the last elections<br>
116
Step 2
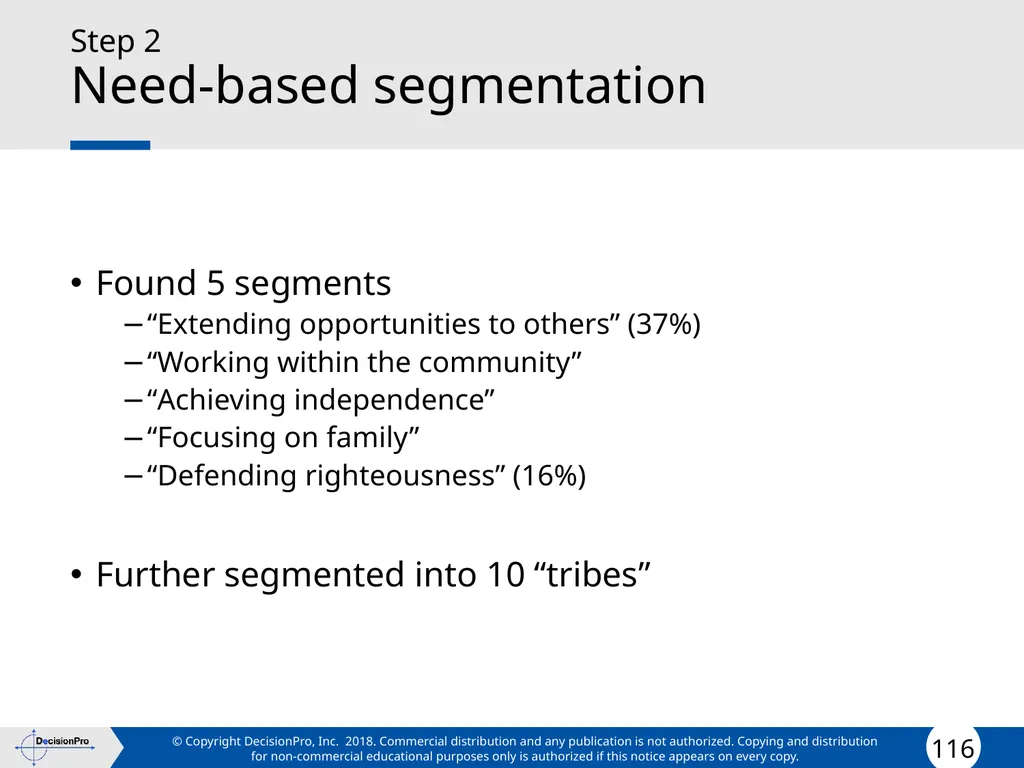
Need-based segmentation Found 5 segments
“Extending opportunities to others” (37%)
“Working within the community”
“Achieving independence”
“Focusing on family”
“Defending righteousness” (16%)
Further segmented into 10 “tribes”<br>
“Extending opportunities to others” (37%)
“Working within the community”
“Achieving independence”
“Focusing on family”
“Defending righteousness” (16%)
Further segmented into 10 “tribes”<br>
117
Step 3
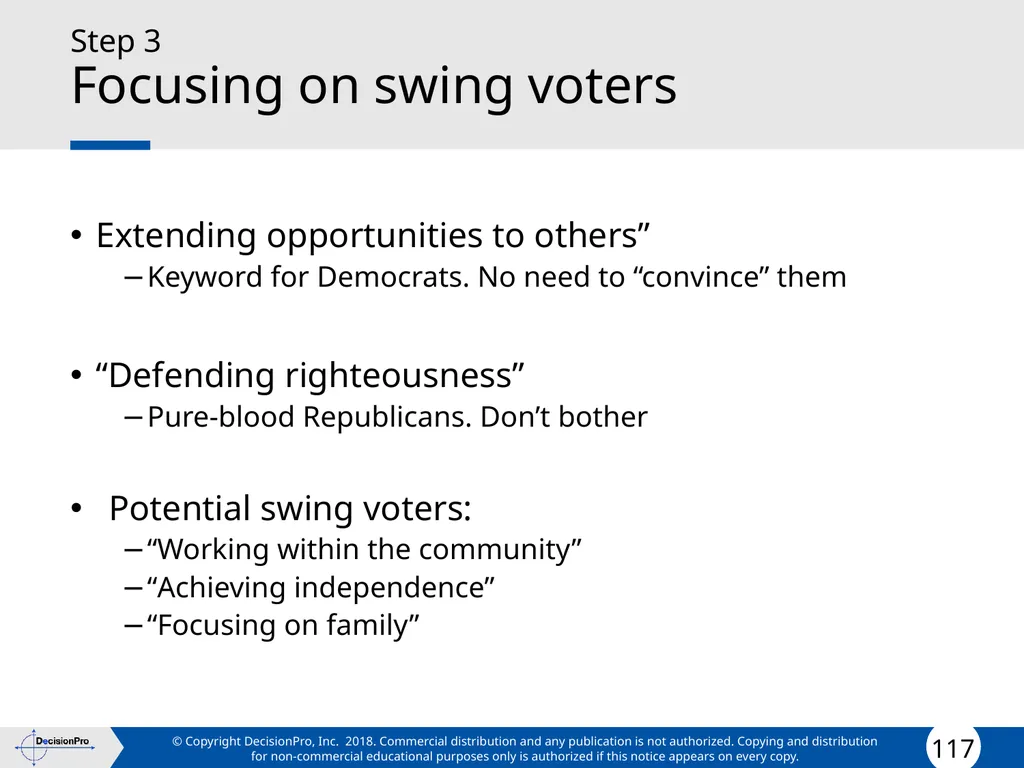
Focusing on swing voters Extending opportunities to others”
Keyword for Democrats. No need to “convince” them
“Defending righteousness”
Pure-blood Republicans. Don’t bother
Potential swing voters:
“Working within the community”
“Achieving independence”
“Focusing on family”<br>
Keyword for Democrats. No need to “convince” them
“Defending righteousness”
Pure-blood Republicans. Don’t bother
Potential swing voters:
“Working within the community”
“Achieving independence”
“Focusing on family”<br>
118
Step 4
Discriminant analysis Bought discriminant data (descriptors) from various commercial database companies
ChoicePoint
Tax records, court rulings, birth and death records
Used for checking resumes, loan, credit card, etc.
Acxiom
Shopping and lifestyle data on 200,000,000 Americans
Value of their house, magazines subscribed, books bought, etc.
Buy all data available, then sold it to those who want to target us<br>
ChoicePoint
Tax records, court rulings, birth and death records
Used for checking resumes, loan, credit card, etc.
Acxiom
Shopping and lifestyle data on 200,000,000 Americans
Value of their house, magazines subscribed, books bought, etc.
Buy all data available, then sold it to those who want to target us<br>
119
Step 4
Discriminant analysis Then used this data to predict segment memberships
You are more likely to be a hard core Democrat if…
You have a cat
You eat sushis
You have an Apple computer
…
You are more likely to be a hard core Republican if…
You have a dog
You drive a Pontiac
You own a gun
You go to church
…<br>
You are more likely to be a hard core Democrat if…
You have a cat
You eat sushis
You have an Apple computer
…
You are more likely to be a hard core Republican if…
You have a dog
You drive a Pontiac
You own a gun
You go to church
…<br>
120
Step 5
Targeting Suppose you have a tight race in the eastern district of North Carolina
Go to Acxiom
Buy addresses of 20,000 people in that region who are likely to belong to the “Working within the community” segment
Send a specific direct mail talking about the Democrat promise to help local groups working with the community
Or…
Check what TV programs the “Focusing on family” segment members watch, and when, in that region (e.g., games, TV shows)
Buy TV spots during these programs
Advertise plans for children’s education, family welfare…<br>
Go to Acxiom
Buy addresses of 20,000 people in that region who are likely to belong to the “Working within the community” segment
Send a specific direct mail talking about the Democrat promise to help local groups working with the community
Or…
Check what TV programs the “Focusing on family” segment members watch, and when, in that region (e.g., games, TV shows)
Buy TV spots during these programs
Advertise plans for children’s education, family welfare…<br>
121
Implementation Issues<br>
122
Most Segmentation Projects Typically Provide…. General Insights…
Not Action Plans …<br>
Not Action Plans …<br>
123
In the Final Analysis…. Little Measurable Value from many
segmentation studies ……
They are one-time Projects that
drain resources<br>
segmentation studies ……
They are one-time Projects that
drain resources<br>
124
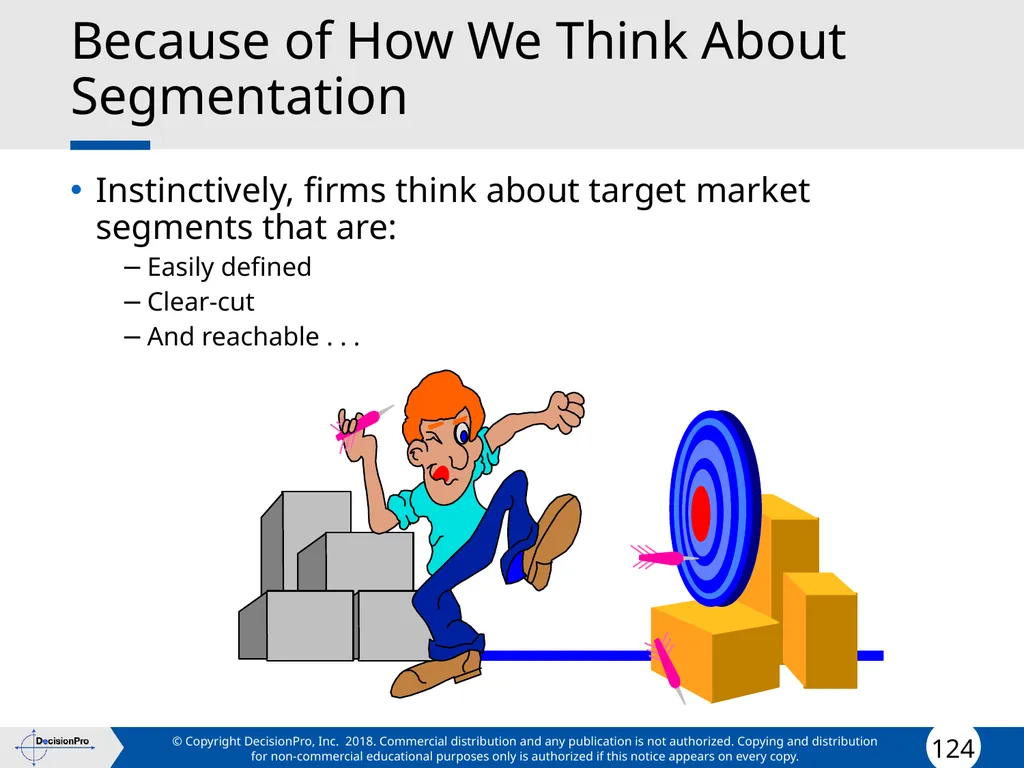
Because of How We Think About Segmentation Instinctively, firms think about target market segments that are:
Easily defined
Clear-cut
And reachable . . .<br>
Easily defined
Clear-cut
And reachable . . .<br>
125
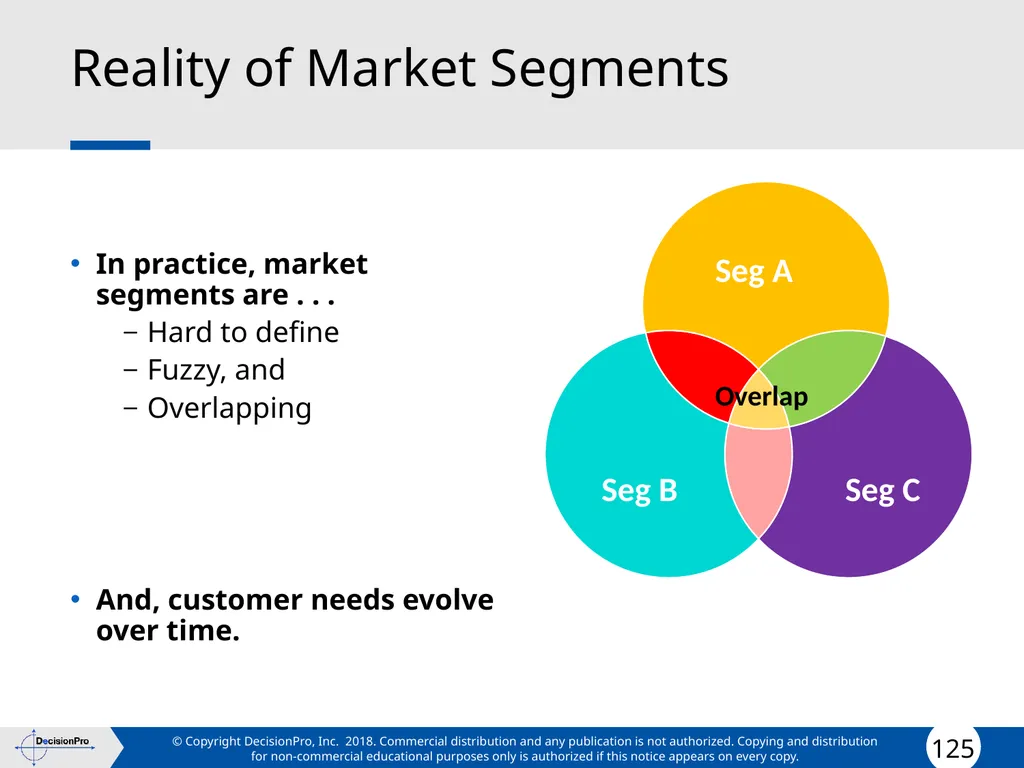
Reality of Market Segments In practice, market segments are . . .
Hard to define
Fuzzy, and
Overlapping
And, customer needs evolve over time. Seg B Seg C Seg A Overlap<br>
Hard to define
Fuzzy, and
Overlapping
And, customer needs evolve over time. Seg B Seg C Seg A Overlap<br>
126
On the Other Hand…
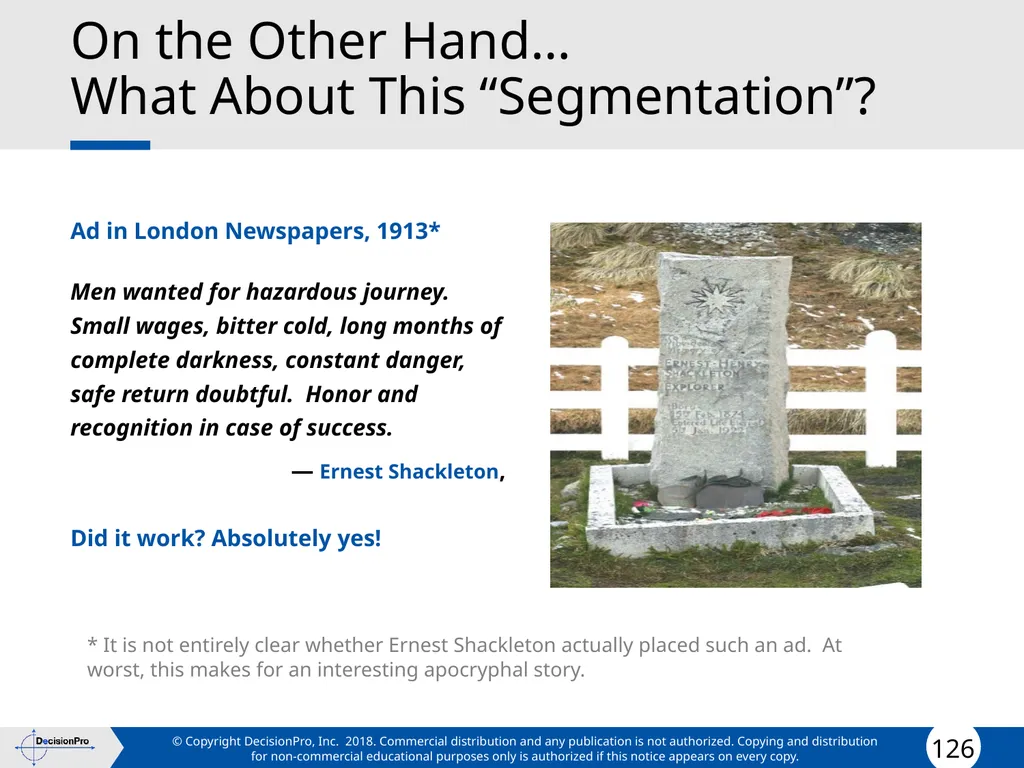
What About This “Segmentation”? Ad in London Newspapers, 1913*
Men wanted for hazardous journey. Small wages, bitter cold, long months of complete darkness, constant danger, safe return doubtful. Honor and recognition in case of success.
— Ernest Shackleton,
Did it work? Absolutely yes! * It is not entirely clear whether Ernest Shackleton actually placed such an ad. At worst, this makes for an interesting apocryphal story.<br>
Men wanted for hazardous journey. Small wages, bitter cold, long months of complete darkness, constant danger, safe return doubtful. Honor and recognition in case of success.
— Ernest Shackleton,
Did it work? Absolutely yes! * It is not entirely clear whether Ernest Shackleton actually placed such an ad. At worst, this makes for an interesting apocryphal story.<br>
127
A Good Segmentation Study … Identifies segments of customers with differentiated needs.
How many different segments?
How do their needs differ?
Enables segments to be separately targeted/reached (this can be problematic even if segments have distinctly different needs).
Finds one or more attractive segments (i.e. a profitable and separate marketing program can be designed for selected segments).
Facilitates the implementation of the segmentation scheme as an ongoing process, not a discrete project.<br>
How many different segments?
How do their needs differ?
Enables segments to be separately targeted/reached (this can be problematic even if segments have distinctly different needs).
Finds one or more attractive segments (i.e. a profitable and separate marketing program can be designed for selected segments).
Facilitates the implementation of the segmentation scheme as an ongoing process, not a discrete project.<br>
128
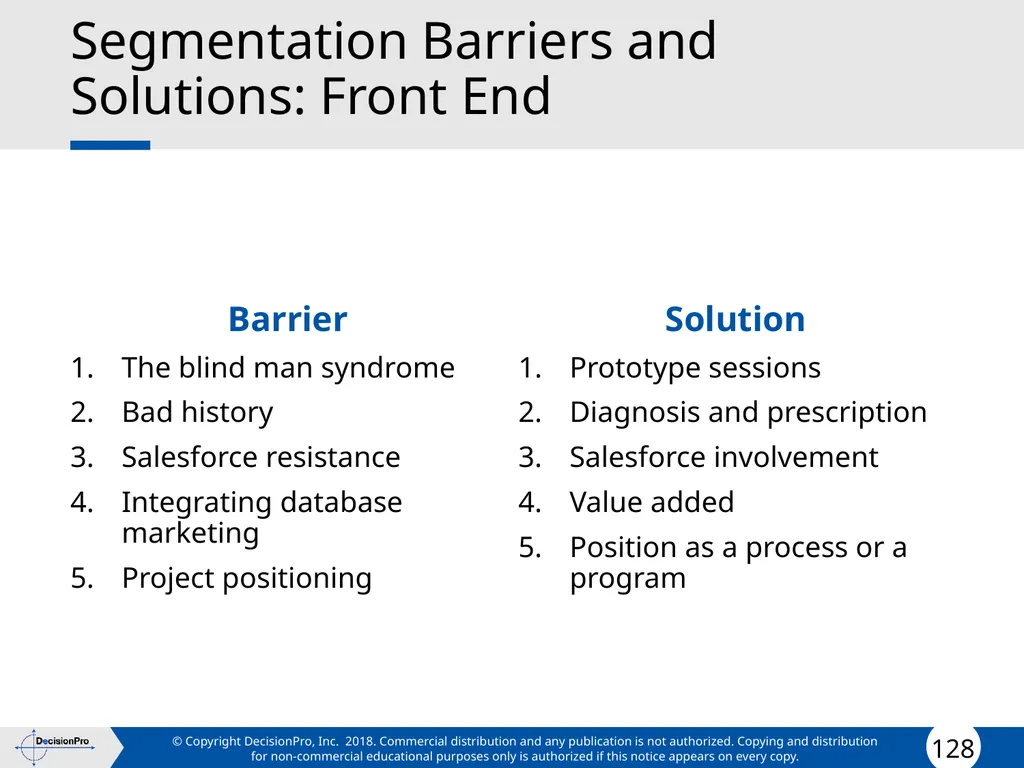
Segmentation Barriers and Solutions: Front End Barrier
The blind man syndrome
Bad history
Salesforce resistance
Integrating database marketing
Project positioning Solution
Prototype sessions
Diagnosis and prescription
Salesforce involvement
Value added
Position as a process or a program<br>
The blind man syndrome
Bad history
Salesforce resistance
Integrating database marketing
Project positioning Solution
Prototype sessions
Diagnosis and prescription
Salesforce involvement
Value added
Position as a process or a program<br>
129
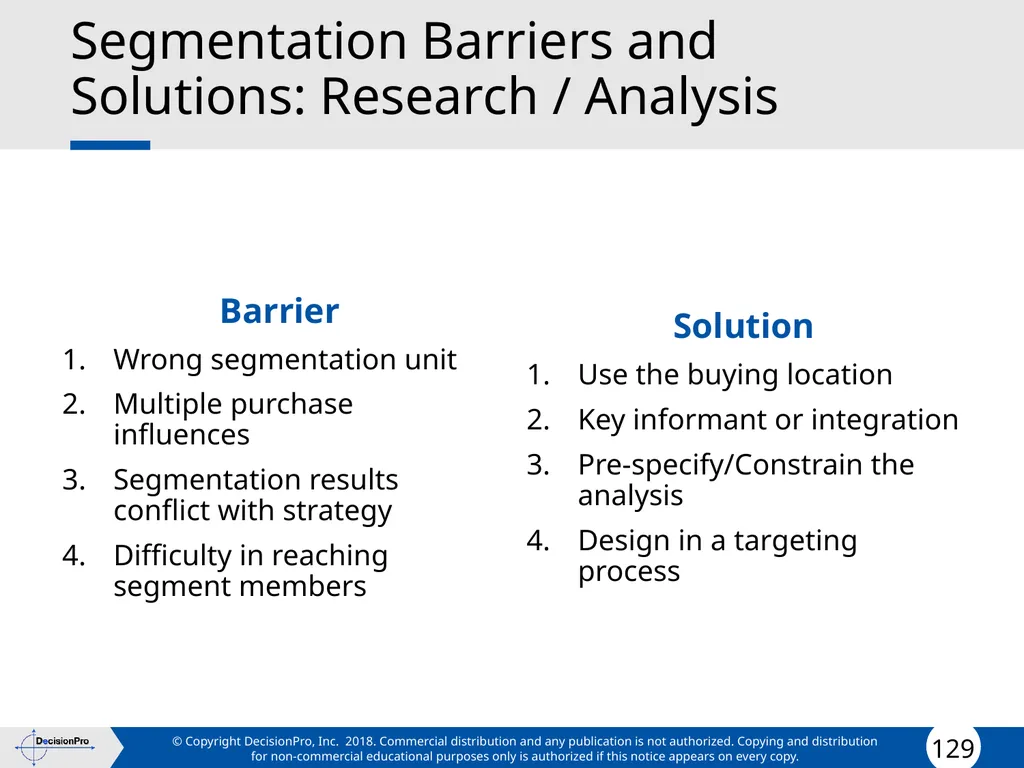
Segmentation Barriers and Solutions: Research / Analysis Barrier
Wrong segmentation unit
Multiple purchase influences
Segmentation results conflict with strategy
Difficulty in reaching segment members Solution
Use the buying location
Key informant or integration
Pre-specify/Constrain the analysis
Design in a targeting process<br>
Wrong segmentation unit
Multiple purchase influences
Segmentation results conflict with strategy
Difficulty in reaching segment members Solution
Use the buying location
Key informant or integration
Pre-specify/Constrain the analysis
Design in a targeting process<br>
130
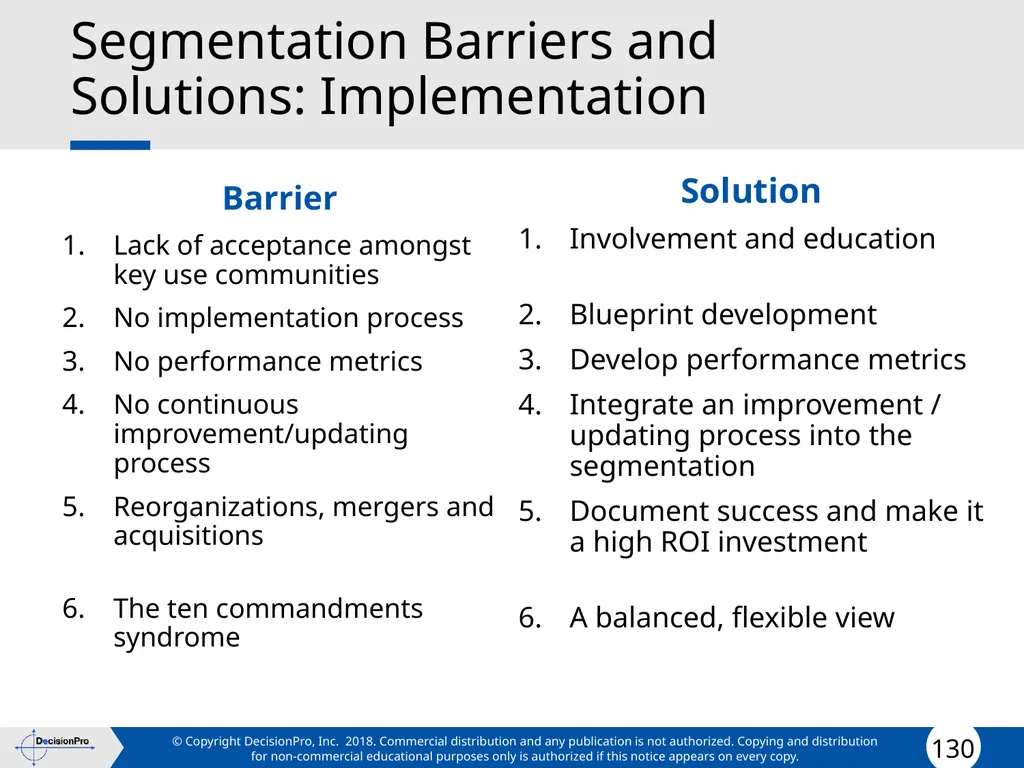
Segmentation Barriers and Solutions: Implementation Barrier
Lack of acceptance amongst key use communities
No implementation process
No performance metrics
No continuous improvement/updating process
Reorganizations, mergers and acquisitions
The ten commandments syndrome Solution
Involvement and education
Blueprint development
Develop performance metrics
Integrate an improvement / updating process into the segmentation
Document success and make it a high ROI investment
A balanced, flexible view<br>
Lack of acceptance amongst key use communities
No implementation process
No performance metrics
No continuous improvement/updating process
Reorganizations, mergers and acquisitions
The ten commandments syndrome Solution
Involvement and education
Blueprint development
Develop performance metrics
Integrate an improvement / updating process into the segmentation
Document success and make it a high ROI investment
A balanced, flexible view<br>
131
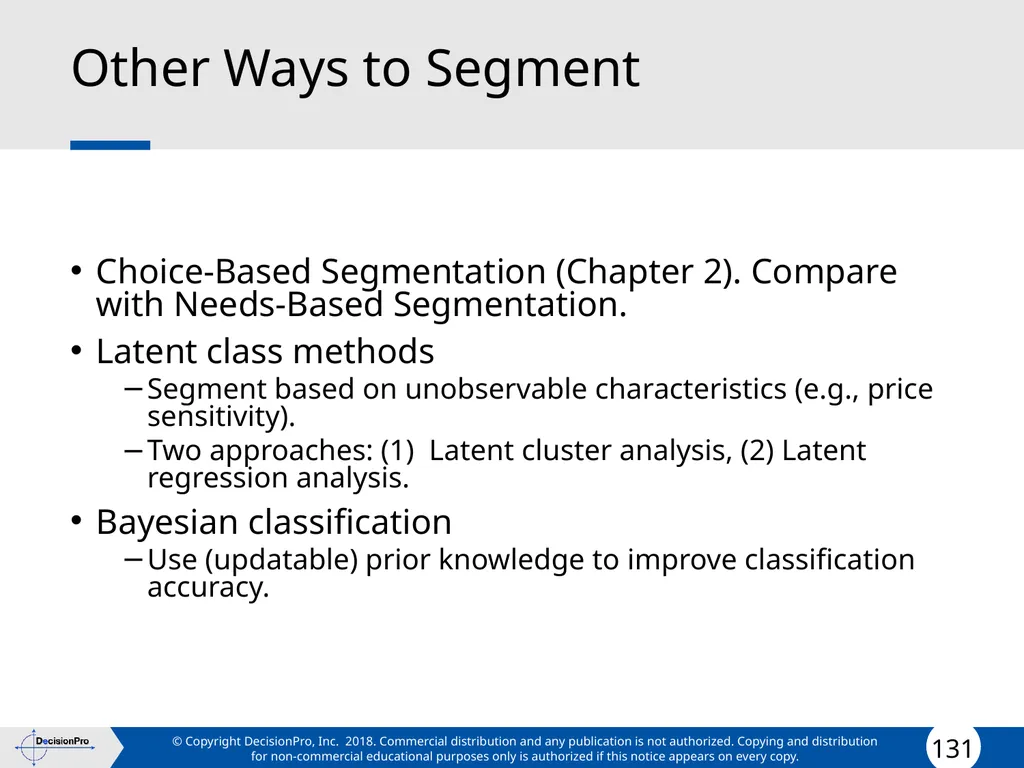
Other Ways to Segment Choice-Based Segmentation (Chapter 2). Compare with Needs-Based Segmentation.
Latent class methods
Segment based on unobservable characteristics (e.g., price sensitivity).
Two approaches: (1) Latent cluster analysis, (2) Latent regression analysis.
Bayesian classification
Use (updatable) prior knowledge to improve classification accuracy.<br>
Latent class methods
Segment based on unobservable characteristics (e.g., price sensitivity).
Two approaches: (1) Latent cluster analysis, (2) Latent regression analysis.
Bayesian classification
Use (updatable) prior knowledge to improve classification accuracy.<br>
132
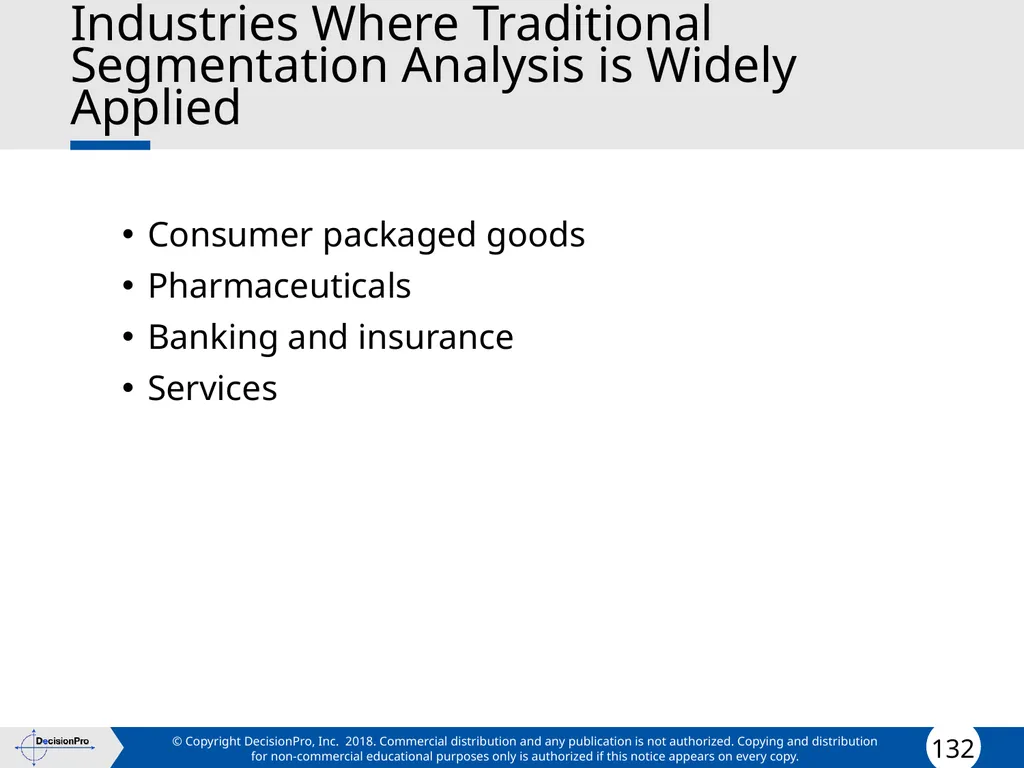
Industries Where Traditional Segmentation Analysis is Widely Applied Consumer packaged goods
Pharmaceuticals
Banking and insurance
Services<br>
Pharmaceuticals
Banking and insurance
Services<br>
133
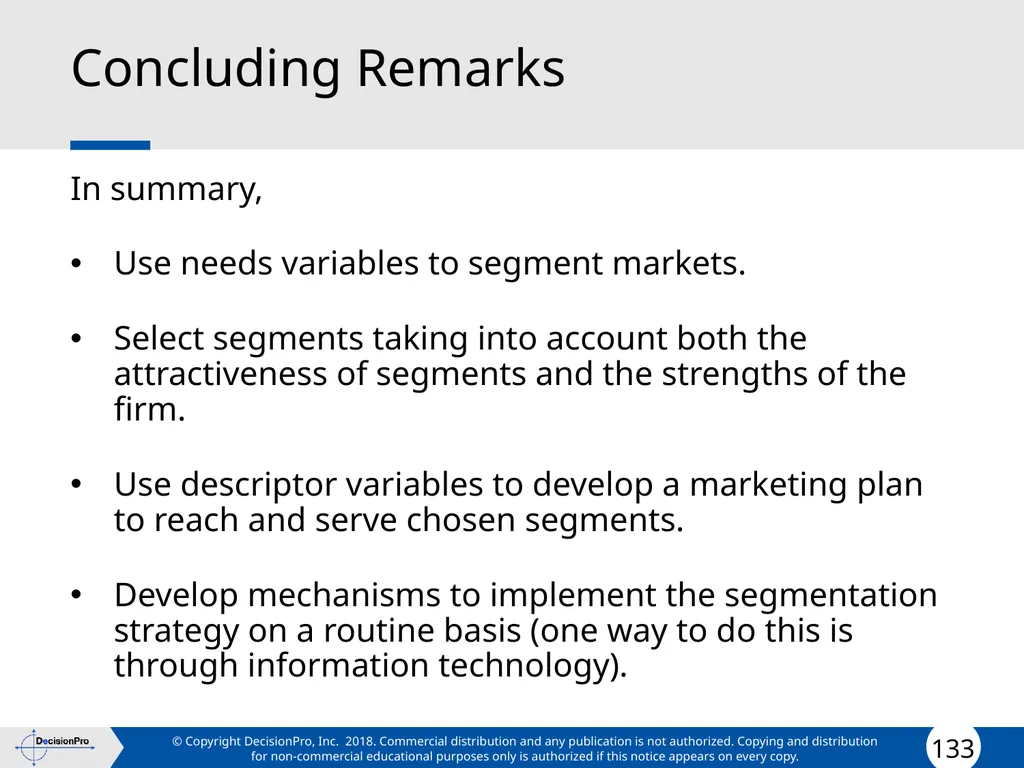
Concluding Remarks In summary,
Use needs variables to segment markets.
Select segments taking into account both the attractiveness of segments and the strengths of the firm.
Use descriptor variables to develop a marketing plan to reach and serve chosen segments.
Develop mechanisms to implement the segmentation strategy on a routine basis (one way to do this is through information technology).<br>
Use needs variables to segment markets.
Select segments taking into account both the attractiveness of segments and the strengths of the firm.
Use descriptor variables to develop a marketing plan to reach and serve chosen segments.
Develop mechanisms to implement the segmentation strategy on a routine basis (one way to do this is through information technology).<br>