
SEPLAT ENERGY EQUITY RESEARCH REPORT BY: - BAKARE
SN
Published · 19 slides · 0 views

1 / 1
Description
SEPLAT ENERGY EQUITY RESEARCH REPORT BY: - BAKARE NOAH O. 25TH JULY, 2022. W: www.giftedanalysts.com E: infogiftedanalysts.com SEPLAT ENERGY GIFTED ANALYSTS EQUITY RESEARCH Financial Analysis Topline Growth Beyond Pre-Pandemic Levels in
Related Topics
Share
Embed code
Download this presentation From Below
"SEPLAT ENERGY EQUITY RESEARCH REPORT BY: - BAKARE" is the property of its rightful owner. Permission is granted to download and print the materials on this website for personal, non-commercial use only, and to display it on your personal computer provided you do not modify the materials and that you retain all copyright notices contained in the materials. By downloading content from our website, you accept the terms of this agreement.
Presentation Transcript
01
SEPLAT ENERGY EQUITY RESEARCH
REPORT BY: -
BAKARE NOAH O.
25TH JULY, 2022.
W: www.giftedanalysts.com | E: info@giftedanalysts.com SEPLAT ENERGY GIFTED ANALYSTS
EQUITY RESEARCH<br>
REPORT BY: -
BAKARE NOAH O.
25TH JULY, 2022.
W: www.giftedanalysts.com | E: info@giftedanalysts.com SEPLAT ENERGY GIFTED ANALYSTS
EQUITY RESEARCH<br>
02
Financial Analysis
Topline Growth Beyond Pre-Pandemic Levels in FY’21
Historical: -
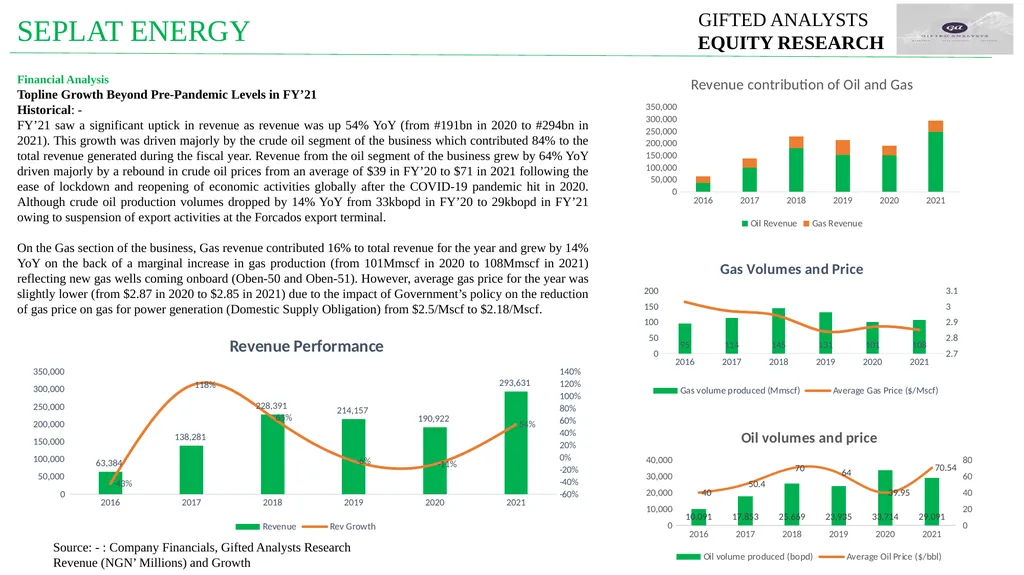
FY’21 saw a significant uptick in revenue as revenue was up 54% YoY (from #191bn in 2020 to #294bn in 2021). This growth was driven majorly by the crude oil segment of the business which contributed 84% to the total revenue generated during the fiscal year. Revenue from the oil segment of the business grew by 64% YoY driven majorly by a rebound in crude oil prices from an average of $39 in FY’20 to $71 in 2021 following the ease of lockdown and reopening of economic activities globally after the COVID-19 pandemic hit in 2020. Although crude oil production volumes dropped by 14% YoY from 33kbopd in FY’20 to 29kbopd in FY’21 owing to suspension of export activities at the Forcados export terminal.
On the Gas section of the business, Gas revenue contributed 16% to total revenue for the year and grew by 14% YoY on the back of a marginal increase in gas production (from 101Mmscf in 2020 to 108Mmscf in 2021) reflecting new gas wells coming onboard (Oben-50 and Oben-51). However, average gas price for the year was slightly lower (from $2.87 in 2020 to $2.85 in 2021) due to the impact of Government’s policy on the reduction of gas price on gas for power generation (Domestic Supply Obligation) from $2.5/Mscf to $2.18/Mscf. Source: - : Company Financials, Gifted Analysts Research
Revenue (NGN’ Millions) and Growth SEPLAT ENERGY GIFTED ANALYSTS
EQUITY RESEARCH<br>
Topline Growth Beyond Pre-Pandemic Levels in FY’21
Historical: -
FY’21 saw a significant uptick in revenue as revenue was up 54% YoY (from #191bn in 2020 to #294bn in 2021). This growth was driven majorly by the crude oil segment of the business which contributed 84% to the total revenue generated during the fiscal year. Revenue from the oil segment of the business grew by 64% YoY driven majorly by a rebound in crude oil prices from an average of $39 in FY’20 to $71 in 2021 following the ease of lockdown and reopening of economic activities globally after the COVID-19 pandemic hit in 2020. Although crude oil production volumes dropped by 14% YoY from 33kbopd in FY’20 to 29kbopd in FY’21 owing to suspension of export activities at the Forcados export terminal.
On the Gas section of the business, Gas revenue contributed 16% to total revenue for the year and grew by 14% YoY on the back of a marginal increase in gas production (from 101Mmscf in 2020 to 108Mmscf in 2021) reflecting new gas wells coming onboard (Oben-50 and Oben-51). However, average gas price for the year was slightly lower (from $2.87 in 2020 to $2.85 in 2021) due to the impact of Government’s policy on the reduction of gas price on gas for power generation (Domestic Supply Obligation) from $2.5/Mscf to $2.18/Mscf. Source: - : Company Financials, Gifted Analysts Research
Revenue (NGN’ Millions) and Growth SEPLAT ENERGY GIFTED ANALYSTS
EQUITY RESEARCH<br>
03
Financial Analysis
Forecast: - Global Dynamics Supports Topline Growth
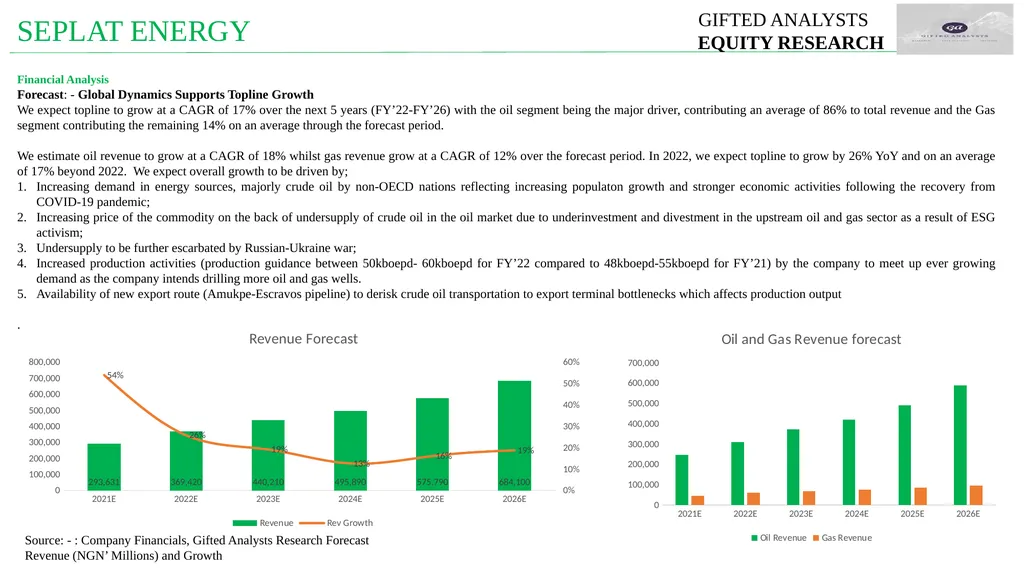
We expect topline to grow at a CAGR of 17% over the next 5 years (FY’22-FY’26) with the oil segment being the major driver, contributing an average of 86% to total revenue and the Gas segment contributing the remaining 14% on an average through the forecast period.
We estimate oil revenue to grow at a CAGR of 18% whilst gas revenue grow at a CAGR of 12% over the forecast period. In 2022, we expect topline to grow by 26% YoY and on an average of 17% beyond 2022. We expect overall growth to be driven by;
Increasing demand in energy sources, majorly crude oil by non-OECD nations reflecting increasing populaton growth and stronger economic activities following the recovery from COVID-19 pandemic;
Increasing price of the commodity on the back of undersupply of crude oil in the oil market due to underinvestment and divestment in the upstream oil and gas sector as a result of ESG activism;
Undersupply to be further escarbated by Russian-Ukraine war;
Increased production activities (production guidance between 50kboepd- 60kboepd for FY’22 compared to 48kboepd-55kboepd for FY’21) by the company to meet up ever growing demand as the company intends drilling more oil and gas wells.
Availability of new export route (Amukpe-Escravos pipeline) to derisk crude oil transportation to export terminal bottlenecks which affects production output
. Source: - : Company Financials, Gifted Analysts Research Forecast
Revenue (NGN’ Millions) and Growth SEPLAT ENERGY GIFTED ANALYSTS
EQUITY RESEARCH<br>
Forecast: - Global Dynamics Supports Topline Growth
We expect topline to grow at a CAGR of 17% over the next 5 years (FY’22-FY’26) with the oil segment being the major driver, contributing an average of 86% to total revenue and the Gas segment contributing the remaining 14% on an average through the forecast period.
We estimate oil revenue to grow at a CAGR of 18% whilst gas revenue grow at a CAGR of 12% over the forecast period. In 2022, we expect topline to grow by 26% YoY and on an average of 17% beyond 2022. We expect overall growth to be driven by;
Increasing demand in energy sources, majorly crude oil by non-OECD nations reflecting increasing populaton growth and stronger economic activities following the recovery from COVID-19 pandemic;
Increasing price of the commodity on the back of undersupply of crude oil in the oil market due to underinvestment and divestment in the upstream oil and gas sector as a result of ESG activism;
Undersupply to be further escarbated by Russian-Ukraine war;
Increased production activities (production guidance between 50kboepd- 60kboepd for FY’22 compared to 48kboepd-55kboepd for FY’21) by the company to meet up ever growing demand as the company intends drilling more oil and gas wells.
Availability of new export route (Amukpe-Escravos pipeline) to derisk crude oil transportation to export terminal bottlenecks which affects production output
. Source: - : Company Financials, Gifted Analysts Research Forecast
Revenue (NGN’ Millions) and Growth SEPLAT ENERGY GIFTED ANALYSTS
EQUITY RESEARCH<br>
04
Financial Analysis
Higher Revenue Supports Operating Performance
Historical: -
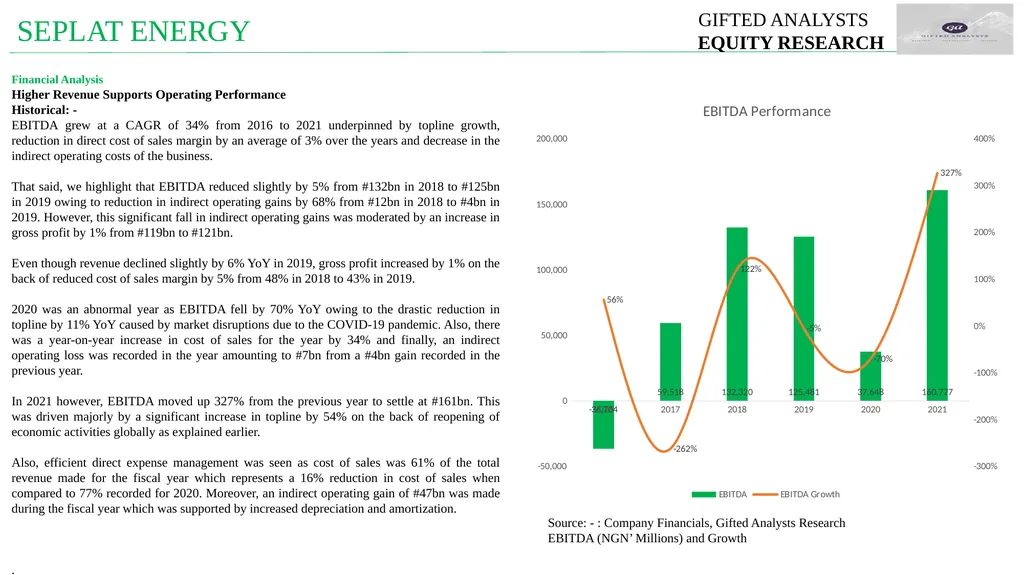
EBITDA grew at a CAGR of 34% from 2016 to 2021 underpinned by topline growth, reduction in direct cost of sales margin by an average of 3% over the years and decrease in the indirect operating costs of the business.
That said, we highlight that EBITDA reduced slightly by 5% from #132bn in 2018 to #125bn in 2019 owing to reduction in indirect operating gains by 68% from #12bn in 2018 to #4bn in 2019. However, this significant fall in indirect operating gains was moderated by an increase in gross profit by 1% from #119bn to #121bn.
Even though revenue declined slightly by 6% YoY in 2019, gross profit increased by 1% on the back of reduced cost of sales margin by 5% from 48% in 2018 to 43% in 2019.
2020 was an abnormal year as EBITDA fell by 70% YoY owing to the drastic reduction in topline by 11% YoY caused by market disruptions due to the COVID-19 pandemic. Also, there was a year-on-year increase in cost of sales for the year by 34% and finally, an indirect operating loss was recorded in the year amounting to #7bn from a #4bn gain recorded in the previous year.
In 2021 however, EBITDA moved up 327% from the previous year to settle at #161bn. This was driven majorly by a significant increase in topline by 54% on the back of reopening of economic activities globally as explained earlier.
Also, efficient direct expense management was seen as cost of sales was 61% of the total revenue made for the fiscal year which represents a 16% reduction in cost of sales when compared to 77% recorded for 2020. Moreover, an indirect operating gain of #47bn was made during the fiscal year which was supported by increased depreciation and amortization.
. Source: - : Company Financials, Gifted Analysts Research
EBITDA (NGN’ Millions) and Growth SEPLAT ENERGY GIFTED ANALYSTS
EQUITY RESEARCH<br>
Higher Revenue Supports Operating Performance
Historical: -
EBITDA grew at a CAGR of 34% from 2016 to 2021 underpinned by topline growth, reduction in direct cost of sales margin by an average of 3% over the years and decrease in the indirect operating costs of the business.
That said, we highlight that EBITDA reduced slightly by 5% from #132bn in 2018 to #125bn in 2019 owing to reduction in indirect operating gains by 68% from #12bn in 2018 to #4bn in 2019. However, this significant fall in indirect operating gains was moderated by an increase in gross profit by 1% from #119bn to #121bn.
Even though revenue declined slightly by 6% YoY in 2019, gross profit increased by 1% on the back of reduced cost of sales margin by 5% from 48% in 2018 to 43% in 2019.
2020 was an abnormal year as EBITDA fell by 70% YoY owing to the drastic reduction in topline by 11% YoY caused by market disruptions due to the COVID-19 pandemic. Also, there was a year-on-year increase in cost of sales for the year by 34% and finally, an indirect operating loss was recorded in the year amounting to #7bn from a #4bn gain recorded in the previous year.
In 2021 however, EBITDA moved up 327% from the previous year to settle at #161bn. This was driven majorly by a significant increase in topline by 54% on the back of reopening of economic activities globally as explained earlier.
Also, efficient direct expense management was seen as cost of sales was 61% of the total revenue made for the fiscal year which represents a 16% reduction in cost of sales when compared to 77% recorded for 2020. Moreover, an indirect operating gain of #47bn was made during the fiscal year which was supported by increased depreciation and amortization.
. Source: - : Company Financials, Gifted Analysts Research
EBITDA (NGN’ Millions) and Growth SEPLAT ENERGY GIFTED ANALYSTS
EQUITY RESEARCH<br>
05
Financial Analysis
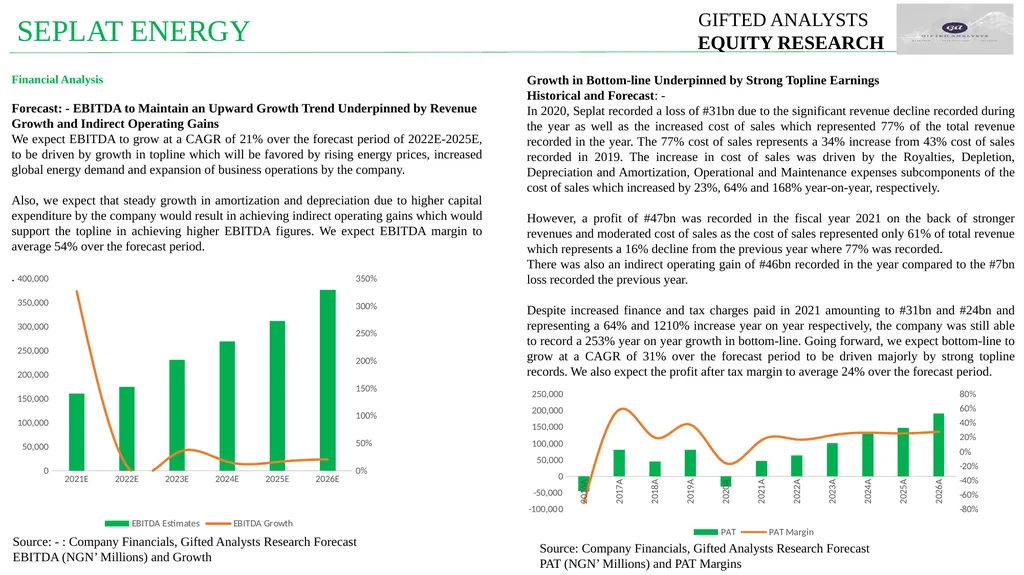
Forecast: - EBITDA to Maintain an Upward Growth Trend Underpinned by Revenue Growth and Indirect Operating Gains
We expect EBITDA to grow at a CAGR of 21% over the forecast period of 2022E-2025E, to be driven by growth in topline which will be favored by rising energy prices, increased global energy demand and expansion of business operations by the company.
Also, we expect that steady growth in amortization and depreciation due to higher capital expenditure by the company would result in achieving indirect operating gains which would support the topline in achieving higher EBITDA figures. We expect EBITDA margin to average 54% over the forecast period.
. Growth in Bottom-line Underpinned by Strong Topline Earnings
Historical and Forecast: -
In 2020, Seplat recorded a loss of #31bn due to the significant revenue decline recorded during the year as well as the increased cost of sales which represented 77% of the total revenue recorded in the year. The 77% cost of sales represents a 34% increase from 43% cost of sales recorded in 2019. The increase in cost of sales was driven by the Royalties, Depletion, Depreciation and Amortization, Operational and Maintenance expenses subcomponents of the cost of sales which increased by 23%, 64% and 168% year-on-year, respectively.
However, a profit of #47bn was recorded in the fiscal year 2021 on the back of stronger revenues and moderated cost of sales as the cost of sales represented only 61% of total revenue which represents a 16% decline from the previous year where 77% was recorded.
There was also an indirect operating gain of #46bn recorded in the year compared to the #7bn loss recorded the previous year.
Despite increased finance and tax charges paid in 2021 amounting to #31bn and #24bn and representing a 64% and 1210% increase year on year respectively, the company was still able to record a 253% year on year growth in bottom-line. Going forward, we expect bottom-line to grow at a CAGR of 31% over the forecast period to be driven majorly by strong topline records. We also expect the profit after tax margin to average 24% over the forecast period. Source: - : Company Financials, Gifted Analysts Research Forecast
EBITDA (NGN’ Millions) and Growth SEPLAT ENERGY GIFTED ANALYSTS
EQUITY RESEARCH Source: Company Financials, Gifted Analysts Research Forecast
PAT (NGN’ Millions) and PAT Margins<br>
Forecast: - EBITDA to Maintain an Upward Growth Trend Underpinned by Revenue Growth and Indirect Operating Gains
We expect EBITDA to grow at a CAGR of 21% over the forecast period of 2022E-2025E, to be driven by growth in topline which will be favored by rising energy prices, increased global energy demand and expansion of business operations by the company.
Also, we expect that steady growth in amortization and depreciation due to higher capital expenditure by the company would result in achieving indirect operating gains which would support the topline in achieving higher EBITDA figures. We expect EBITDA margin to average 54% over the forecast period.
. Growth in Bottom-line Underpinned by Strong Topline Earnings
Historical and Forecast: -
In 2020, Seplat recorded a loss of #31bn due to the significant revenue decline recorded during the year as well as the increased cost of sales which represented 77% of the total revenue recorded in the year. The 77% cost of sales represents a 34% increase from 43% cost of sales recorded in 2019. The increase in cost of sales was driven by the Royalties, Depletion, Depreciation and Amortization, Operational and Maintenance expenses subcomponents of the cost of sales which increased by 23%, 64% and 168% year-on-year, respectively.
However, a profit of #47bn was recorded in the fiscal year 2021 on the back of stronger revenues and moderated cost of sales as the cost of sales represented only 61% of total revenue which represents a 16% decline from the previous year where 77% was recorded.
There was also an indirect operating gain of #46bn recorded in the year compared to the #7bn loss recorded the previous year.
Despite increased finance and tax charges paid in 2021 amounting to #31bn and #24bn and representing a 64% and 1210% increase year on year respectively, the company was still able to record a 253% year on year growth in bottom-line. Going forward, we expect bottom-line to grow at a CAGR of 31% over the forecast period to be driven majorly by strong topline records. We also expect the profit after tax margin to average 24% over the forecast period. Source: - : Company Financials, Gifted Analysts Research Forecast
EBITDA (NGN’ Millions) and Growth SEPLAT ENERGY GIFTED ANALYSTS
EQUITY RESEARCH Source: Company Financials, Gifted Analysts Research Forecast
PAT (NGN’ Millions) and PAT Margins<br>
06
Financial Analysis
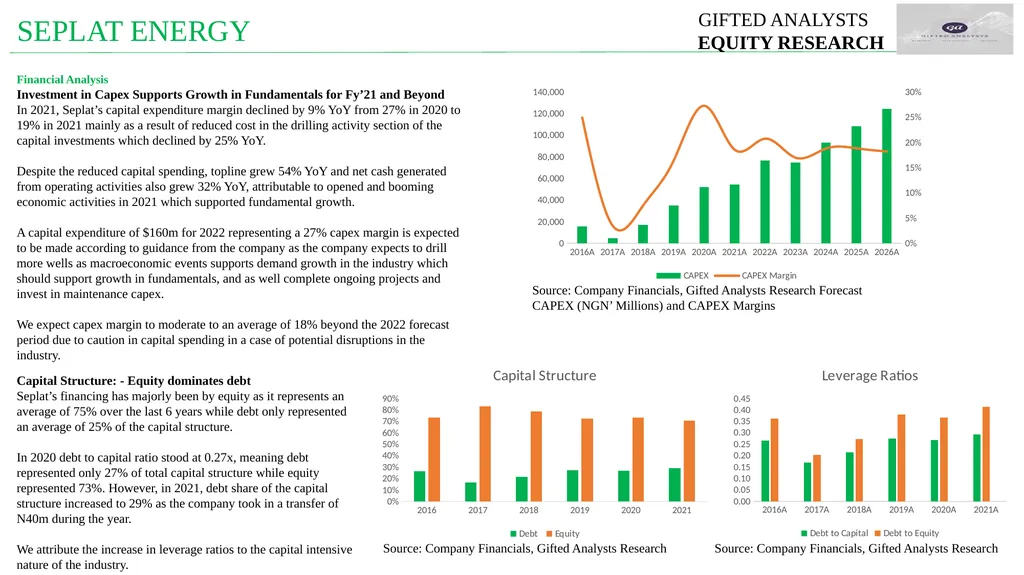
Investment in Capex Supports Growth in Fundamentals for Fy’21 and Beyond
In 2021, Seplat’s capital expenditure margin declined by 9% YoY from 27% in 2020 to 19% in 2021 mainly as a result of reduced cost in the drilling activity section of the capital investments which declined by 25% YoY.
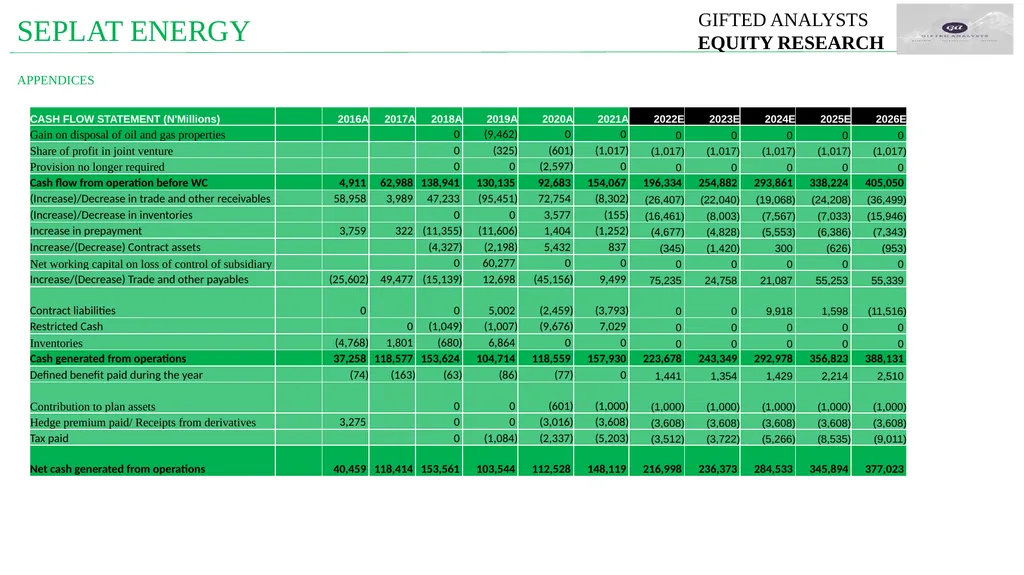
Despite the reduced capital spending, topline grew 54% YoY and net cash generated from operating activities also grew 32% YoY, attributable to opened and booming economic activities in 2021 which supported fundamental growth.
A capital expenditure of $160m for 2022 representing a 27% capex margin is expected to be made according to guidance from the company as the company expects to drill more wells as macroeconomic events supports demand growth in the industry which should support growth in fundamentals, and as well complete ongoing projects and invest in maintenance capex.
We expect capex margin to moderate to an average of 18% beyond the 2022 forecast period due to caution in capital spending in a case of potential disruptions in the industry. SEPLAT ENERGY GIFTED ANALYSTS
EQUITY RESEARCH Source: Company Financials, Gifted Analysts Research Forecast
CAPEX (NGN’ Millions) and CAPEX Margins Capital Structure: - Equity dominates debt
Seplat’s financing has majorly been by equity as it represents an average of 75% over the last 6 years while debt only represented an average of 25% of the capital structure.
In 2020 debt to capital ratio stood at 0.27x, meaning debt represented only 27% of total capital structure while equity represented 73%. However, in 2021, debt share of the capital structure increased to 29% as the company took in a transfer of N40m during the year.
We attribute the increase in leverage ratios to the capital intensive nature of the industry. Source: Company Financials, Gifted Analysts Research Source: Company Financials, Gifted Analysts Research<br>
Investment in Capex Supports Growth in Fundamentals for Fy’21 and Beyond
In 2021, Seplat’s capital expenditure margin declined by 9% YoY from 27% in 2020 to 19% in 2021 mainly as a result of reduced cost in the drilling activity section of the capital investments which declined by 25% YoY.
Despite the reduced capital spending, topline grew 54% YoY and net cash generated from operating activities also grew 32% YoY, attributable to opened and booming economic activities in 2021 which supported fundamental growth.
A capital expenditure of $160m for 2022 representing a 27% capex margin is expected to be made according to guidance from the company as the company expects to drill more wells as macroeconomic events supports demand growth in the industry which should support growth in fundamentals, and as well complete ongoing projects and invest in maintenance capex.
We expect capex margin to moderate to an average of 18% beyond the 2022 forecast period due to caution in capital spending in a case of potential disruptions in the industry. SEPLAT ENERGY GIFTED ANALYSTS
EQUITY RESEARCH Source: Company Financials, Gifted Analysts Research Forecast
CAPEX (NGN’ Millions) and CAPEX Margins Capital Structure: - Equity dominates debt
Seplat’s financing has majorly been by equity as it represents an average of 75% over the last 6 years while debt only represented an average of 25% of the capital structure.
In 2020 debt to capital ratio stood at 0.27x, meaning debt represented only 27% of total capital structure while equity represented 73%. However, in 2021, debt share of the capital structure increased to 29% as the company took in a transfer of N40m during the year.
We attribute the increase in leverage ratios to the capital intensive nature of the industry. Source: Company Financials, Gifted Analysts Research Source: Company Financials, Gifted Analysts Research<br>
07
Valuation
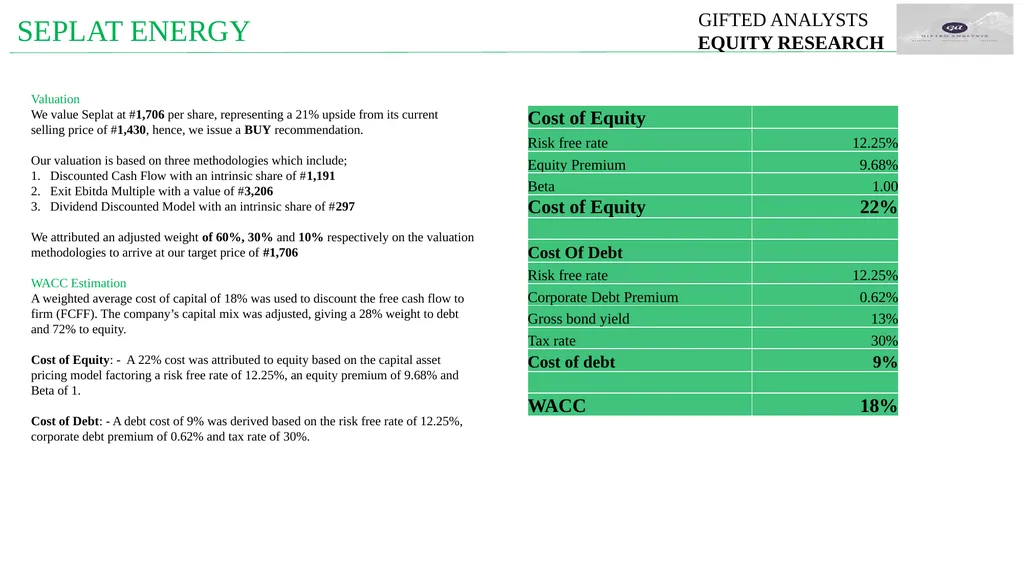
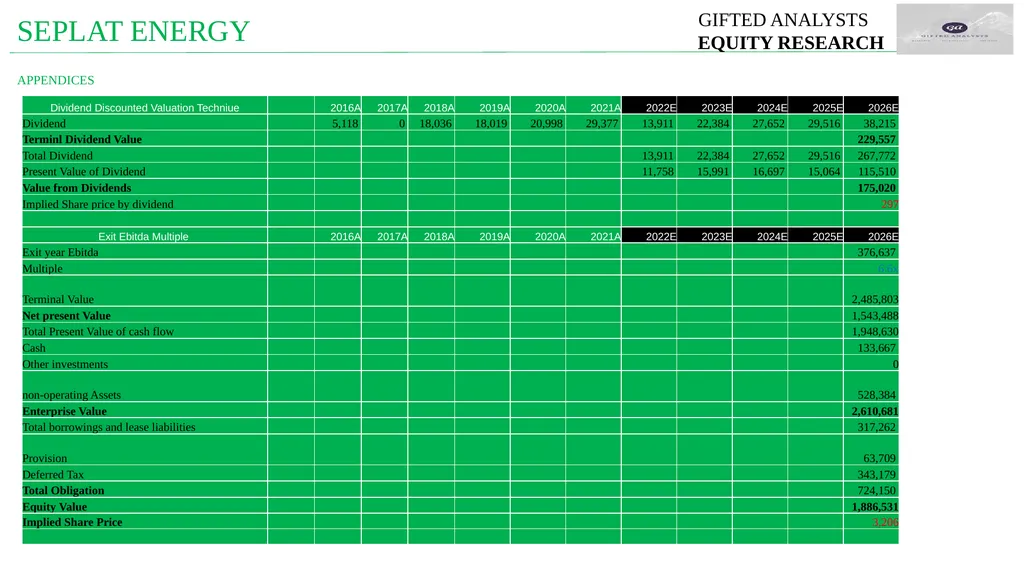
We value Seplat at #1,706 per share, representing a 21% upside from its current selling price of #1,430, hence, we issue a BUY recommendation.
Our valuation is based on three methodologies which include;
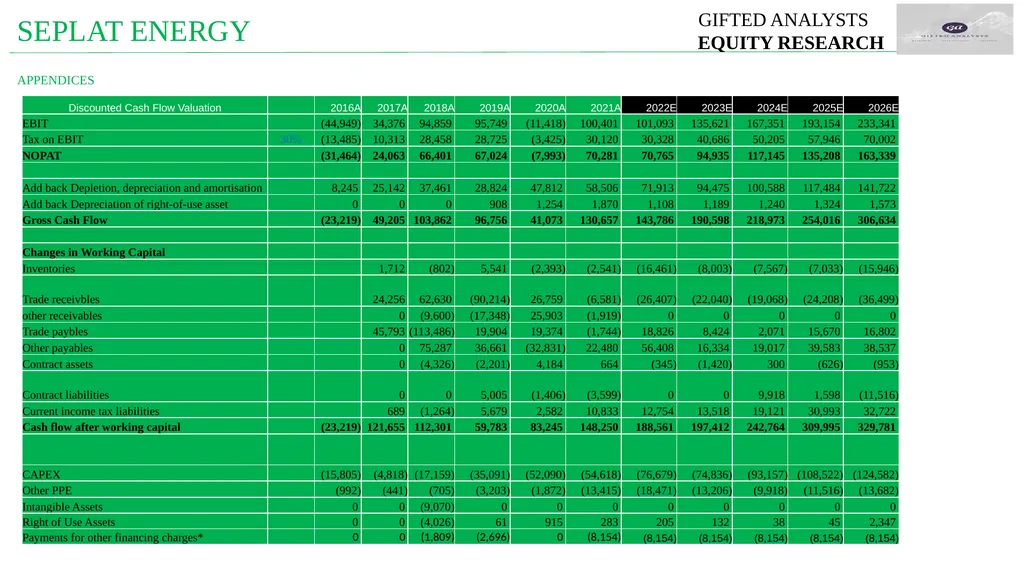
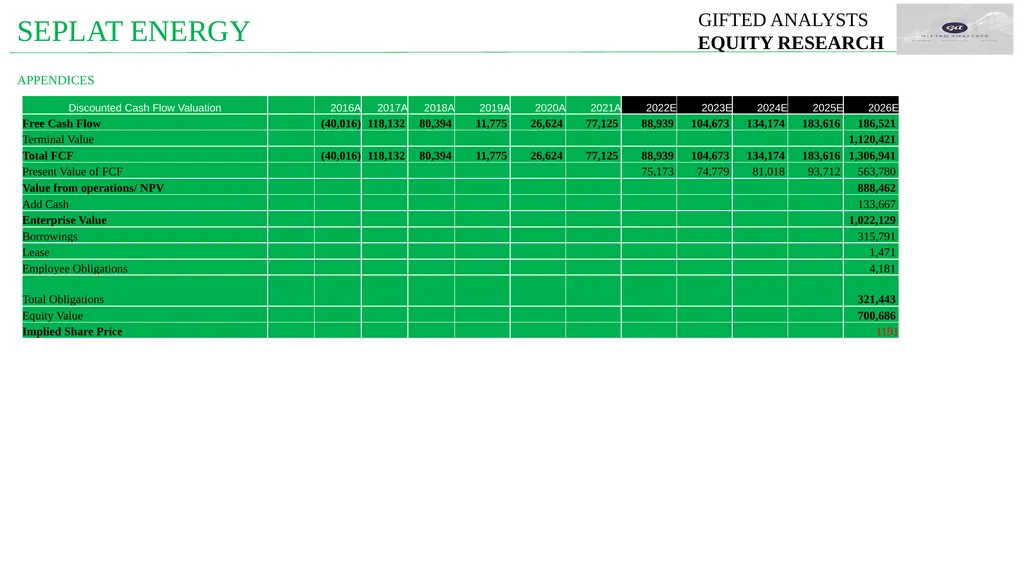
Discounted Cash Flow with an intrinsic share of #1,191
Exit Ebitda Multiple with a value of #3,206
Dividend Discounted Model with an intrinsic share of #297
We attributed an adjusted weight of 60%, 30% and 10% respectively on the valuation methodologies to arrive at our target price of #1,706
WACC Estimation
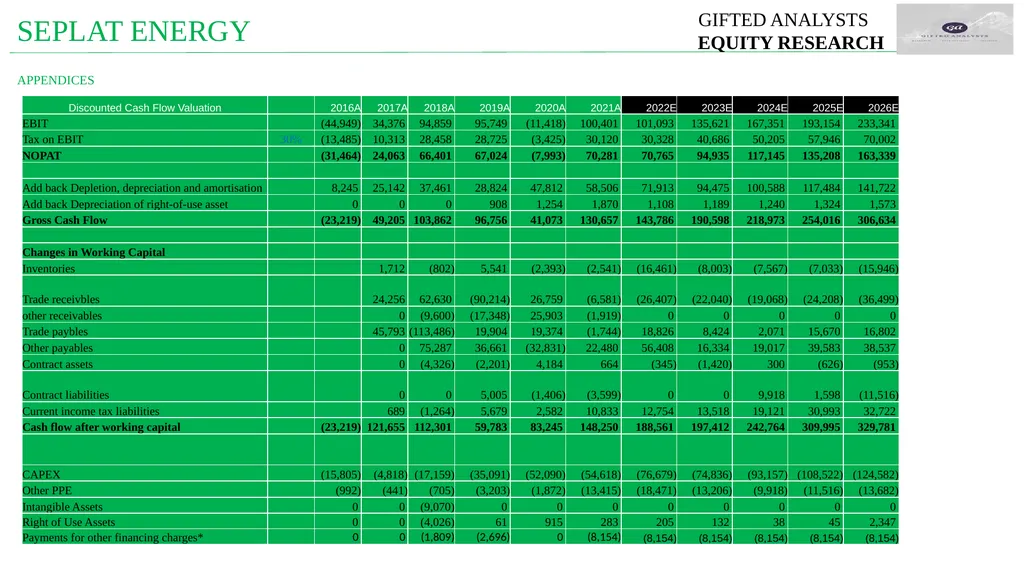
A weighted average cost of capital of 18% was used to discount the free cash flow to firm (FCFF). The company’s capital mix was adjusted, giving a 28% weight to debt and 72% to equity.
Cost of Equity: - A 22% cost was attributed to equity based on the capital asset pricing model factoring a risk free rate of 12.25%, an equity premium of 9.68% and Beta of 1.
Cost of Debt: - A debt cost of 9% was derived based on the risk free rate of 12.25%, corporate debt premium of 0.62% and tax rate of 30%. SEPLAT ENERGY GIFTED ANALYSTS
EQUITY RESEARCH<br>
We value Seplat at #1,706 per share, representing a 21% upside from its current selling price of #1,430, hence, we issue a BUY recommendation.
Our valuation is based on three methodologies which include;
Discounted Cash Flow with an intrinsic share of #1,191
Exit Ebitda Multiple with a value of #3,206
Dividend Discounted Model with an intrinsic share of #297
We attributed an adjusted weight of 60%, 30% and 10% respectively on the valuation methodologies to arrive at our target price of #1,706
WACC Estimation
A weighted average cost of capital of 18% was used to discount the free cash flow to firm (FCFF). The company’s capital mix was adjusted, giving a 28% weight to debt and 72% to equity.
Cost of Equity: - A 22% cost was attributed to equity based on the capital asset pricing model factoring a risk free rate of 12.25%, an equity premium of 9.68% and Beta of 1.
Cost of Debt: - A debt cost of 9% was derived based on the risk free rate of 12.25%, corporate debt premium of 0.62% and tax rate of 30%. SEPLAT ENERGY GIFTED ANALYSTS
EQUITY RESEARCH<br>
08
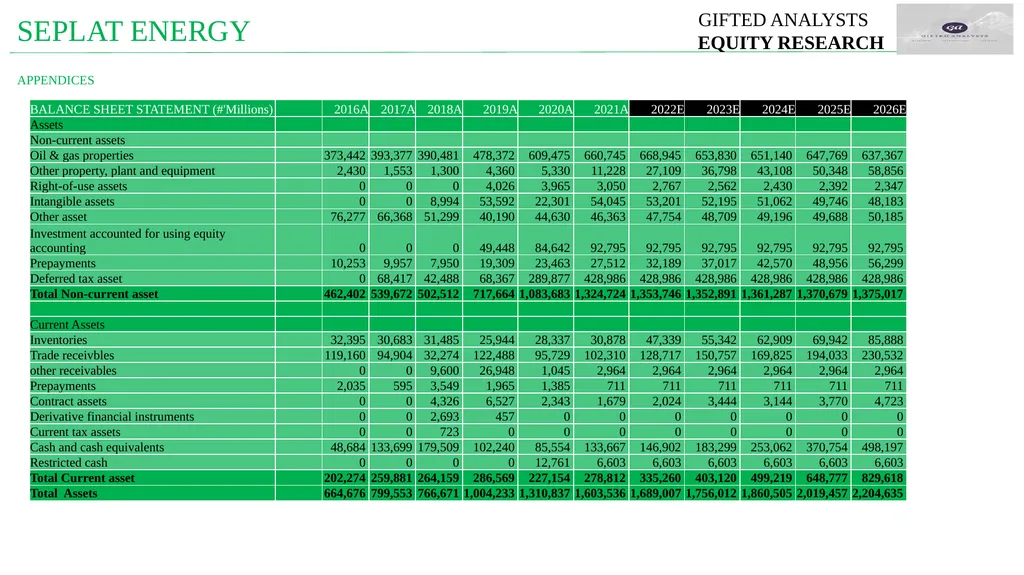
APPENDICES SEPLAT ENERGY GIFTED ANALYSTS
EQUITY RESEARCH<br>
EQUITY RESEARCH<br>
09
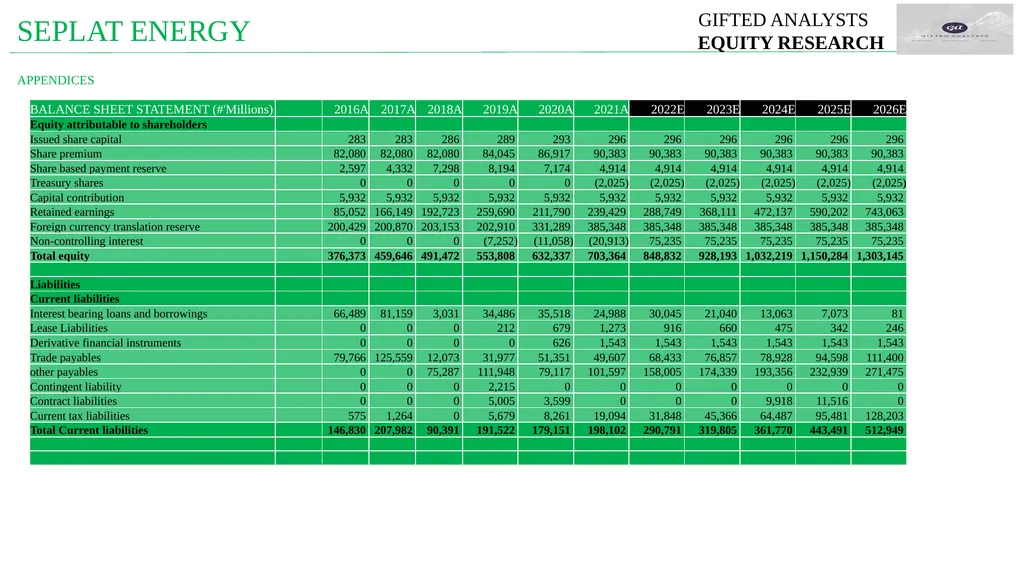
APPENDICES SEPLAT ENERGY GIFTED ANALYSTS
EQUITY RESEARCH<br>
EQUITY RESEARCH<br>
10
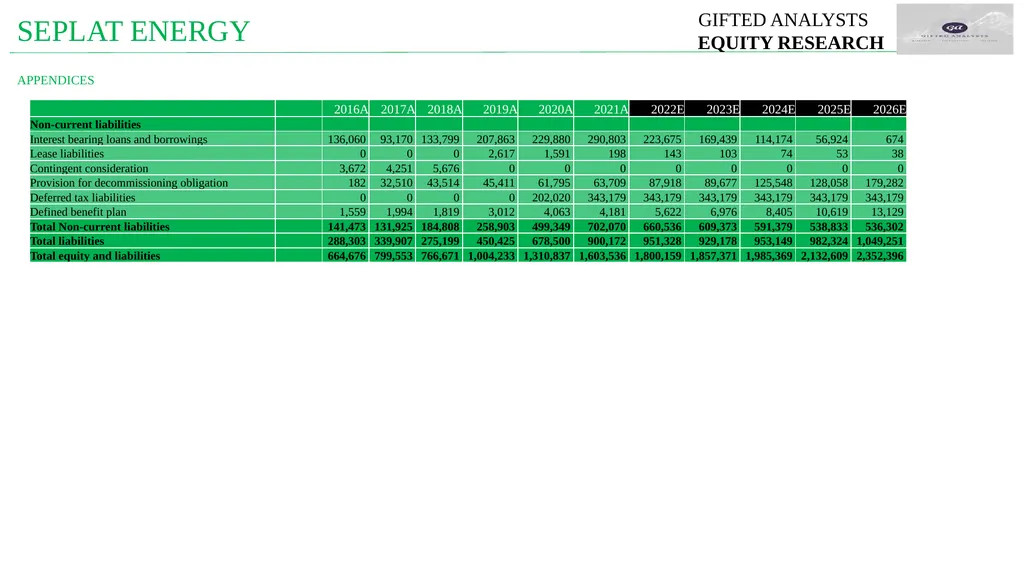
APPENDICES SEPLAT ENERGY GIFTED ANALYSTS
EQUITY RESEARCH<br>
EQUITY RESEARCH<br>
11
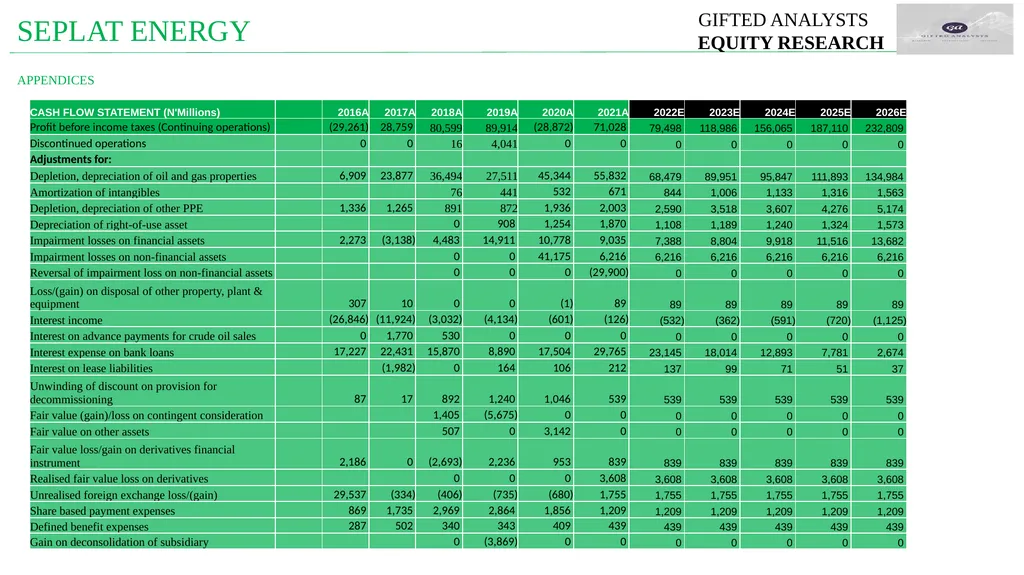
APPENDICES SEPLAT ENERGY GIFTED ANALYSTS
EQUITY RESEARCH<br>
EQUITY RESEARCH<br>
12
APPENDICES SEPLAT ENERGY GIFTED ANALYSTS
EQUITY RESEARCH<br>
EQUITY RESEARCH<br>
13
APPENDICES SEPLAT ENERGY GIFTED ANALYSTS
EQUITY RESEARCH<br>
EQUITY RESEARCH<br>
14
APPENDICES SEPLAT ENERGY GIFTED ANALYSTS
EQUITY RESEARCH<br>
EQUITY RESEARCH<br>
15
APPENDICES SEPLAT ENERGY GIFTED ANALYSTS
EQUITY RESEARCH<br>
EQUITY RESEARCH<br>
16
APPENDICES SEPLAT ENERGY GIFTED ANALYSTS
EQUITY RESEARCH<br>
EQUITY RESEARCH<br>
17
APPENDICES SEPLAT ENERGY GIFTED ANALYSTS
EQUITY RESEARCH<br>
EQUITY RESEARCH<br>
18
APPENDICES SEPLAT ENERGY GIFTED ANALYSTS
EQUITY RESEARCH<br>
EQUITY RESEARCH<br>
19
APPENDICES SEPLAT ENERGY GIFTED ANALYSTS
EQUITY RESEARCH<br>
EQUITY RESEARCH<br>