
SiO2 properties and applications. Thermal



Description: SiO2 properties and applications. Thermal oxidation basics. Manufacturing methods and equipment. Measurement methods (mechanical, optical, electrical). Deal-Grove model (linear parabolic model). Thin oxide growth, dependence on gas pressure
Related Topics
Download Presentation
"SiO2 properties and applications. Thermal" is the property of its rightful owner. Permission is granted to download and print the materials on this website for personal, non-commercial use only, and to display it on your personal computer provided you do not modify the materials and that you retain all copyright notices contained in the materials. By downloading content from our website, you accept the terms of this agreement.
Presentation Transcript
slide1. SiO2 properties and applications.
Thermal oxidation basics.
Manufacturing methods and equipment.
Measurement methods (mechanical, optical, electrical).
Deal-Grove model (linear parabolic model).
Thin oxide growth, dependence on gas pressure and crystal orientation
Cl-containing gas, 2D growth, substrate doping effect .
Interface charges, dopant redistribution. Textbook page 313. Chapter 6 Thermal oxidation and the Si/SiO2 interface 1 NE 343: Microfabrication and thin film technology
Instructor: Bo Cui, ECE, University of Waterloo; http://ece.uwaterloo.ca/~bcui/
Textbook: Silicon VLSI Technology by Plummer, Deal and Griffin<br>
slide2. As a young researcher at Fairchild Semiconductor, he “wrote the book” on SiO2 growth: the Deal-Grove model. http://en.wikipedia.org/wiki/Andrew_Grove Grove worked at Fairchild Semiconductor before becoming the fourth employee at the nascent Intel Corporation. He became Intel's president in 1979, its CEO in 1987, and its Chairman and CEO in 1997.
Grove is credited with having transformed Intel from a manufacturer of memory chips into one of the world's dominant producers of microprocessors. During his tenure as CEO, Grove oversaw a 4,500% increase in Intel's market capitalization from $4 billion to $197 billion, making it, at the time, the world's most valuable company. Time Magazine's Man of the Year (1997) Bruce Deal and Andrew Grove 2<br>
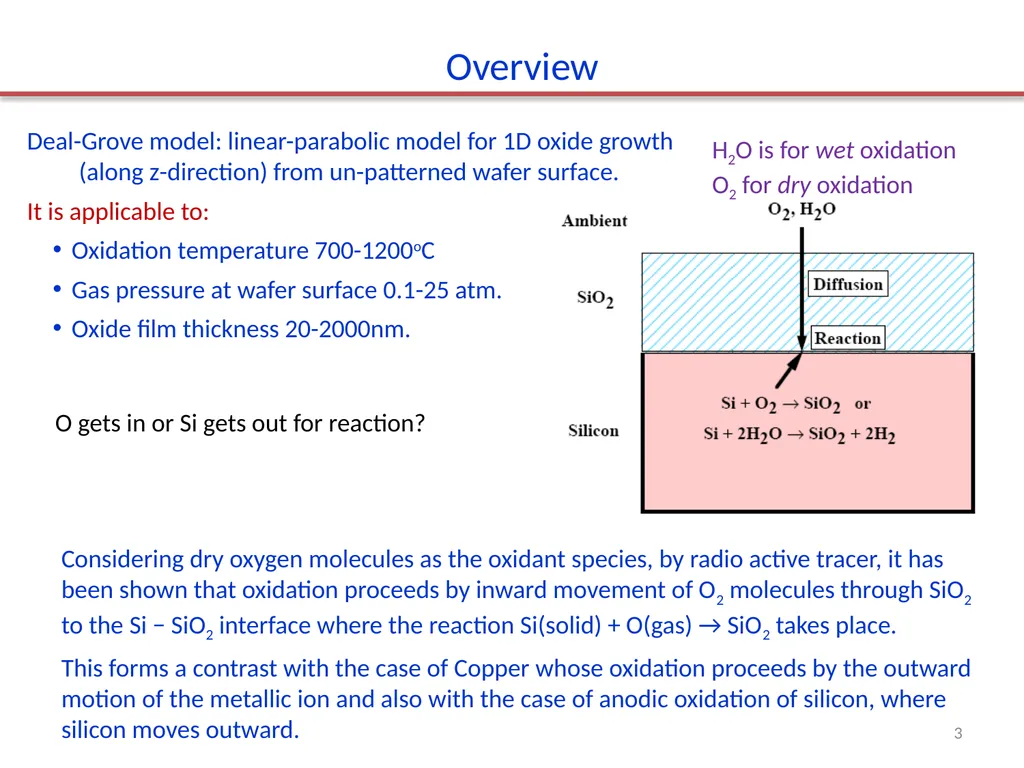
slide3. Overview Deal-Grove model: linear-parabolic model for 1D oxide growth (along z-direction) from un-patterned wafer surface.
It is applicable to:
Oxidation temperature 700-1200oC
Gas pressure at wafer surface 0.1-25 atm.
Oxide film thickness 20-2000nm. Considering dry oxygen molecules as the oxidant species, by radio active tracer, it has been shown that oxidation proceeds by inward movement of O2 molecules through SiO2 to the Si − SiO2 interface where the reaction Si(solid) + O(gas) → SiO2 takes place.
This forms a contrast with the case of Copper whose oxidation proceeds by the outward motion of the metallic ion and also with the case of anodic oxidation of silicon, where silicon moves outward. H2O is for wet oxidation
O2 for dry oxidation 3 O gets in or Si gets out for reaction?<br>
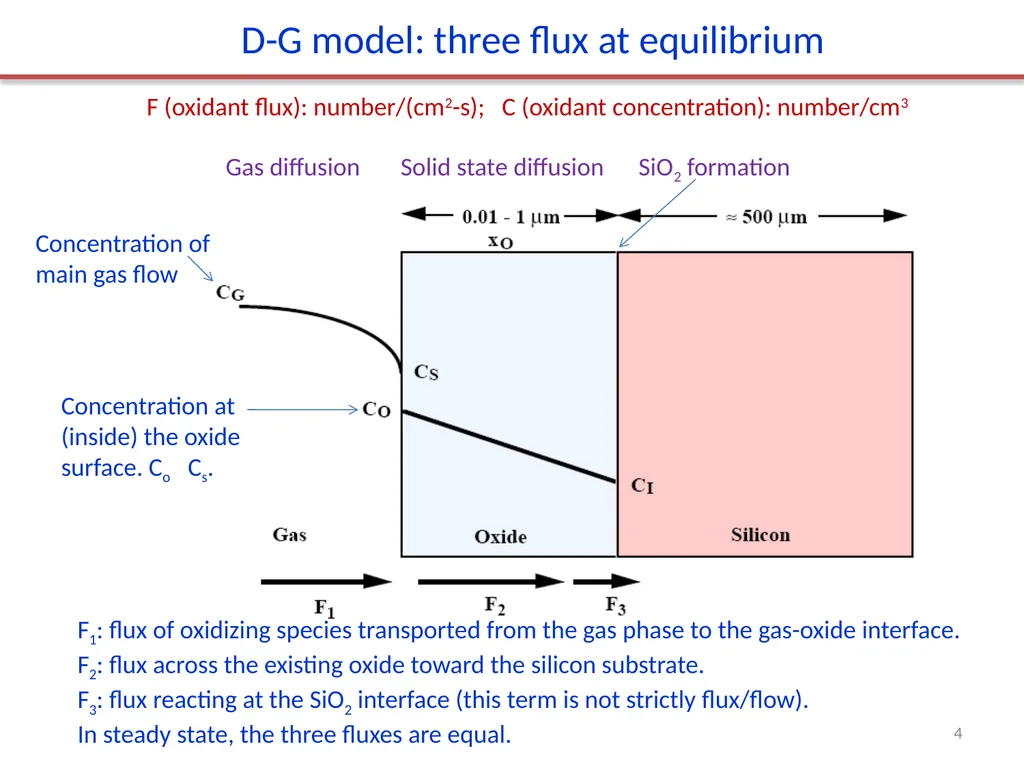
slide4. F (oxidant flux): number/(cm2-s); C (oxidant concentration): number/cm3 Cs > Co D-G model: three flux at equilibrium Gas diffusion Solid state diffusion SiO2 formation F1: flux of oxidizing species transported from the gas phase to the gas-oxide interface.
F2: flux across the existing oxide toward the silicon substrate.
F3: flux reacting at the SiO2 interface (this term is not strictly flux/flow).
In steady state, the three fluxes are equal. Concentration of main gas flow Concentration at (inside) the oxide surface. Co Cs. 4<br>
slide5. Define h=hg/HkT, C*=HkTCG=HPG,then For ideal gas, PSV=NKBT, so Cs=N/V=Ps/KT.
According to Henry’s law, the concentration of a gas species dissolved in a solid is proportional to the partial pressure of that species at the solid surface. So Co=HPs, where H is Henry’s constant.
(this is something similar to the law of segregation of dopant at an interface) D-G model: three flux at equilibrium hg is mass transfer coefficient in cm/sec. 5<br>
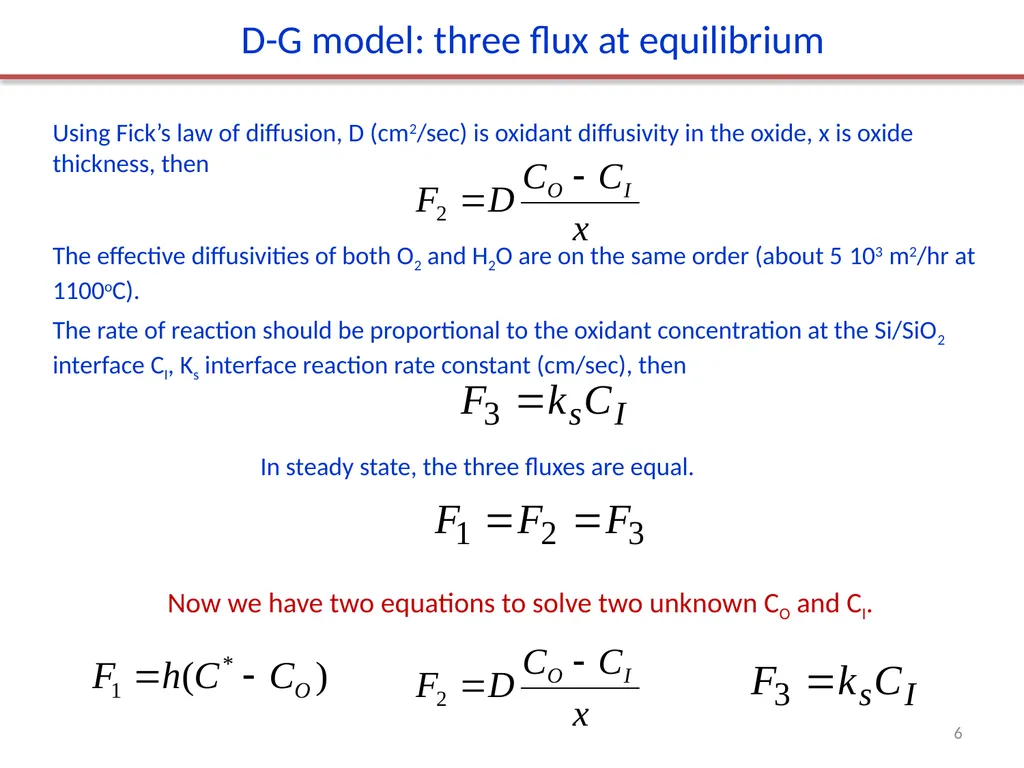
slide6. D-G model: three flux at equilibrium Using Fick’s law of diffusion, D (cm2/sec) is oxidant diffusivity in the oxide, x is oxide thickness, then
The effective diffusivities of both O2 and H2O are on the same order (about 5103m2/hr at 1100oC).
The rate of reaction should be proportional to the oxidant concentration at the Si/SiO2 interface CI, Ks interface reaction rate constant (cm/sec), then In steady state, the three fluxes are equal. Now we have two equations to solve two unknown CO and CI. 6<br>
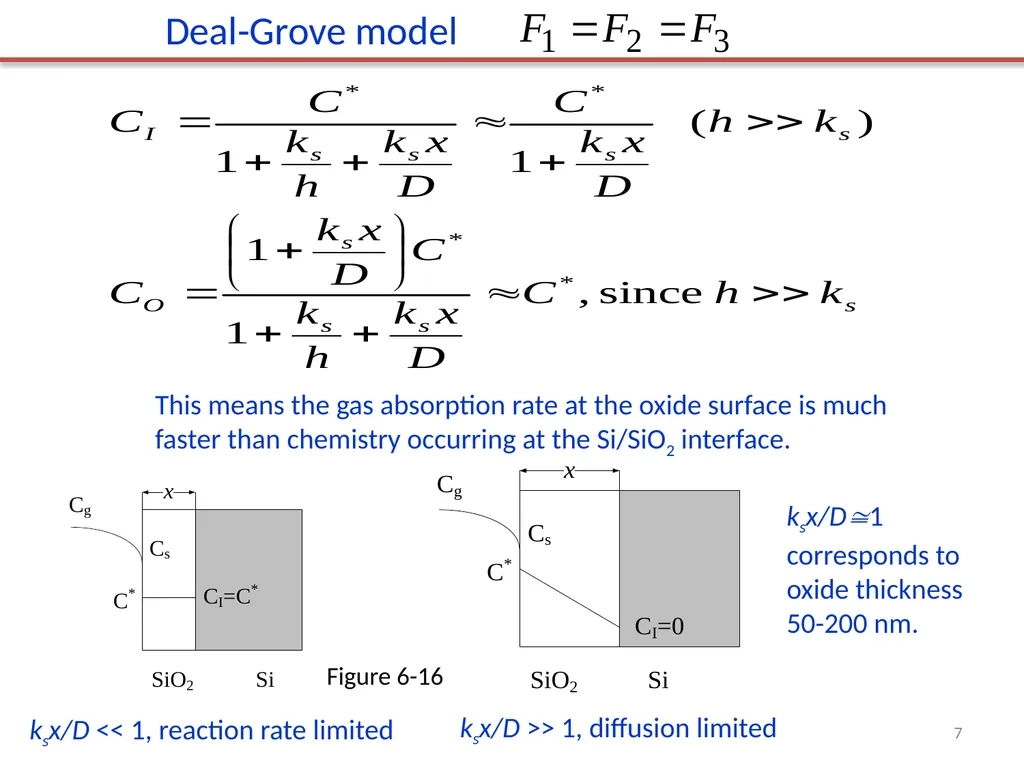
slide7. ksx/D << 1, reaction rate limited ksx/D >> 1, diffusion limited ksx/D1 corresponds to oxide thickness 50-200 nm. Deal-Grove model This means the gas absorption rate at the oxide surface is much faster than chemistry occurring at the Si/SiO2 interface. Figure 6-16 7<br>
slide8. Let B=2DC*/N1,A=2D(1/ks+1/h),
B/AC*ks/N1,(h>>ks) Deal-Grove model Assume N1 as the number of oxidant molecules incorporated per unit volume of oxide grown.
For O2 (dry) oxidation, N1=2.2×1022 cm-3; for H2O (wet) oxidation, N1=4.4×1022 cm-3 (2 that of dry, since H2O has only one oxygen atom).
Then the oxidation rate R (F is flux, F=F1=F2=F3=KSCI, unit is number/(cm2s); unit for R is cm/s). Xi account for any oxide present at the start of the oxidation. 8<br>
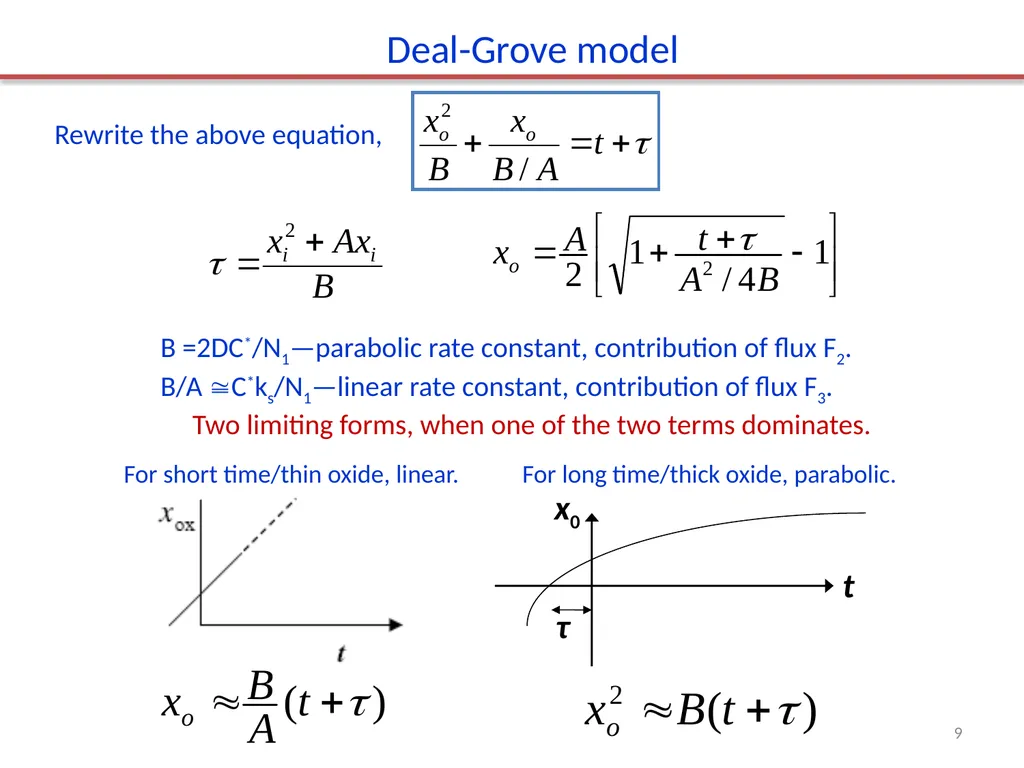
slide9. 9 B =2DC*/N1—parabolic rate constant, contribution of flux F2.
B/A C*ks/N1—linear rate constant, contribution of flux F3. Deal-Grove model Rewrite the above equation, Two limiting forms, when one of the two terms dominates. For short time/thin oxide, linear. For long time/thick oxide, parabolic.<br>
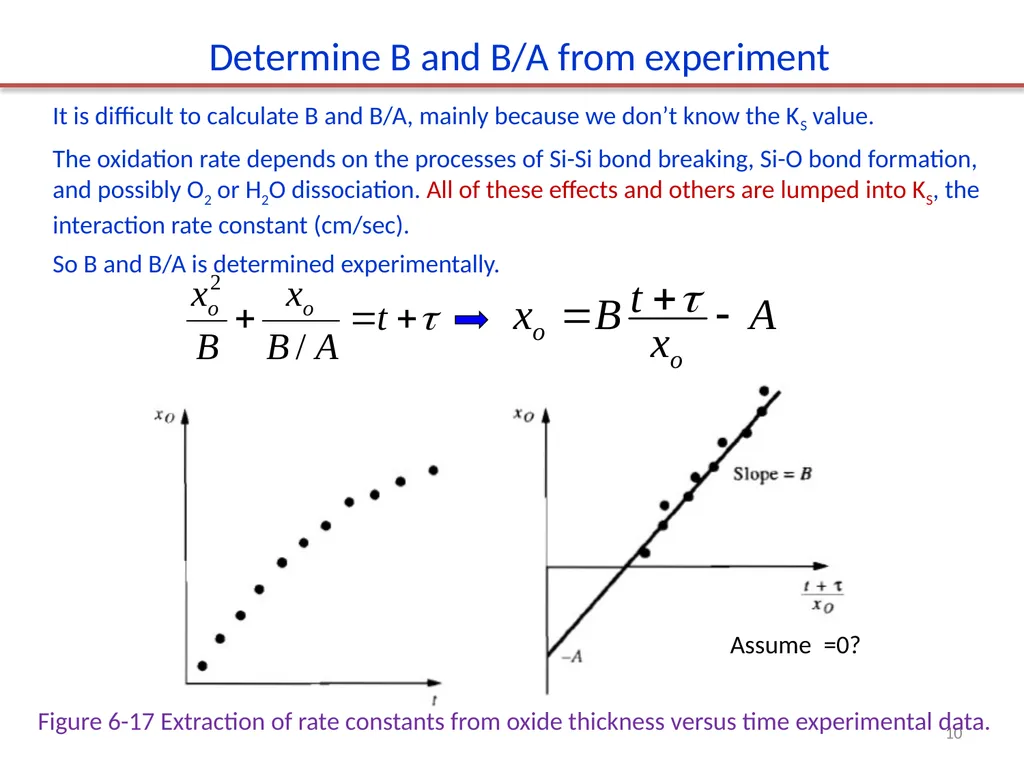
slide10. Determine B and B/A from experiment Figure 6-17 Extraction of rate constants from oxide thickness versus time experimental data. It is difficult to calculate B and B/A, mainly because we don’t know the KS value.
The oxidation rate depends on the processes of Si-Si bond breaking, Si-O bond formation, and possibly O2 or H2O dissociation. All of these effects and others are lumped into KS, the interaction rate constant (cm/sec).
So B and B/A is determined experimentally. Assume =0? 10<br>
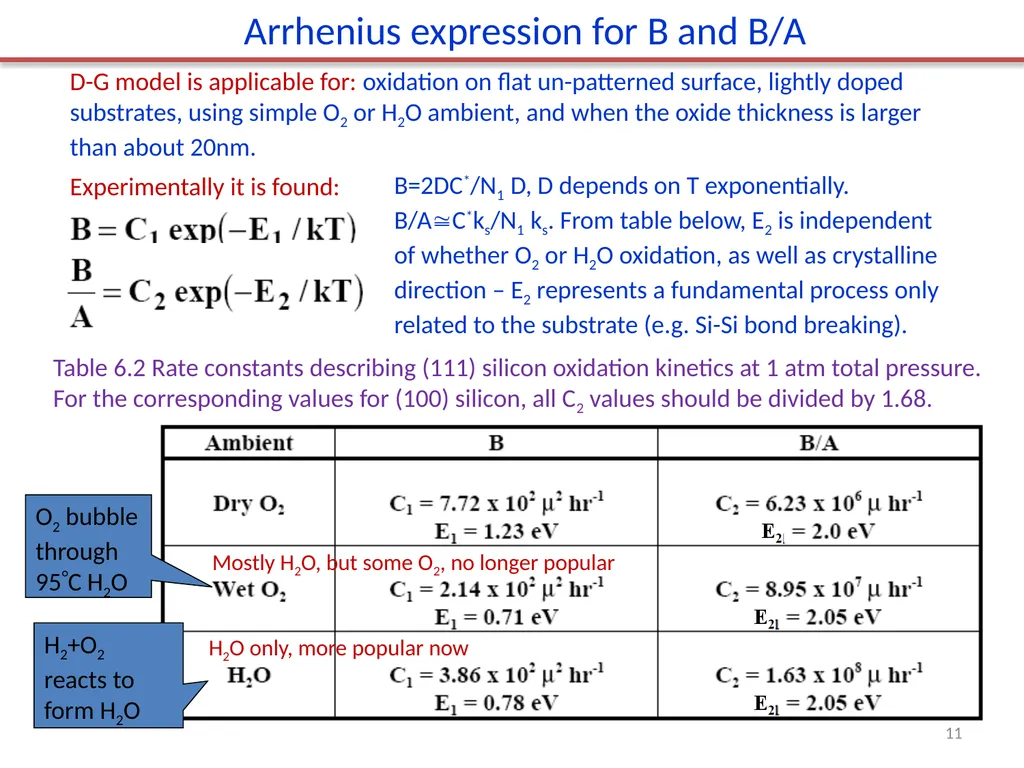
slide11. D-G model is applicable for: oxidation on flat un-patterned surface, lightly doped substrates, using simple O2 or H2O ambient, and when the oxide thickness is larger than about 20nm.
Experimentally it is found: Arrhenius expression for B and B/A Table 6.2 Rate constants describing (111) silicon oxidation kinetics at 1 atm total pressure.
For the corresponding values for (100) silicon, all C2 values should be divided by 1.68. Mostly H2O, but some O2, no longer popular H2O only, more popular now B=2DC*/N1D, D depends on T exponentially.
B/AC*ks/N1ks. From table below, E2 is independent of whether O2 or H2O oxidation, as well as crystalline direction – E2 represents a fundamental process only related to the substrate (e.g. Si-Si bond breaking). 11<br>
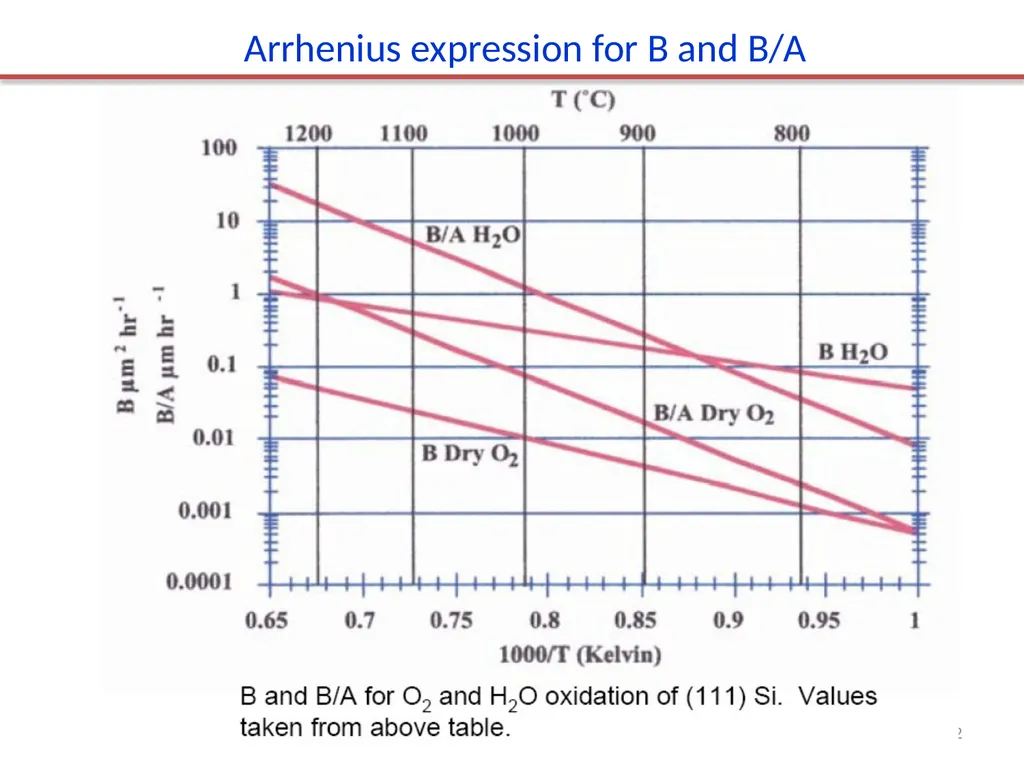
slide12. Arrhenius expression for B and B/A 12<br>
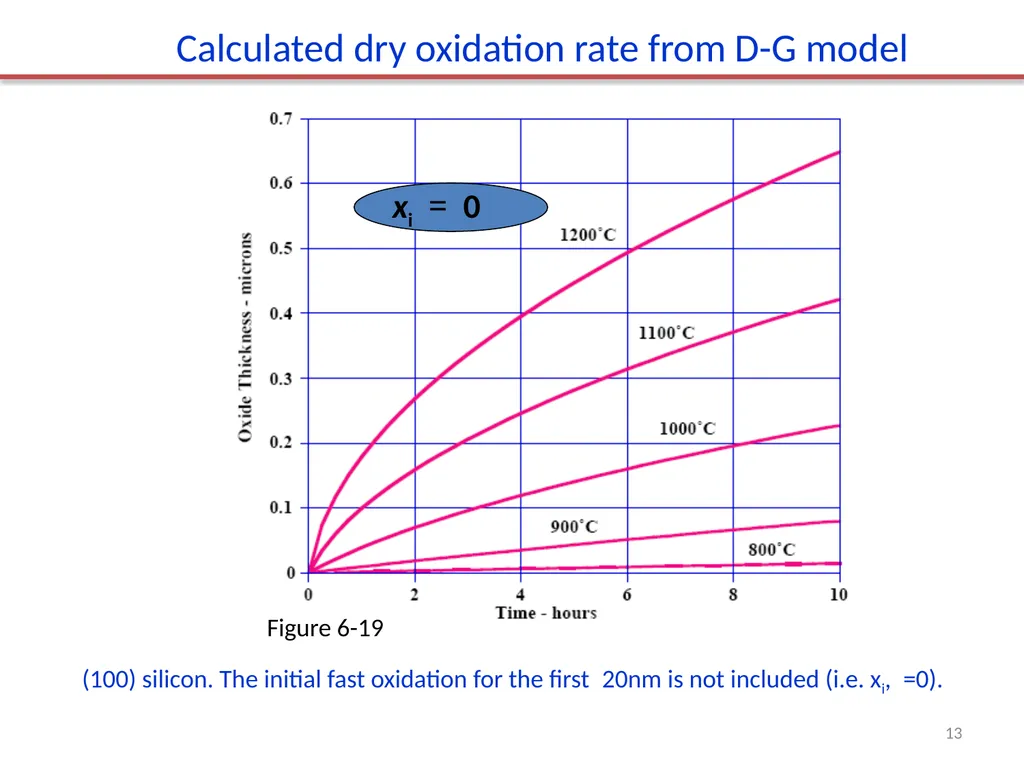
slide13. Calculated dry oxidation rate from D-G model (100) silicon. The initial fast oxidation for the first 20nm is not included (i.e. xi, =0). Figure 6-19 13<br>
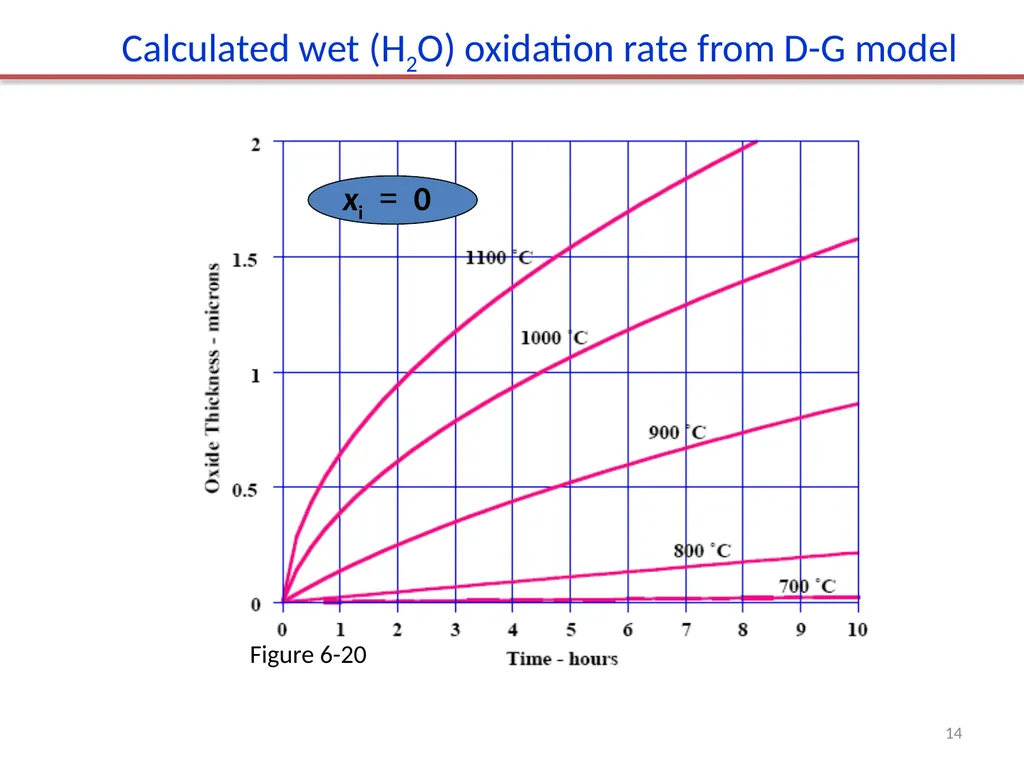
slide14. Calculated wet (H2O) oxidation rate from D-G model Figure 6-20 14<br>
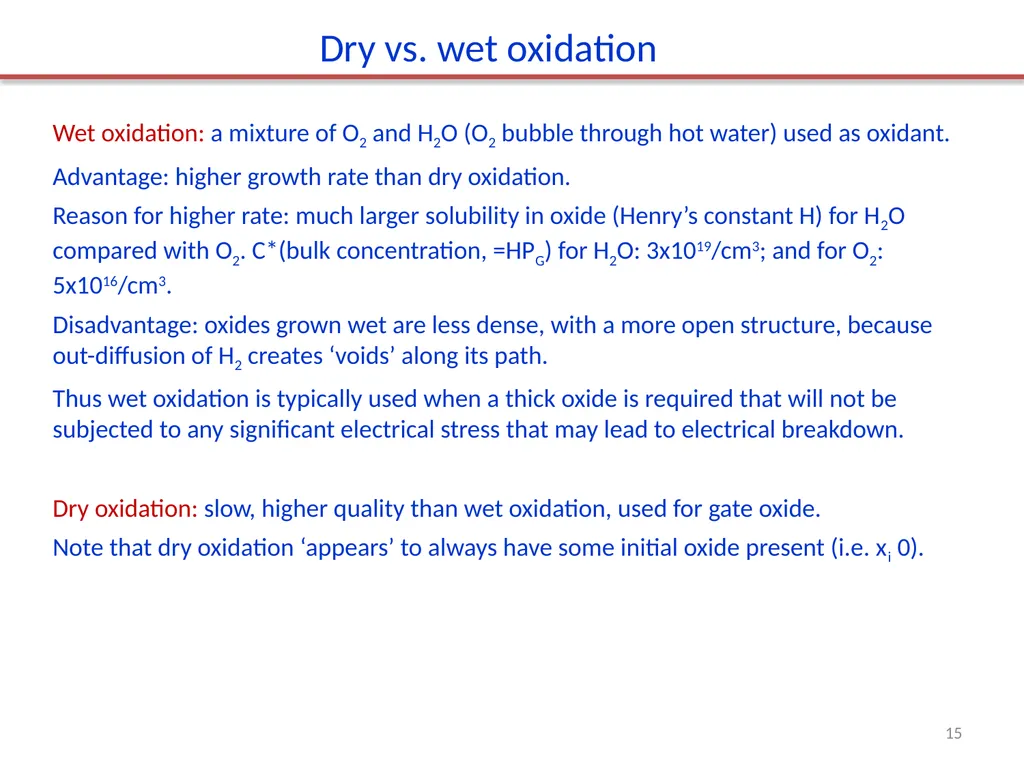
slide15. Wet oxidation: a mixture of O2 and H2O (O2 bubble through hot water) used as oxidant.
Advantage: higher growth rate than dry oxidation.
Reason for higher rate: much larger solubility in oxide (Henry’s constant H) for H2O compared with O2. C*(bulk concentration, =HPG) for H2O: 3x10¹⁹/cm3; and for O2: 5x10¹⁶/cm3.
Disadvantage: oxides grown wet are less dense, with a more open structure, because out-diffusion of H2 creates ‘voids’ along its path.
Thus wet oxidation is typically used when a thick oxide is required that will not be subjected to any significant electrical stress that may lead to electrical breakdown.
Dry oxidation: slow, higher quality than wet oxidation, used for gate oxide.
Note that dry oxidation ‘appears’ to always have some initial oxide present (i.e. xi0). Dry vs. wet oxidation 15<br>
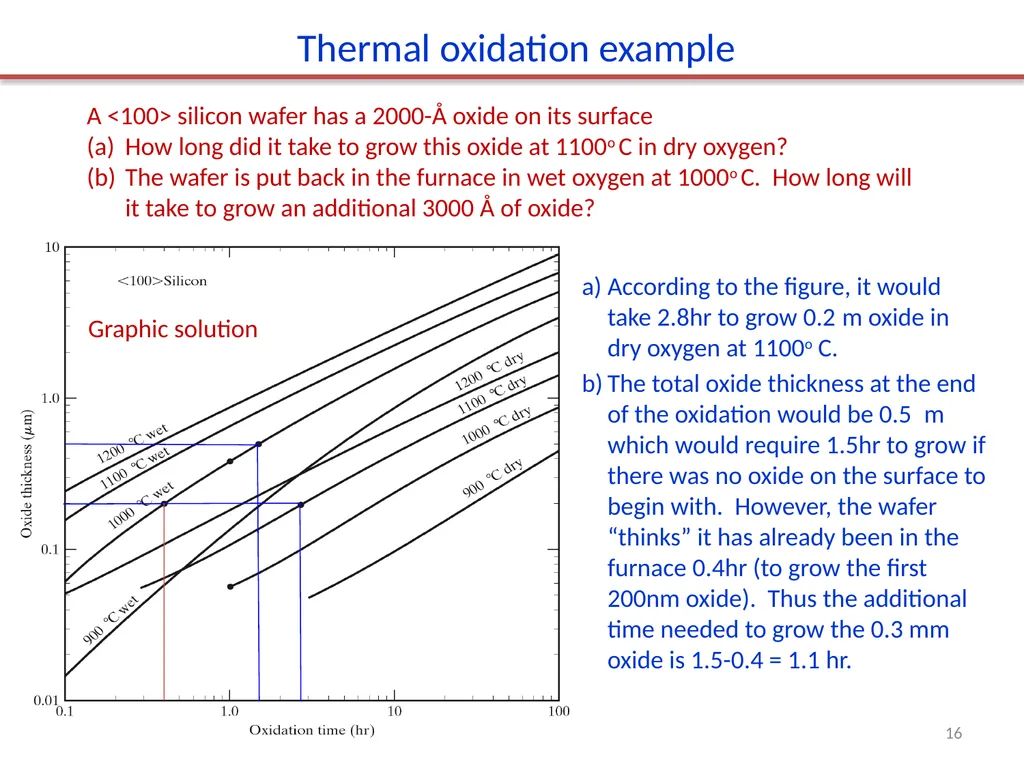
slide16. Thermal oxidation example A <100> silicon wafer has a 2000-Å oxide on its surface
How long did it take to grow this oxide at 1100o C in dry oxygen?
The wafer is put back in the furnace in wet oxygen at 1000o C. How long will it take to grow an additional 3000 Å of oxide? Graphic solution According to the figure, it would take 2.8hr to grow 0.2m oxide in dry oxygen at 1100o C.
The total oxide thickness at the end of the oxidation would be 0.5 m which would require 1.5hr to grow if there was no oxide on the surface to begin with. However, the wafer “thinks” it has already been in the furnace 0.4hr (to grow the first 200nm oxide). Thus the additional time needed to grow the 0.3 mm oxide is 1.5-0.4 = 1.1 hr. 16<br>
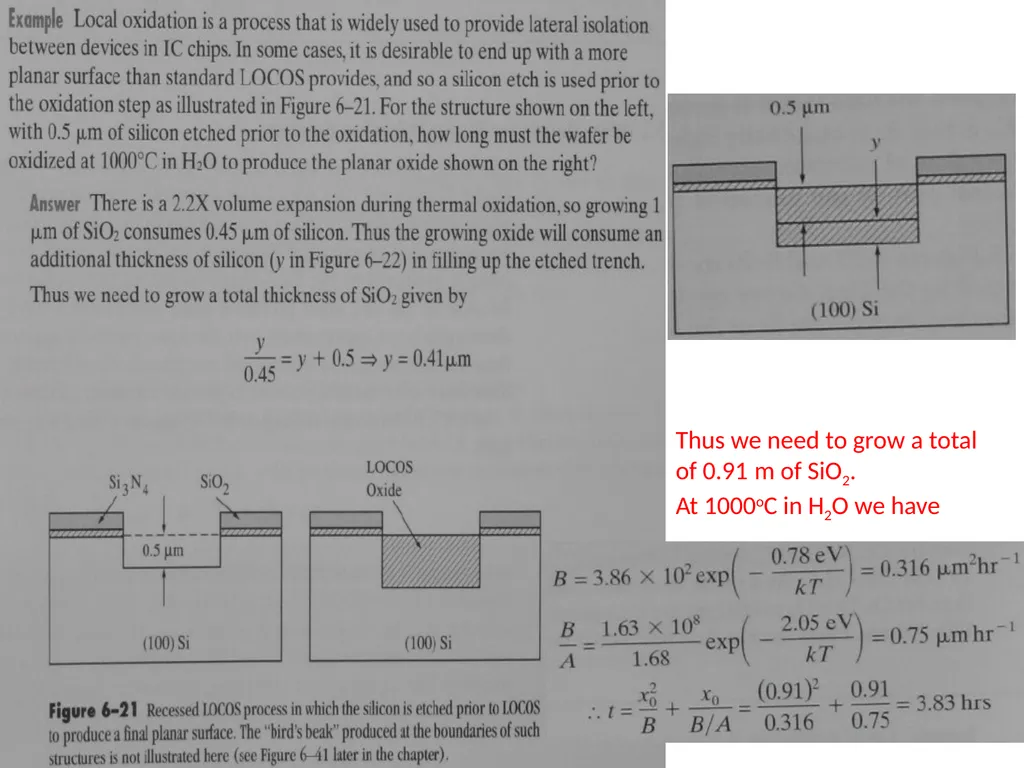
slide17. Thus we need to grow a total of 0.91m of SiO2.
At 1000oC in H2O we have 17<br>
Thermal oxidation basics.
Manufacturing methods and equipment.
Measurement methods (mechanical, optical, electrical).
Deal-Grove model (linear parabolic model).
Thin oxide growth, dependence on gas pressure and crystal orientation
Cl-containing gas, 2D growth, substrate doping effect .
Interface charges, dopant redistribution. Textbook page 313. Chapter 6 Thermal oxidation and the Si/SiO2 interface 1 NE 343: Microfabrication and thin film technology
Instructor: Bo Cui, ECE, University of Waterloo; http://ece.uwaterloo.ca/~bcui/
Textbook: Silicon VLSI Technology by Plummer, Deal and Griffin<br>
slide2. As a young researcher at Fairchild Semiconductor, he “wrote the book” on SiO2 growth: the Deal-Grove model. http://en.wikipedia.org/wiki/Andrew_Grove Grove worked at Fairchild Semiconductor before becoming the fourth employee at the nascent Intel Corporation. He became Intel's president in 1979, its CEO in 1987, and its Chairman and CEO in 1997.
Grove is credited with having transformed Intel from a manufacturer of memory chips into one of the world's dominant producers of microprocessors. During his tenure as CEO, Grove oversaw a 4,500% increase in Intel's market capitalization from $4 billion to $197 billion, making it, at the time, the world's most valuable company. Time Magazine's Man of the Year (1997) Bruce Deal and Andrew Grove 2<br>
slide3. Overview Deal-Grove model: linear-parabolic model for 1D oxide growth (along z-direction) from un-patterned wafer surface.
It is applicable to:
Oxidation temperature 700-1200oC
Gas pressure at wafer surface 0.1-25 atm.
Oxide film thickness 20-2000nm. Considering dry oxygen molecules as the oxidant species, by radio active tracer, it has been shown that oxidation proceeds by inward movement of O2 molecules through SiO2 to the Si − SiO2 interface where the reaction Si(solid) + O(gas) → SiO2 takes place.
This forms a contrast with the case of Copper whose oxidation proceeds by the outward motion of the metallic ion and also with the case of anodic oxidation of silicon, where silicon moves outward. H2O is for wet oxidation
O2 for dry oxidation 3 O gets in or Si gets out for reaction?<br>
slide4. F (oxidant flux): number/(cm2-s); C (oxidant concentration): number/cm3 Cs > Co D-G model: three flux at equilibrium Gas diffusion Solid state diffusion SiO2 formation F1: flux of oxidizing species transported from the gas phase to the gas-oxide interface.
F2: flux across the existing oxide toward the silicon substrate.
F3: flux reacting at the SiO2 interface (this term is not strictly flux/flow).
In steady state, the three fluxes are equal. Concentration of main gas flow Concentration at (inside) the oxide surface. Co Cs. 4<br>
slide5. Define h=hg/HkT, C*=HkTCG=HPG,then For ideal gas, PSV=NKBT, so Cs=N/V=Ps/KT.
According to Henry’s law, the concentration of a gas species dissolved in a solid is proportional to the partial pressure of that species at the solid surface. So Co=HPs, where H is Henry’s constant.
(this is something similar to the law of segregation of dopant at an interface) D-G model: three flux at equilibrium hg is mass transfer coefficient in cm/sec. 5<br>
slide6. D-G model: three flux at equilibrium Using Fick’s law of diffusion, D (cm2/sec) is oxidant diffusivity in the oxide, x is oxide thickness, then
The effective diffusivities of both O2 and H2O are on the same order (about 5103m2/hr at 1100oC).
The rate of reaction should be proportional to the oxidant concentration at the Si/SiO2 interface CI, Ks interface reaction rate constant (cm/sec), then In steady state, the three fluxes are equal. Now we have two equations to solve two unknown CO and CI. 6<br>
slide7. ksx/D << 1, reaction rate limited ksx/D >> 1, diffusion limited ksx/D1 corresponds to oxide thickness 50-200 nm. Deal-Grove model This means the gas absorption rate at the oxide surface is much faster than chemistry occurring at the Si/SiO2 interface. Figure 6-16 7<br>
slide8. Let B=2DC*/N1,A=2D(1/ks+1/h),
B/AC*ks/N1,(h>>ks) Deal-Grove model Assume N1 as the number of oxidant molecules incorporated per unit volume of oxide grown.
For O2 (dry) oxidation, N1=2.2×1022 cm-3; for H2O (wet) oxidation, N1=4.4×1022 cm-3 (2 that of dry, since H2O has only one oxygen atom).
Then the oxidation rate R (F is flux, F=F1=F2=F3=KSCI, unit is number/(cm2s); unit for R is cm/s). Xi account for any oxide present at the start of the oxidation. 8<br>
slide9. 9 B =2DC*/N1—parabolic rate constant, contribution of flux F2.
B/A C*ks/N1—linear rate constant, contribution of flux F3. Deal-Grove model Rewrite the above equation, Two limiting forms, when one of the two terms dominates. For short time/thin oxide, linear. For long time/thick oxide, parabolic.<br>
slide10. Determine B and B/A from experiment Figure 6-17 Extraction of rate constants from oxide thickness versus time experimental data. It is difficult to calculate B and B/A, mainly because we don’t know the KS value.
The oxidation rate depends on the processes of Si-Si bond breaking, Si-O bond formation, and possibly O2 or H2O dissociation. All of these effects and others are lumped into KS, the interaction rate constant (cm/sec).
So B and B/A is determined experimentally. Assume =0? 10<br>
slide11. D-G model is applicable for: oxidation on flat un-patterned surface, lightly doped substrates, using simple O2 or H2O ambient, and when the oxide thickness is larger than about 20nm.
Experimentally it is found: Arrhenius expression for B and B/A Table 6.2 Rate constants describing (111) silicon oxidation kinetics at 1 atm total pressure.
For the corresponding values for (100) silicon, all C2 values should be divided by 1.68. Mostly H2O, but some O2, no longer popular H2O only, more popular now B=2DC*/N1D, D depends on T exponentially.
B/AC*ks/N1ks. From table below, E2 is independent of whether O2 or H2O oxidation, as well as crystalline direction – E2 represents a fundamental process only related to the substrate (e.g. Si-Si bond breaking). 11<br>
slide12. Arrhenius expression for B and B/A 12<br>
slide13. Calculated dry oxidation rate from D-G model (100) silicon. The initial fast oxidation for the first 20nm is not included (i.e. xi, =0). Figure 6-19 13<br>
slide14. Calculated wet (H2O) oxidation rate from D-G model Figure 6-20 14<br>
slide15. Wet oxidation: a mixture of O2 and H2O (O2 bubble through hot water) used as oxidant.
Advantage: higher growth rate than dry oxidation.
Reason for higher rate: much larger solubility in oxide (Henry’s constant H) for H2O compared with O2. C*(bulk concentration, =HPG) for H2O: 3x10¹⁹/cm3; and for O2: 5x10¹⁶/cm3.
Disadvantage: oxides grown wet are less dense, with a more open structure, because out-diffusion of H2 creates ‘voids’ along its path.
Thus wet oxidation is typically used when a thick oxide is required that will not be subjected to any significant electrical stress that may lead to electrical breakdown.
Dry oxidation: slow, higher quality than wet oxidation, used for gate oxide.
Note that dry oxidation ‘appears’ to always have some initial oxide present (i.e. xi0). Dry vs. wet oxidation 15<br>
slide16. Thermal oxidation example A <100> silicon wafer has a 2000-Å oxide on its surface
How long did it take to grow this oxide at 1100o C in dry oxygen?
The wafer is put back in the furnace in wet oxygen at 1000o C. How long will it take to grow an additional 3000 Å of oxide? Graphic solution According to the figure, it would take 2.8hr to grow 0.2m oxide in dry oxygen at 1100o C.
The total oxide thickness at the end of the oxidation would be 0.5 m which would require 1.5hr to grow if there was no oxide on the surface to begin with. However, the wafer “thinks” it has already been in the furnace 0.4hr (to grow the first 200nm oxide). Thus the additional time needed to grow the 0.3 mm oxide is 1.5-0.4 = 1.1 hr. 16<br>
slide17. Thus we need to grow a total of 0.91m of SiO2.
At 1000oC in H2O we have 17<br>