
Slough Insights About this pack… This pack has

Description: Slough Insights About this pack This pack has been created to provide some insights on Slough, our residents and the boroughs economy. It draws upon new data from the 2021 Census, as well as other key sources of information. It is
Related Topics
Download Presentation
"Slough Insights About this pack… This pack has" is the property of its rightful owner. Permission is granted to download and print the materials on this website for personal, non-commercial use only, and to display it on your personal computer provided you do not modify the materials and that you retain all copyright notices contained in the materials. By downloading content from our website, you accept the terms of this agreement.
Presentation Transcript
slide1. Slough Insights<br>
slide2. About this pack… This pack has been created to provide some insights on Slough, our residents and the borough’s economy. It draws upon new data from the 2021 Census, as well as other key sources of information.
It is intended to be viewed as a first point of reference, to provide high-level insights on key challenges and key strengths for the town, and is designed as a tool to support the council in the development of our strategies and in making evidence-based decisions.
This pack should be used alongside other key sources of information, such as the Joint Strategic Needs Assessment (JSNA), equalities data, resident consultations and other service-level sources of data.
In order to save room – data sources and definitions are in the ‘notes section’ of the slides, and links to our data sources can be found on the final slide. 2<br>
slide3. Headlines Slough has a diverse, young population.
Slough has pockets of severe deprivation.
Slough has high levels of overcrowding and the largest average household size in England and Wales.
There has been a larger increase in economically inactive people than active people in Slough since 2011.
Slough has a high proportion of children in low income families and pensioners in poverty in Berkshire. There is a gap in income of £84 per week between Slough residents and those who commute into Slough for work.
There are high levels of crime, including violent crime.
Slough has generally good levels of educational attainment but is below the national average for post-16 education and qualifications. 3<br>
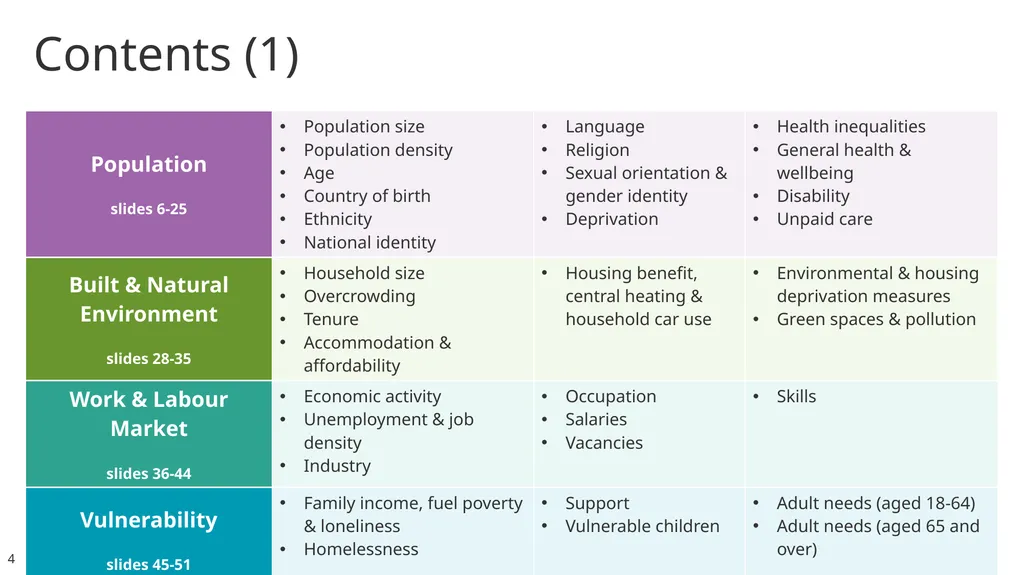
slide4. Contents (1) 4<br>
slide5. Contents (2) 5<br>
slide6. Population 6<br>
slide7. Population - Residents & Households Slough population: 158,500 Females
80,005
(50.5%) Males
78,495
(49.5%) 52,423 Households 3 people per Household Slough’s population in the 2021 Census was 158,500. This is an increase of 13.0% from 2011, compared to increases of 7.5% in the South East and 6.6% in England. This growth is also larger than our neighbouring authorities:
Buckinghamshire - 9.5%
Hillingdon – 11.7%
Spelthorne – 7.7%
Windsor & Maidenhead – 6.2%
Slough is now the 127th largest local authority by total population size, up 13 places from 2011.
There are now 52,423 households in Slough containing at least one person – a growth of only 3.3% on 2011, compared to 6.1% in England and Wales.
Slough has a mean household size of 3 people per household. This is the largest mean household size in England and Wales. The mean for England and Wales is 2.4. 7<br>
slide8. Population - Density Slough is the third most densely populated LA in the South East, with 4,871 usual residents per square kilometre (48.7 per hectare compared to 45.8 in 2011, South East: 4.87, England: 4.34).
This is the equivalent of around 35 people living on each football pitch-sized area of land, compared to an average of just 3 across England.
Slough is the fifth most densely populated Local Authority outside of London.
Slough has the third smallest population within Berkshire but is the most densely populated. 8<br>
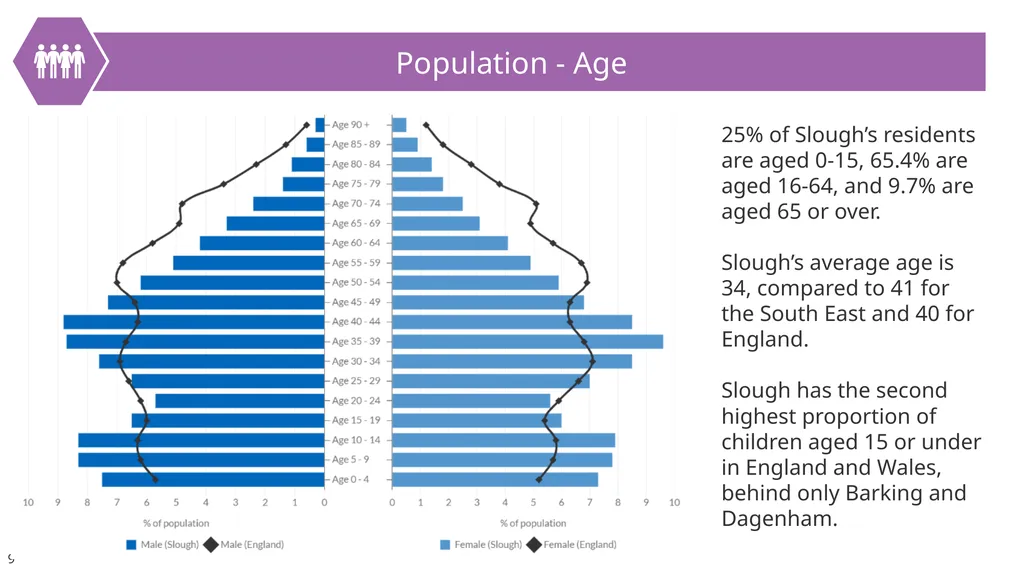
slide9. Population - Age 25% of Slough’s residents are aged 0-15, 65.4% are aged 16-64, and 9.7% are aged 65 or over.
Slough’s average age is 34, compared to 41 for the South East and 40 for England.
Slough has the second highest proportion of children aged 15 or under in England and Wales, behind only Barking and Dagenham. 9<br>
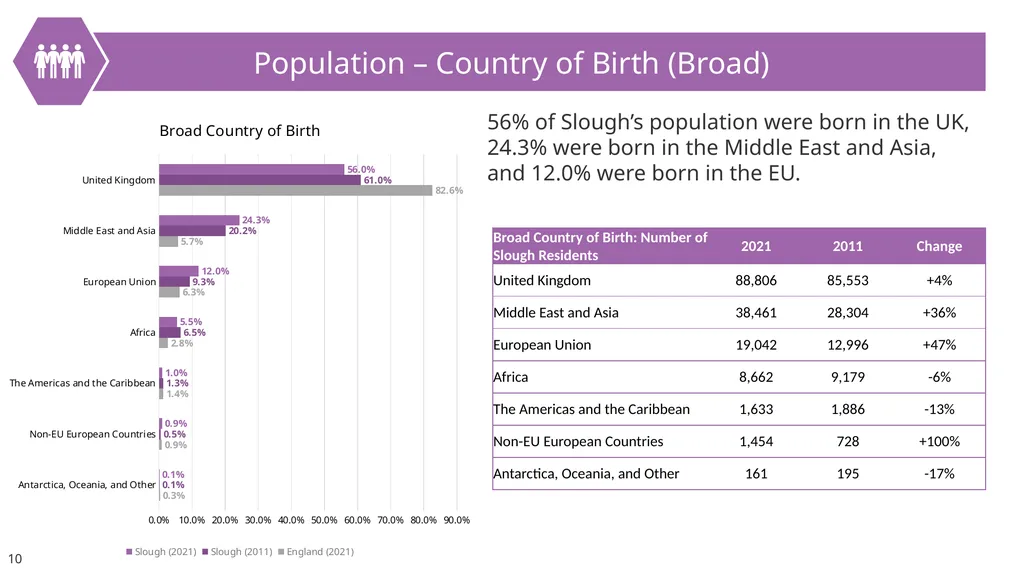
slide10. Population – Country of Birth (Broad) 56% of Slough’s population were born in the UK, 24.3% were born in the Middle East and Asia, and 12.0% were born in the EU. 10<br>
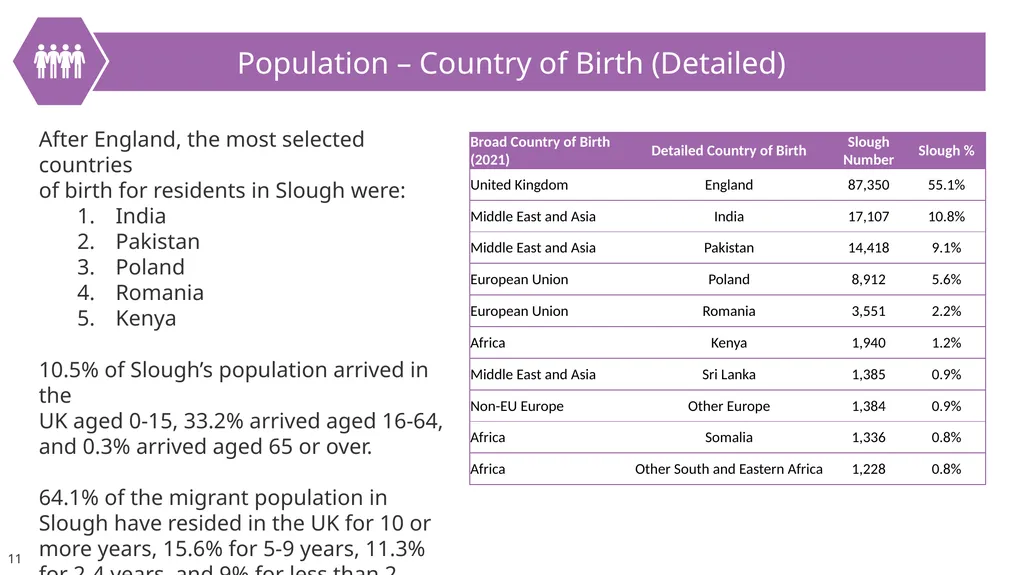
slide11. Population – Country of Birth (Detailed) After England, the most selected countries of birth for residents in Slough were:
India
Pakistan
Poland
Romania
Kenya
10.5% of Slough’s population arrived in the UK aged 0-15, 33.2% arrived aged 16-64, and 0.3% arrived aged 65 or over.
64.1% of the migrant population in Slough have resided in the UK for 10 or more years, 15.6% for 5-9 years, 11.3% for 2-4 years, and 9% for less than 2 years. 11<br>
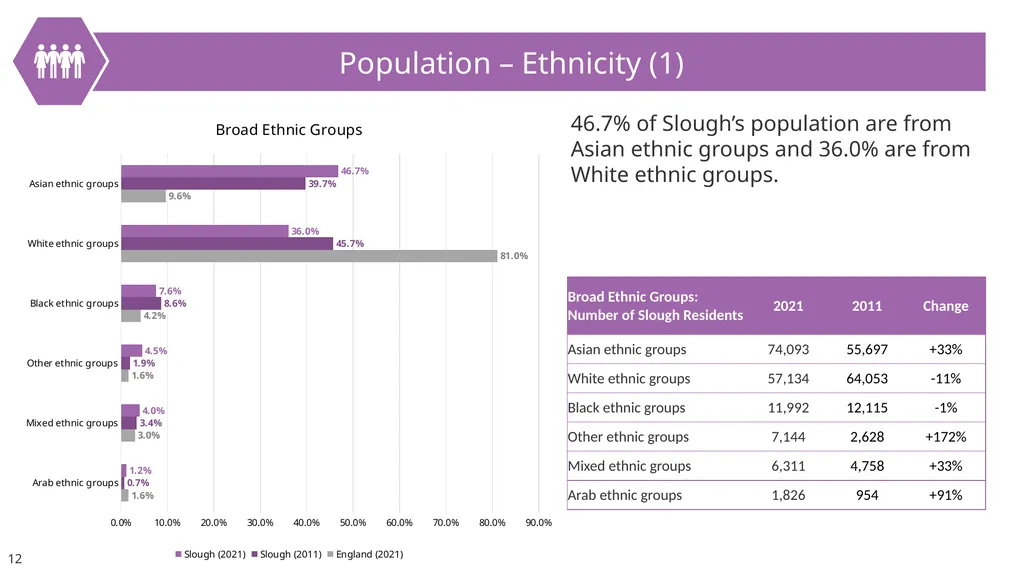
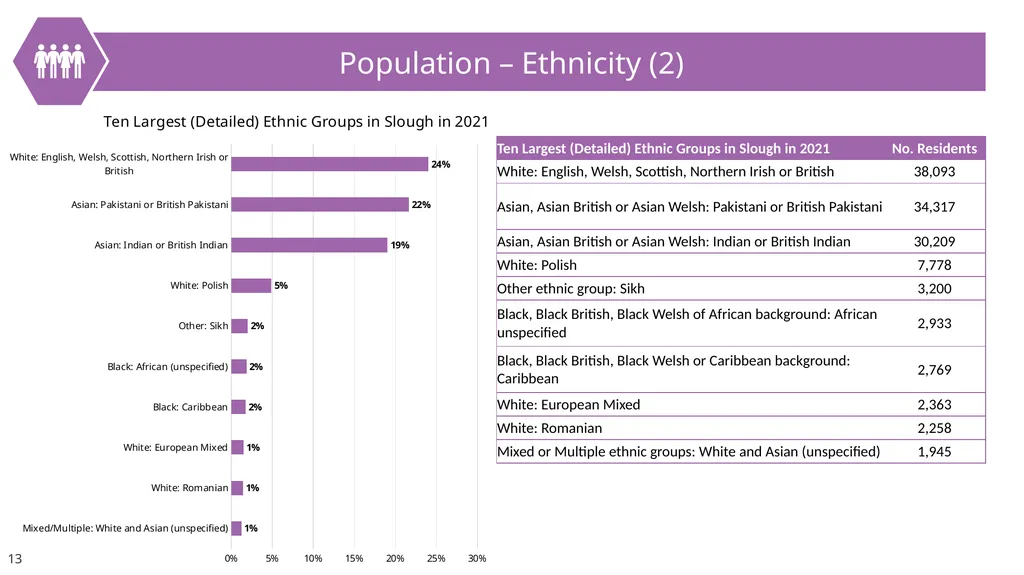
slide12. Population – Ethnicity (1) 46.7% of Slough’s population are from Asian ethnic groups and 36.0% are from White ethnic groups. 12<br>
slide13. Population – Ethnicity (2) 13<br>
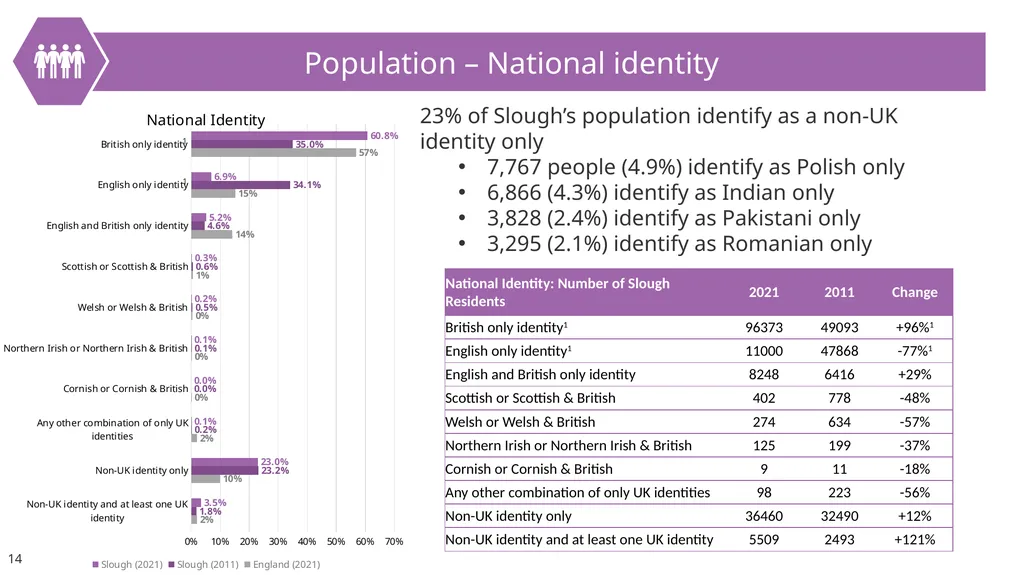
slide14. Population – National identity 23% of Slough’s population identify as a non-UK identity only
7,767 people (4.9%) identify as Polish only
6,866 (4.3%) identify as Indian only
3,828 (2.4%) identify as Pakistani only
3,295 (2.1%) identify as Romanian only 14<br>
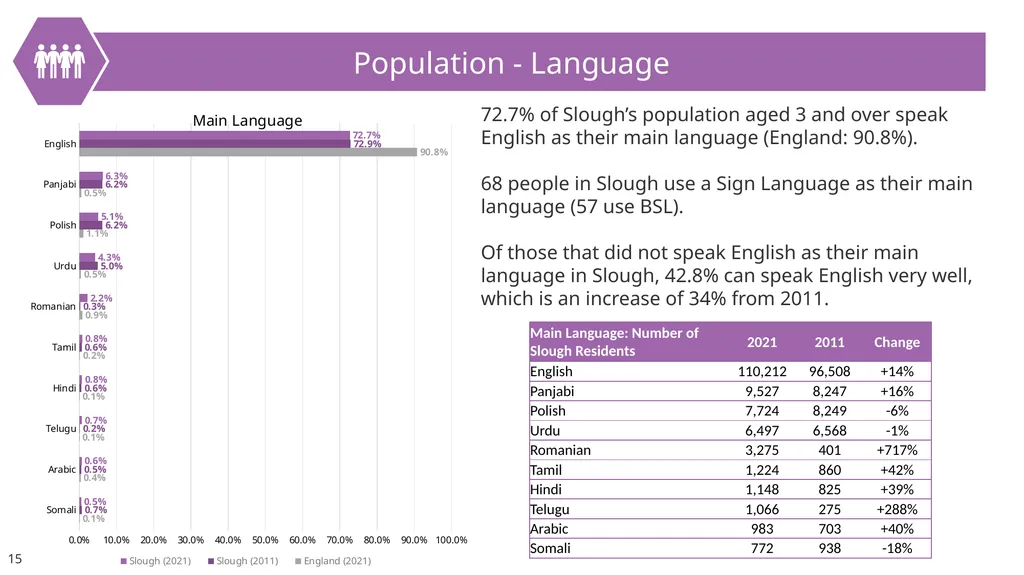
slide15. Population - Language 72.7% of Slough’s population aged 3 and over speak English as their main language (England: 90.8%).
68 people in Slough use a Sign Language as their main language (57 use BSL).
Of those that did not speak English as their main language in Slough, 42.8% can speak English very well, which is an increase of 34% from 2011. 15<br>
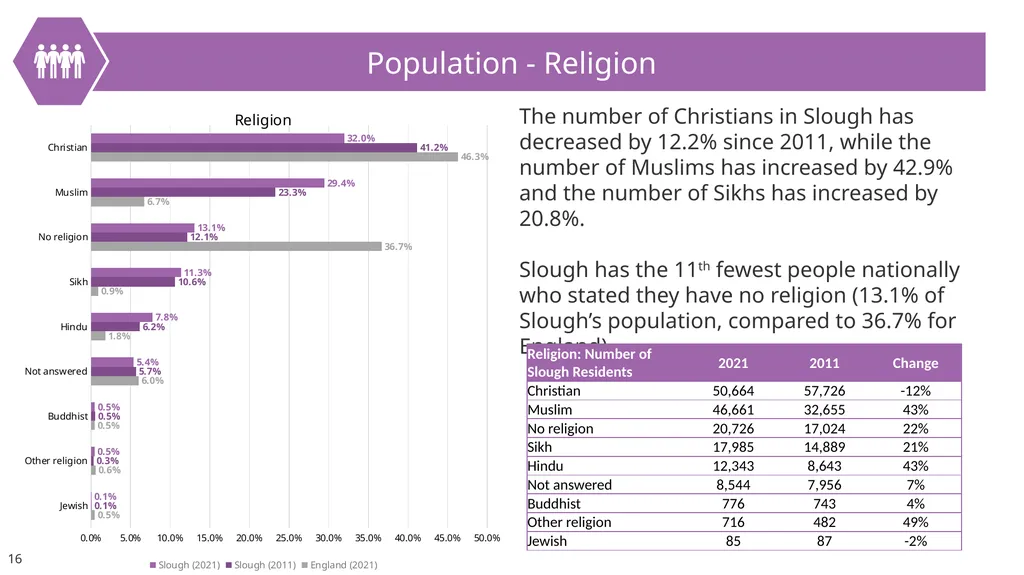
slide16. Population - Religion The number of Christians in Slough has decreased by 12.2% since 2011, while the number of Muslims has increased by 42.9% and the number of Sikhs has increased by 20.8%.
Slough has the 11th fewest people nationally who stated they have no religion (13.1% of Slough’s population, compared to 36.7% for England). 16<br>
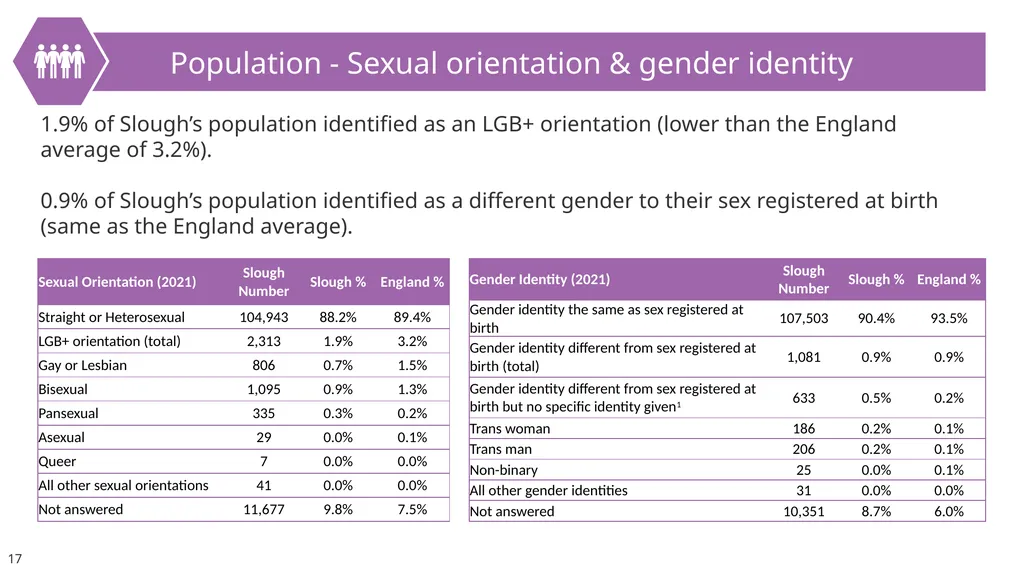
slide17. Population - Sexual orientation & gender identity 1.9% of Slough’s population identified as an LGB+ orientation (lower than the England average of 3.2%).
0.9% of Slough’s population identified as a different gender to their sex registered at birth (same as the England average). 17<br>
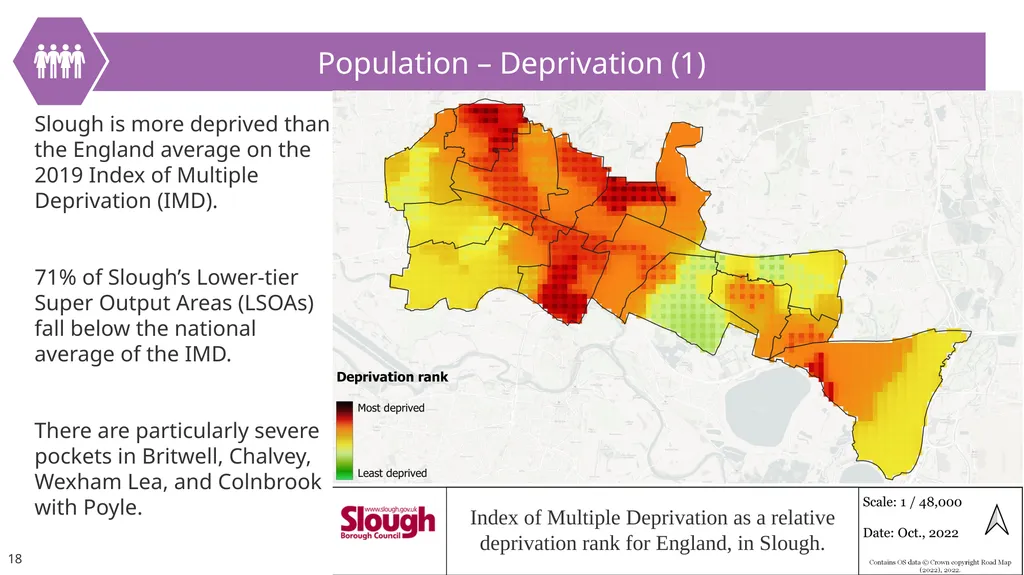
slide18. Population – Deprivation (1) Slough is more deprived than the England average on the 2019 Index of Multiple Deprivation (IMD).
71% of Slough’s Lower-tier Super Output Areas (LSOAs) fall below the national average of the IMD.
There are particularly severe pockets in Britwell, Chalvey, Wexham Lea, and Colnbrook with Poyle. 18<br>
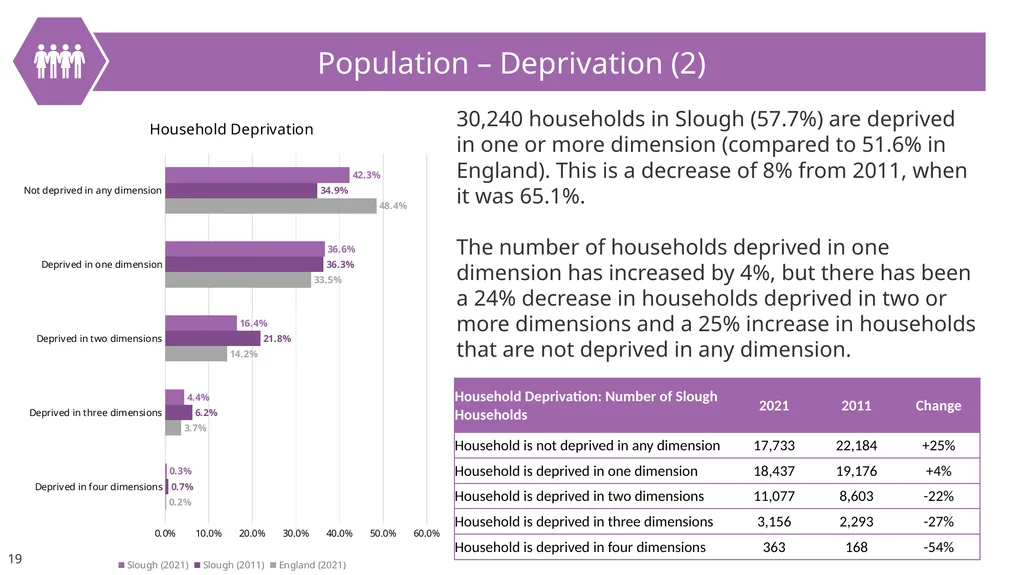
slide19. Population – Deprivation (2) 30,240 households in Slough (57.7%) are deprived in one or more dimension (compared to 51.6% in England). This is a decrease of 8% from 2011, when it was 65.1%.
The number of households deprived in one dimension has increased by 4%, but there has been a 24% decrease in households deprived in two or more dimensions and a 25% increase in households that are not deprived in any dimension. 19<br>
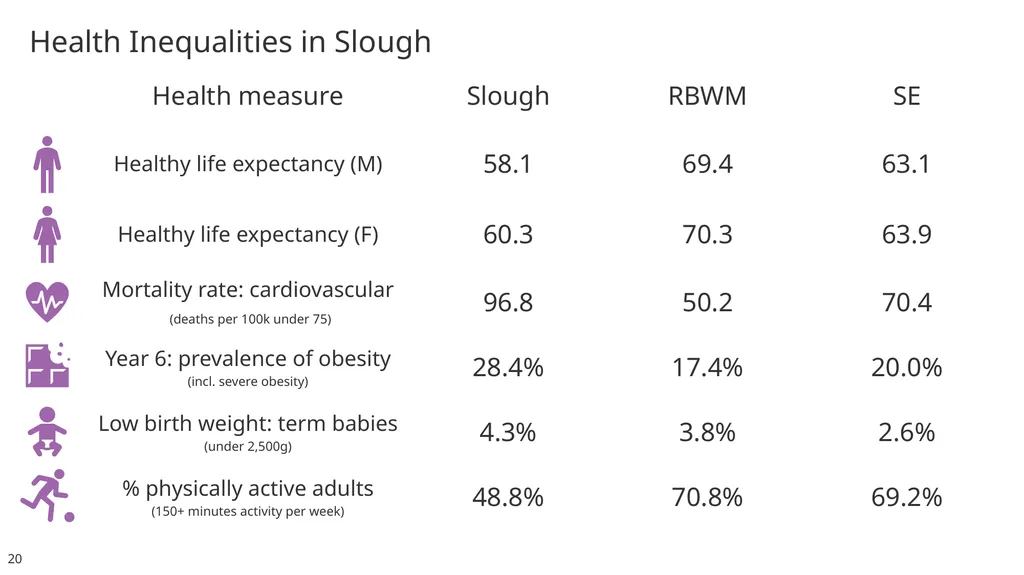
slide20. Health Inequalities in Slough 20<br>
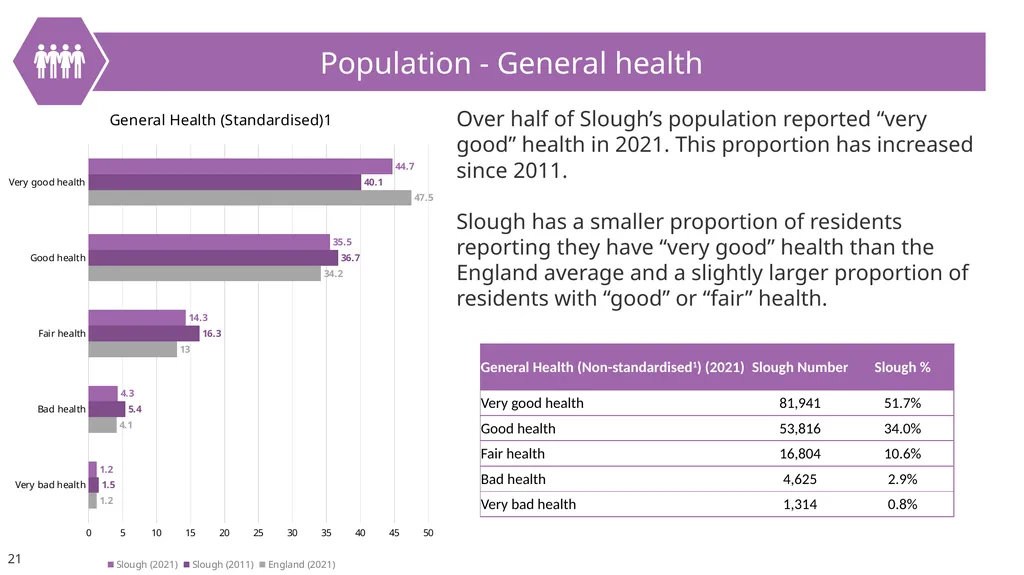
slide21. Population - General health Over half of Slough’s population reported “very good” health in 2021. This proportion has increased since 2011.
Slough has a smaller proportion of residents reporting they have “very good” health than the England average and a slightly larger proportion of residents with “good” or “fair” health. 21<br>
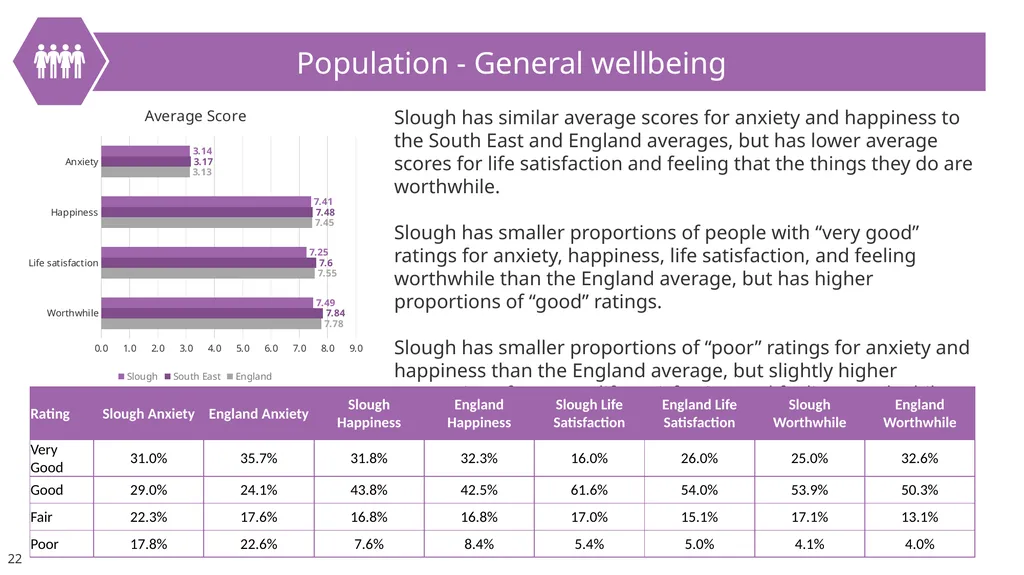
slide22. Population - General wellbeing Slough has similar average scores for anxiety and happiness to the South East and England averages, but has lower average scores for life satisfaction and feeling that the things they do are worthwhile.
Slough has smaller proportions of people with “very good” ratings for anxiety, happiness, life satisfaction, and feeling worthwhile than the England average, but has higher proportions of “good” ratings.
Slough has smaller proportions of “poor” ratings for anxiety and happiness than the England average, but slightly higher proportions for “poor” life satisfaction and feeling worthwhile. 22<br>
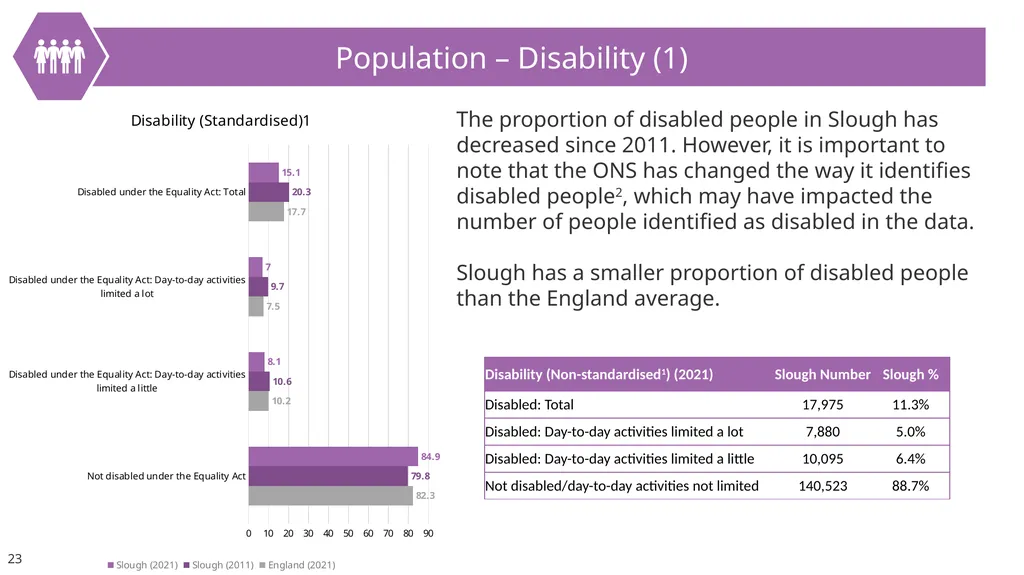
slide23. Population – Disability (1) The proportion of disabled people in Slough has decreased since 2011. However, it is important to note that the ONS has changed the way it identifies disabled people2, which may have impacted the number of people identified as disabled in the data.
Slough has a smaller proportion of disabled people than the England average. 23<br>
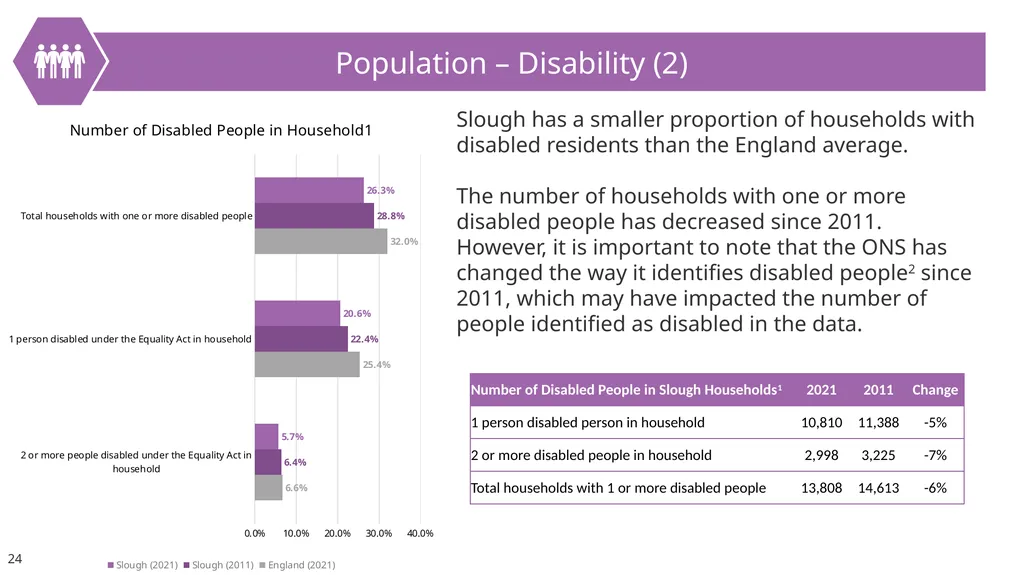
slide24. Population – Disability (2) Slough has a smaller proportion of households with disabled residents than the England average.
The number of households with one or more disabled people has decreased since 2011. However, it is important to note that the ONS has changed the way it identifies disabled people2 since 2011, which may have impacted the number of people identified as disabled in the data. 24<br>
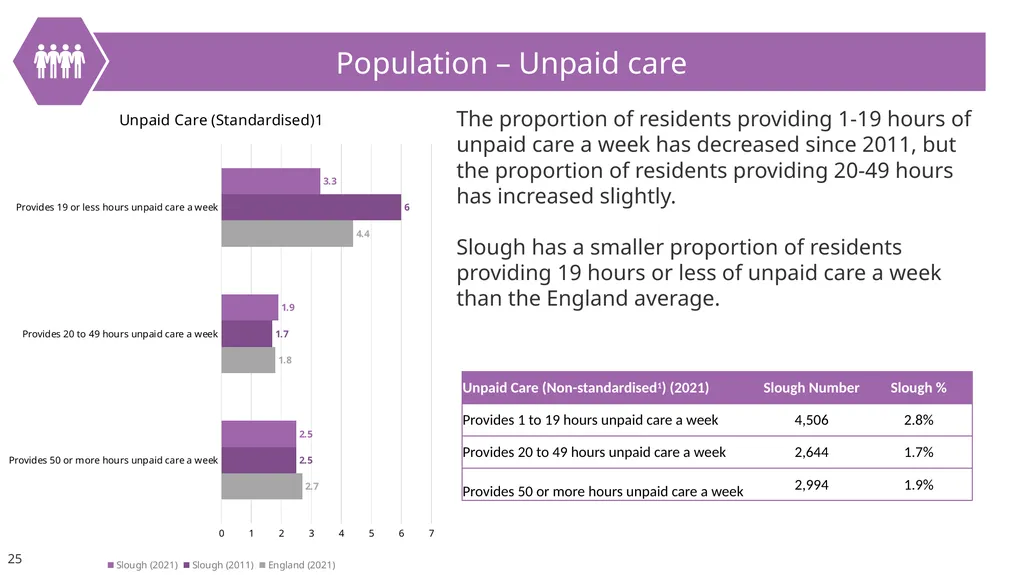
slide25. Population – Unpaid care The proportion of residents providing 1-19 hours of unpaid care a week has decreased since 2011, but the proportion of residents providing 20-49 hours has increased slightly.
Slough has a smaller proportion of residents providing 19 hours or less of unpaid care a week than the England average. 25<br>
slide26. Wider Determinants of Health 26<br>
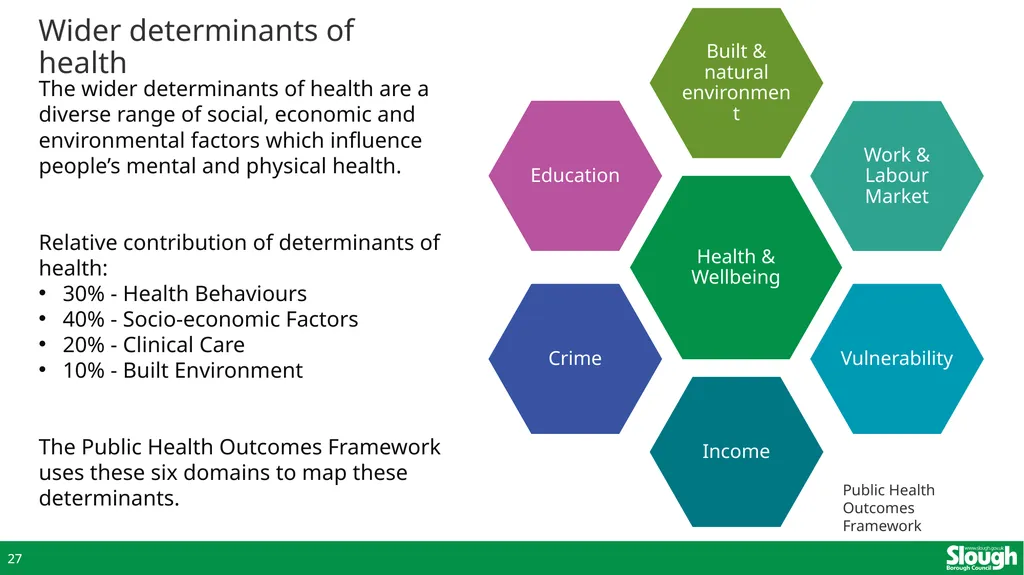
slide27. Wider determinants of health The wider determinants of health are a diverse range of social, economic and environmental factors which influence people’s mental and physical health.
Relative contribution of determinants of health:
30% - Health Behaviours
40% - Socio-economic Factors
20% - Clinical Care
10% - Built Environment
The Public Health Outcomes Framework uses these six domains to map these determinants. Public Health Outcomes Framework 27<br>
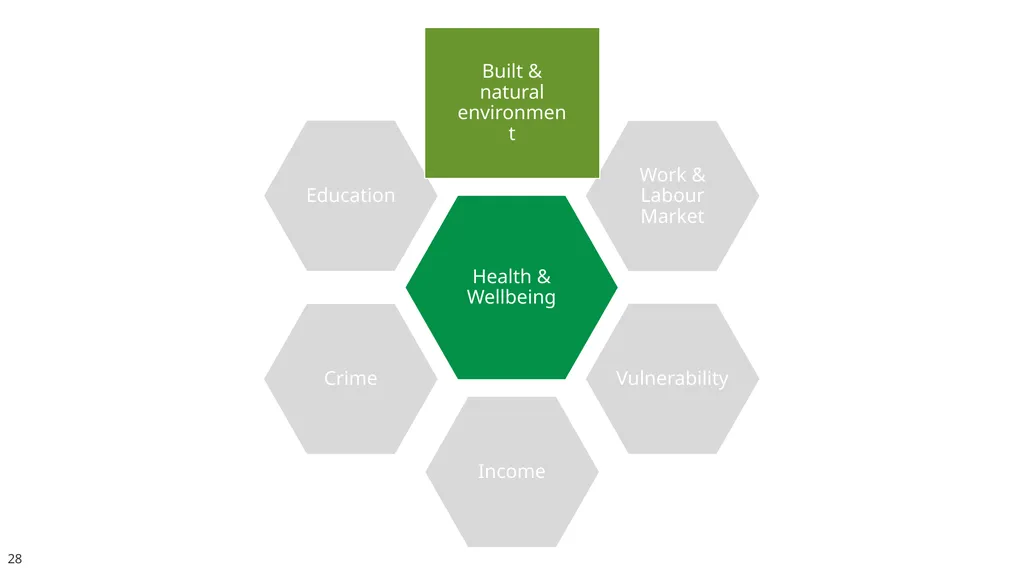
slide28. 28 Built & natural environment<br>
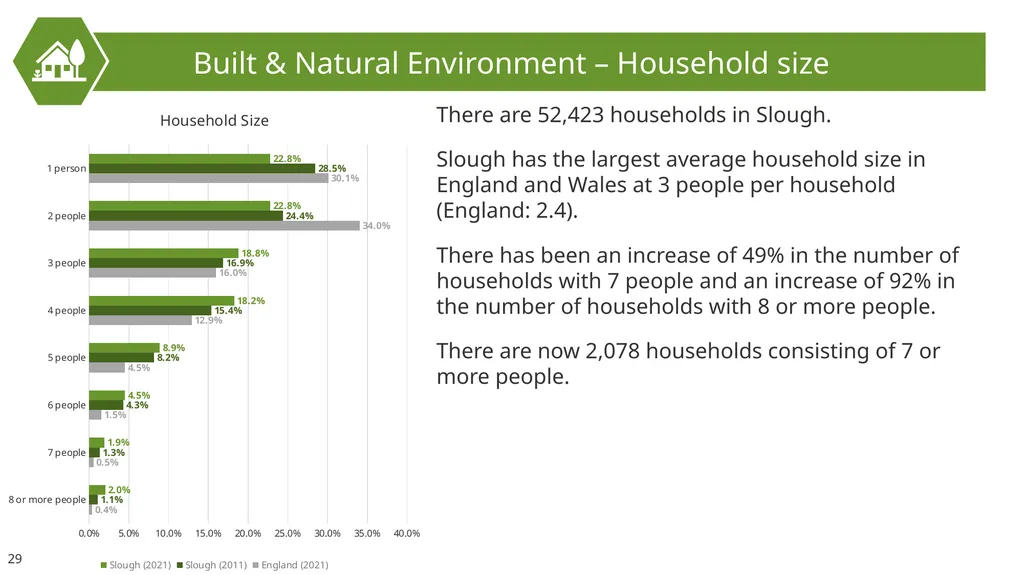
slide29. Built & Natural Environment – Household size There are 52,423 households in Slough.
Slough has the largest average household size in England and Wales at 3 people per household (England: 2.4).
There has been an increase of 49% in the number of households with 7 people and an increase of 92% in the number of households with 8 or more people.
There are now 2,078 households consisting of 7 or more people. 29<br>
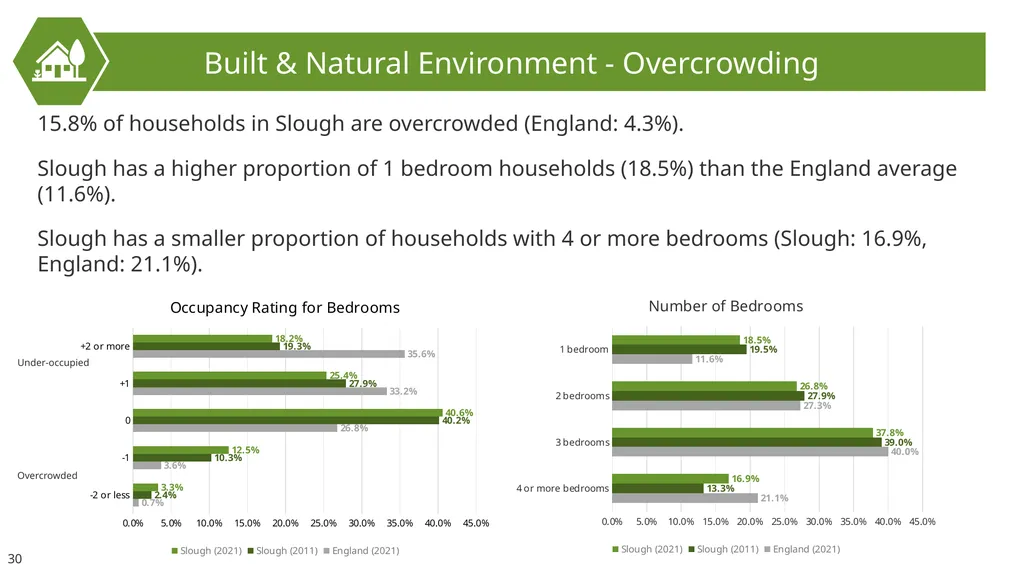
slide30. Built & Natural Environment - Overcrowding 15.8% of households in Slough are overcrowded (England: 4.3%).
Slough has a higher proportion of 1 bedroom households (18.5%) than the England average (11.6%).
Slough has a smaller proportion of households with 4 or more bedrooms (Slough: 16.9%, England: 21.1%). Under-occupied Overcrowded 30<br>
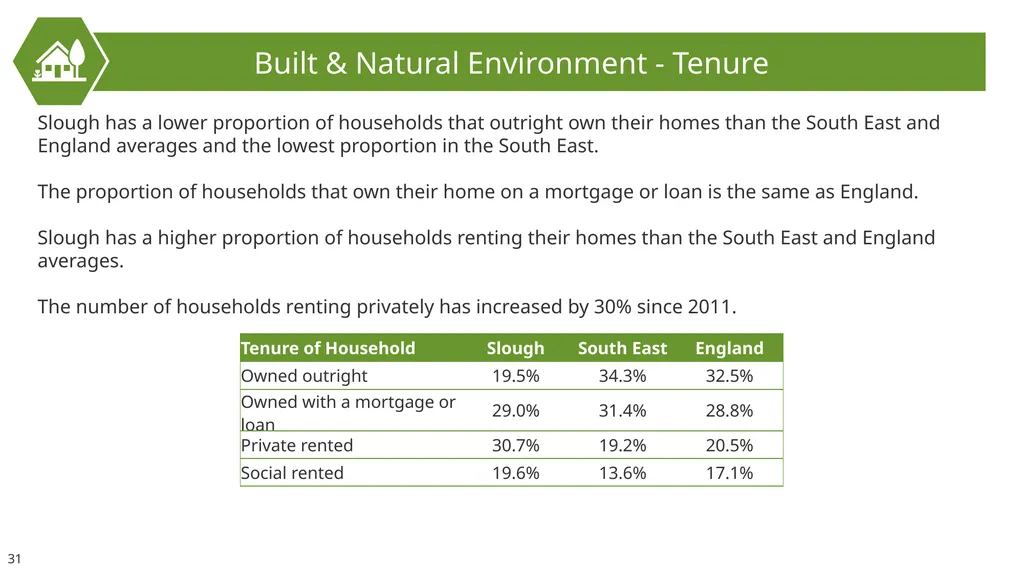
slide31. Built & Natural Environment - Tenure Slough has a lower proportion of households that outright own their homes than the South East and England averages and the lowest proportion in the South East.
The proportion of households that own their home on a mortgage or loan is the same as England.
Slough has a higher proportion of households renting their homes than the South East and England averages.
The number of households renting privately has increased by 30% since 2011. 31<br>
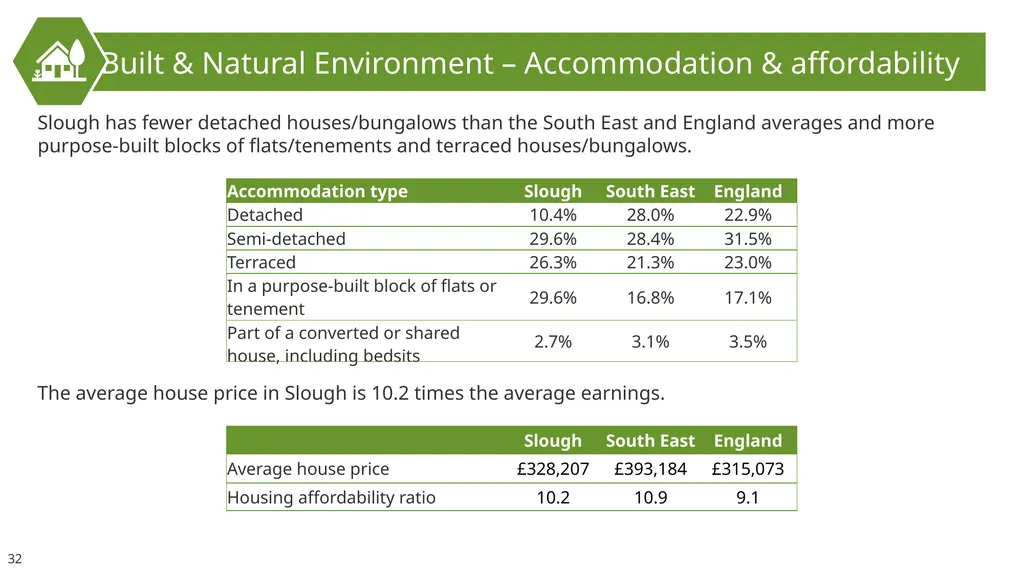
slide32. Built & Natural Environment – Accommodation & affordability Slough has fewer detached houses/bungalows than the South East and England averages and more purpose-built blocks of flats/tenements and terraced houses/bungalows. The average house price in Slough is 10.2 times the average earnings. 32<br>
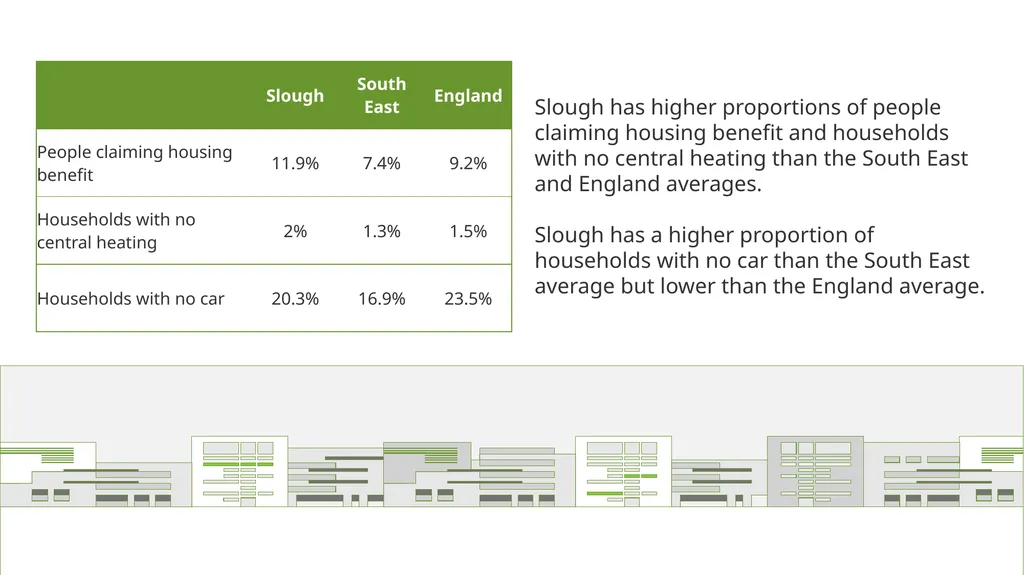
slide33. Built & Natural Environment – Housing benefit, central heating, and car availability Slough has higher proportions of people claiming housing benefit and households with no central heating than the South East and England averages.
Slough has a higher proportion of households with no car than the South East average but lower than the England average. 33<br>
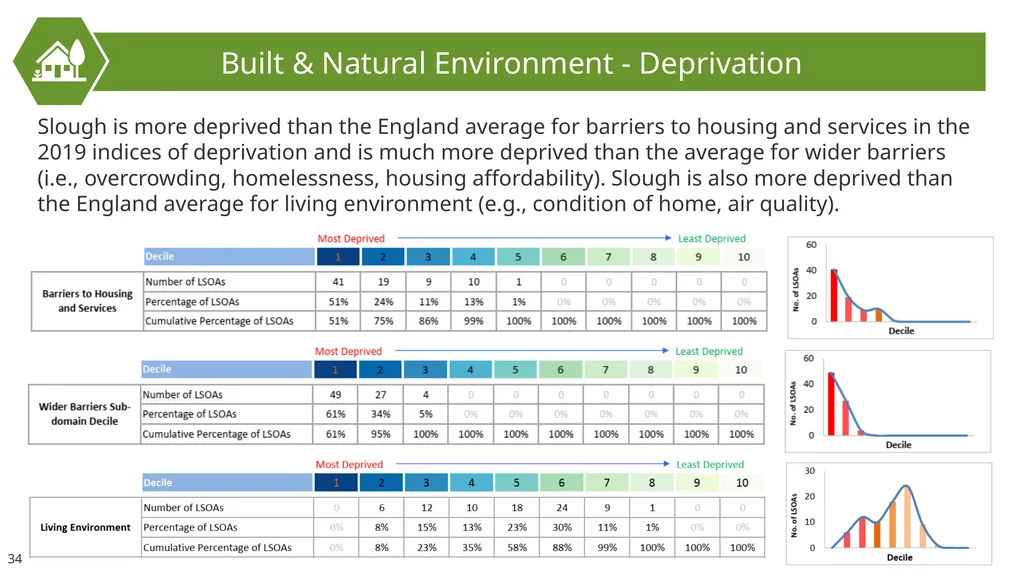
slide34. Built & Natural Environment - Deprivation Slough is more deprived than the England average for barriers to housing and services in the 2019 indices of deprivation and is much more deprived than the average for wider barriers (i.e., overcrowding, homelessness, housing affordability). Slough is also more deprived than the England average for living environment (e.g., condition of home, air quality). 34<br>
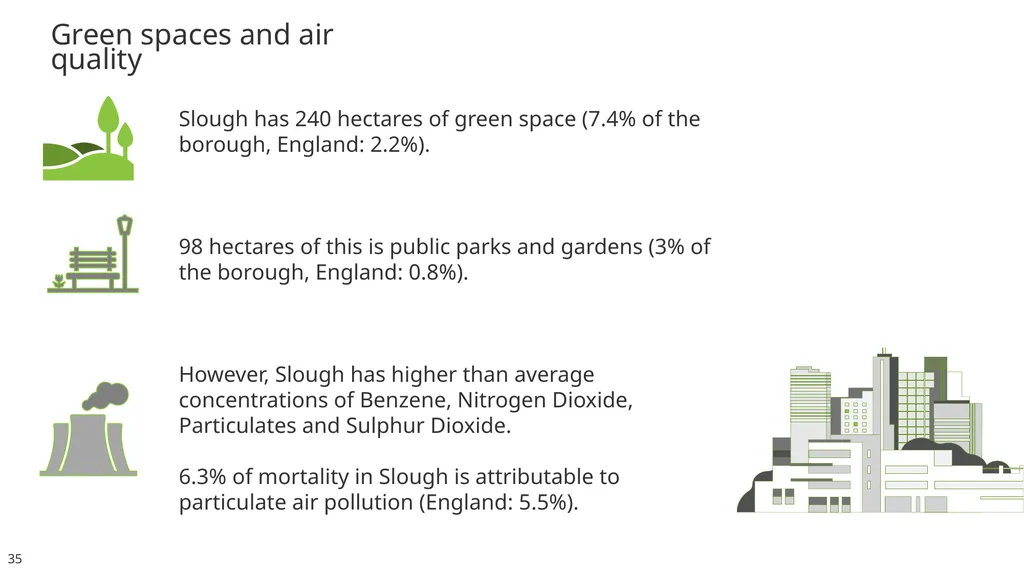
slide35. Green spaces and air quality Slough has 240 hectares of green space (7.4% of the borough, England: 2.2%).
98 hectares of this is public parks and gardens (3% of the borough, England: 0.8%).
However, Slough has higher than average concentrations of Benzene, Nitrogen Dioxide, Particulates and Sulphur Dioxide.
6.3% of mortality in Slough is attributable to particulate air pollution (England: 5.5%). 35<br>
slide36. 36 Work & Labour Market<br>
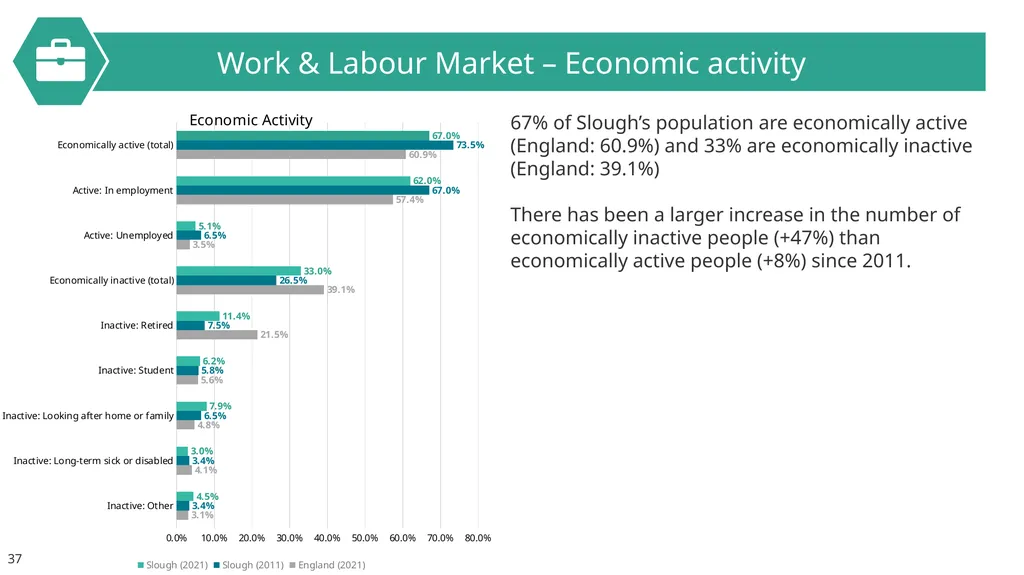
slide37. Work & Labour Market – Economic activity 67% of Slough’s population are economically active (England: 60.9%) and 33% are economically inactive (England: 39.1%)
There has been a larger increase in the number of economically inactive people (+47%) than economically active people (+8%) since 2011. 37<br>
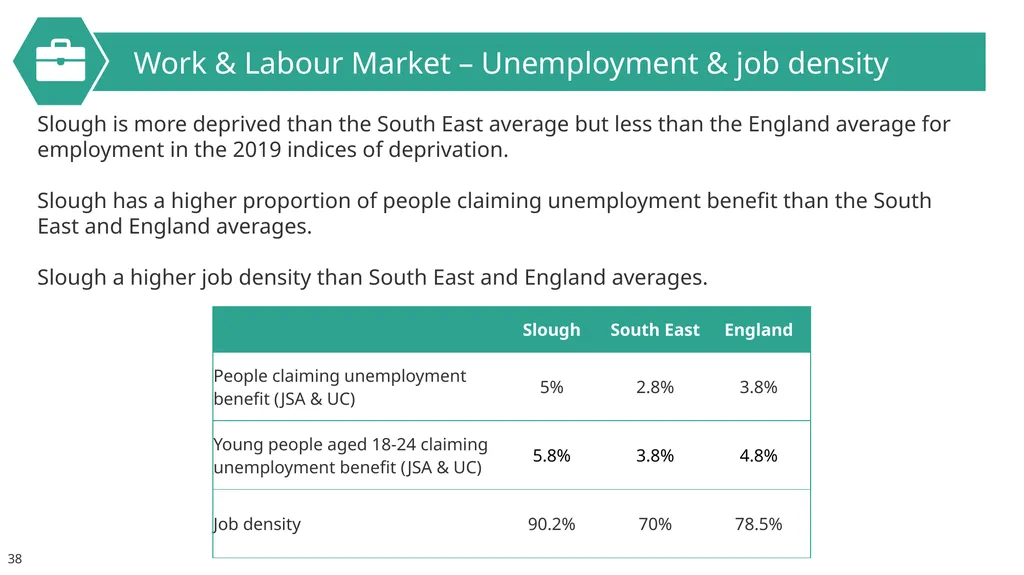
slide38. Work & Labour Market – Unemployment & job density Slough is more deprived than the South East average but less than the England average for employment in the 2019 indices of deprivation.
Slough has a higher proportion of people claiming unemployment benefit than the South East and England averages.
Slough a higher job density than South East and England averages. 38<br>
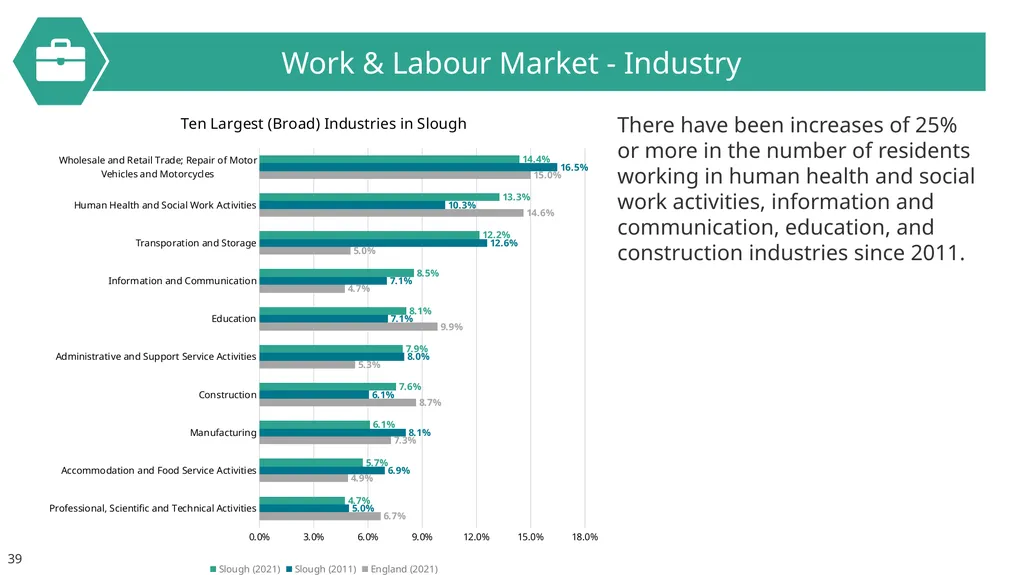
slide39. Work & Labour Market - Industry There have been increases of 25% or more in the number of residents working in human health and social work activities, information and communication, education, and construction industries since 2011. 39<br>
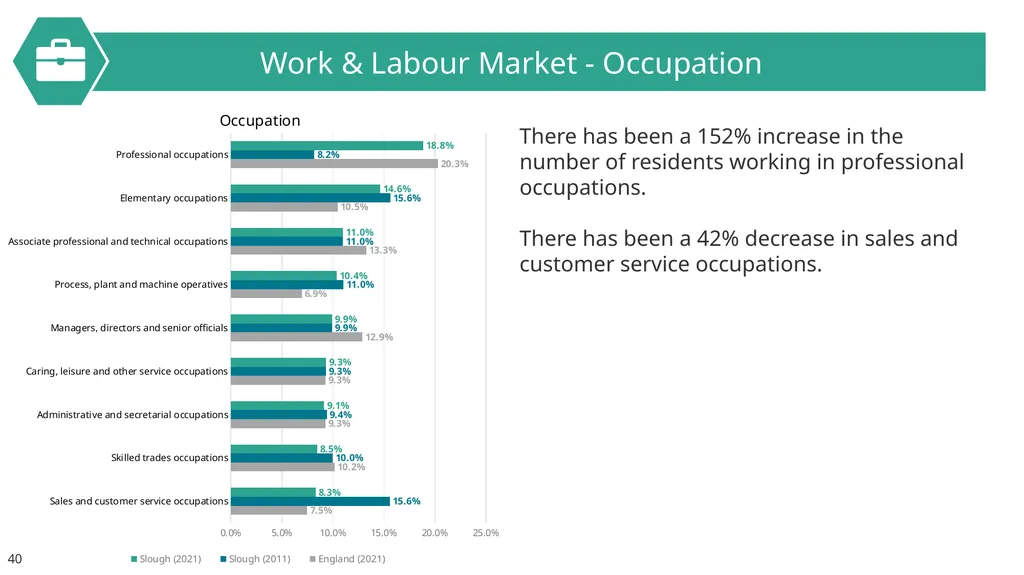
slide40. Work & Labour Market - Occupation There has been a 152% increase in the number of residents working in professional occupations.
There has been a 42% decrease in sales and customer service occupations. 40<br>
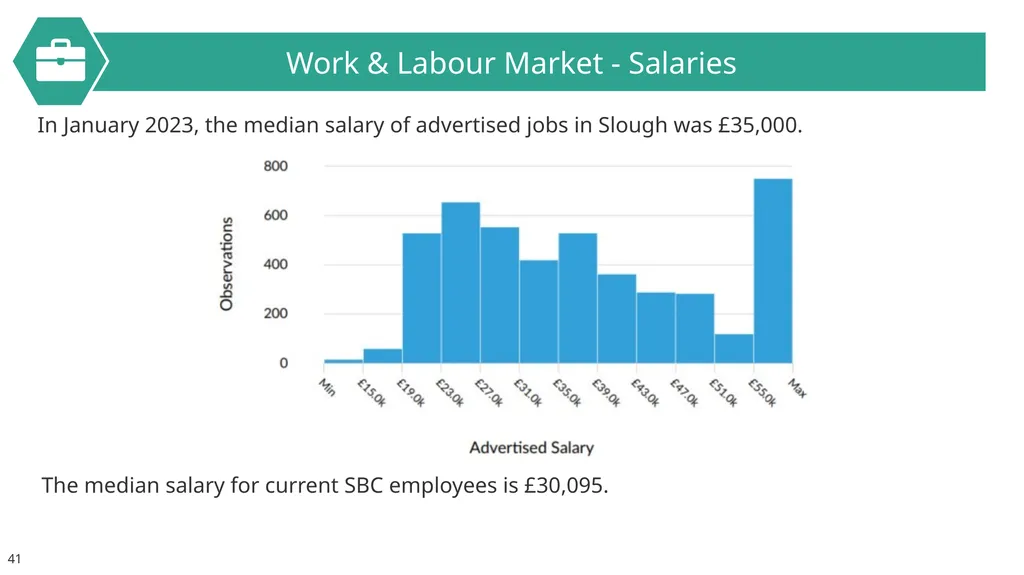
slide41. Work & Labour Market - Salaries In January 2023, the median salary of advertised jobs in Slough was £35,000. The median salary for current SBC employees is £30,095. 41<br>
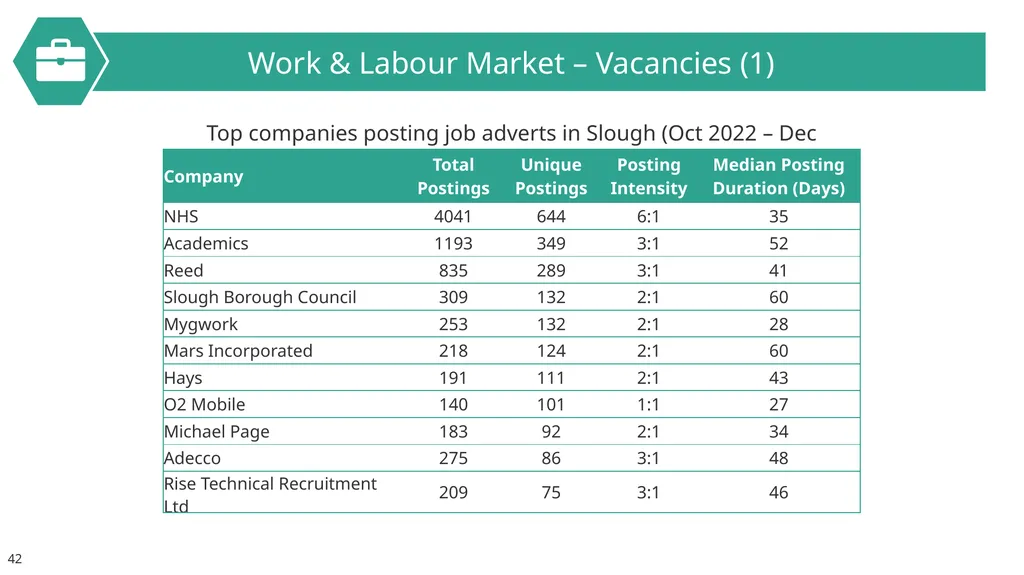
slide42. Work & Labour Market – Vacancies (1) Top companies posting job adverts in Slough (Oct 2022 – Dec 2022) 42<br>
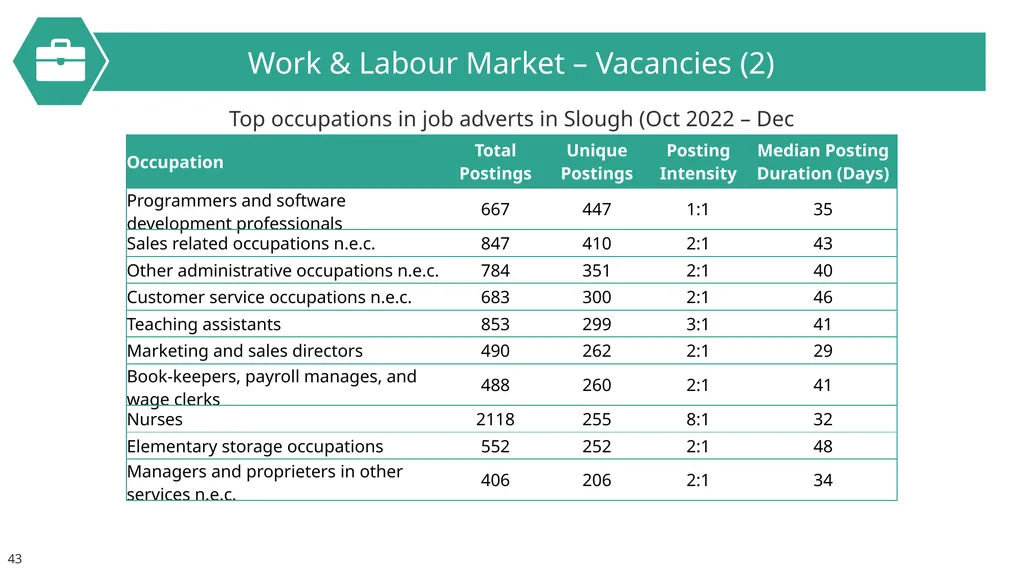
slide43. Work & Labour Market – Vacancies (2) Top occupations in job adverts in Slough (Oct 2022 – Dec 2022) 43<br>
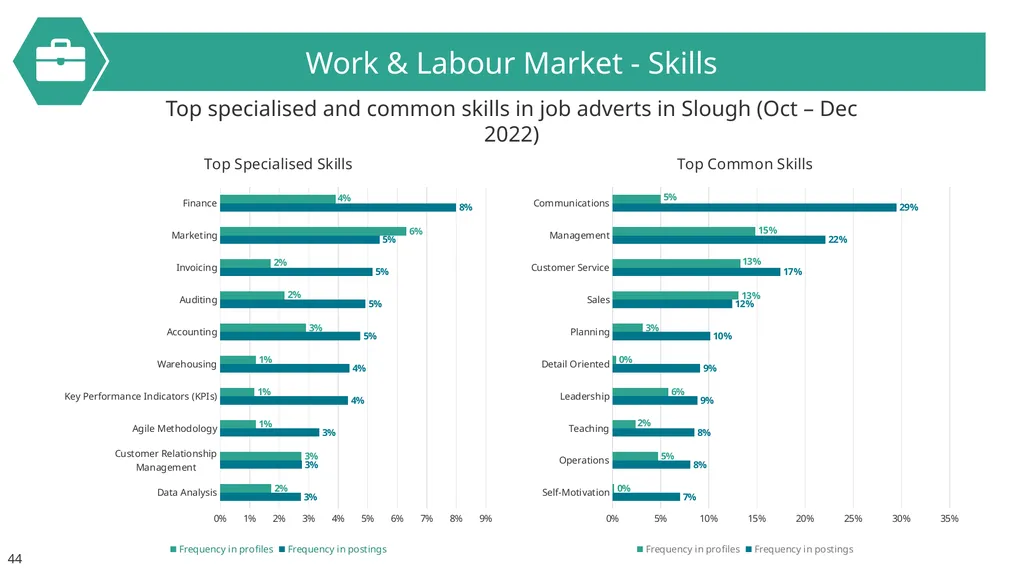
slide44. Work & Labour Market - Skills Top specialised and common skills in job adverts in Slough (Oct – Dec 2022) 44<br>
slide45. 45 Vulnerability<br>
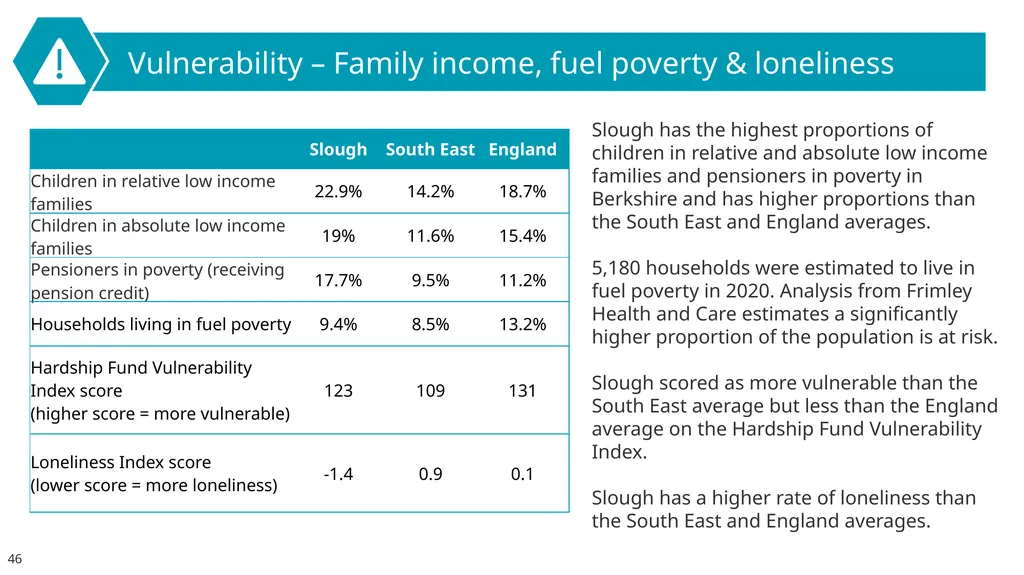
slide46. Vulnerability – Family income, fuel poverty & loneliness Slough has the highest proportions of children in relative and absolute low income families and pensioners in poverty in Berkshire and has higher proportions than the South East and England averages.
5,180 households were estimated to live in fuel poverty in 2020. Analysis from Frimley Health and Care estimates a significantly higher proportion of the population is at risk.
Slough scored as more vulnerable than the South East average but less than the England average on the Hardship Fund Vulnerability Index.
Slough has a higher rate of loneliness than the South East and England averages. 46<br>
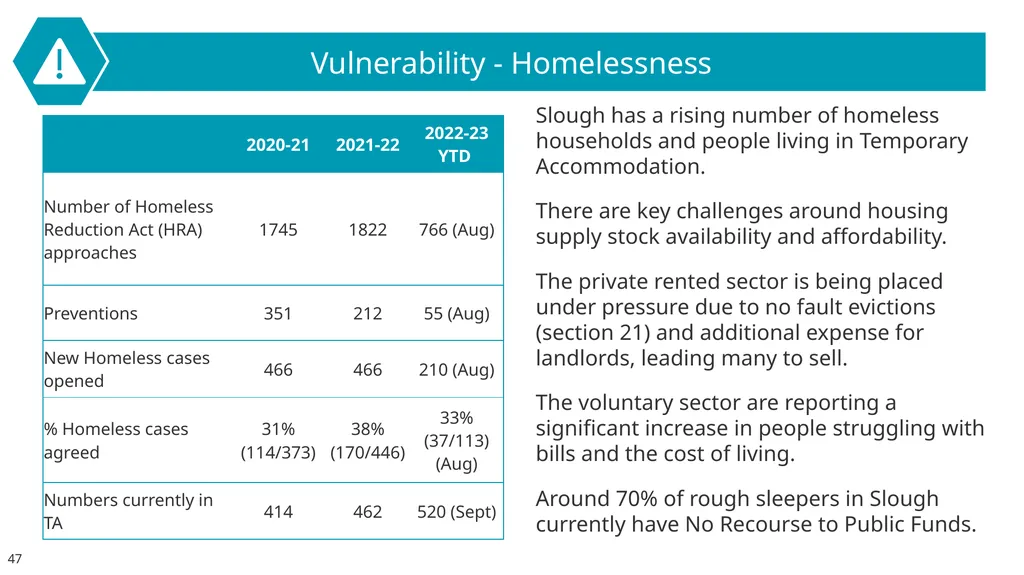
slide47. Vulnerability - Homelessness Slough has a rising number of homeless households and people living in Temporary Accommodation.
There are key challenges around housing supply stock availability and affordability.
The private rented sector is being placed under pressure due to no fault evictions (section 21) and additional expense for landlords, leading many to sell.
The voluntary sector are reporting a significant increase in people struggling with bills and the cost of living.
Around 70% of rough sleepers in Slough currently have No Recourse to Public Funds. 47<br>
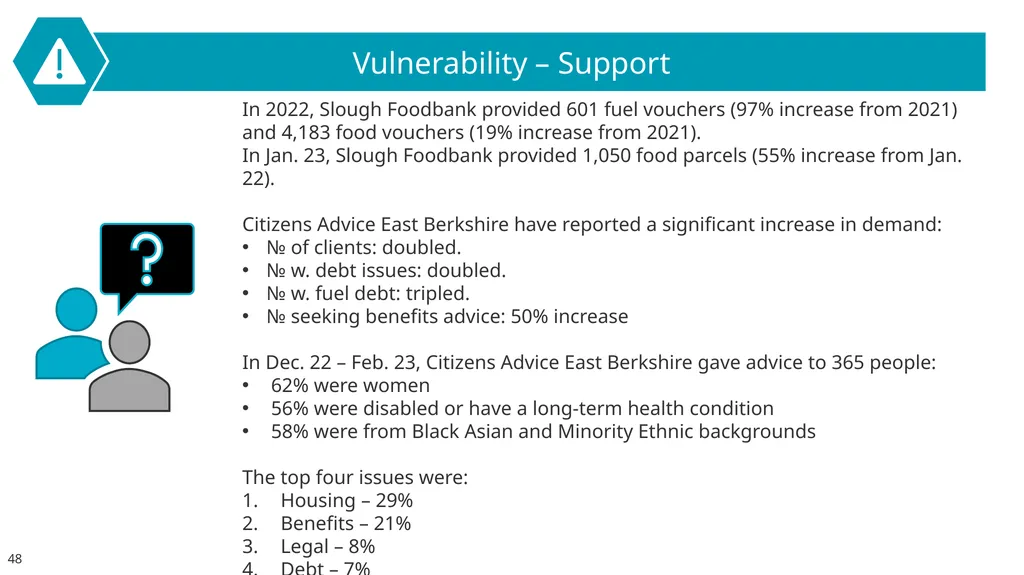
slide48. Vulnerability – Support In 2022, Slough Foodbank provided 601 fuel vouchers (97% increase from 2021) and 4,183 food vouchers (19% increase from 2021).
In Jan. 23, Slough Foodbank provided 1,050 food parcels (55% increase from Jan. 22).
Citizens Advice East Berkshire have reported a significant increase in demand:
№ of clients: doubled.
№ w. debt issues: doubled.
№ w. fuel debt: tripled.
№ seeking benefits advice: 50% increase
In Dec. 22 – Feb. 23, Citizens Advice East Berkshire gave advice to 365 people:
62% were women
56% were disabled or have a long-term health condition
58% were from Black Asian and Minority Ethnic backgrounds
The top four issues were:
Housing – 29%
Benefits – 21%
Legal – 8%
Debt – 7% 48<br>
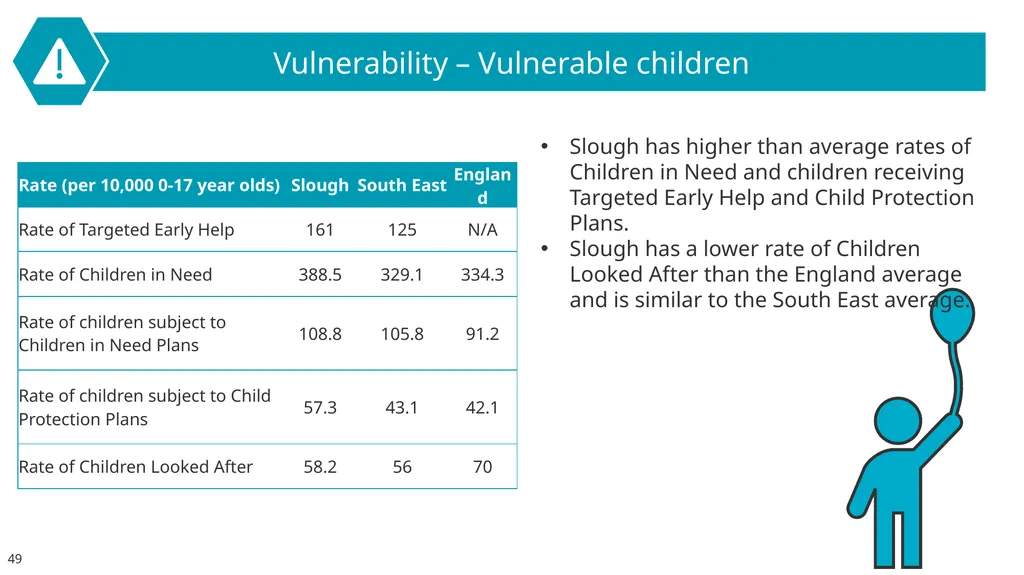
slide49. Vulnerability – Vulnerable children Slough has higher than average rates of Children in Need and children receiving Targeted Early Help and Child Protection Plans.
Slough has a lower rate of Children Looked After than the England average and is similar to the South East average. 49<br>
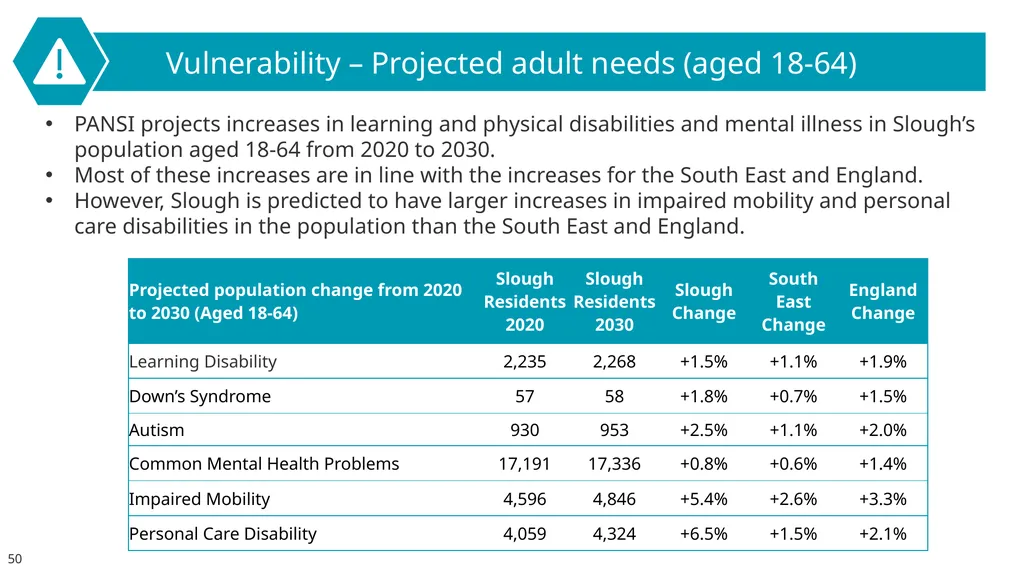
slide50. Vulnerability – Projected adult needs (aged 18-64) PANSI projects increases in learning and physical disabilities and mental illness in Slough’s population aged 18-64 from 2020 to 2030.
Most of these increases are in line with the increases for the South East and England.
However, Slough is predicted to have larger increases in impaired mobility and personal care disabilities in the population than the South East and England. 50<br>
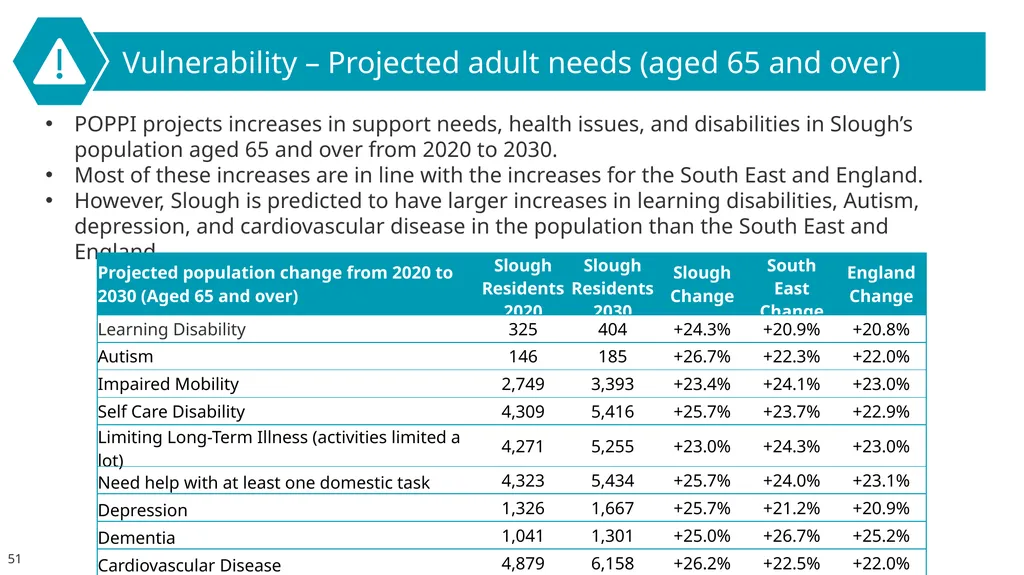
slide51. Vulnerability – Projected adult needs (aged 65 and over) POPPI projects increases in support needs, health issues, and disabilities in Slough’s population aged 65 and over from 2020 to 2030.
Most of these increases are in line with the increases for the South East and England.
However, Slough is predicted to have larger increases in learning disabilities, Autism, depression, and cardiovascular disease in the population than the South East and England. 51<br>
slide52. 52 Income<br>
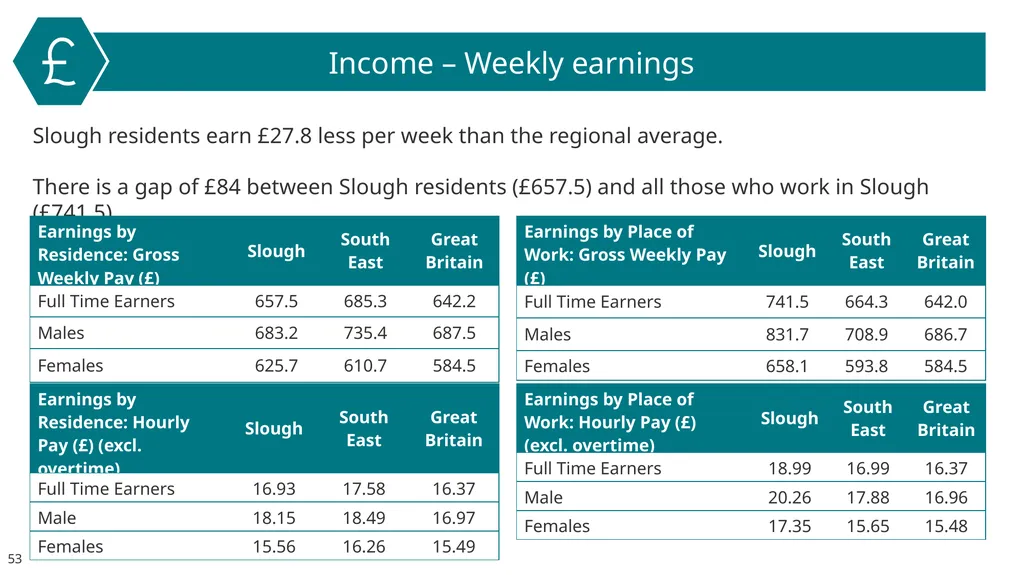
slide53. Income – Weekly earnings Slough residents earn £27.8 less per week than the regional average.
There is a gap of £84 between Slough residents (£657.5) and all those who work in Slough (£741.5). 53<br>
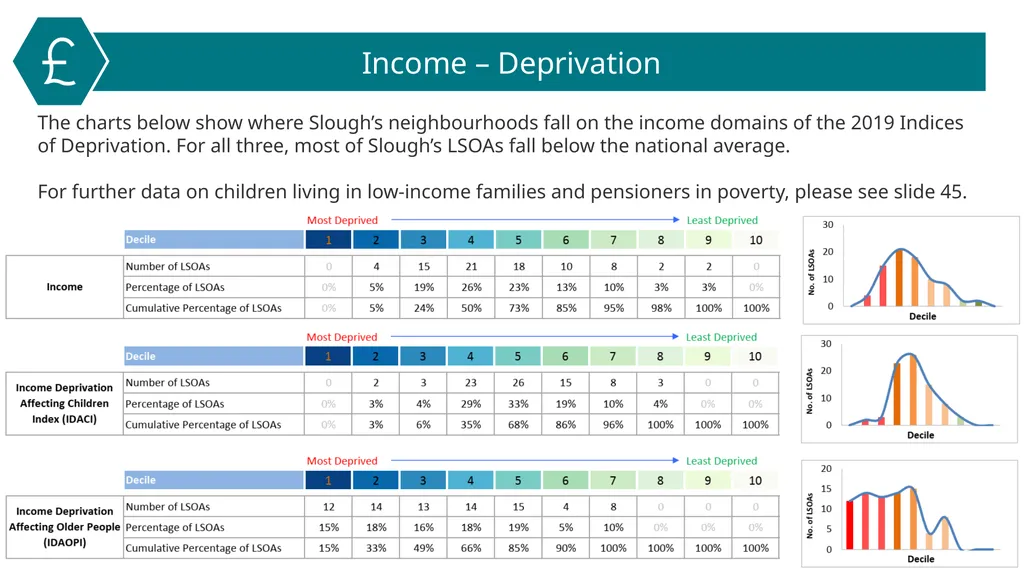
slide54. Income – Deprivation The charts below show where Slough’s neighbourhoods fall on the income domains of the 2019 Indices of Deprivation. For all three, most of Slough’s LSOAs fall below the national average.
For further data on children living in low-income families and pensioners in poverty, please see slide 45. 54<br>
slide55. 55 Crime<br>
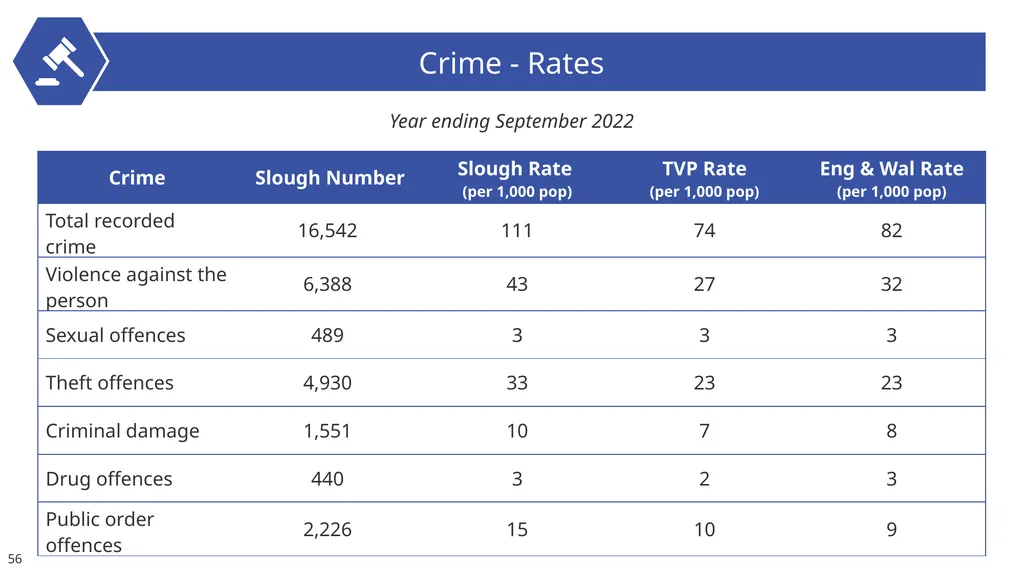
slide56. Crime - Rates Year ending September 2022 56<br>
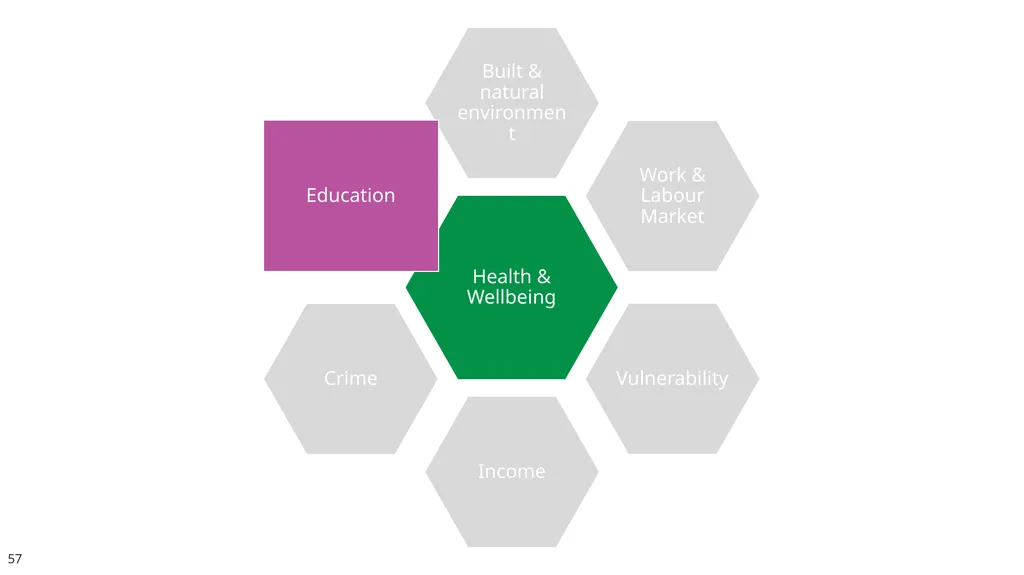
slide57. 57 Education<br>
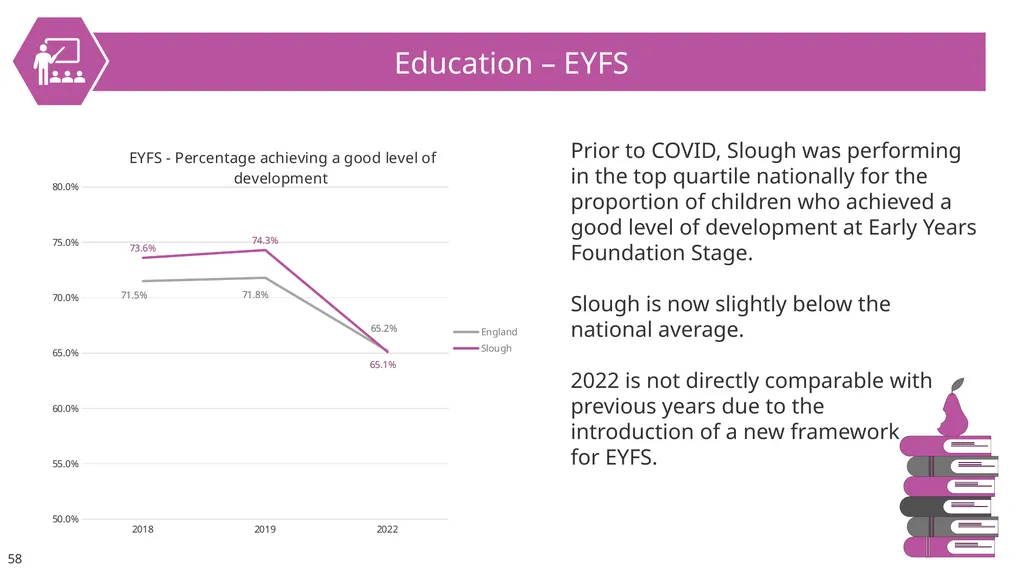
slide58. Education – EYFS Prior to COVID, Slough was performing in the top quartile nationally for the proportion of children who achieved a good level of development at Early Years Foundation Stage.
Slough is now slightly below the national average.
2022 is not directly comparable with previous years due to the introduction of a new framework for EYFS. 58<br>
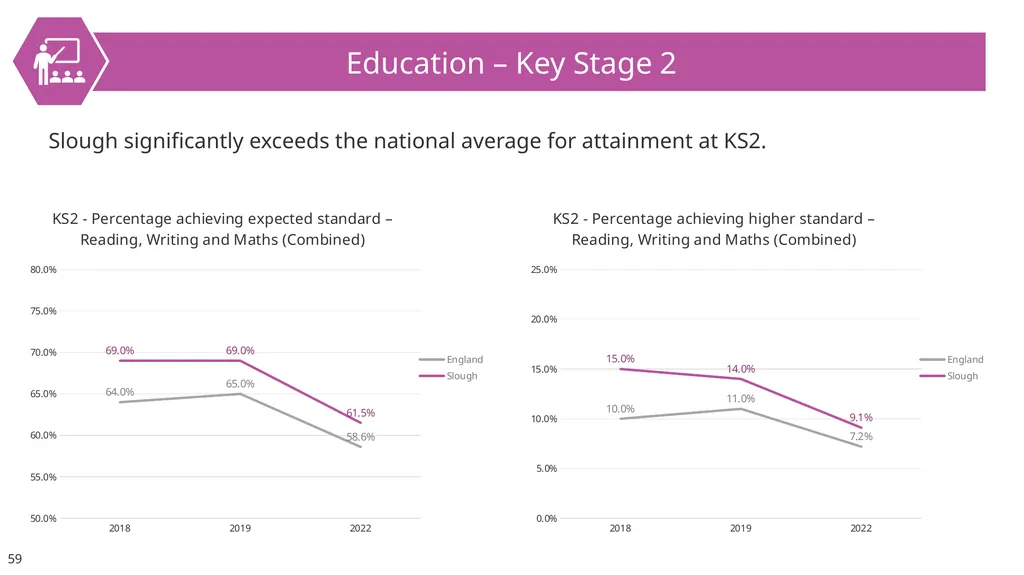
slide59. Education – Key Stage 2 Slough significantly exceeds the national average for attainment at KS2. 59<br>
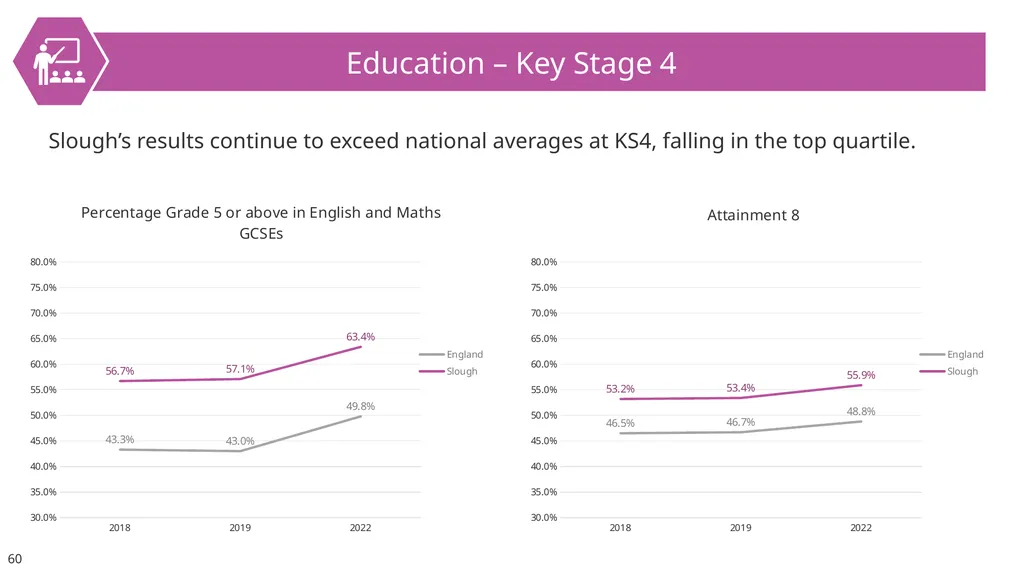
slide60. Education – Key Stage 4 Slough’s results continue to exceed national averages at KS4, falling in the top quartile. 60<br>
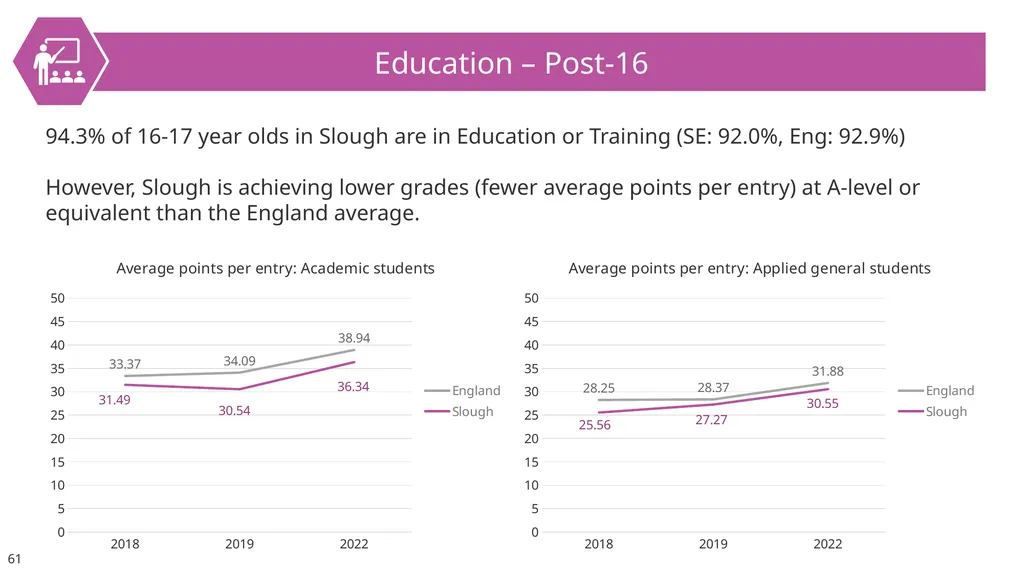
slide61. Education – Post-16 94.3% of 16-17 year olds in Slough are in Education or Training (SE: 92.0%, Eng: 92.9%)
However, Slough is achieving lower grades (fewer average points per entry) at A-level or equivalent than the England average. 61<br>
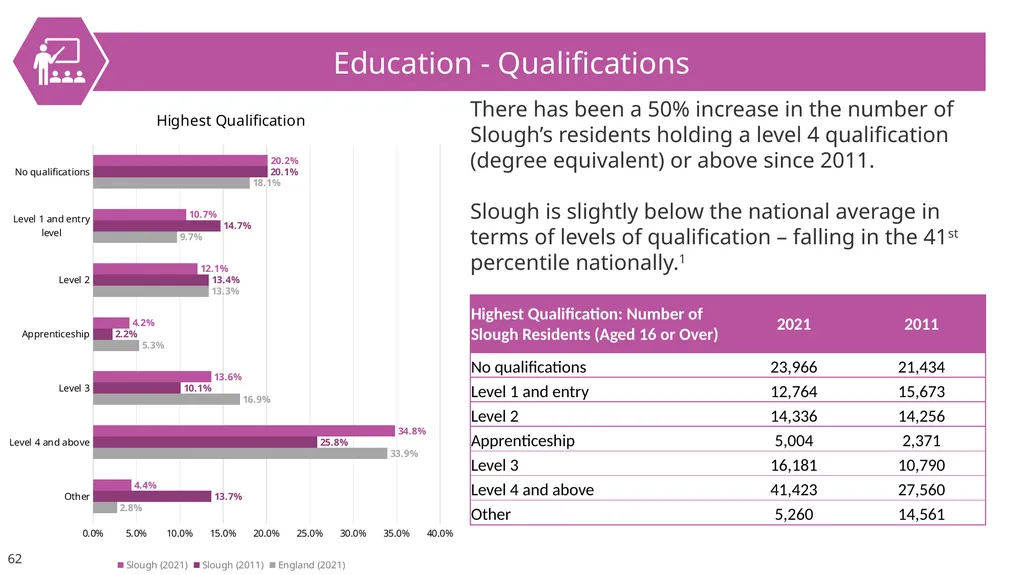
slide62. Education - Qualifications There has been a 50% increase in the number of Slough’s residents holding a level 4 qualification (degree equivalent) or above since 2011.
Slough is slightly below the national average in terms of levels of qualification – falling in the 41st percentile nationally.1 62<br>
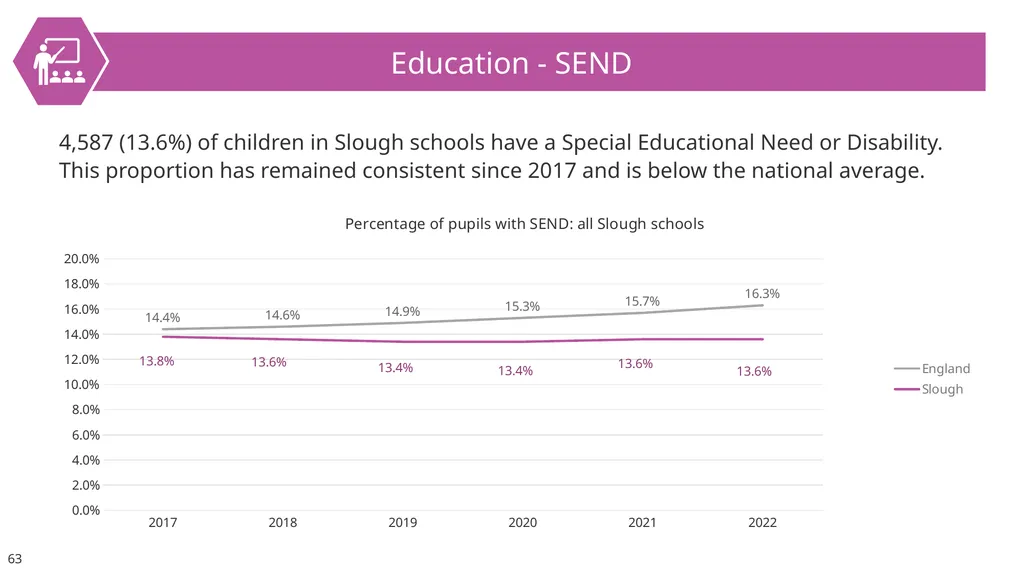
slide63. Education - SEND 4,587 (13.6%) of children in Slough schools have a Special Educational Need or Disability. This proportion has remained consistent since 2017 and is below the national average. 63<br>
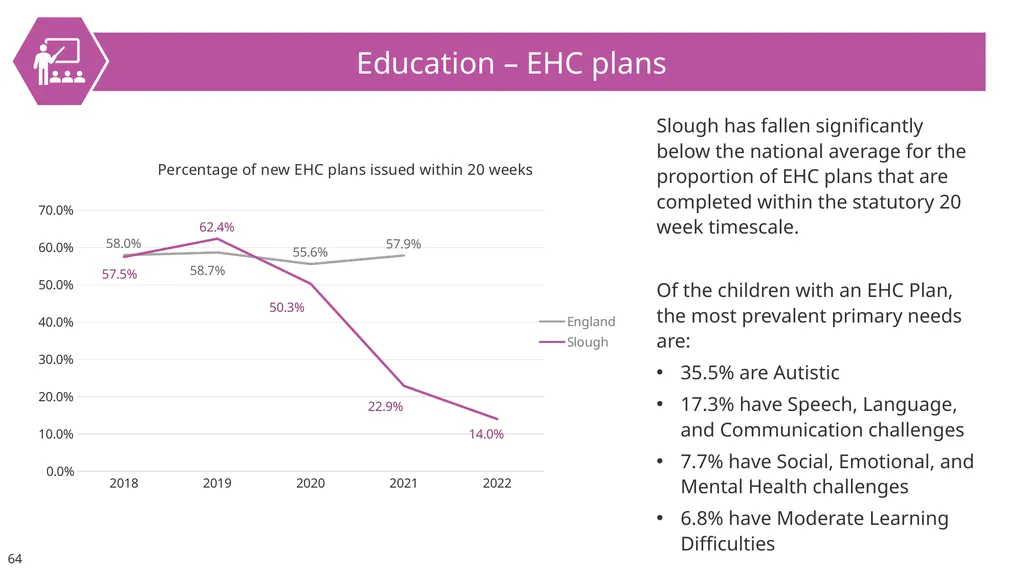
slide64. Education – EHC plans Slough has fallen significantly below the national average for the proportion of EHC plans that are completed within the statutory 20 week timescale.
Of the children with an EHC Plan, the most prevalent primary needs are:
35.5% are Autistic
17.3% have Speech, Language, and Communication challenges
7.7% have Social, Emotional, and Mental Health challenges
6.8% have Moderate Learning Difficulties 64<br>
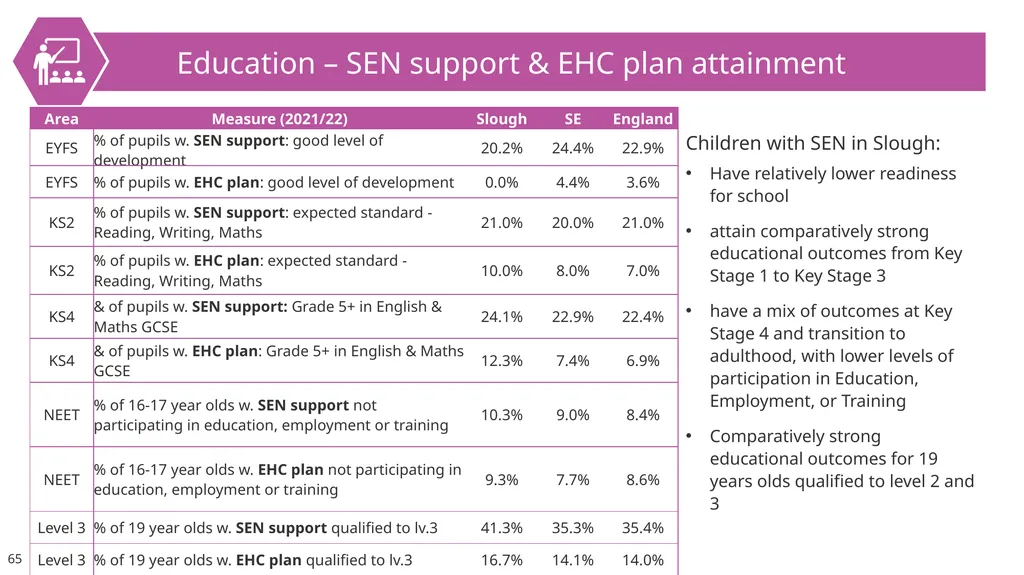
slide65. Education – SEN support & EHC plan attainment Children with SEN in Slough:
Have relatively lower readiness for school
attain comparatively strong educational outcomes from Key Stage 1 to Key Stage 3
have a mix of outcomes at Key Stage 4 and transition to adulthood, with lower levels of participation in Education, Employment, or Training
Comparatively strong educational outcomes for 19 years olds qualified to level 2 and 3 65<br>
slide66. Sources Data in this pack:
2021 Census
2011 Census
2019 Indices of Deprivation
ONS: People, population and community
OHID: Fingertips Public Health Data
NOMIS: Census & Labour Market
Community Safety Partnership Recorded Crime Other useful sources:
Berkshire Observatory
Berkshire East JSNA
PHOF Wider Determinants of Health
Local Insight (login required – contact Strategic Insight Team) 66<br>
slide2. About this pack… This pack has been created to provide some insights on Slough, our residents and the borough’s economy. It draws upon new data from the 2021 Census, as well as other key sources of information.
It is intended to be viewed as a first point of reference, to provide high-level insights on key challenges and key strengths for the town, and is designed as a tool to support the council in the development of our strategies and in making evidence-based decisions.
This pack should be used alongside other key sources of information, such as the Joint Strategic Needs Assessment (JSNA), equalities data, resident consultations and other service-level sources of data.
In order to save room – data sources and definitions are in the ‘notes section’ of the slides, and links to our data sources can be found on the final slide. 2<br>
slide3. Headlines Slough has a diverse, young population.
Slough has pockets of severe deprivation.
Slough has high levels of overcrowding and the largest average household size in England and Wales.
There has been a larger increase in economically inactive people than active people in Slough since 2011.
Slough has a high proportion of children in low income families and pensioners in poverty in Berkshire. There is a gap in income of £84 per week between Slough residents and those who commute into Slough for work.
There are high levels of crime, including violent crime.
Slough has generally good levels of educational attainment but is below the national average for post-16 education and qualifications. 3<br>
slide4. Contents (1) 4<br>
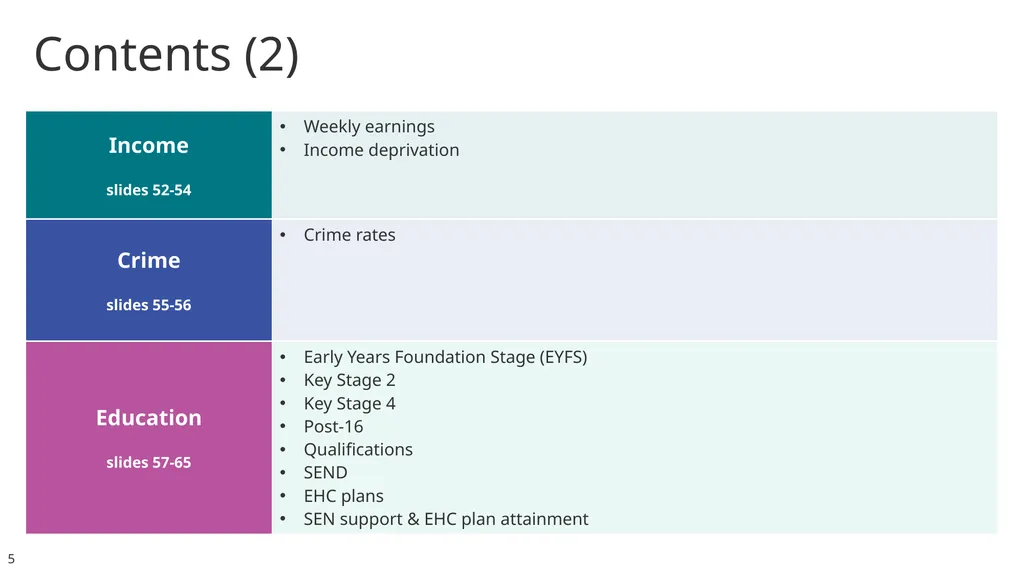
slide5. Contents (2) 5<br>
slide6. Population 6<br>
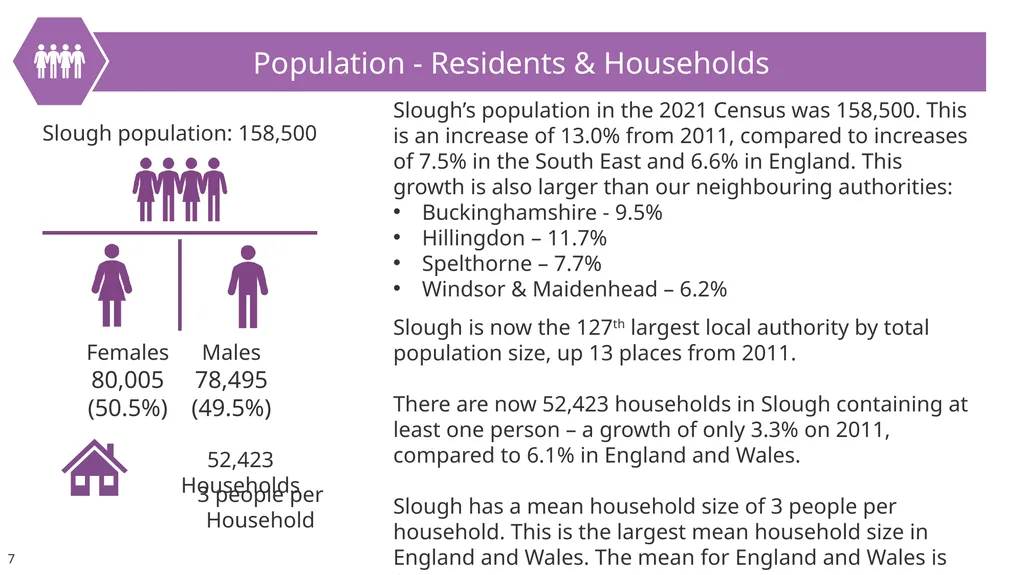
slide7. Population - Residents & Households Slough population: 158,500 Females
80,005
(50.5%) Males
78,495
(49.5%) 52,423 Households 3 people per Household Slough’s population in the 2021 Census was 158,500. This is an increase of 13.0% from 2011, compared to increases of 7.5% in the South East and 6.6% in England. This growth is also larger than our neighbouring authorities:
Buckinghamshire - 9.5%
Hillingdon – 11.7%
Spelthorne – 7.7%
Windsor & Maidenhead – 6.2%
Slough is now the 127th largest local authority by total population size, up 13 places from 2011.
There are now 52,423 households in Slough containing at least one person – a growth of only 3.3% on 2011, compared to 6.1% in England and Wales.
Slough has a mean household size of 3 people per household. This is the largest mean household size in England and Wales. The mean for England and Wales is 2.4. 7<br>
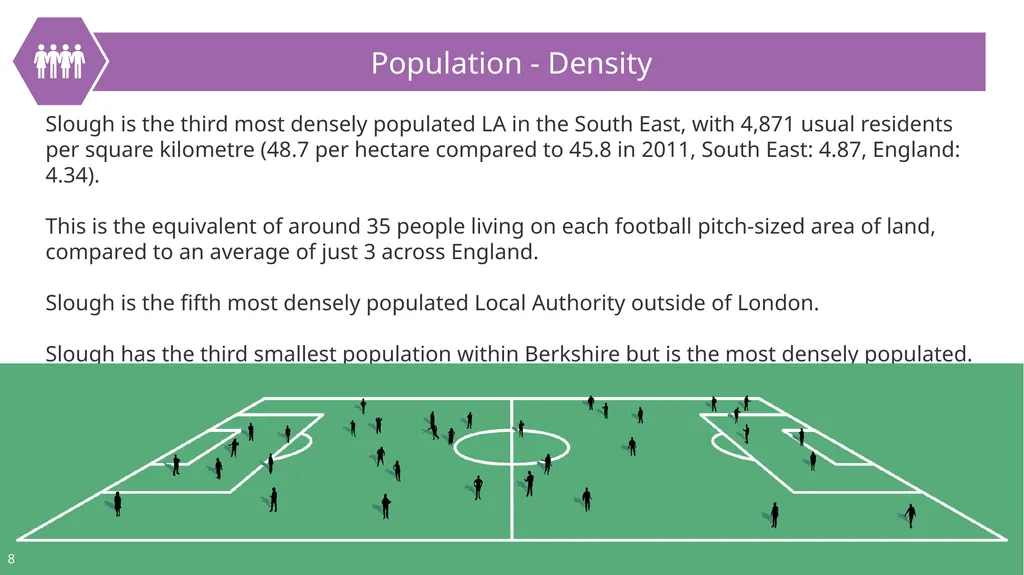
slide8. Population - Density Slough is the third most densely populated LA in the South East, with 4,871 usual residents per square kilometre (48.7 per hectare compared to 45.8 in 2011, South East: 4.87, England: 4.34).
This is the equivalent of around 35 people living on each football pitch-sized area of land, compared to an average of just 3 across England.
Slough is the fifth most densely populated Local Authority outside of London.
Slough has the third smallest population within Berkshire but is the most densely populated. 8<br>
slide9. Population - Age 25% of Slough’s residents are aged 0-15, 65.4% are aged 16-64, and 9.7% are aged 65 or over.
Slough’s average age is 34, compared to 41 for the South East and 40 for England.
Slough has the second highest proportion of children aged 15 or under in England and Wales, behind only Barking and Dagenham. 9<br>
slide10. Population – Country of Birth (Broad) 56% of Slough’s population were born in the UK, 24.3% were born in the Middle East and Asia, and 12.0% were born in the EU. 10<br>
slide11. Population – Country of Birth (Detailed) After England, the most selected countries of birth for residents in Slough were:
India
Pakistan
Poland
Romania
Kenya
10.5% of Slough’s population arrived in the UK aged 0-15, 33.2% arrived aged 16-64, and 0.3% arrived aged 65 or over.
64.1% of the migrant population in Slough have resided in the UK for 10 or more years, 15.6% for 5-9 years, 11.3% for 2-4 years, and 9% for less than 2 years. 11<br>
slide12. Population – Ethnicity (1) 46.7% of Slough’s population are from Asian ethnic groups and 36.0% are from White ethnic groups. 12<br>
slide13. Population – Ethnicity (2) 13<br>
slide14. Population – National identity 23% of Slough’s population identify as a non-UK identity only
7,767 people (4.9%) identify as Polish only
6,866 (4.3%) identify as Indian only
3,828 (2.4%) identify as Pakistani only
3,295 (2.1%) identify as Romanian only 14<br>
slide15. Population - Language 72.7% of Slough’s population aged 3 and over speak English as their main language (England: 90.8%).
68 people in Slough use a Sign Language as their main language (57 use BSL).
Of those that did not speak English as their main language in Slough, 42.8% can speak English very well, which is an increase of 34% from 2011. 15<br>
slide16. Population - Religion The number of Christians in Slough has decreased by 12.2% since 2011, while the number of Muslims has increased by 42.9% and the number of Sikhs has increased by 20.8%.
Slough has the 11th fewest people nationally who stated they have no religion (13.1% of Slough’s population, compared to 36.7% for England). 16<br>
slide17. Population - Sexual orientation & gender identity 1.9% of Slough’s population identified as an LGB+ orientation (lower than the England average of 3.2%).
0.9% of Slough’s population identified as a different gender to their sex registered at birth (same as the England average). 17<br>
slide18. Population – Deprivation (1) Slough is more deprived than the England average on the 2019 Index of Multiple Deprivation (IMD).
71% of Slough’s Lower-tier Super Output Areas (LSOAs) fall below the national average of the IMD.
There are particularly severe pockets in Britwell, Chalvey, Wexham Lea, and Colnbrook with Poyle. 18<br>
slide19. Population – Deprivation (2) 30,240 households in Slough (57.7%) are deprived in one or more dimension (compared to 51.6% in England). This is a decrease of 8% from 2011, when it was 65.1%.
The number of households deprived in one dimension has increased by 4%, but there has been a 24% decrease in households deprived in two or more dimensions and a 25% increase in households that are not deprived in any dimension. 19<br>
slide20. Health Inequalities in Slough 20<br>
slide21. Population - General health Over half of Slough’s population reported “very good” health in 2021. This proportion has increased since 2011.
Slough has a smaller proportion of residents reporting they have “very good” health than the England average and a slightly larger proportion of residents with “good” or “fair” health. 21<br>
slide22. Population - General wellbeing Slough has similar average scores for anxiety and happiness to the South East and England averages, but has lower average scores for life satisfaction and feeling that the things they do are worthwhile.
Slough has smaller proportions of people with “very good” ratings for anxiety, happiness, life satisfaction, and feeling worthwhile than the England average, but has higher proportions of “good” ratings.
Slough has smaller proportions of “poor” ratings for anxiety and happiness than the England average, but slightly higher proportions for “poor” life satisfaction and feeling worthwhile. 22<br>
slide23. Population – Disability (1) The proportion of disabled people in Slough has decreased since 2011. However, it is important to note that the ONS has changed the way it identifies disabled people2, which may have impacted the number of people identified as disabled in the data.
Slough has a smaller proportion of disabled people than the England average. 23<br>
slide24. Population – Disability (2) Slough has a smaller proportion of households with disabled residents than the England average.
The number of households with one or more disabled people has decreased since 2011. However, it is important to note that the ONS has changed the way it identifies disabled people2 since 2011, which may have impacted the number of people identified as disabled in the data. 24<br>
slide25. Population – Unpaid care The proportion of residents providing 1-19 hours of unpaid care a week has decreased since 2011, but the proportion of residents providing 20-49 hours has increased slightly.
Slough has a smaller proportion of residents providing 19 hours or less of unpaid care a week than the England average. 25<br>
slide26. Wider Determinants of Health 26<br>
slide27. Wider determinants of health The wider determinants of health are a diverse range of social, economic and environmental factors which influence people’s mental and physical health.
Relative contribution of determinants of health:
30% - Health Behaviours
40% - Socio-economic Factors
20% - Clinical Care
10% - Built Environment
The Public Health Outcomes Framework uses these six domains to map these determinants. Public Health Outcomes Framework 27<br>
slide28. 28 Built & natural environment<br>
slide29. Built & Natural Environment – Household size There are 52,423 households in Slough.
Slough has the largest average household size in England and Wales at 3 people per household (England: 2.4).
There has been an increase of 49% in the number of households with 7 people and an increase of 92% in the number of households with 8 or more people.
There are now 2,078 households consisting of 7 or more people. 29<br>
slide30. Built & Natural Environment - Overcrowding 15.8% of households in Slough are overcrowded (England: 4.3%).
Slough has a higher proportion of 1 bedroom households (18.5%) than the England average (11.6%).
Slough has a smaller proportion of households with 4 or more bedrooms (Slough: 16.9%, England: 21.1%). Under-occupied Overcrowded 30<br>
slide31. Built & Natural Environment - Tenure Slough has a lower proportion of households that outright own their homes than the South East and England averages and the lowest proportion in the South East.
The proportion of households that own their home on a mortgage or loan is the same as England.
Slough has a higher proportion of households renting their homes than the South East and England averages.
The number of households renting privately has increased by 30% since 2011. 31<br>
slide32. Built & Natural Environment – Accommodation & affordability Slough has fewer detached houses/bungalows than the South East and England averages and more purpose-built blocks of flats/tenements and terraced houses/bungalows. The average house price in Slough is 10.2 times the average earnings. 32<br>
slide33. Built & Natural Environment – Housing benefit, central heating, and car availability Slough has higher proportions of people claiming housing benefit and households with no central heating than the South East and England averages.
Slough has a higher proportion of households with no car than the South East average but lower than the England average. 33<br>
slide34. Built & Natural Environment - Deprivation Slough is more deprived than the England average for barriers to housing and services in the 2019 indices of deprivation and is much more deprived than the average for wider barriers (i.e., overcrowding, homelessness, housing affordability). Slough is also more deprived than the England average for living environment (e.g., condition of home, air quality). 34<br>
slide35. Green spaces and air quality Slough has 240 hectares of green space (7.4% of the borough, England: 2.2%).
98 hectares of this is public parks and gardens (3% of the borough, England: 0.8%).
However, Slough has higher than average concentrations of Benzene, Nitrogen Dioxide, Particulates and Sulphur Dioxide.
6.3% of mortality in Slough is attributable to particulate air pollution (England: 5.5%). 35<br>
slide36. 36 Work & Labour Market<br>
slide37. Work & Labour Market – Economic activity 67% of Slough’s population are economically active (England: 60.9%) and 33% are economically inactive (England: 39.1%)
There has been a larger increase in the number of economically inactive people (+47%) than economically active people (+8%) since 2011. 37<br>
slide38. Work & Labour Market – Unemployment & job density Slough is more deprived than the South East average but less than the England average for employment in the 2019 indices of deprivation.
Slough has a higher proportion of people claiming unemployment benefit than the South East and England averages.
Slough a higher job density than South East and England averages. 38<br>
slide39. Work & Labour Market - Industry There have been increases of 25% or more in the number of residents working in human health and social work activities, information and communication, education, and construction industries since 2011. 39<br>
slide40. Work & Labour Market - Occupation There has been a 152% increase in the number of residents working in professional occupations.
There has been a 42% decrease in sales and customer service occupations. 40<br>
slide41. Work & Labour Market - Salaries In January 2023, the median salary of advertised jobs in Slough was £35,000. The median salary for current SBC employees is £30,095. 41<br>
slide42. Work & Labour Market – Vacancies (1) Top companies posting job adverts in Slough (Oct 2022 – Dec 2022) 42<br>
slide43. Work & Labour Market – Vacancies (2) Top occupations in job adverts in Slough (Oct 2022 – Dec 2022) 43<br>
slide44. Work & Labour Market - Skills Top specialised and common skills in job adverts in Slough (Oct – Dec 2022) 44<br>
slide45. 45 Vulnerability<br>
slide46. Vulnerability – Family income, fuel poverty & loneliness Slough has the highest proportions of children in relative and absolute low income families and pensioners in poverty in Berkshire and has higher proportions than the South East and England averages.
5,180 households were estimated to live in fuel poverty in 2020. Analysis from Frimley Health and Care estimates a significantly higher proportion of the population is at risk.
Slough scored as more vulnerable than the South East average but less than the England average on the Hardship Fund Vulnerability Index.
Slough has a higher rate of loneliness than the South East and England averages. 46<br>
slide47. Vulnerability - Homelessness Slough has a rising number of homeless households and people living in Temporary Accommodation.
There are key challenges around housing supply stock availability and affordability.
The private rented sector is being placed under pressure due to no fault evictions (section 21) and additional expense for landlords, leading many to sell.
The voluntary sector are reporting a significant increase in people struggling with bills and the cost of living.
Around 70% of rough sleepers in Slough currently have No Recourse to Public Funds. 47<br>
slide48. Vulnerability – Support In 2022, Slough Foodbank provided 601 fuel vouchers (97% increase from 2021) and 4,183 food vouchers (19% increase from 2021).
In Jan. 23, Slough Foodbank provided 1,050 food parcels (55% increase from Jan. 22).
Citizens Advice East Berkshire have reported a significant increase in demand:
№ of clients: doubled.
№ w. debt issues: doubled.
№ w. fuel debt: tripled.
№ seeking benefits advice: 50% increase
In Dec. 22 – Feb. 23, Citizens Advice East Berkshire gave advice to 365 people:
62% were women
56% were disabled or have a long-term health condition
58% were from Black Asian and Minority Ethnic backgrounds
The top four issues were:
Housing – 29%
Benefits – 21%
Legal – 8%
Debt – 7% 48<br>
slide49. Vulnerability – Vulnerable children Slough has higher than average rates of Children in Need and children receiving Targeted Early Help and Child Protection Plans.
Slough has a lower rate of Children Looked After than the England average and is similar to the South East average. 49<br>
slide50. Vulnerability – Projected adult needs (aged 18-64) PANSI projects increases in learning and physical disabilities and mental illness in Slough’s population aged 18-64 from 2020 to 2030.
Most of these increases are in line with the increases for the South East and England.
However, Slough is predicted to have larger increases in impaired mobility and personal care disabilities in the population than the South East and England. 50<br>
slide51. Vulnerability – Projected adult needs (aged 65 and over) POPPI projects increases in support needs, health issues, and disabilities in Slough’s population aged 65 and over from 2020 to 2030.
Most of these increases are in line with the increases for the South East and England.
However, Slough is predicted to have larger increases in learning disabilities, Autism, depression, and cardiovascular disease in the population than the South East and England. 51<br>
slide52. 52 Income<br>
slide53. Income – Weekly earnings Slough residents earn £27.8 less per week than the regional average.
There is a gap of £84 between Slough residents (£657.5) and all those who work in Slough (£741.5). 53<br>
slide54. Income – Deprivation The charts below show where Slough’s neighbourhoods fall on the income domains of the 2019 Indices of Deprivation. For all three, most of Slough’s LSOAs fall below the national average.
For further data on children living in low-income families and pensioners in poverty, please see slide 45. 54<br>
slide55. 55 Crime<br>
slide56. Crime - Rates Year ending September 2022 56<br>
slide57. 57 Education<br>
slide58. Education – EYFS Prior to COVID, Slough was performing in the top quartile nationally for the proportion of children who achieved a good level of development at Early Years Foundation Stage.
Slough is now slightly below the national average.
2022 is not directly comparable with previous years due to the introduction of a new framework for EYFS. 58<br>
slide59. Education – Key Stage 2 Slough significantly exceeds the national average for attainment at KS2. 59<br>
slide60. Education – Key Stage 4 Slough’s results continue to exceed national averages at KS4, falling in the top quartile. 60<br>
slide61. Education – Post-16 94.3% of 16-17 year olds in Slough are in Education or Training (SE: 92.0%, Eng: 92.9%)
However, Slough is achieving lower grades (fewer average points per entry) at A-level or equivalent than the England average. 61<br>
slide62. Education - Qualifications There has been a 50% increase in the number of Slough’s residents holding a level 4 qualification (degree equivalent) or above since 2011.
Slough is slightly below the national average in terms of levels of qualification – falling in the 41st percentile nationally.1 62<br>
slide63. Education - SEND 4,587 (13.6%) of children in Slough schools have a Special Educational Need or Disability. This proportion has remained consistent since 2017 and is below the national average. 63<br>
slide64. Education – EHC plans Slough has fallen significantly below the national average for the proportion of EHC plans that are completed within the statutory 20 week timescale.
Of the children with an EHC Plan, the most prevalent primary needs are:
35.5% are Autistic
17.3% have Speech, Language, and Communication challenges
7.7% have Social, Emotional, and Mental Health challenges
6.8% have Moderate Learning Difficulties 64<br>
slide65. Education – SEN support & EHC plan attainment Children with SEN in Slough:
Have relatively lower readiness for school
attain comparatively strong educational outcomes from Key Stage 1 to Key Stage 3
have a mix of outcomes at Key Stage 4 and transition to adulthood, with lower levels of participation in Education, Employment, or Training
Comparatively strong educational outcomes for 19 years olds qualified to level 2 and 3 65<br>
slide66. Sources Data in this pack:
2021 Census
2011 Census
2019 Indices of Deprivation
ONS: People, population and community
OHID: Fingertips Public Health Data
NOMIS: Census & Labour Market
Community Safety Partnership Recorded Crime Other useful sources:
Berkshire Observatory
Berkshire East JSNA
PHOF Wider Determinants of Health
Local Insight (login required – contact Strategic Insight Team) 66<br>