Smoking Bradford District Smoking Prevalence Prevalence of smoking among persons 18 years and over Bradford District Regional Average National Average 15.6 13.1 12.7 In 2022, 15.6 of adults within Bradford District are current smokers
"Smoking Bradford District Smoking Prevalence" is the property of its rightful owner. Permission is granted to
download and print the materials on this website for personal, non-commercial use only, and to display it
on your personal computer provided you do not modify the materials and that you retain all copyright
notices contained in the materials. By downloading content from our website, you accept the terms of this
agreement.
Presentation Transcript
01
Smoking Bradford District<br>
02
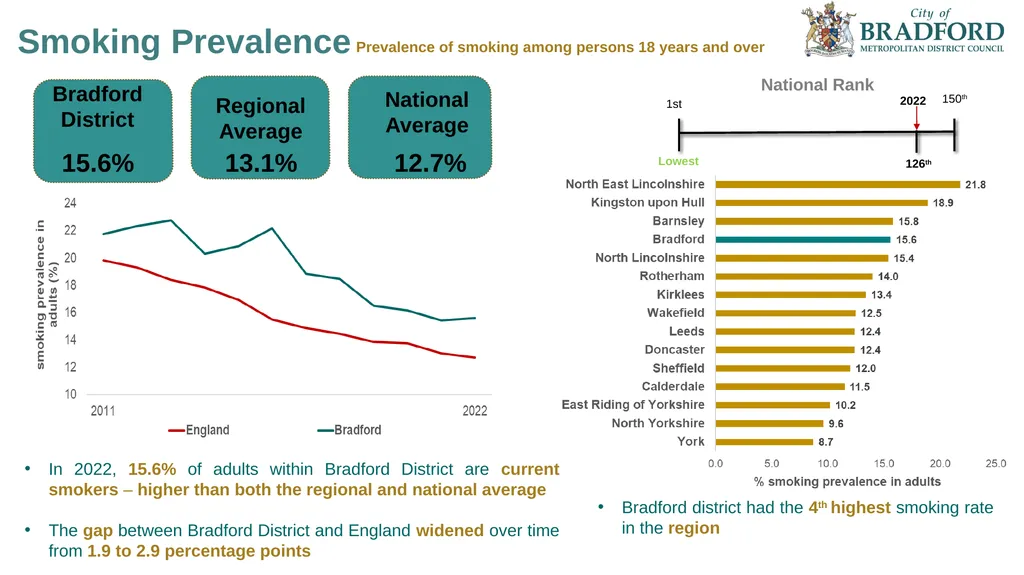
Smoking Prevalence Prevalence of smoking among persons 18 years and over Bradford District Regional Average National Average 15.6% 13.1% 12.7% In 2022, 15.6% of adults within Bradford District are current smokers – higher than both the regional and national average
The gap between Bradford District and England widened over time from 1.9 to 2.9 percentage points Bradford district had the 4th highest smoking rate in the region National Rank<br>
03
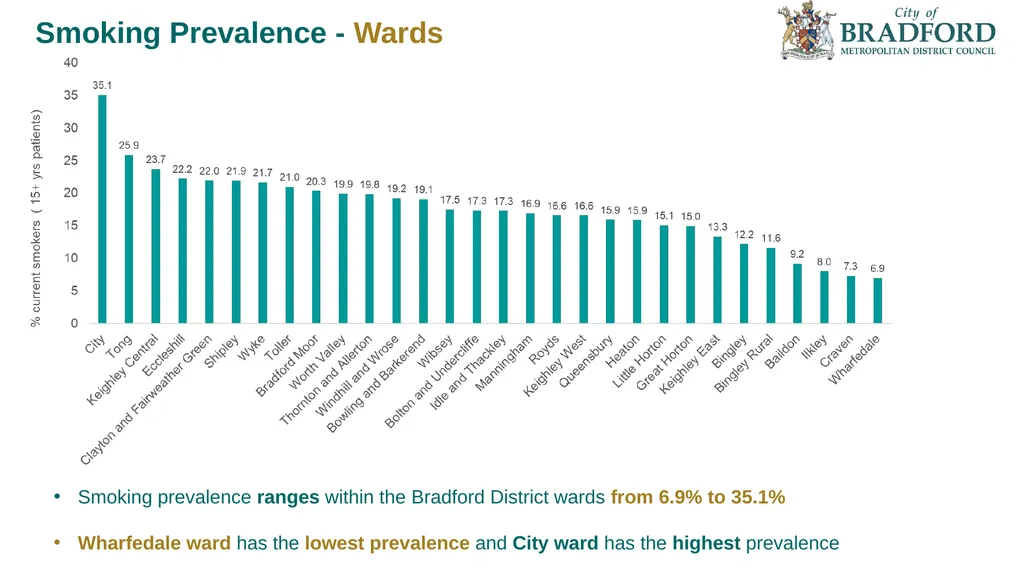
Smoking Prevalence - Wards Smoking prevalence ranges within the Bradford District wards from 6.9% to 35.1%
Wharfedale ward has the lowest prevalence and City ward has the highest prevalence<br>
04
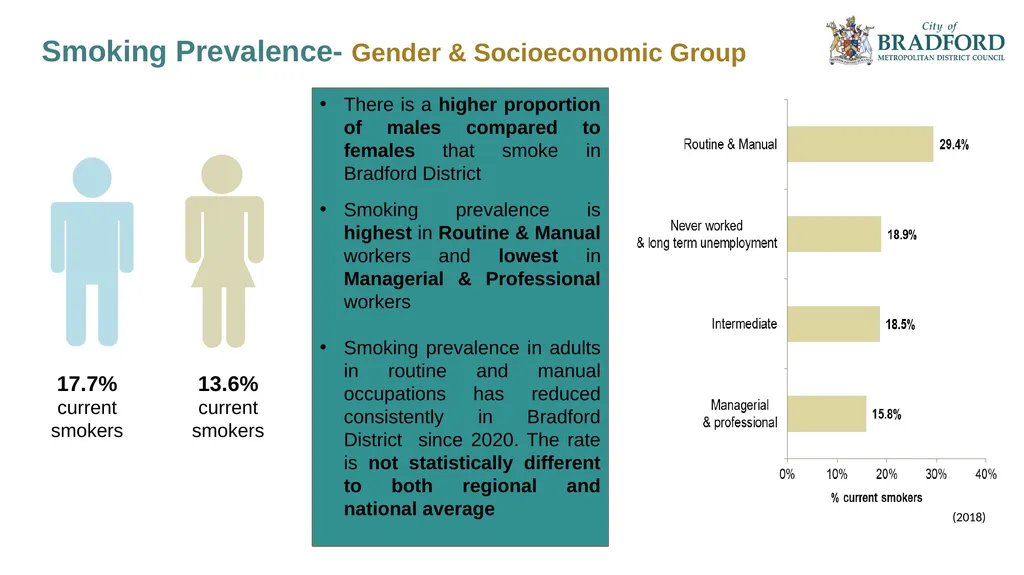
Smoking Prevalence- Gender & Socioeconomic Group 17.7% current smokers 13.6% current smokers There is a higher proportion of males compared to females that smoke in Bradford District
Smoking prevalence is highest in Routine & Manual workers and lowest in Managerial & Professional workers
Smoking prevalence in adults in routine and manual occupations has reduced consistently in Bradford District since 2020. The rate is not statistically different to both regional and national average (2018)<br>
05
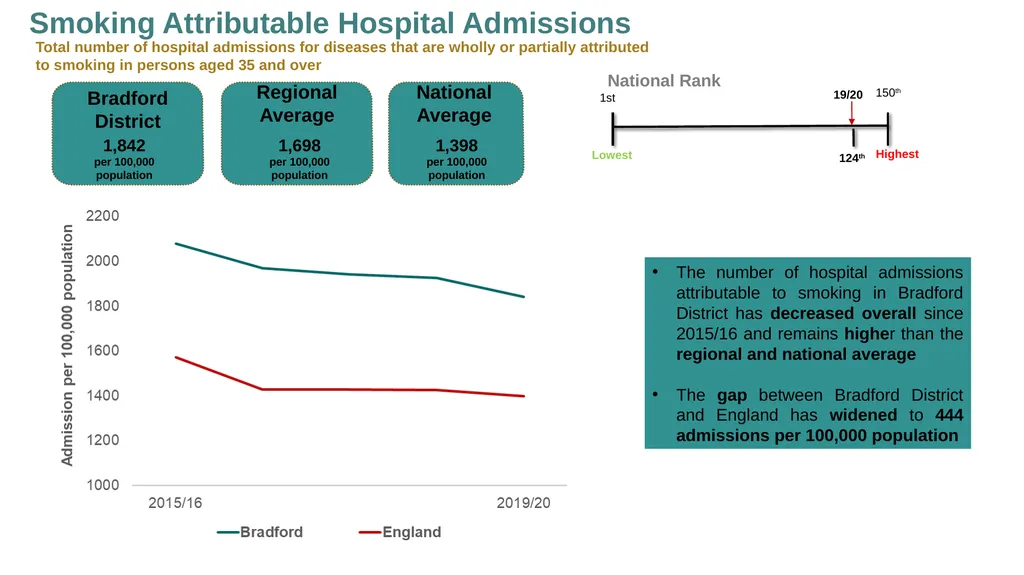
Smoking Attributable Hospital Admissions Total number of hospital admissions for diseases that are wholly or partially attributed to smoking in persons aged 35 and over National Rank 1,698
per 100,000 population Bradford District Regional Average National Average 1,842
per 100,000 population 1,398
per 100,000 population The number of hospital admissions attributable to smoking in Bradford District has decreased overall since 2015/16 and remains higher than the regional and national average
The gap between Bradford District and England has widened to 444 admissions per 100,000 population Highest<br>
06
= 7th highest
in the region =3rd highest
statistical
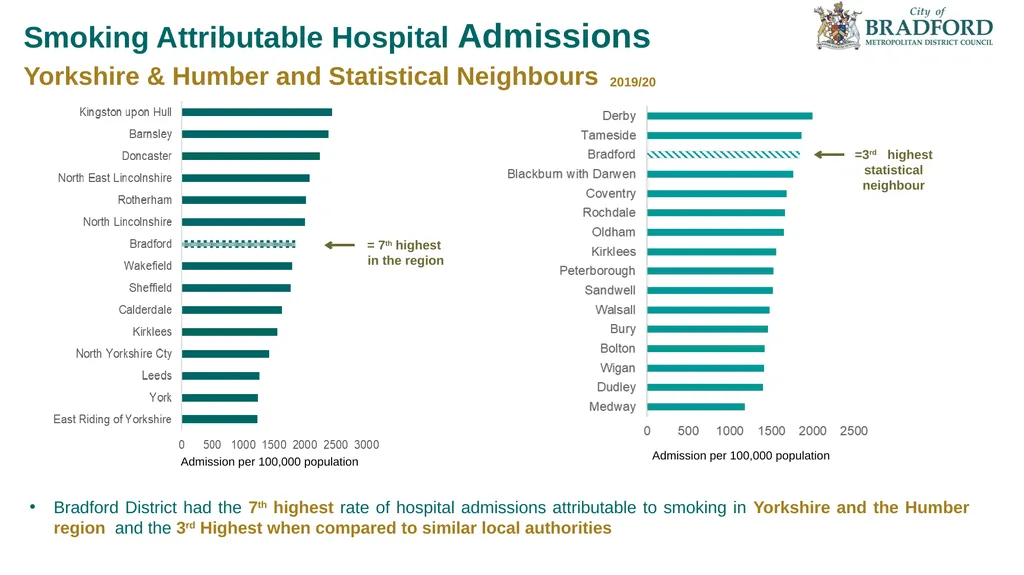
neighbour Smoking Attributable Hospital Admissions
Yorkshire & Humber and Statistical Neighbours 2019/20 Admission per 100,000 population Admission per 100,000 population Bradford District had the 7th highest rate of hospital admissions attributable to smoking in Yorkshire and the Humber region and the 3rd Highest when compared to similar local authorities<br>
07
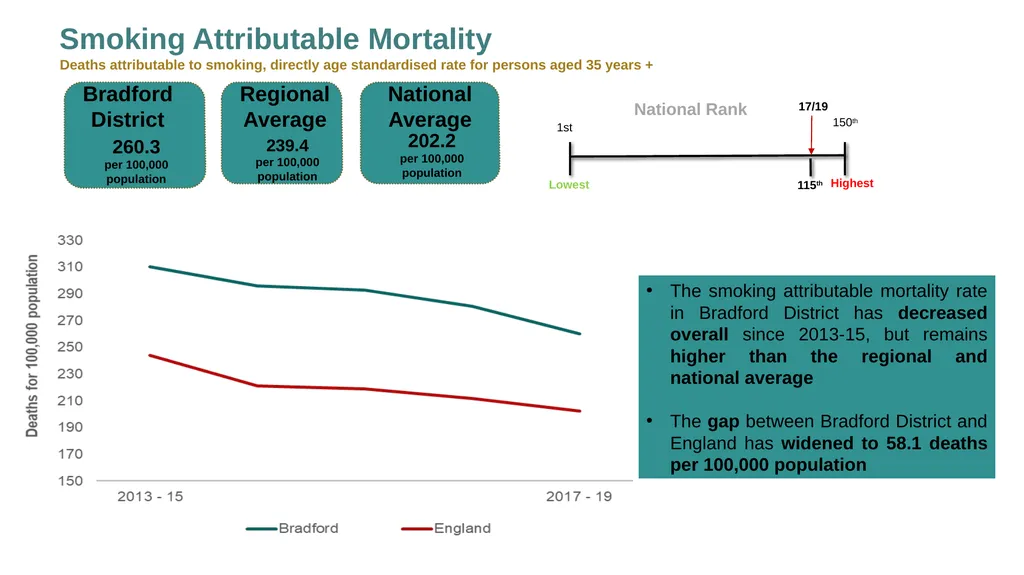
Smoking Attributable Mortality Deaths attributable to smoking, directly age standardised rate for persons aged 35 years + 239.4
per 100,000 population Bradford District Regional Average National Average 260.3
per 100,000 population 202.2
per 100,000 population National Rank The smoking attributable mortality rate in Bradford District has decreased overall since 2013-15, but remains higher than the regional and national average
The gap between Bradford District and England has widened to 58.1 deaths per 100,000 population Highest<br>
08
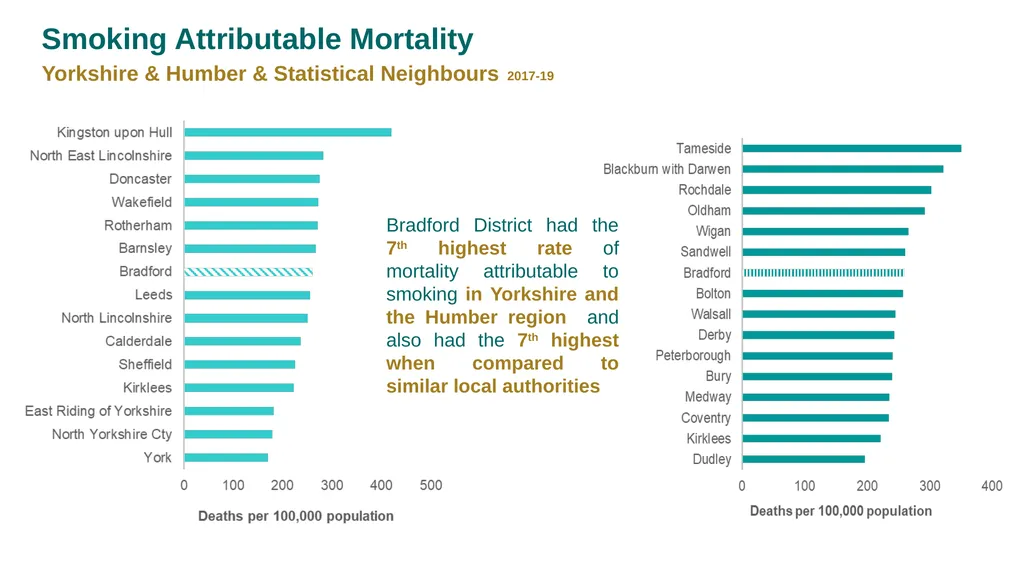
Smoking Attributable Mortality
Yorkshire & Humber & Statistical Neighbours 2017-19 Bradford District had the 7th highest rate of mortality attributable to smoking in Yorkshire and the Humber region and also had the 7th highest when compared to similar local authorities<br>
09
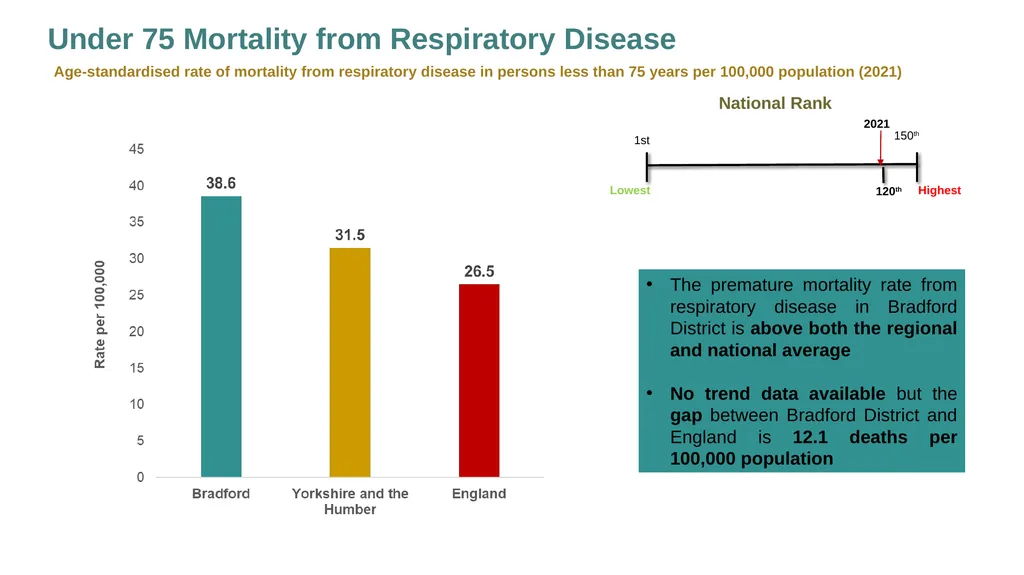
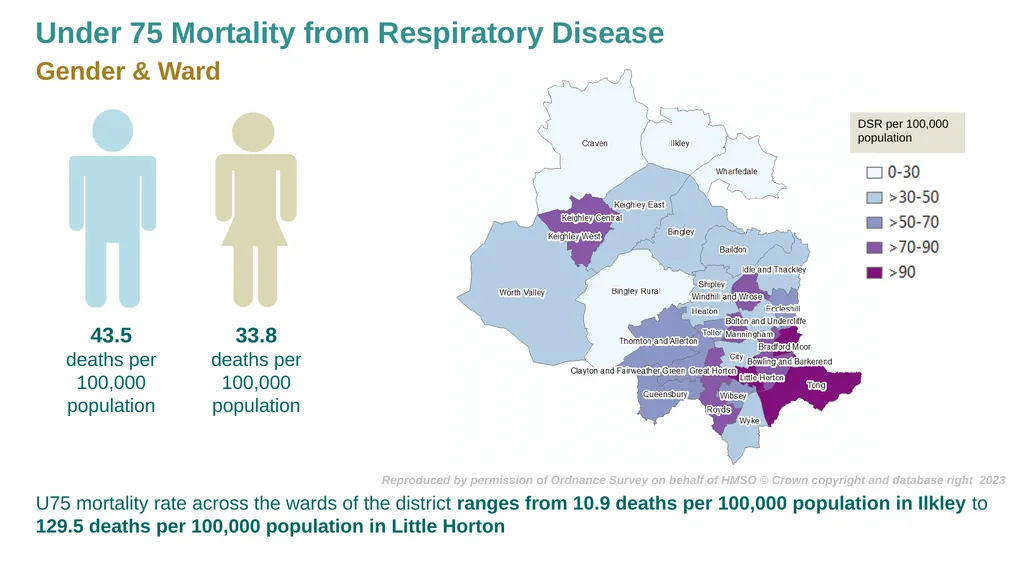
Under 75 Mortality from Respiratory Disease Age-standardised rate of mortality from respiratory disease in persons less than 75 years per 100,000 population (2021) National Rank The premature mortality rate from respiratory disease in Bradford District is above both the regional and national average
No trend data available but the gap between Bradford District and England is 12.1 deaths per 100,000 population 2021 Highest Lowest<br>
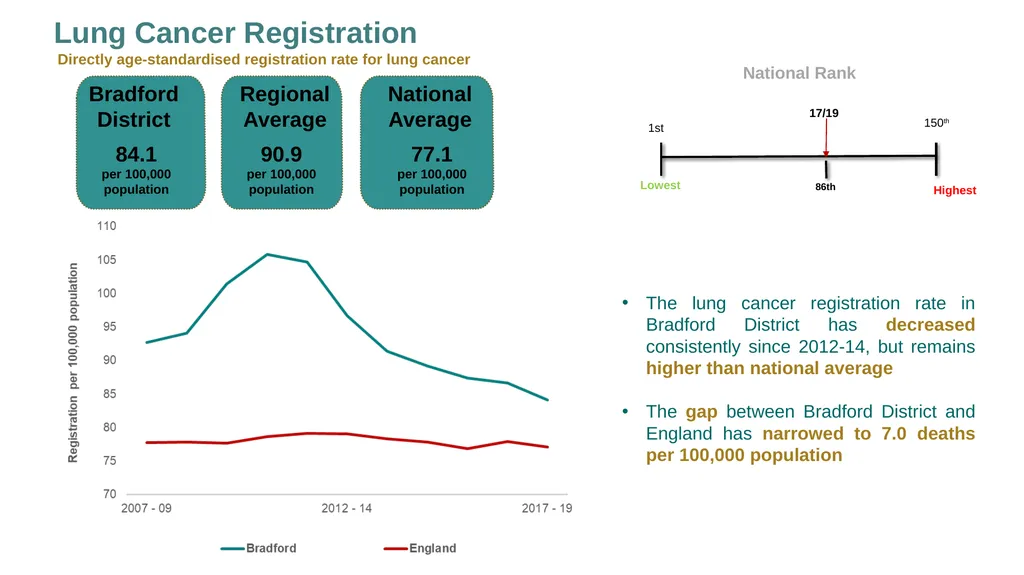
Lung Cancer Registration Directly age-standardised registration rate for lung cancer 90.9
per 100,000 population Bradford District Regional Average National Average 84.1
per 100,000 population 77.1
per 100,000 population National Rank The lung cancer registration rate in Bradford District has decreased consistently since 2012-14, but remains higher than national average
The gap between Bradford District and England has narrowed to 7.0 deaths per 100,000 population Highest<br>
12
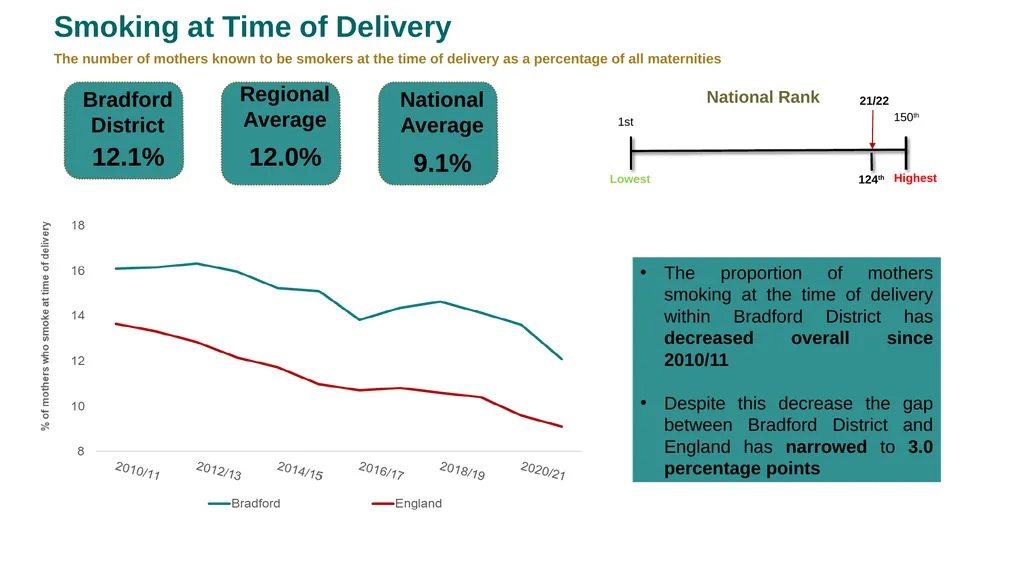
Smoking at Time of Delivery The number of mothers known to be smokers at the time of delivery as a percentage of all maternities Bradford District Regional Average National Average 12.1% 12.0% 9.1% National Rank The proportion of mothers smoking at the time of delivery within Bradford District has decreased overall since 2010/11
Despite this decrease the gap between Bradford District and England has narrowed to 3.0 percentage points Highest<br>
13
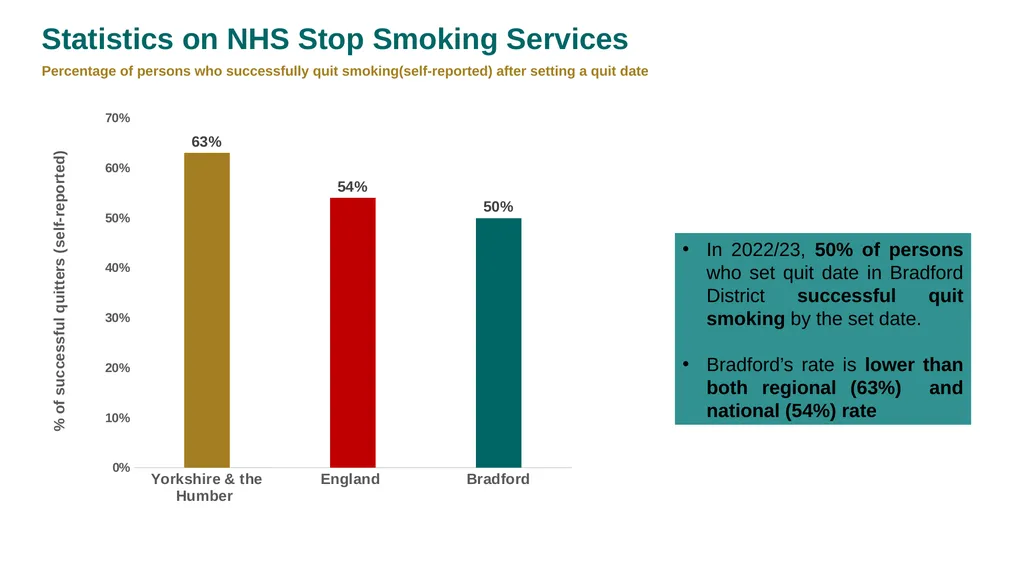
Statistics on NHS Stop Smoking Services Percentage of persons who successfully quit smoking(self-reported) after setting a quit date In 2022/23, 50% of persons who set quit date in Bradford District successful quit smoking by the set date.
Bradford’s rate is lower than both regional (63%) and national (54%) rate<br>
14
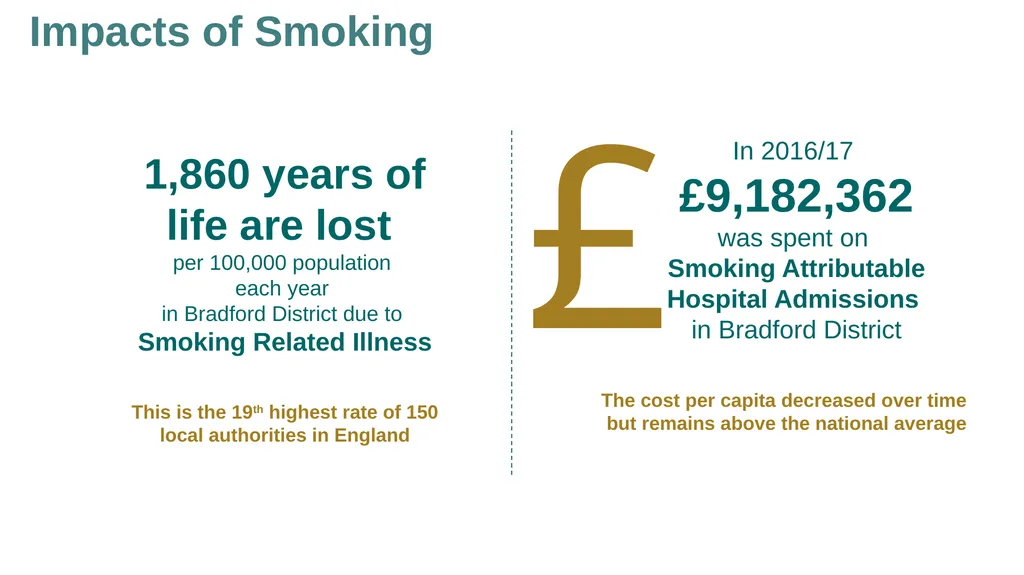
Impacts of Smoking 1,860 years of life are lost
per 100,000 population
each year
in Bradford District due to
Smoking Related Illness This is the 19th highest rate of 150 local authorities in England In 2016/17
£9,182,362
was spent on
Smoking Attributable
Hospital Admissions
in Bradford District £ The cost per capita decreased over time
but remains above the national average<br>
15
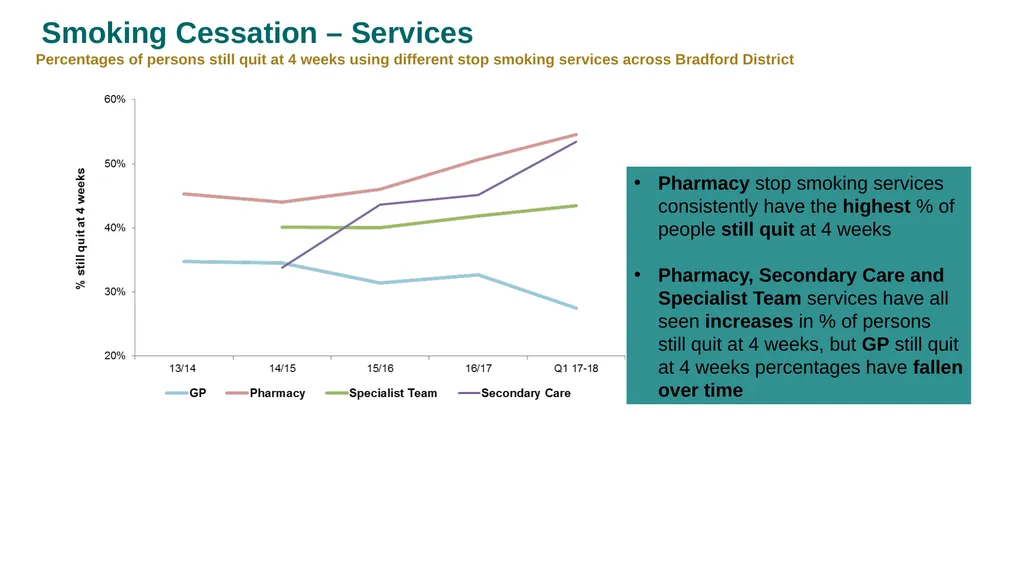
Smoking Cessation – Services Percentages of persons still quit at 4 weeks using different stop smoking services across Bradford District Pharmacy stop smoking services consistently have the highest % of people still quit at 4 weeks
Pharmacy, Secondary Care and Specialist Team services have all seen increases in % of persons still quit at 4 weeks, but GP still quit at 4 weeks percentages have fallen over time<br>