Standards Unit S3: Using Probability Computer Games 1 hour for each of the two games. One game alone, both in consecutive lessons, or both over a period of time can be used. No background is required, but its helpful to use S2 Evaluating
"Standards Unit S3: Using Probability Computer" is the property of its rightful owner. Permission is granted to
download and print the materials on this website for personal, non-commercial use only, and to display it
on your personal computer provided you do not modify the materials and that you retain all copyright
notices contained in the materials. By downloading content from our website, you accept the terms of this
agreement.
Presentation Transcript
01
Standards Unit S3: Using Probability Computer Games ~1 hour for each of the two games.
One game alone, both in consecutive lessons, or both over a period of time can be used. No background is required, but its helpful to use S2 Evaluating Probability statements before this activity. [Except, I would say, for weaker groups who’ll be better spending just more time on this]
Paired activity.
Laptops preferably, otherwise must be in ICT suite.
Camera?
Mini-whiteboards for analysis part & plenary Suitable for students from high Level 4 to Level 7 (Level 7-8 challenge at very end)<br>
Consumable Resources Needed: Re-usable Resources Needed:
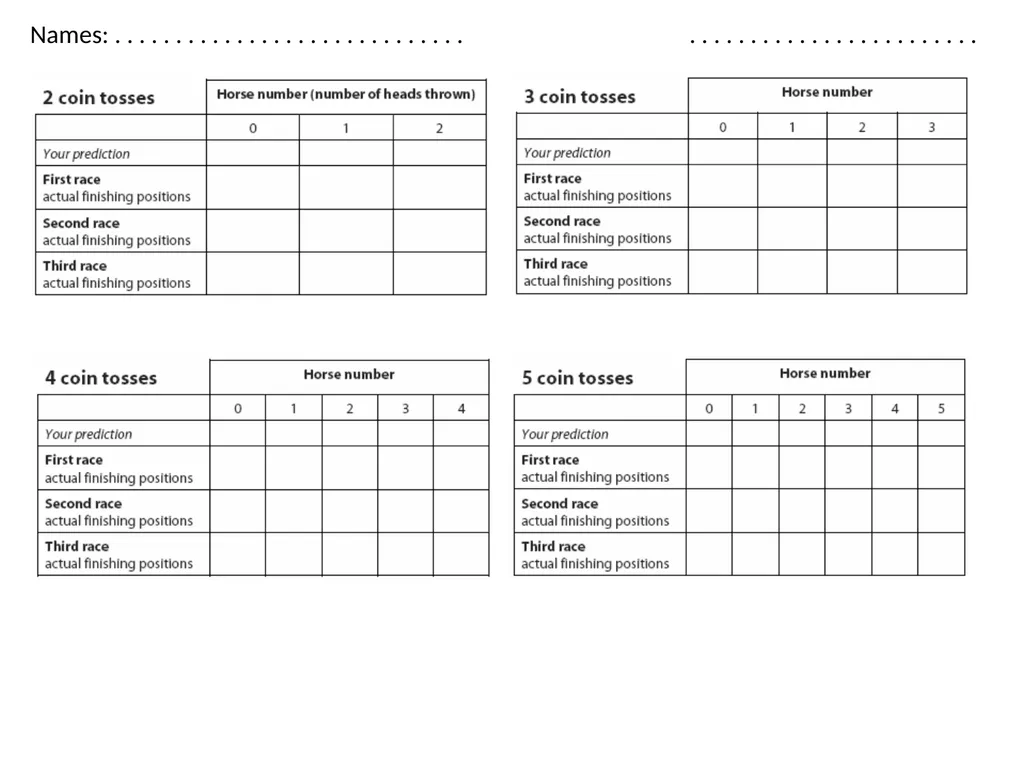
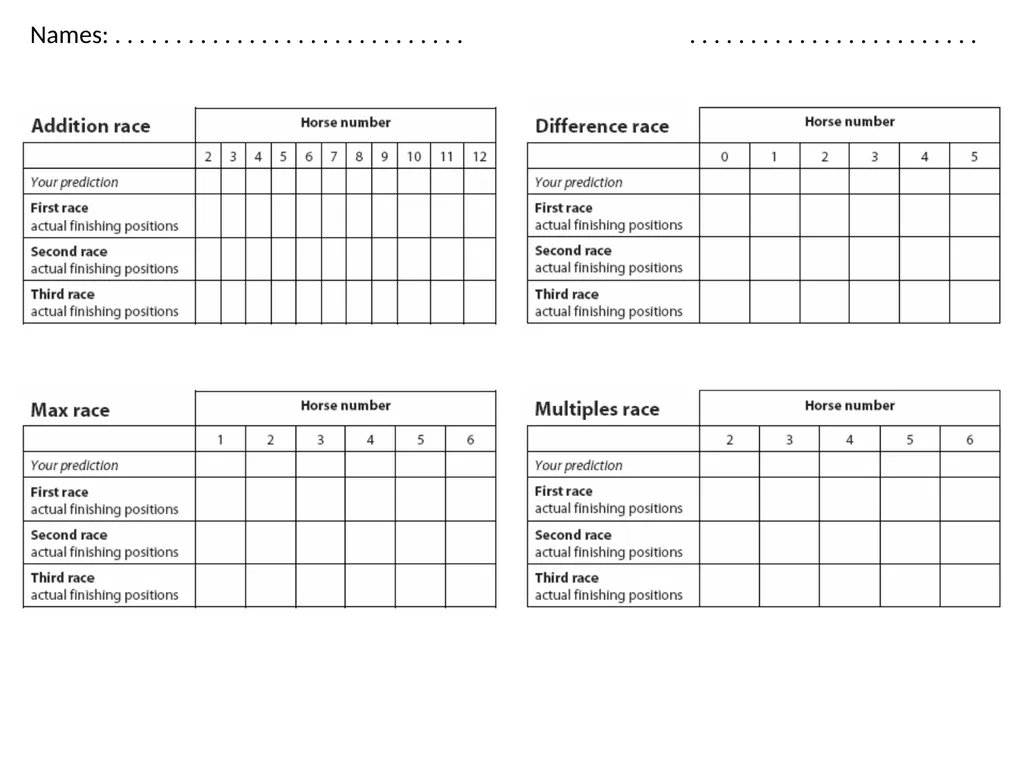
Mini-whiteboards needed for analysis and plenary Laptop shared between pair of students. Each pair needs 1 A4 colour copy of recording Sheet 1 and/or Sheet 2
(depending upon which of coin / dice game(s) are being played If playing the Dice games, each student needs a copy of the third worksheet (sample spaces). Single Excel spreadsheet into which to collect all class results<br>
05
Notes to start.
Students must be pre-assigned into pairs.
Appropriate worksheet(s) must be distributed from the start.
Students need mini-whitebaords
PCs must be loaded with games software.
My PC must be running my Excel analysis spreadsheet: S3_ProbabilityGames
Note: Spreadsheet supports aggregation of Race results from:
- all 4 of the COIN races
- only the last, ‘Multiples’, Dice race.
No particular reason, just that otherwise spend too much time inputting .data<br>
06
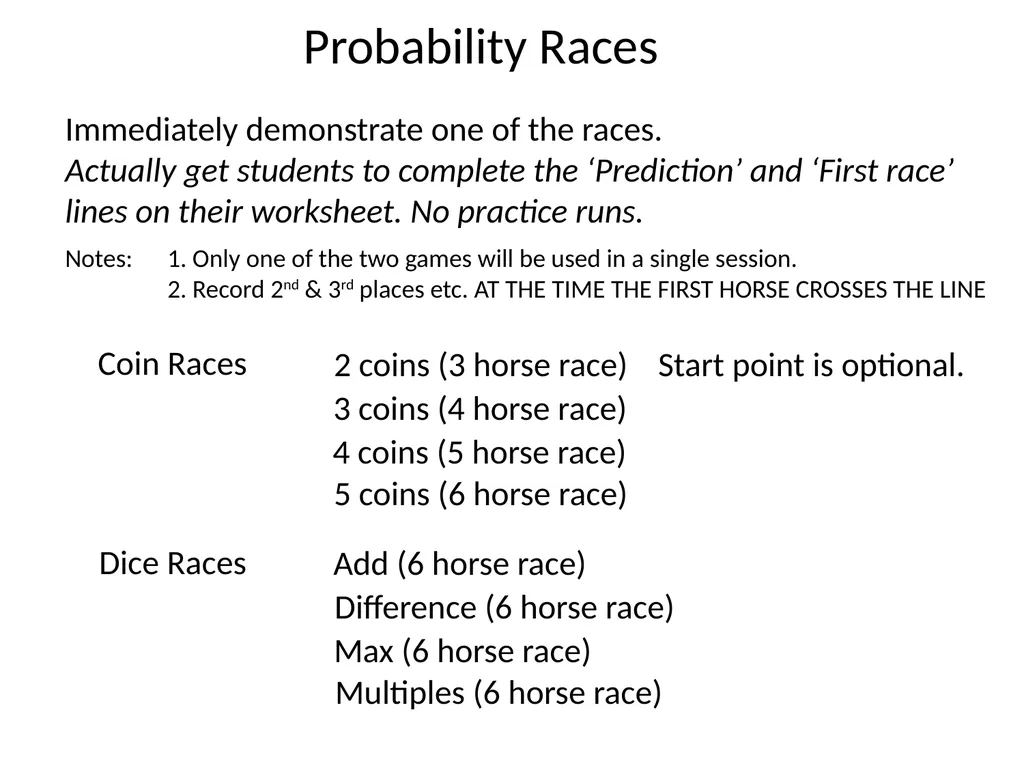
Probability Races Immediately demonstrate one of the races.
Actually get students to complete the ‘Prediction’ and ‘First race’ lines on their worksheet. No practice runs. Start point is optional. Coin Races 2 coins (3 horse race) 3 coins (4 horse race) 4 coins (5 horse race) 5 coins (6 horse race) Dice Races Difference (6 horse race) Max (6 horse race) Multiples (6 horse race) Add (6 horse race) Notes: 1. Only one of the two games will be used in a single session.
2. Record 2nd & 3rd places etc. AT THE TIME THE FIRST HORSE CROSSES THE LINE<br>
07
Coin Race Slides<br>
08
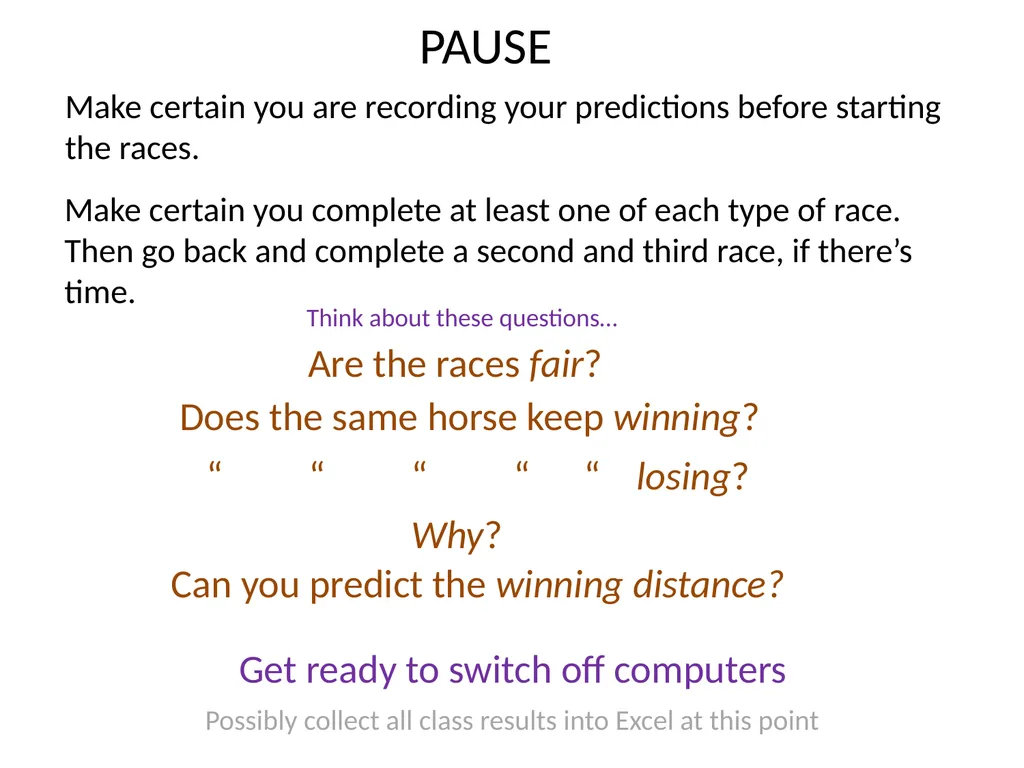
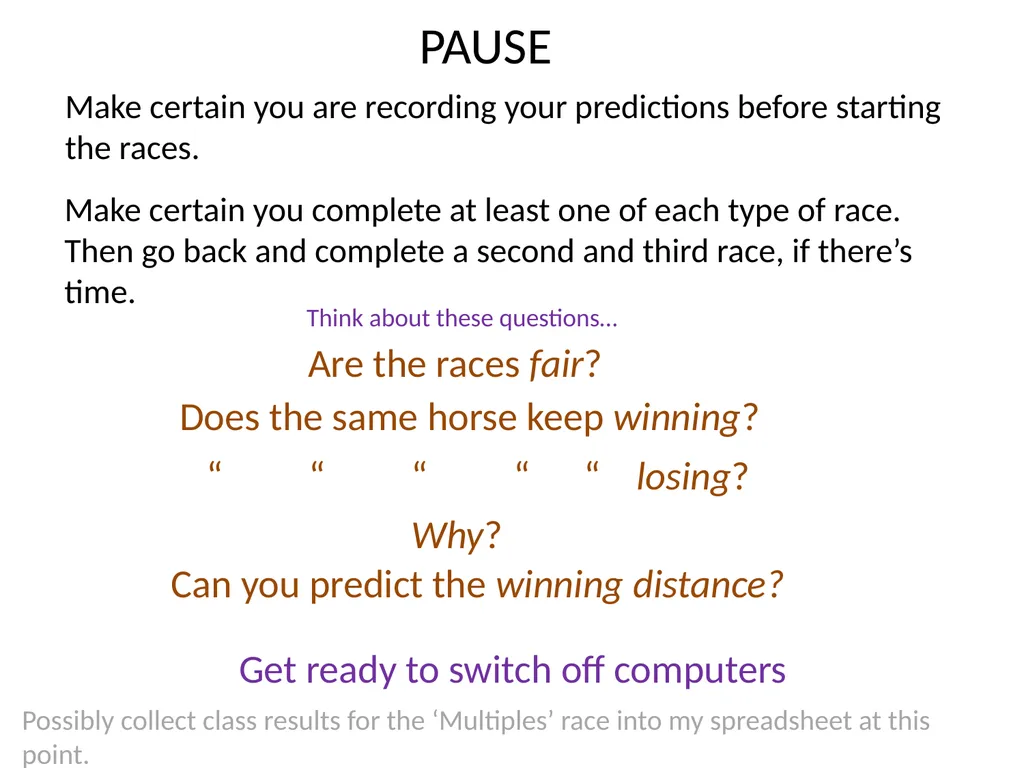
PAUSE Make certain you are recording your predictions before starting the races. Make certain you complete at least one of each type of race. Then go back and complete a second and third race, if there’s time. Get ready to switch off computers Possibly collect all class results into Excel at this point Does the same horse keep winning? “ “ “ “ “ losing? Why? Can you predict the winning distance? Think about these questions… Are the races fair?<br>
09
Why do the same horses keep winning?<br>
10
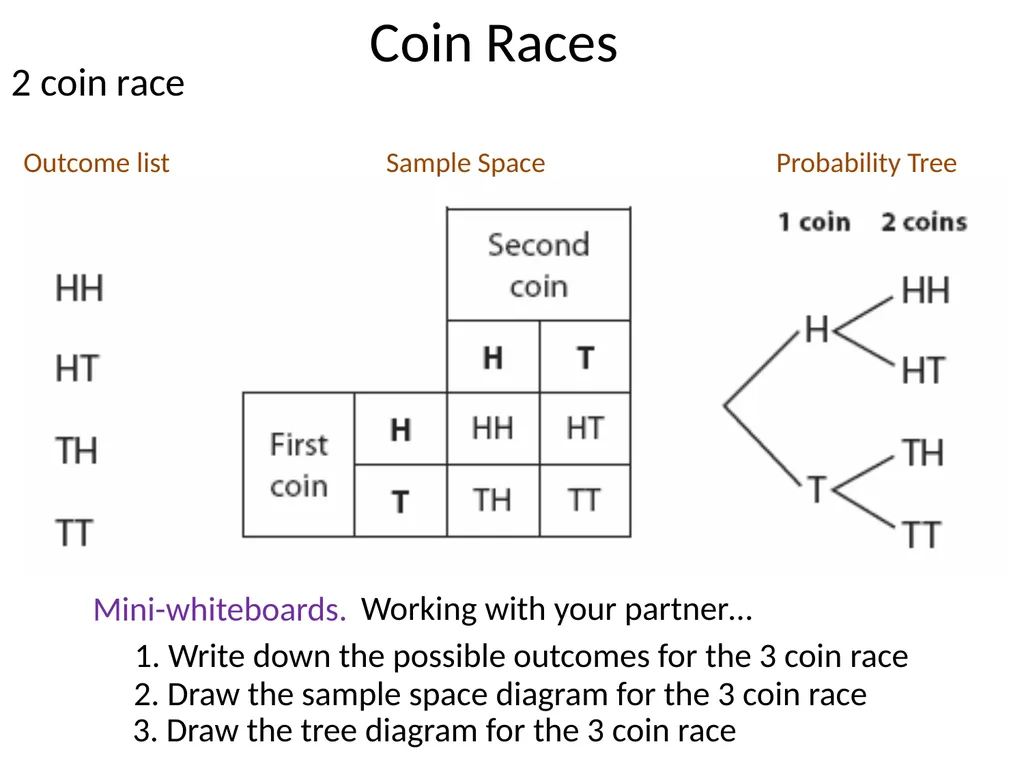
Coin Races 2 coin race Mini-whiteboards. 1. Write down the possible outcomes for the 3 coin race 2. Draw the sample space diagram for the 3 coin race 3. Draw the tree diagram for the 3 coin race Working with your partner… Outcome list Sample Space Probability Tree<br>
11
Coin Races 3 coin race<br>
12
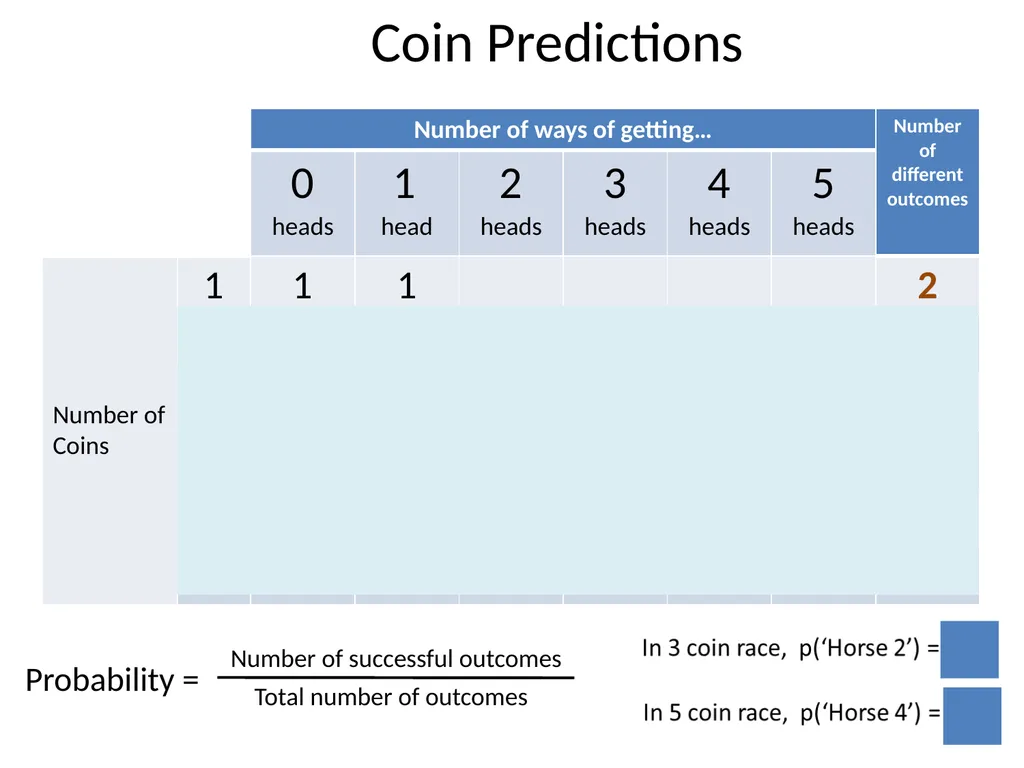
Coin Predictions<br>
13
In 4 coin race, ‘Horse 3’ should, on average, be 6 times further down the course than ‘Horse 1’ or ‘Horse 5’ Are these predictions, and others, accurate?
Compare to your results, and compare to the aggregated results<br>
14
Coin Race Slides<br>
15
PAUSE Make certain you are recording your predictions before starting the races. Make certain you complete at least one of each type of race. Then go back and complete a second and third race, if there’s time. Get ready to switch off computers Possibly collect class results for the ‘Multiples’ race into my spreadsheet at this point. Does the same horse keep winning? “ “ “ “ “ losing? Why? Can you predict the winning distance? Think about these questions… Are the races fair?<br>
16
Why do the same horses keep winning?<br>
17
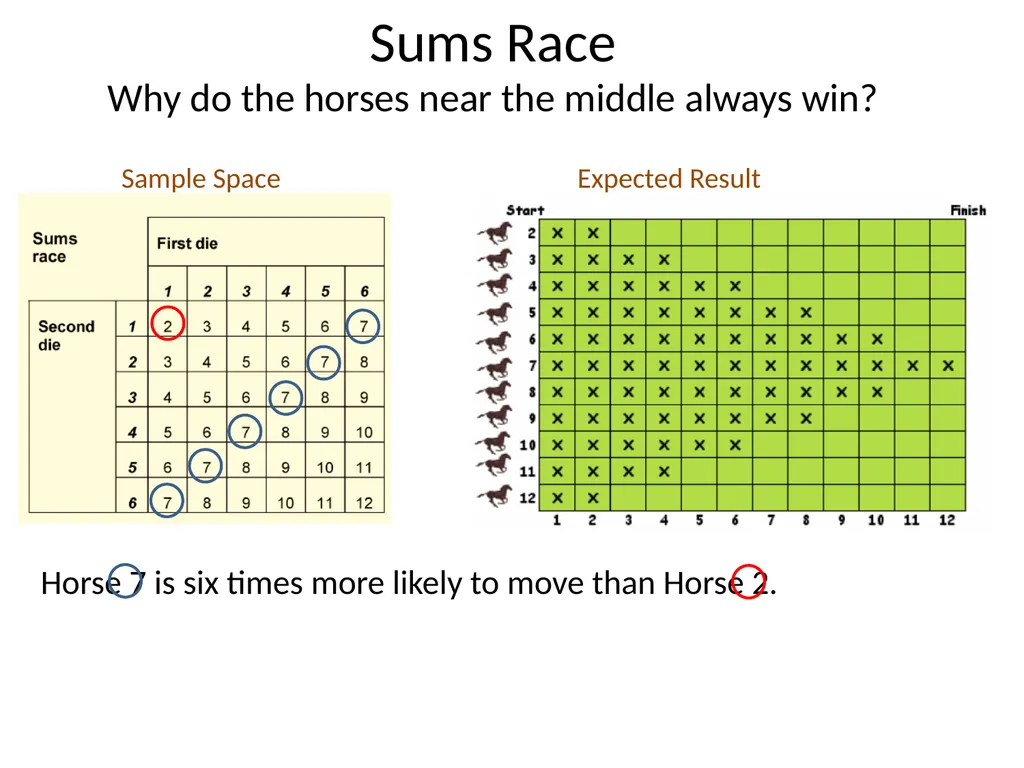
Sums Race Why do the horses near the middle always win?<br>
18
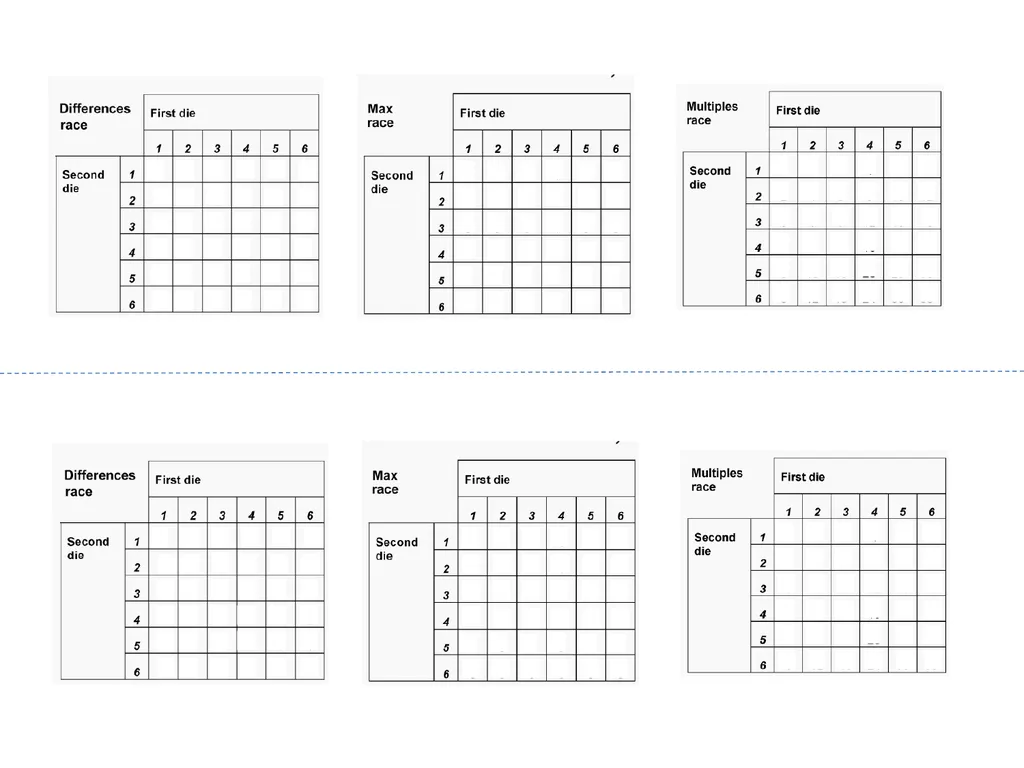
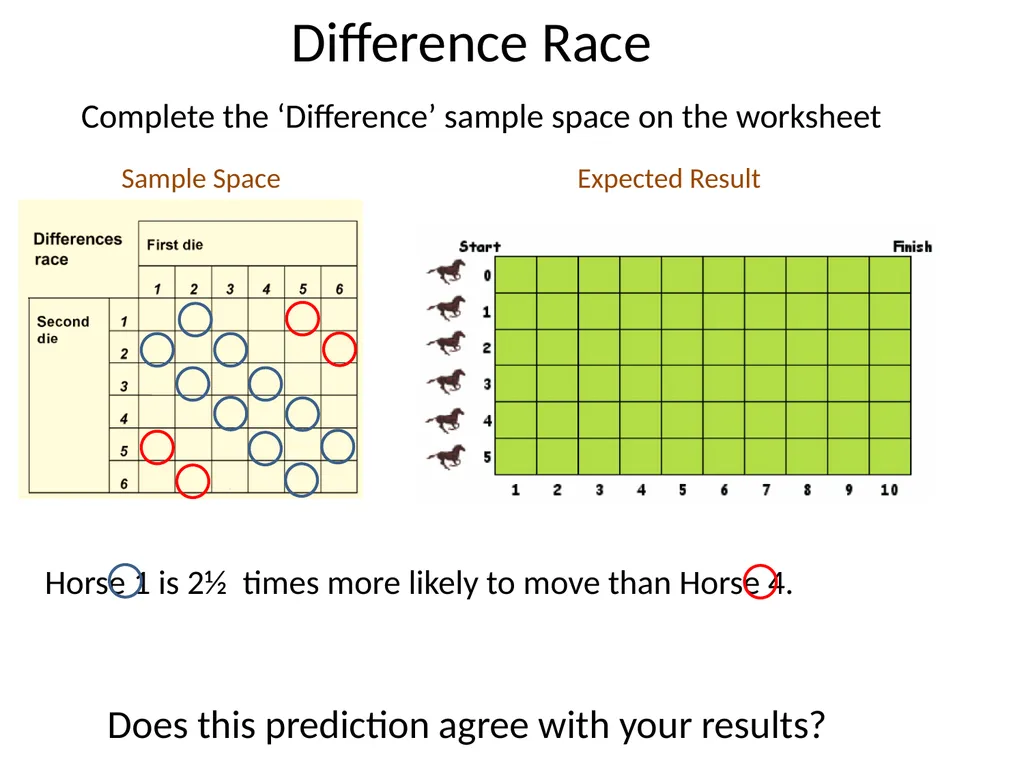
Difference Race Does this prediction agree with your results? Expected Result Sample Space Complete the ‘Difference’ sample space on the worksheet<br>
19
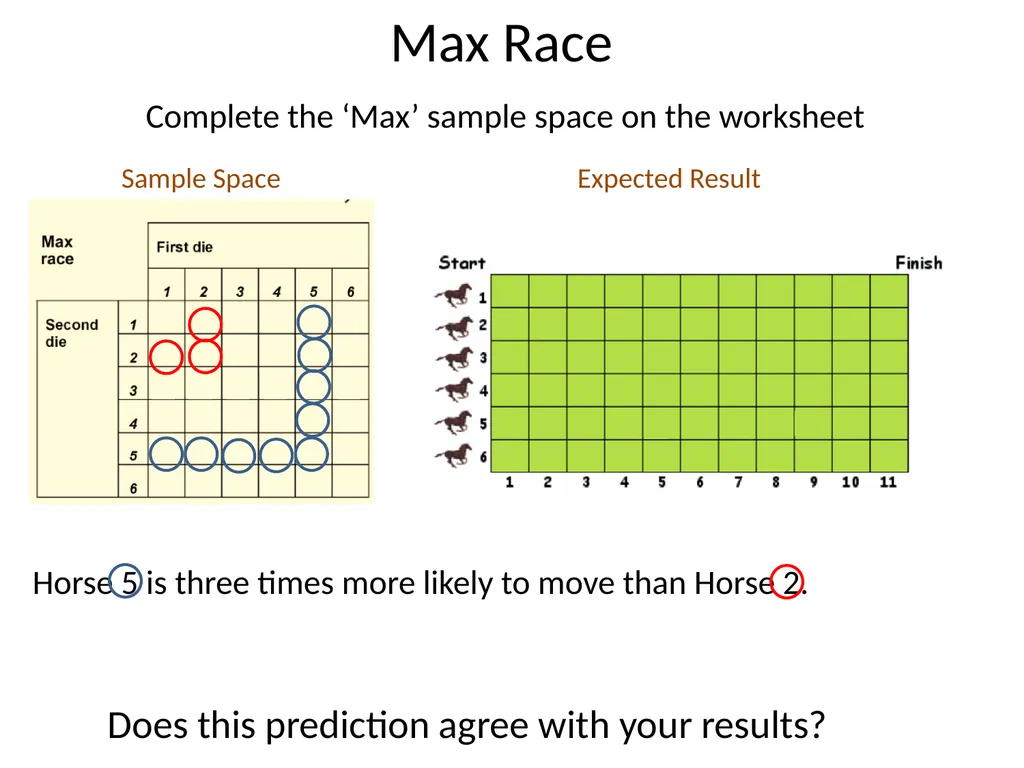
Max Race Does this prediction agree with your results? Sample Space Expected Result Complete the ‘Max’ sample space on the worksheet<br>
20
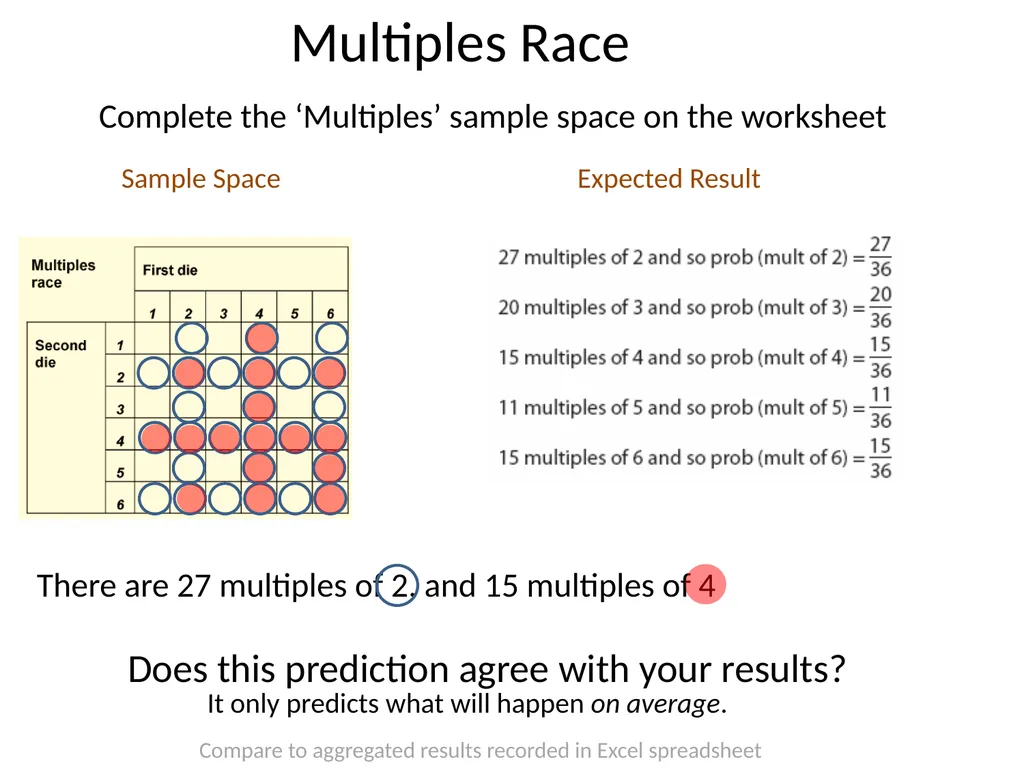
Multiples Race Sample Space Expected Result Complete the ‘Multiples’ sample space on the worksheet Compare to aggregated results recorded in Excel spreadsheet<br>
21
Sample Spaces Sample Spaces are extremely helpful in making predictions. Even totally random events can produce predictable outcomes. The outcomes from the dice were totally random, but the winning horses were highly predictable. This is crucial in Science and Nature.
Before science, people thought that anything clever had to have been deliberately made that way.
For example, birds fly together in a pattern – they must deliberately do this?
Fish swim together in shoals – they deliberately do this?
….
But we have shown that sometimes totally random events can create clear patterns. Improve this slide<br>
22
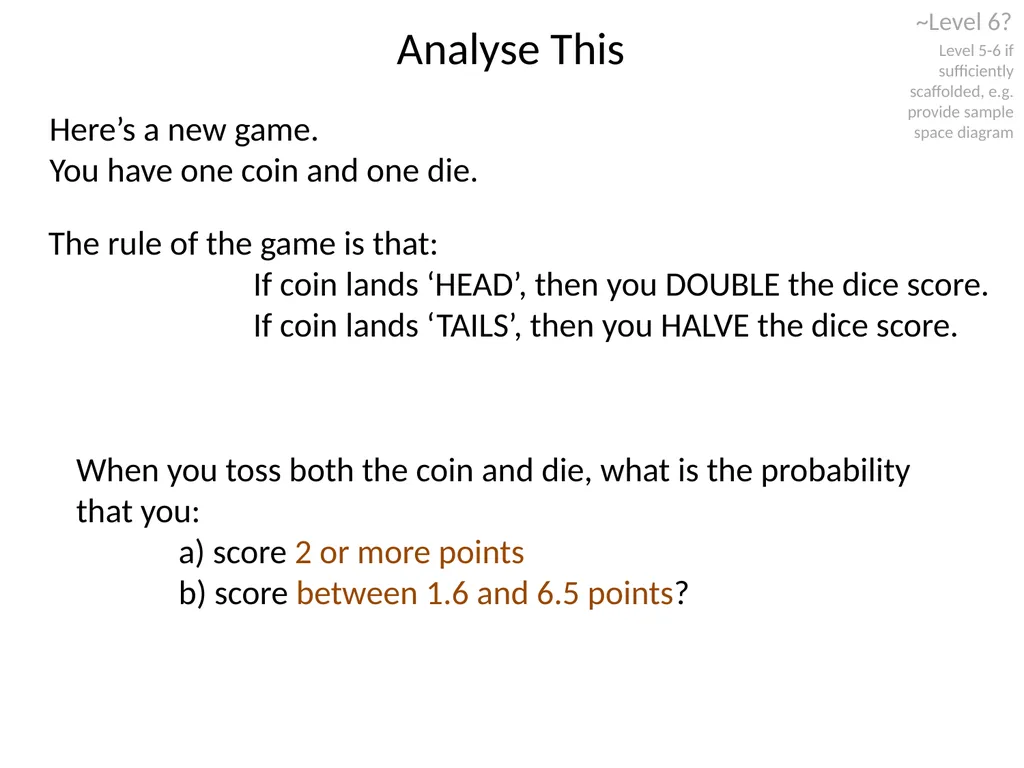
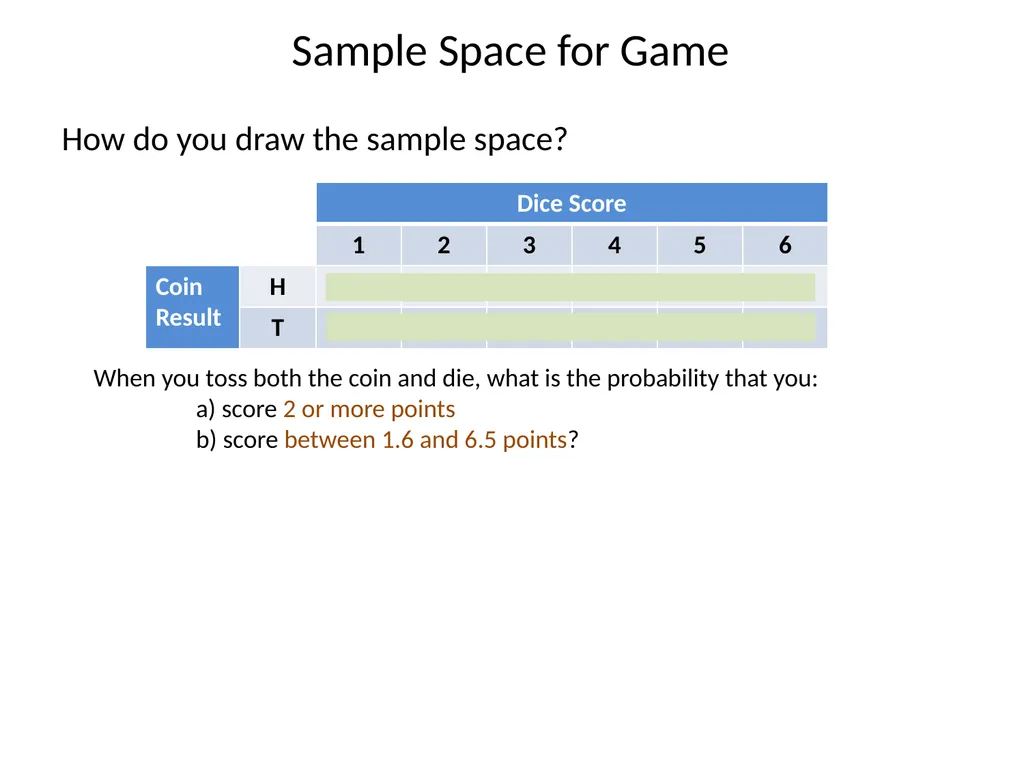
Analyse This Here’s a new game.
You have one coin and one die. The rule of the game is that:
If coin lands ‘HEAD’, then you DOUBLE the dice score.
If coin lands ‘TAILS’, then you HALVE the dice score. ~Level 6? Level 5-6 if sufficiently scaffolded, e.g. provide sample space diagram When you toss both the coin and die, what is the probability that you:
a) score 2 or more points
b) score between 1.6 and 6.5 points?<br>
23
Sample Space for Game When you toss both the coin and die, what is the probability that you:
a) score 2 or more points
b) score between 1.6 and 6.5 points? How do you draw the sample space?<br>