
Thank you for being ready to learn! Title:
SN
Published · 28 slides · 0 views

1 / 1






Description
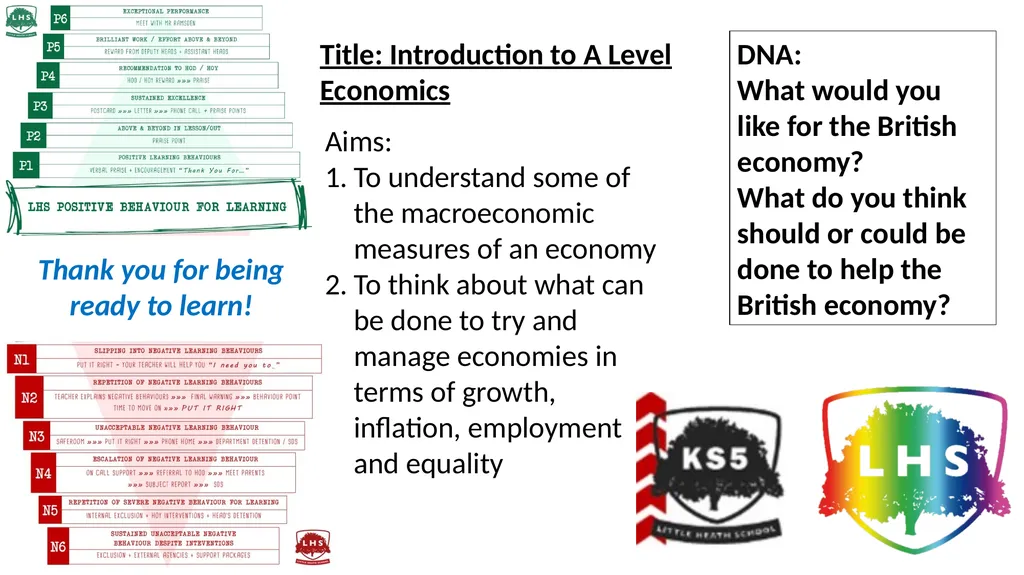
Thank you for being ready to learn! Title: Introduction to A Level Economics Aims: To understand some of the macroeconomic measures of an economy To think about what can be done to try and manage economies in terms of growth, inflation,
Related Topics
Share
Embed code
Download this presentation From Below
"Thank you for being ready to learn! Title:" is the property of its rightful owner. Permission is granted to download and print the materials on this website for personal, non-commercial use only, and to display it on your personal computer provided you do not modify the materials and that you retain all copyright notices contained in the materials. By downloading content from our website, you accept the terms of this agreement.
Presentation Transcript
01
Thank you for being ready to learn! Title: Introduction to A Level
Economics Aims:
To understand some of the macroeconomic measures of an economy
To think about what can be done to try and manage economies in terms of growth, inflation, employment and equality DNA:
What would you like for the British economy?
What do you think should or could be done to help the British economy?<br>
Economics Aims:
To understand some of the macroeconomic measures of an economy
To think about what can be done to try and manage economies in terms of growth, inflation, employment and equality DNA:
What would you like for the British economy?
What do you think should or could be done to help the British economy?<br>
02
What is Economics? Economics literally means ‘laws of the world’. It’s about studying how the world works in terms of producing and consuming goods and services.
It looks at the question of: with limited resources, which goods and services are made, and how are those goods and services distributed?<br>
It looks at the question of: with limited resources, which goods and services are made, and how are those goods and services distributed?<br>
03
ECONOMICS ECONOMIC INDICATORS DATA TRUMPS ACTIVITY<br>
04
Economists use a number of measurements to determine the relative performance of one economy compared to another… ECONOMIC INDICATORS<br>
05
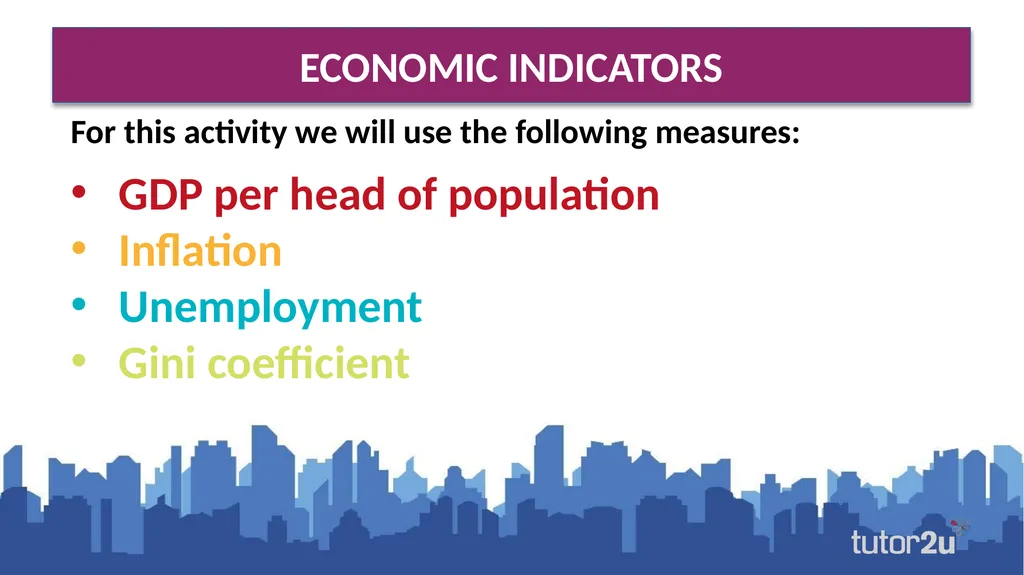
For this activity we will use the following measures:
GDP per head of population
Inflation
Unemployment
Gini coefficient ECONOMIC INDICATORS<br>
GDP per head of population
Inflation
Unemployment
Gini coefficient ECONOMIC INDICATORS<br>
06
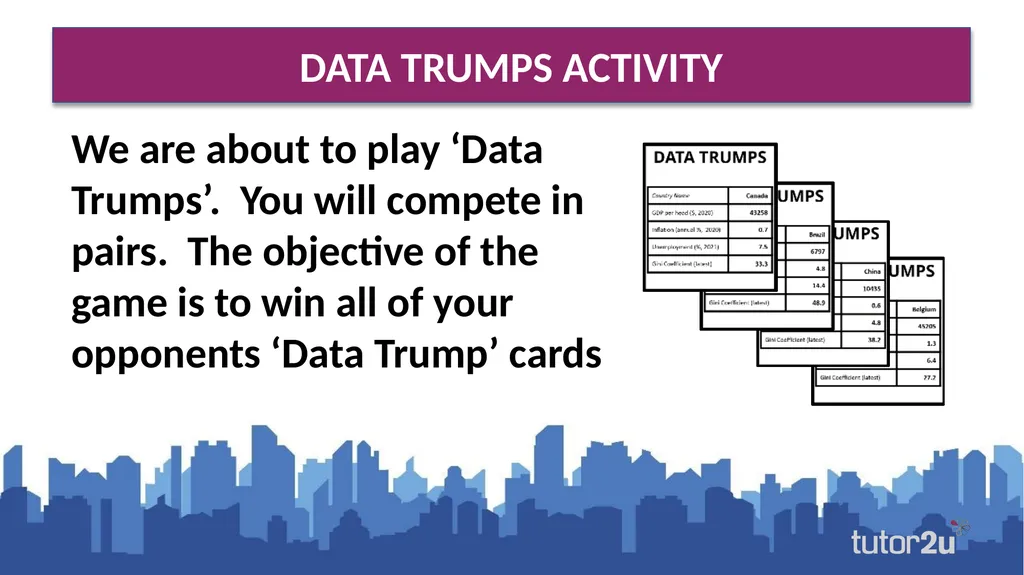
We are about to play ‘Data Trumps’. You will compete in pairs. The objective of the game is to win all of your opponents ‘Data Trump’ cards DATA TRUMPS ACTIVITY<br>
07
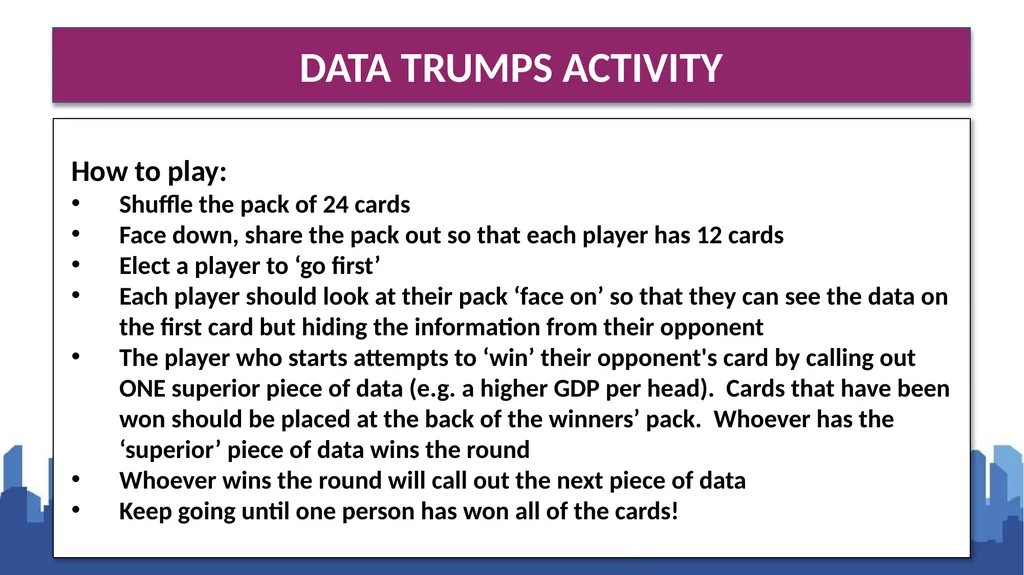
How to play:
Shuffle the pack of 24 cards
Face down, share the pack out so that each player has 12 cards
Elect a player to ‘go first’
Each player should look at their pack ‘face on’ so that they can see the data on the first card but hiding the information from their opponent
The player who starts attempts to ‘win’ their opponent's card by calling out ONE superior piece of data (e.g. a higher GDP per head). Cards that have been won should be placed at the back of the winners’ pack. Whoever has the ‘superior’ piece of data wins the round
Whoever wins the round will call out the next piece of data
Keep going until one person has won all of the cards! DATA TRUMPS ACTIVITY<br>
Shuffle the pack of 24 cards
Face down, share the pack out so that each player has 12 cards
Elect a player to ‘go first’
Each player should look at their pack ‘face on’ so that they can see the data on the first card but hiding the information from their opponent
The player who starts attempts to ‘win’ their opponent's card by calling out ONE superior piece of data (e.g. a higher GDP per head). Cards that have been won should be placed at the back of the winners’ pack. Whoever has the ‘superior’ piece of data wins the round
Whoever wins the round will call out the next piece of data
Keep going until one person has won all of the cards! DATA TRUMPS ACTIVITY<br>
08
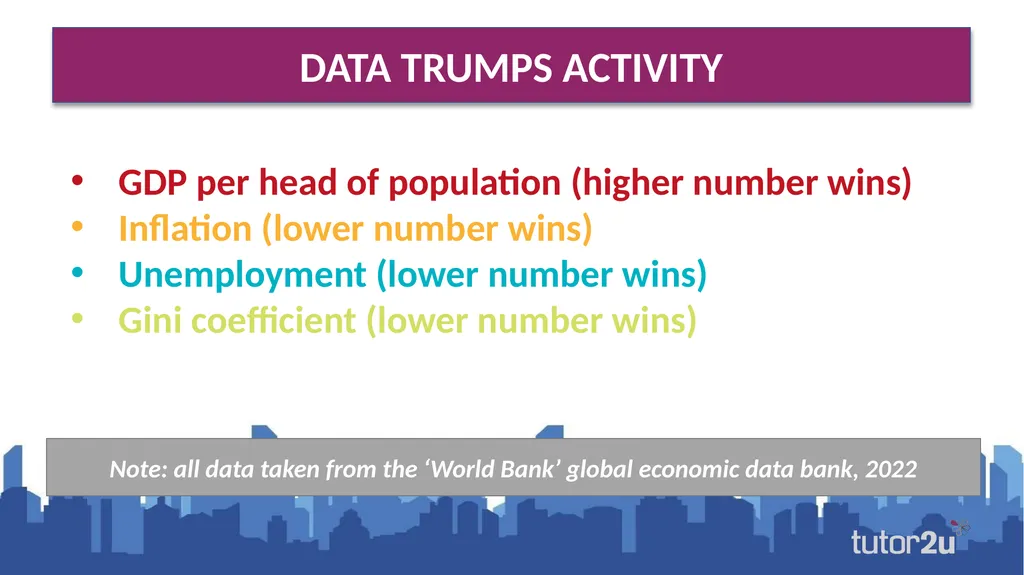
GDP per head of population (higher number wins)
Inflation (lower number wins)
Unemployment (lower number wins)
Gini coefficient (lower number wins) DATA TRUMPS ACTIVITY Note: all data taken from the ‘World Bank’ global economic data bank, 2022<br>
Inflation (lower number wins)
Unemployment (lower number wins)
Gini coefficient (lower number wins) DATA TRUMPS ACTIVITY Note: all data taken from the ‘World Bank’ global economic data bank, 2022<br>
09
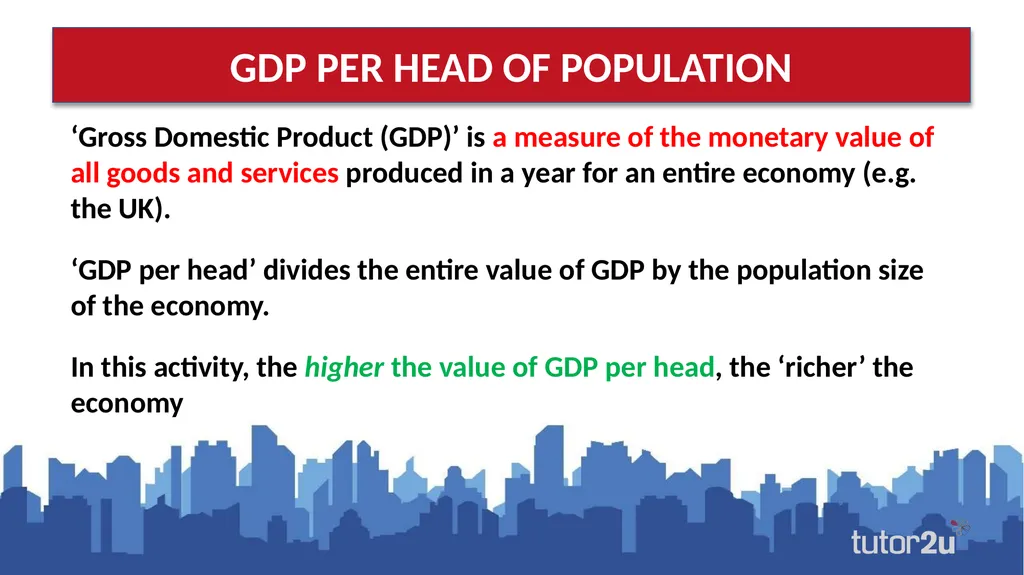
‘Gross Domestic Product (GDP)’ is a measure of the monetary value of all goods and services produced in a year for an entire economy (e.g. the UK).
‘GDP per head’ divides the entire value of GDP by the population size of the economy.
In this activity, the higher the value of GDP per head, the ‘richer’ the economy GDP PER HEAD OF POPULATION<br>
‘GDP per head’ divides the entire value of GDP by the population size of the economy.
In this activity, the higher the value of GDP per head, the ‘richer’ the economy GDP PER HEAD OF POPULATION<br>
10
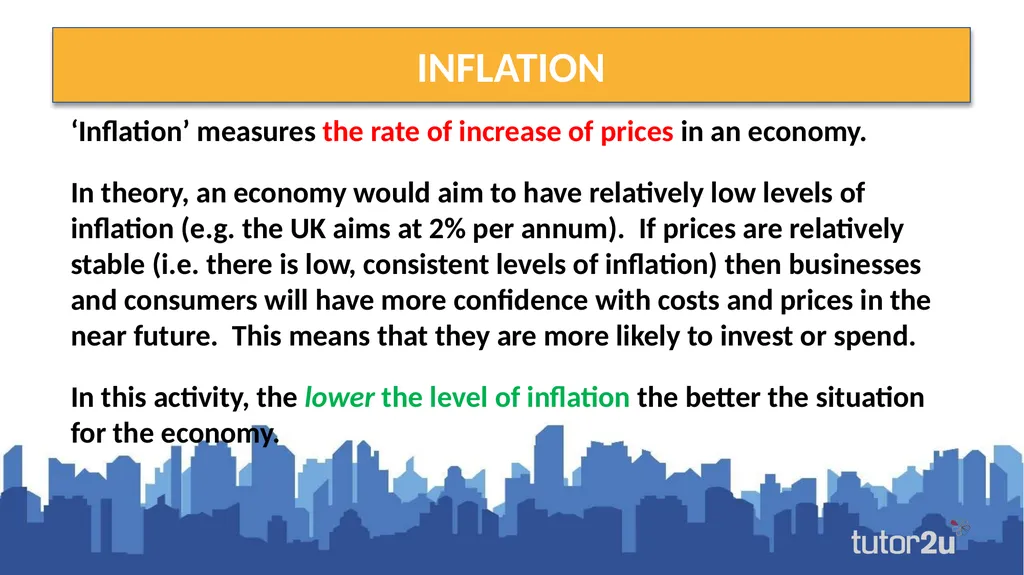
‘Inflation’ measures the rate of increase of prices in an economy.
In theory, an economy would aim to have relatively low levels of inflation (e.g. the UK aims at 2% per annum). If prices are relatively stable (i.e. there is low, consistent levels of inflation) then businesses and consumers will have more confidence with costs and prices in the near future. This means that they are more likely to invest or spend.
In this activity, the lower the level of inflation the better the situation for the economy. INFLATION<br>
In theory, an economy would aim to have relatively low levels of inflation (e.g. the UK aims at 2% per annum). If prices are relatively stable (i.e. there is low, consistent levels of inflation) then businesses and consumers will have more confidence with costs and prices in the near future. This means that they are more likely to invest or spend.
In this activity, the lower the level of inflation the better the situation for the economy. INFLATION<br>
11
‘Unemployment’ is a measure of the number of economically active people who are searching for work but unable to find employment.
Unemployed people represents a loss of potential output for an economy
In this activity, the lower the level of unemployment the better the situation for the economy. UNEMPLOYMENT<br>
Unemployed people represents a loss of potential output for an economy
In this activity, the lower the level of unemployment the better the situation for the economy. UNEMPLOYMENT<br>
12
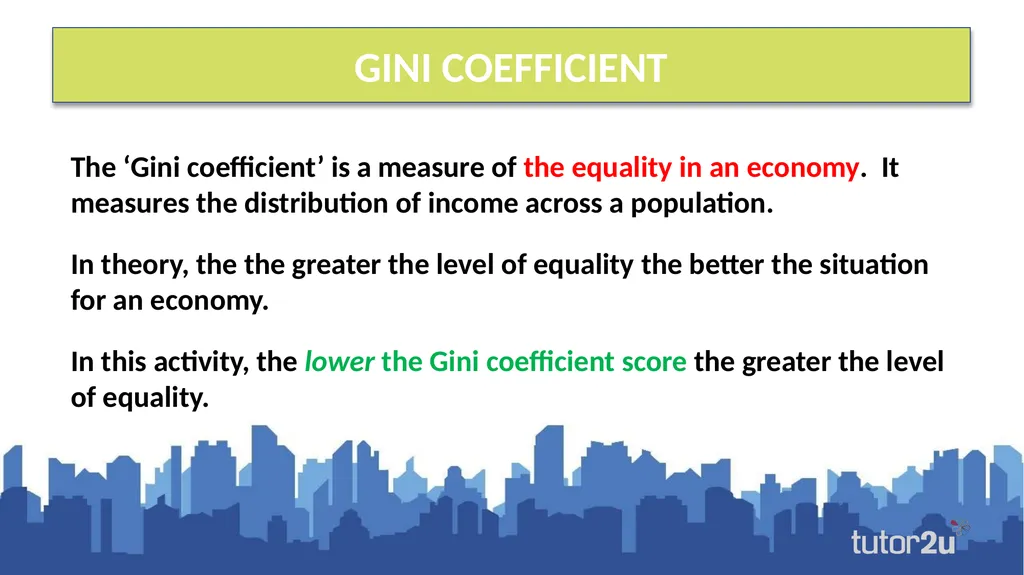
The ‘Gini coefficient’ is a measure of the equality in an economy. It measures the distribution of income across a population.
In theory, the the greater the level of equality the better the situation for an economy.
In this activity, the lower the Gini coefficient score the greater the level of equality. GINI COEFFICIENT<br>
In theory, the the greater the level of equality the better the situation for an economy.
In this activity, the lower the Gini coefficient score the greater the level of equality. GINI COEFFICIENT<br>
13
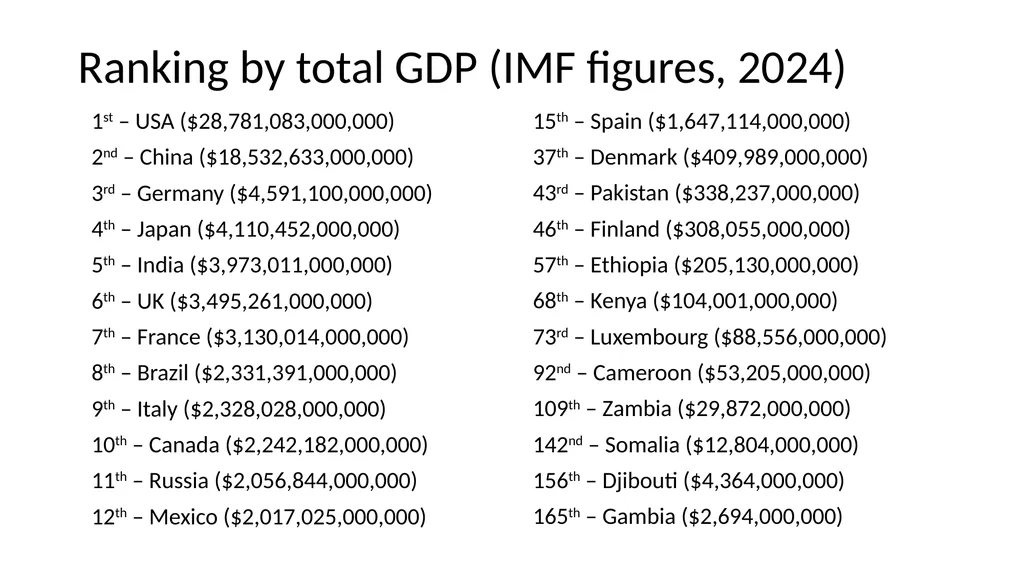
Ranking by total GDP (IMF figures, 2024) 1st – USA ($28,781,083,000,000)
2nd – China ($18,532,633,000,000)
3rd – Germany ($4,591,100,000,000)
4th – Japan ($4,110,452,000,000)
5th – India ($3,973,011,000,000)
6th – UK ($3,495,261,000,000)
7th – France ($3,130,014,000,000)
8th – Brazil ($2,331,391,000,000)
9th – Italy ($2,328,028,000,000)
10th – Canada ($2,242,182,000,000)
11th – Russia ($2,056,844,000,000)
12th – Mexico ($2,017,025,000,000) 15th – Spain ($1,647,114,000,000)
37th – Denmark ($409,989,000,000)
43rd – Pakistan ($338,237,000,000)
46th – Finland ($308,055,000,000)
57th – Ethiopia ($205,130,000,000)
68th – Kenya ($104,001,000,000)
73rd – Luxembourg ($88,556,000,000)
92nd – Cameroon ($53,205,000,000)
109th – Zambia ($29,872,000,000)
142nd – Somalia ($12,804,000,000)
156th – Djibouti ($4,364,000,000)
165th – Gambia ($2,694,000,000)<br>
2nd – China ($18,532,633,000,000)
3rd – Germany ($4,591,100,000,000)
4th – Japan ($4,110,452,000,000)
5th – India ($3,973,011,000,000)
6th – UK ($3,495,261,000,000)
7th – France ($3,130,014,000,000)
8th – Brazil ($2,331,391,000,000)
9th – Italy ($2,328,028,000,000)
10th – Canada ($2,242,182,000,000)
11th – Russia ($2,056,844,000,000)
12th – Mexico ($2,017,025,000,000) 15th – Spain ($1,647,114,000,000)
37th – Denmark ($409,989,000,000)
43rd – Pakistan ($338,237,000,000)
46th – Finland ($308,055,000,000)
57th – Ethiopia ($205,130,000,000)
68th – Kenya ($104,001,000,000)
73rd – Luxembourg ($88,556,000,000)
92nd – Cameroon ($53,205,000,000)
109th – Zambia ($29,872,000,000)
142nd – Somalia ($12,804,000,000)
156th – Djibouti ($4,364,000,000)
165th – Gambia ($2,694,000,000)<br>
14
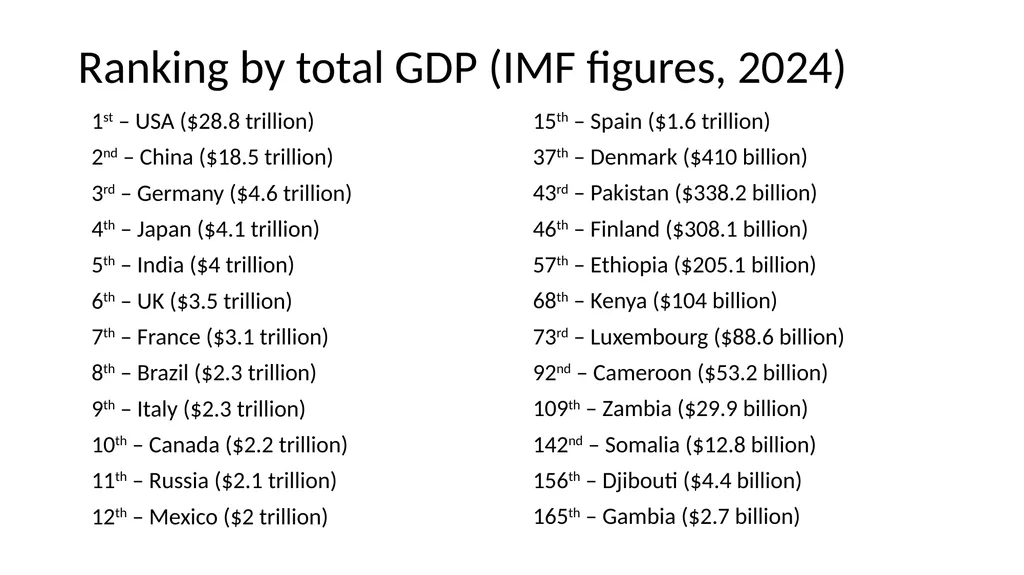
Ranking by total GDP (IMF figures, 2024) 1st – USA ($28.8 trillion)
2nd – China ($18.5 trillion)
3rd – Germany ($4.6 trillion)
4th – Japan ($4.1 trillion)
5th – India ($4 trillion)
6th – UK ($3.5 trillion)
7th – France ($3.1 trillion)
8th – Brazil ($2.3 trillion)
9th – Italy ($2.3 trillion)
10th – Canada ($2.2 trillion)
11th – Russia ($2.1 trillion)
12th – Mexico ($2 trillion) 15th – Spain ($1.6 trillion)
37th – Denmark ($410 billion)
43rd – Pakistan ($338.2 billion)
46th – Finland ($308.1 billion)
57th – Ethiopia ($205.1 billion)
68th – Kenya ($104 billion)
73rd – Luxembourg ($88.6 billion)
92nd – Cameroon ($53.2 billion)
109th – Zambia ($29.9 billion)
142nd – Somalia ($12.8 billion)
156th – Djibouti ($4.4 billion)
165th – Gambia ($2.7 billion)<br>
2nd – China ($18.5 trillion)
3rd – Germany ($4.6 trillion)
4th – Japan ($4.1 trillion)
5th – India ($4 trillion)
6th – UK ($3.5 trillion)
7th – France ($3.1 trillion)
8th – Brazil ($2.3 trillion)
9th – Italy ($2.3 trillion)
10th – Canada ($2.2 trillion)
11th – Russia ($2.1 trillion)
12th – Mexico ($2 trillion) 15th – Spain ($1.6 trillion)
37th – Denmark ($410 billion)
43rd – Pakistan ($338.2 billion)
46th – Finland ($308.1 billion)
57th – Ethiopia ($205.1 billion)
68th – Kenya ($104 billion)
73rd – Luxembourg ($88.6 billion)
92nd – Cameroon ($53.2 billion)
109th – Zambia ($29.9 billion)
142nd – Somalia ($12.8 billion)
156th – Djibouti ($4.4 billion)
165th – Gambia ($2.7 billion)<br>
15
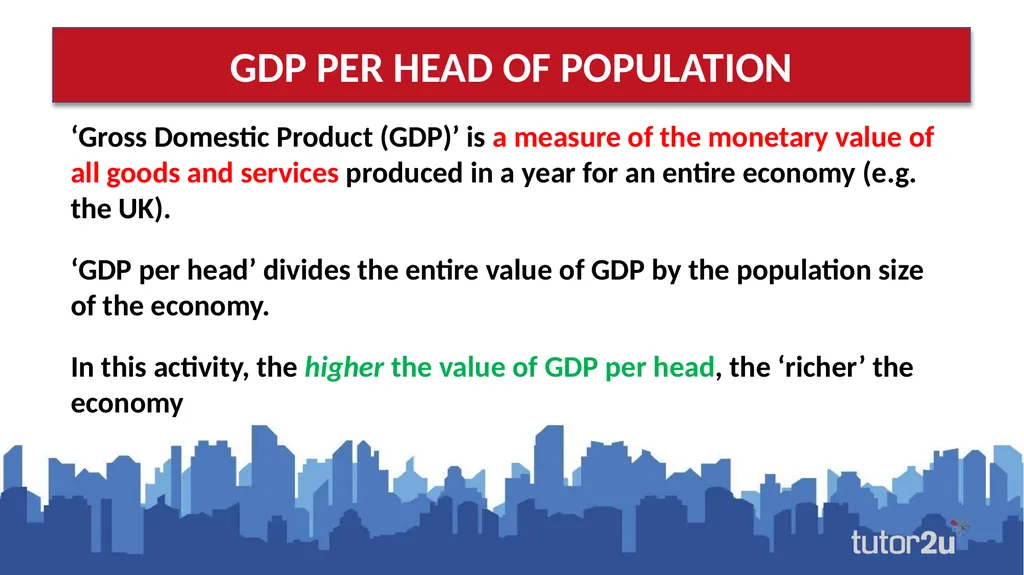
‘Gross Domestic Product (GDP)’ is a measure of the monetary value of all goods and services produced in a year for an entire economy (e.g. the UK).
‘GDP per head’ divides the entire value of GDP by the population size of the economy.
In this activity, the higher the value of GDP per head, the ‘richer’ the economy GDP PER HEAD OF POPULATION<br>
‘GDP per head’ divides the entire value of GDP by the population size of the economy.
In this activity, the higher the value of GDP per head, the ‘richer’ the economy GDP PER HEAD OF POPULATION<br>
16
What policies might governments do (or not do) in the long-run or short-run to increase GDP?
Work in groups to come up with your ideas.
For each idea, think about why this might help, but also think about other consequences of the government doing that policy, on businesses, government finances (so taxpayers), the rest of the world, etc. GDP PER HEAD OF POPULATION<br>
Work in groups to come up with your ideas.
For each idea, think about why this might help, but also think about other consequences of the government doing that policy, on businesses, government finances (so taxpayers), the rest of the world, etc. GDP PER HEAD OF POPULATION<br>
17
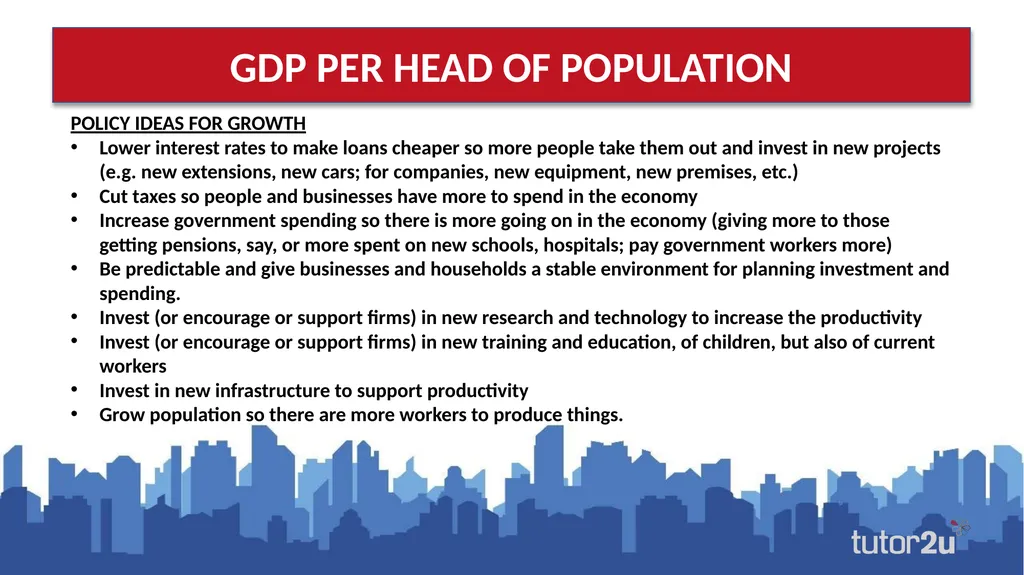
POLICY IDEAS FOR GROWTH
Lower interest rates to make loans cheaper so more people take them out and invest in new projects (e.g. new extensions, new cars; for companies, new equipment, new premises, etc.)
Cut taxes so people and businesses have more to spend in the economy
Increase government spending so there is more going on in the economy (giving more to those getting pensions, say, or more spent on new schools, hospitals; pay government workers more)
Be predictable and give businesses and households a stable environment for planning investment and spending.
Invest (or encourage or support firms) in new research and technology to increase the productivity
Invest (or encourage or support firms) in new training and education, of children, but also of current workers
Invest in new infrastructure to support productivity
Grow population so there are more workers to produce things. GDP PER HEAD OF POPULATION<br>
Lower interest rates to make loans cheaper so more people take them out and invest in new projects (e.g. new extensions, new cars; for companies, new equipment, new premises, etc.)
Cut taxes so people and businesses have more to spend in the economy
Increase government spending so there is more going on in the economy (giving more to those getting pensions, say, or more spent on new schools, hospitals; pay government workers more)
Be predictable and give businesses and households a stable environment for planning investment and spending.
Invest (or encourage or support firms) in new research and technology to increase the productivity
Invest (or encourage or support firms) in new training and education, of children, but also of current workers
Invest in new infrastructure to support productivity
Grow population so there are more workers to produce things. GDP PER HEAD OF POPULATION<br>
18
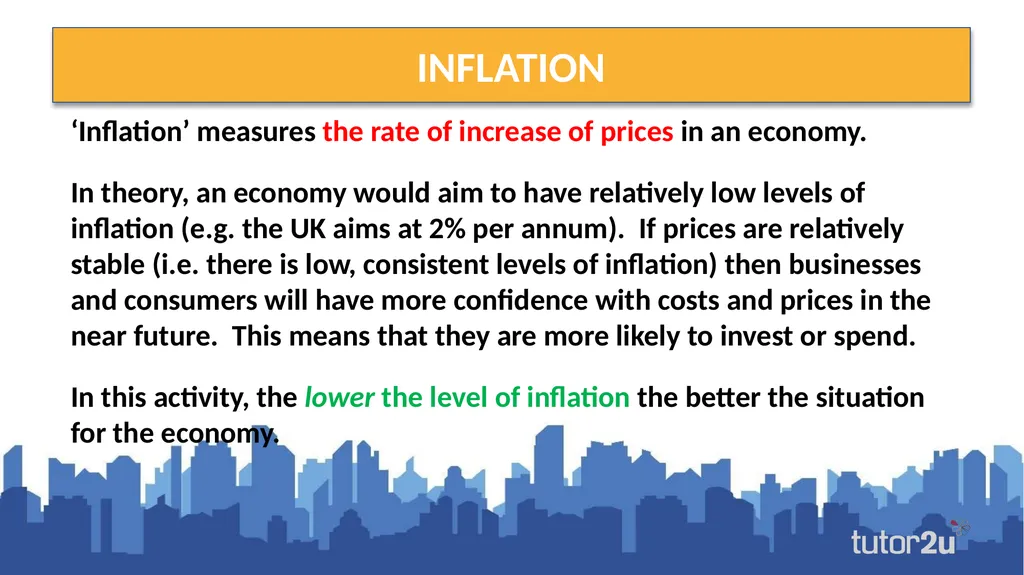
‘Inflation’ measures the rate of increase of prices in an economy.
In theory, an economy would aim to have relatively low levels of inflation (e.g. the UK aims at 2% per annum). If prices are relatively stable (i.e. there is low, consistent levels of inflation) then businesses and consumers will have more confidence with costs and prices in the near future. This means that they are more likely to invest or spend.
In this activity, the lower the level of inflation the better the situation for the economy. INFLATION<br>
In theory, an economy would aim to have relatively low levels of inflation (e.g. the UK aims at 2% per annum). If prices are relatively stable (i.e. there is low, consistent levels of inflation) then businesses and consumers will have more confidence with costs and prices in the near future. This means that they are more likely to invest or spend.
In this activity, the lower the level of inflation the better the situation for the economy. INFLATION<br>
19
What policies might governments do (or not do) in the long-run or short-run to control inflation to a low-ish level?
Work in groups to come up with your ideas.
For each idea, think about why this might help, but also think about other consequences of the government doing that policy, on businesses, government finances (so taxpayers), the rest of the world, etc. INFLATION<br>
Work in groups to come up with your ideas.
For each idea, think about why this might help, but also think about other consequences of the government doing that policy, on businesses, government finances (so taxpayers), the rest of the world, etc. INFLATION<br>
20
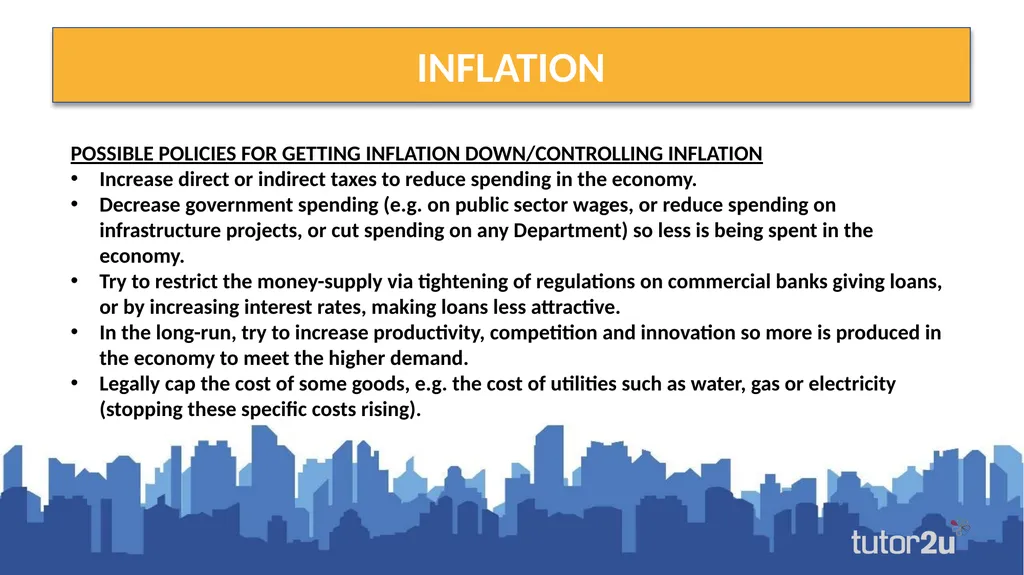
POSSIBLE POLICIES FOR GETTING INFLATION DOWN/CONTROLLING INFLATION
Increase direct or indirect taxes to reduce spending in the economy.
Decrease government spending (e.g. on public sector wages, or reduce spending on infrastructure projects, or cut spending on any Department) so less is being spent in the economy.
Try to restrict the money-supply via tightening of regulations on commercial banks giving loans, or by increasing interest rates, making loans less attractive.
In the long-run, try to increase productivity, competition and innovation so more is produced in the economy to meet the higher demand.
Legally cap the cost of some goods, e.g. the cost of utilities such as water, gas or electricity (stopping these specific costs rising). INFLATION<br>
Increase direct or indirect taxes to reduce spending in the economy.
Decrease government spending (e.g. on public sector wages, or reduce spending on infrastructure projects, or cut spending on any Department) so less is being spent in the economy.
Try to restrict the money-supply via tightening of regulations on commercial banks giving loans, or by increasing interest rates, making loans less attractive.
In the long-run, try to increase productivity, competition and innovation so more is produced in the economy to meet the higher demand.
Legally cap the cost of some goods, e.g. the cost of utilities such as water, gas or electricity (stopping these specific costs rising). INFLATION<br>
21
‘Unemployment’ is a measure of the number of economically active people who are searching for work but unable to find employment.
Unemployed people represents a loss of potential output for an economy
In this activity, the lower the level of unemployment the better the situation for the economy. UNEMPLOYMENT<br>
Unemployed people represents a loss of potential output for an economy
In this activity, the lower the level of unemployment the better the situation for the economy. UNEMPLOYMENT<br>
22
What policies might governments do (or not do) in the long-run or short-run to reduce unemployment?
Work in groups to come up with your ideas.
For each idea, think about why this might help, but also think about other consequences of the government doing that policy, on businesses, government finances (so taxpayers), the rest of the world, etc. UNEMPLOYMENT<br>
Work in groups to come up with your ideas.
For each idea, think about why this might help, but also think about other consequences of the government doing that policy, on businesses, government finances (so taxpayers), the rest of the world, etc. UNEMPLOYMENT<br>
23
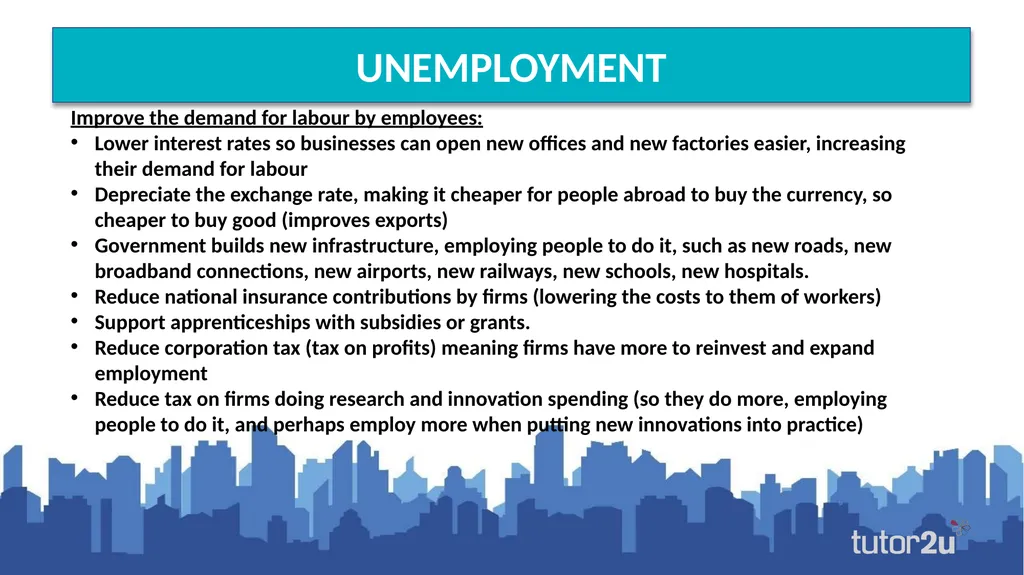
Improve the demand for labour by employees:
Lower interest rates so businesses can open new offices and new factories easier, increasing their demand for labour
Depreciate the exchange rate, making it cheaper for people abroad to buy the currency, so cheaper to buy good (improves exports)
Government builds new infrastructure, employing people to do it, such as new roads, new broadband connections, new airports, new railways, new schools, new hospitals.
Reduce national insurance contributions by firms (lowering the costs to them of workers)
Support apprenticeships with subsidies or grants.
Reduce corporation tax (tax on profits) meaning firms have more to reinvest and expand employment
Reduce tax on firms doing research and innovation spending (so they do more, employing people to do it, and perhaps employ more when putting new innovations into practice) UNEMPLOYMENT<br>
Lower interest rates so businesses can open new offices and new factories easier, increasing their demand for labour
Depreciate the exchange rate, making it cheaper for people abroad to buy the currency, so cheaper to buy good (improves exports)
Government builds new infrastructure, employing people to do it, such as new roads, new broadband connections, new airports, new railways, new schools, new hospitals.
Reduce national insurance contributions by firms (lowering the costs to them of workers)
Support apprenticeships with subsidies or grants.
Reduce corporation tax (tax on profits) meaning firms have more to reinvest and expand employment
Reduce tax on firms doing research and innovation spending (so they do more, employing people to do it, and perhaps employ more when putting new innovations into practice) UNEMPLOYMENT<br>
24
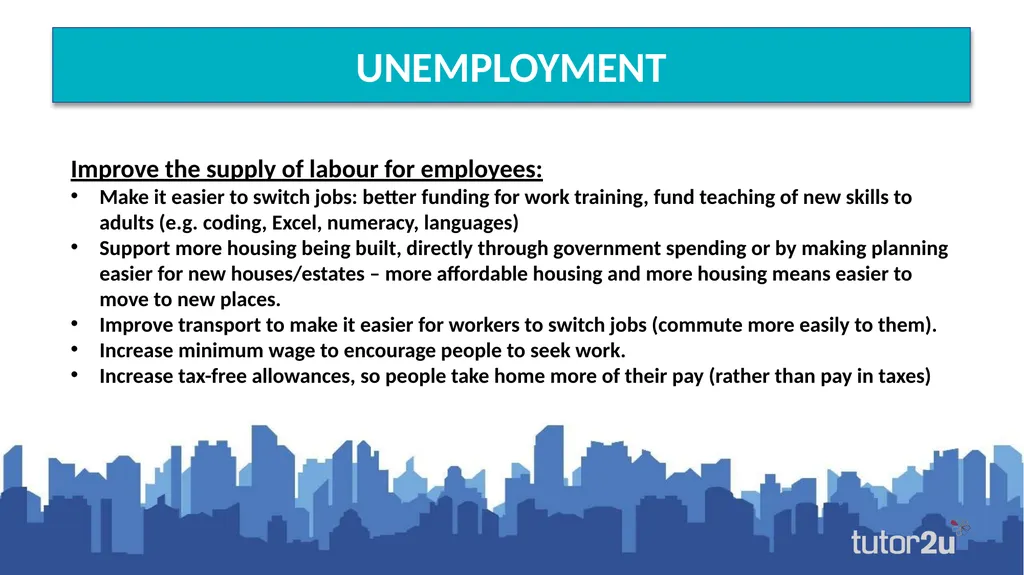
Improve the supply of labour for employees:
Make it easier to switch jobs: better funding for work training, fund teaching of new skills to adults (e.g. coding, Excel, numeracy, languages)
Support more housing being built, directly through government spending or by making planning easier for new houses/estates – more affordable housing and more housing means easier to move to new places.
Improve transport to make it easier for workers to switch jobs (commute more easily to them).
Increase minimum wage to encourage people to seek work.
Increase tax-free allowances, so people take home more of their pay (rather than pay in taxes) UNEMPLOYMENT<br>
Make it easier to switch jobs: better funding for work training, fund teaching of new skills to adults (e.g. coding, Excel, numeracy, languages)
Support more housing being built, directly through government spending or by making planning easier for new houses/estates – more affordable housing and more housing means easier to move to new places.
Improve transport to make it easier for workers to switch jobs (commute more easily to them).
Increase minimum wage to encourage people to seek work.
Increase tax-free allowances, so people take home more of their pay (rather than pay in taxes) UNEMPLOYMENT<br>
25
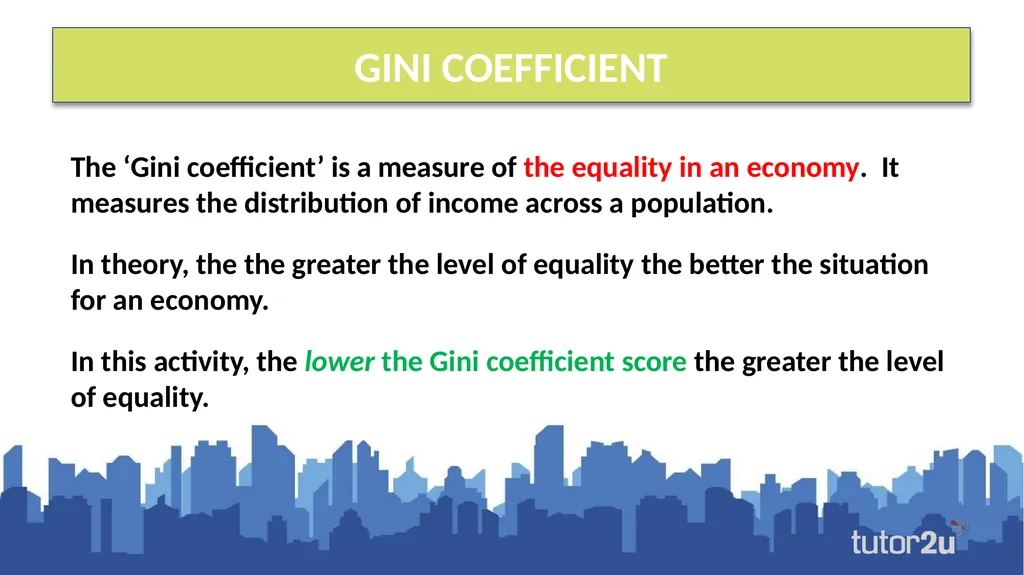
The ‘Gini coefficient’ is a measure of the equality in an economy. It measures the distribution of income across a population.
In theory, the the greater the level of equality the better the situation for an economy.
In this activity, the lower the Gini coefficient score the greater the level of equality. GINI COEFFICIENT<br>
In theory, the the greater the level of equality the better the situation for an economy.
In this activity, the lower the Gini coefficient score the greater the level of equality. GINI COEFFICIENT<br>
26
What policies might governments do (or not do) in the long-run or short-run to increase equality?
Work in groups to come up with your ideas.
For each idea, think about why this might help, but also think about other consequences of the government doing that policy, on businesses, government finances (so taxpayers), the rest of the world, etc. GINI COEFFICIENT<br>
Work in groups to come up with your ideas.
For each idea, think about why this might help, but also think about other consequences of the government doing that policy, on businesses, government finances (so taxpayers), the rest of the world, etc. GINI COEFFICIENT<br>
27
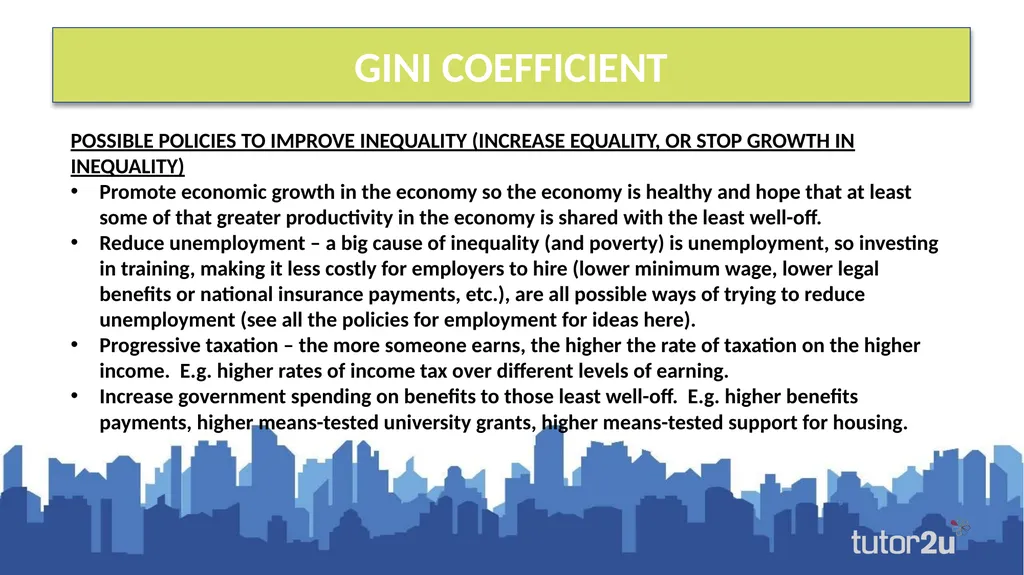
POSSIBLE POLICIES TO IMPROVE INEQUALITY (INCREASE EQUALITY, OR STOP GROWTH IN INEQUALITY)
Promote economic growth in the economy so the economy is healthy and hope that at least some of that greater productivity in the economy is shared with the least well-off.
Reduce unemployment – a big cause of inequality (and poverty) is unemployment, so investing in training, making it less costly for employers to hire (lower minimum wage, lower legal benefits or national insurance payments, etc.), are all possible ways of trying to reduce unemployment (see all the policies for employment for ideas here).
Progressive taxation – the more someone earns, the higher the rate of taxation on the higher income. E.g. higher rates of income tax over different levels of earning.
Increase government spending on benefits to those least well-off. E.g. higher benefits payments, higher means-tested university grants, higher means-tested support for housing. GINI COEFFICIENT<br>
Promote economic growth in the economy so the economy is healthy and hope that at least some of that greater productivity in the economy is shared with the least well-off.
Reduce unemployment – a big cause of inequality (and poverty) is unemployment, so investing in training, making it less costly for employers to hire (lower minimum wage, lower legal benefits or national insurance payments, etc.), are all possible ways of trying to reduce unemployment (see all the policies for employment for ideas here).
Progressive taxation – the more someone earns, the higher the rate of taxation on the higher income. E.g. higher rates of income tax over different levels of earning.
Increase government spending on benefits to those least well-off. E.g. higher benefits payments, higher means-tested university grants, higher means-tested support for housing. GINI COEFFICIENT<br>
28
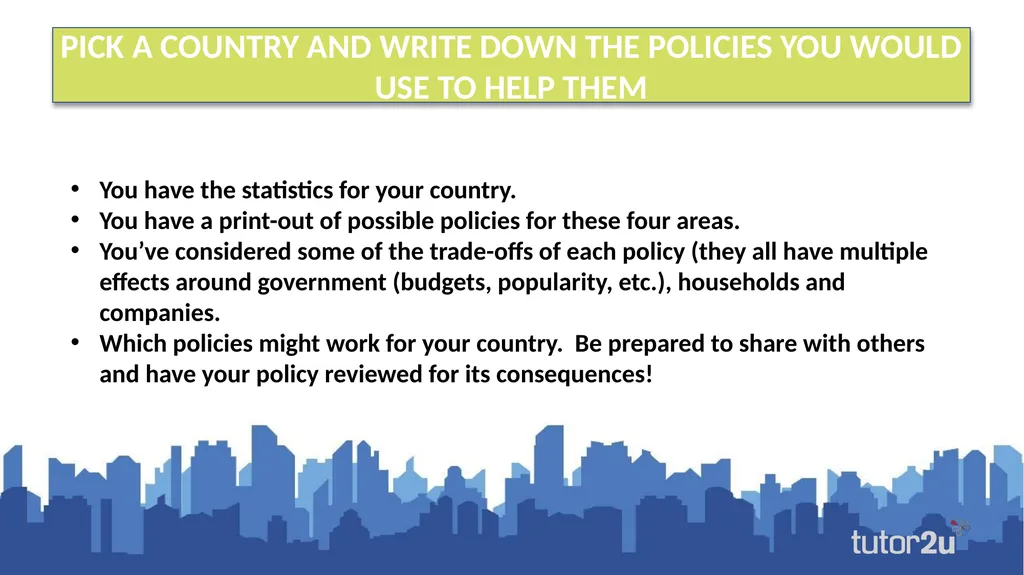
You have the statistics for your country.
You have a print-out of possible policies for these four areas.
You’ve considered some of the trade-offs of each policy (they all have multiple effects around government (budgets, popularity, etc.), households and companies.
Which policies might work for your country. Be prepared to share with others and have your policy reviewed for its consequences! PICK A COUNTRY AND WRITE DOWN THE POLICIES YOU WOULD USE TO HELP THEM<br>
You have a print-out of possible policies for these four areas.
You’ve considered some of the trade-offs of each policy (they all have multiple effects around government (budgets, popularity, etc.), households and companies.
Which policies might work for your country. Be prepared to share with others and have your policy reviewed for its consequences! PICK A COUNTRY AND WRITE DOWN THE POLICIES YOU WOULD USE TO HELP THEM<br>