
The Global Summit on CRVS Civil Registration
JO
Published · 66 slides · 0 views

1 / 1







Description
The Global Summit on CRVS Civil Registration System and Sample Registration System R. K. Gautam Director Office of the Registrar General, India Sub- Topics History of Civil Registration System Vital Statistics in India The Registration of
Related Topics
Share
Embed code
Download this presentation From Below
"The Global Summit on CRVS Civil Registration" is the property of its rightful owner. Permission is granted to download and print the materials on this website for personal, non-commercial use only, and to display it on your personal computer provided you do not modify the materials and that you retain all copyright notices contained in the materials. By downloading content from our website, you accept the terms of this agreement.
Presentation Transcript
01
The Global Summit on CRVS
Civil Registration System and
Sample Registration System R. K. Gautam
Director
Office of the Registrar General, India<br>
Director
Office of the Registrar General, India<br>
02
Sub- Topics History of Civil Registration System & Vital Statistics in India
The Registration of Births & Deaths Act, 1969 (RBD Act, 1969)
Salient features of the RBD Act, 1969
Roles and Responsibilities of registration functionaries
Forms under the system of registration of births and deaths<br>
The Registration of Births & Deaths Act, 1969 (RBD Act, 1969)
Salient features of the RBD Act, 1969
Roles and Responsibilities of registration functionaries
Forms under the system of registration of births and deaths<br>
03
Sub- Topics Sources of data for generating Vital Statistics
Process of compilation of Vital Statistics
Process of Dissemination of Vital Statistics
Level of Registration<br>
Process of compilation of Vital Statistics
Process of Dissemination of Vital Statistics
Level of Registration<br>
04
Introduction to Civil Registration System Civil Registration System popularly known as birth and death registration system is the recording of vital events i.e. live births, still births and deaths under the statutory provisions on a continuous and permanent basis. The registration records are useful primarily as legal documents and secondarily as a source of statistics.
In India, the system of civil registration has been in operation for more than a century.
At present the registration of births and deaths is being done under Registration of Birth and Death Act,1969.<br>
In India, the system of civil registration has been in operation for more than a century.
At present the registration of births and deaths is being done under Registration of Birth and Death Act,1969.<br>
05
CIVIL REGISTRATION SYSTEM Vital Statistics including Registration of Births and Deaths at Sl. No. 30 falls under Concurrent List of the Constitution of India.
Mandatory under RBD Act 1969 National<br>
Mandatory under RBD Act 1969 National<br>
06
Civil Registration System Comprehensive and complete CRS has multi-faceted implications on socio-economic development of a country.
A complete & up to date CRS can provide:
Reliable Statistics on fertility & mortality at all level of aggregations
Almost on a real time basis which is not possible from any sample survey.
Key for evidence based planning and has no parallels
The levels of registration reflects the quality of governance.<br>
A complete & up to date CRS can provide:
Reliable Statistics on fertility & mortality at all level of aggregations
Almost on a real time basis which is not possible from any sample survey.
Key for evidence based planning and has no parallels
The levels of registration reflects the quality of governance.<br>
07
Civil Registration System The essential features of Civil Registration System are:
Universality
Continuity
Compulsory
Permanence<br>
Universality
Continuity
Compulsory
Permanence<br>
08
Civil Registration System CRS has the following components:
Law
Civil Registration Structure
People Participation
Services to Public
Checks and Balances<br>
Law
Civil Registration Structure
People Participation
Services to Public
Checks and Balances<br>
09
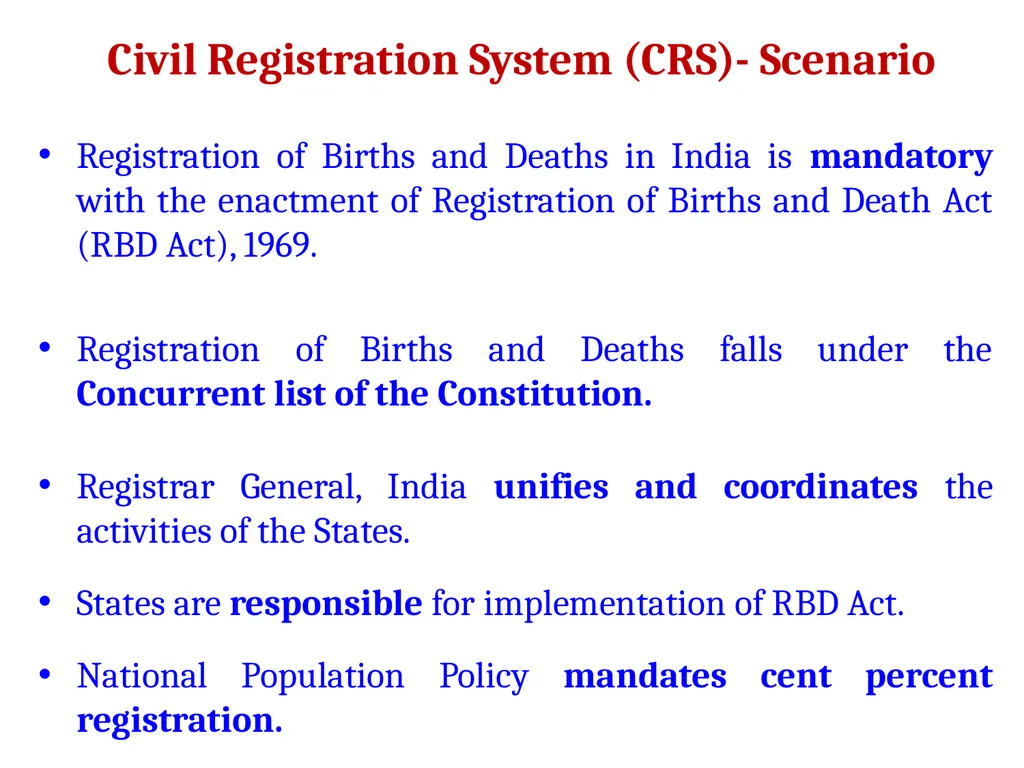
Civil Registration System (CRS)- Scenario Registration of Births and Deaths in India is mandatory with the enactment of Registration of Births and Death Act (RBD Act), 1969.
Registration of Births and Deaths falls under the Concurrent list of the Constitution.
Registrar General, India unifies and coordinates the activities of the States.
States are responsible for implementation of RBD Act.
National Population Policy mandates cent percent registration.<br>
Registration of Births and Deaths falls under the Concurrent list of the Constitution.
Registrar General, India unifies and coordinates the activities of the States.
States are responsible for implementation of RBD Act.
National Population Policy mandates cent percent registration.<br>
10
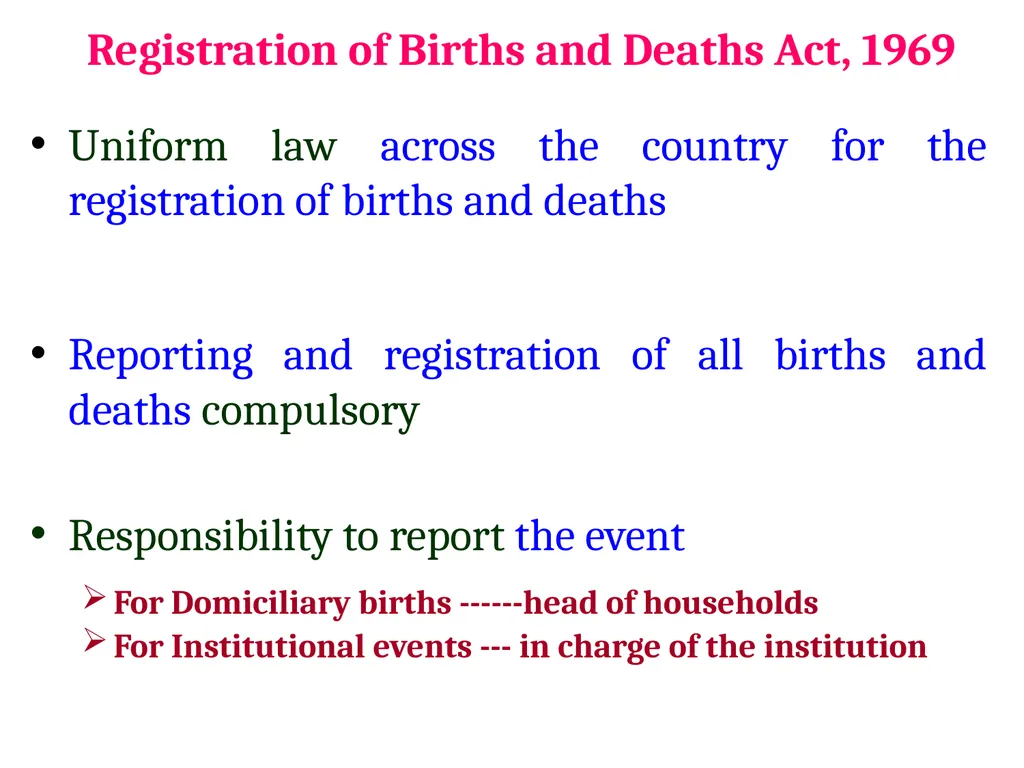
Registration of Births and Deaths Act, 1969 Uniform law across the country for the registration of births and deaths
Reporting and registration of all births and deaths compulsory
Responsibility to report the event
For Domiciliary births ------head of households
For Institutional events --- in charge of the institution<br>
Reporting and registration of all births and deaths compulsory
Responsibility to report the event
For Domiciliary births ------head of households
For Institutional events --- in charge of the institution<br>
11
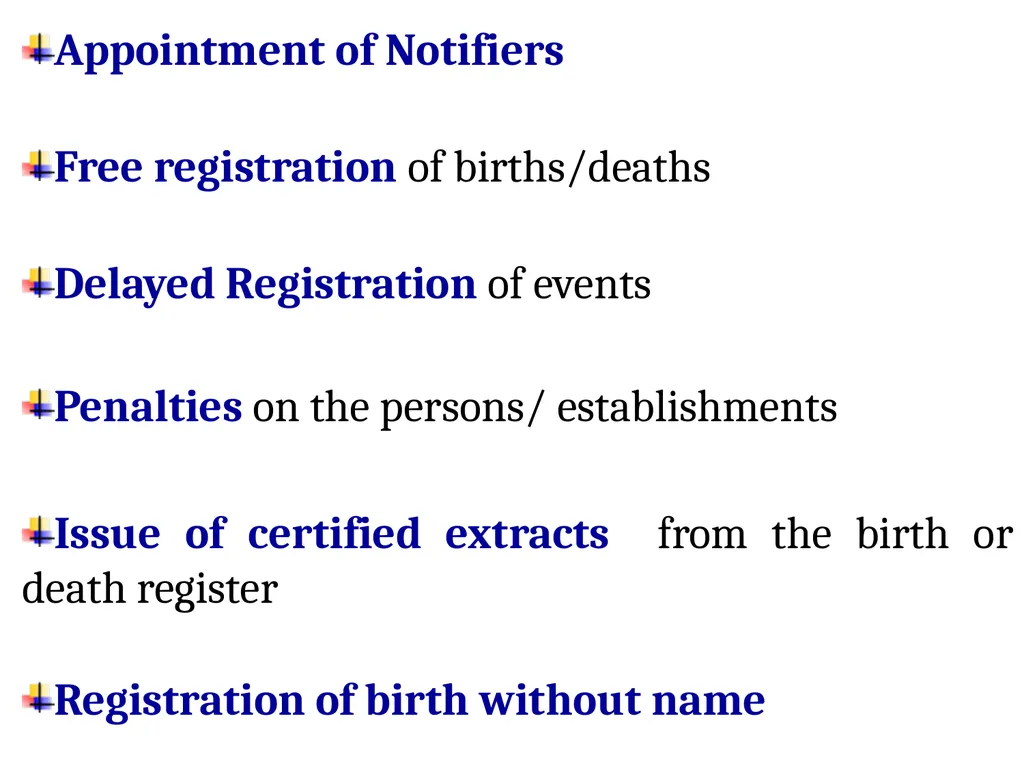
Appointment of Notifiers
Free registration of births/deaths
Delayed Registration of events
Penalties on the persons/ establishments
Issue of certified extracts from the birth or death register
Registration of birth without name<br>
Free registration of births/deaths
Delayed Registration of events
Penalties on the persons/ establishments
Issue of certified extracts from the birth or death register
Registration of birth without name<br>
12
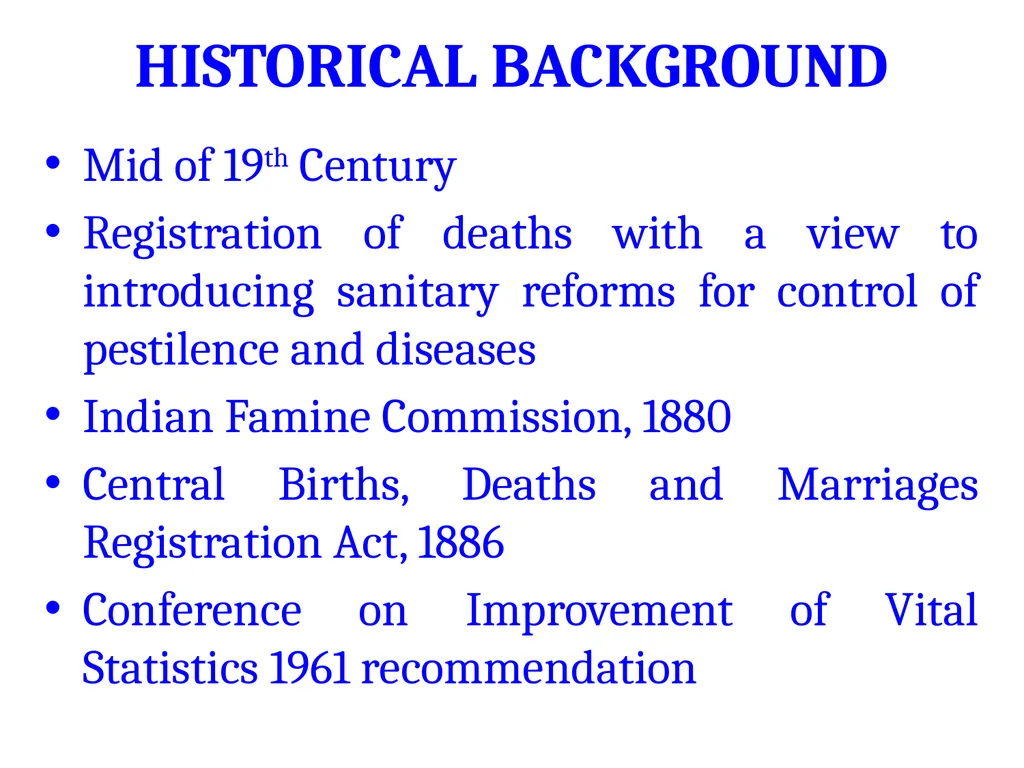
HISTORICAL BACKGROUND Mid of 19th Century
Registration of deaths with a view to introducing sanitary reforms for control of pestilence and diseases
Indian Famine Commission, 1880
Central Births, Deaths and Marriages Registration Act, 1886
Conference on Improvement of Vital Statistics 1961 recommendation<br>
Registration of deaths with a view to introducing sanitary reforms for control of pestilence and diseases
Indian Famine Commission, 1880
Central Births, Deaths and Marriages Registration Act, 1886
Conference on Improvement of Vital Statistics 1961 recommendation<br>
13
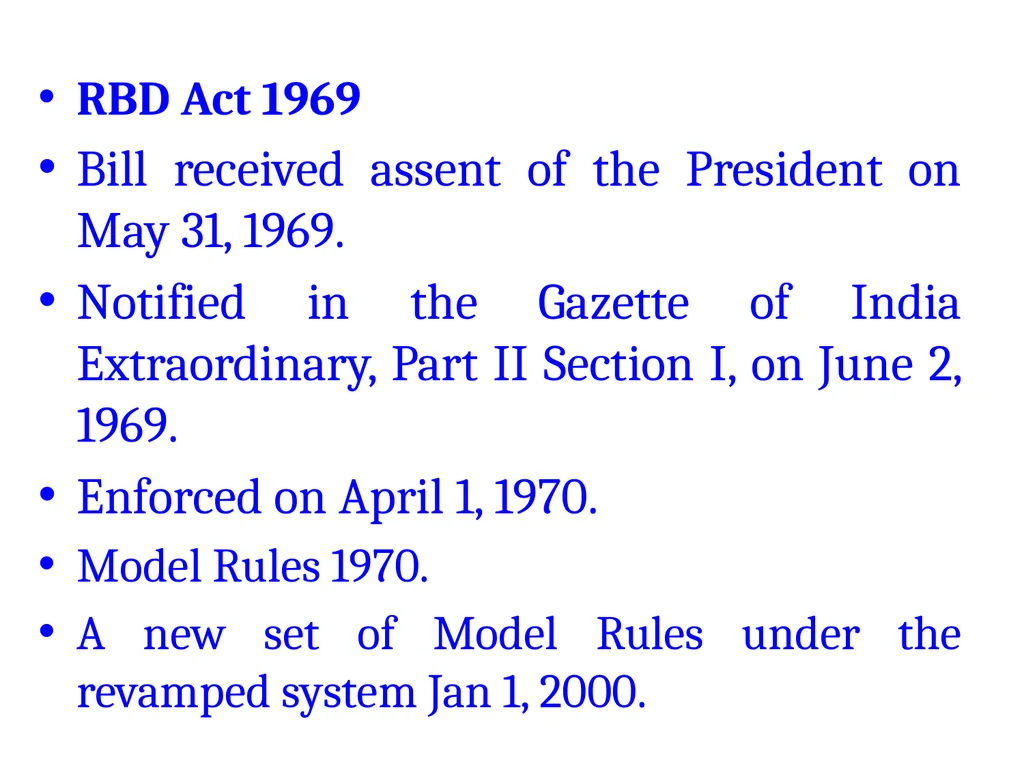
RBD Act 1969
Bill received assent of the President on May 31, 1969.
Notified in the Gazette of India Extraordinary, Part II Section I, on June 2, 1969.
Enforced on April 1, 1970.
Model Rules 1970.
A new set of Model Rules under the revamped system Jan 1, 2000.<br>
Bill received assent of the President on May 31, 1969.
Notified in the Gazette of India Extraordinary, Part II Section I, on June 2, 1969.
Enforced on April 1, 1970.
Model Rules 1970.
A new set of Model Rules under the revamped system Jan 1, 2000.<br>
14
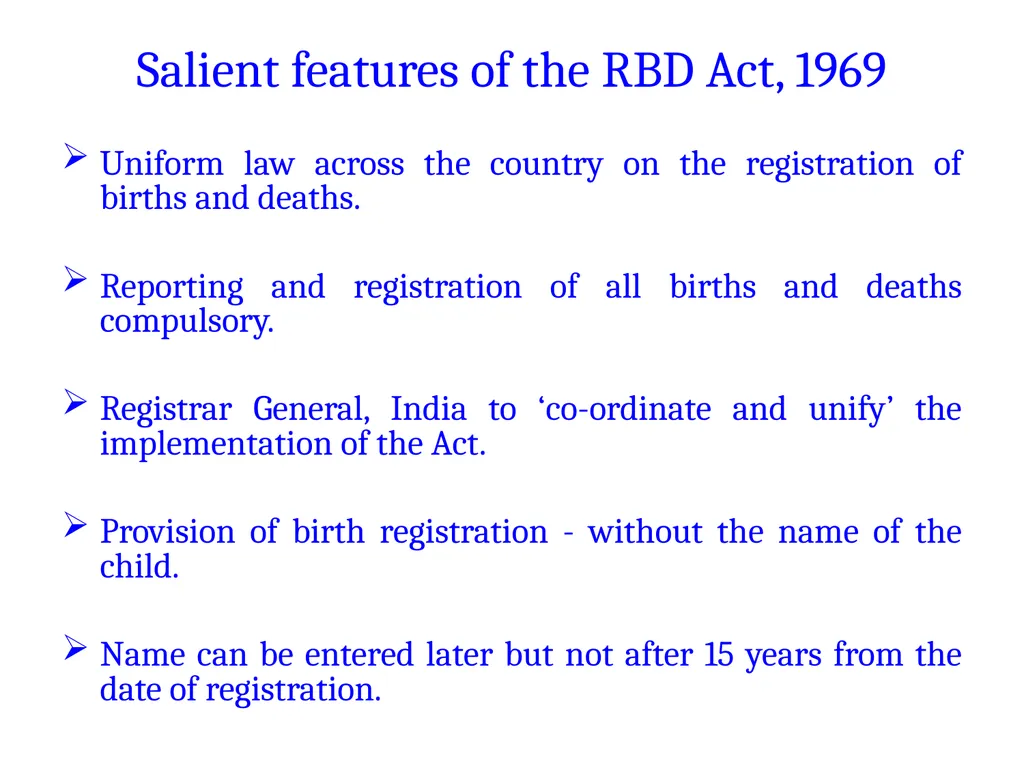
Salient features of the RBD Act, 1969 Uniform law across the country on the registration of births and deaths.
Reporting and registration of all births and deaths compulsory.
Registrar General, India to ‘co-ordinate and unify’ the implementation of the Act.
Provision of birth registration - without the name of the child.
Name can be entered later but not after 15 years from the date of registration.<br>
Reporting and registration of all births and deaths compulsory.
Registrar General, India to ‘co-ordinate and unify’ the implementation of the Act.
Provision of birth registration - without the name of the child.
Name can be entered later but not after 15 years from the date of registration.<br>
15
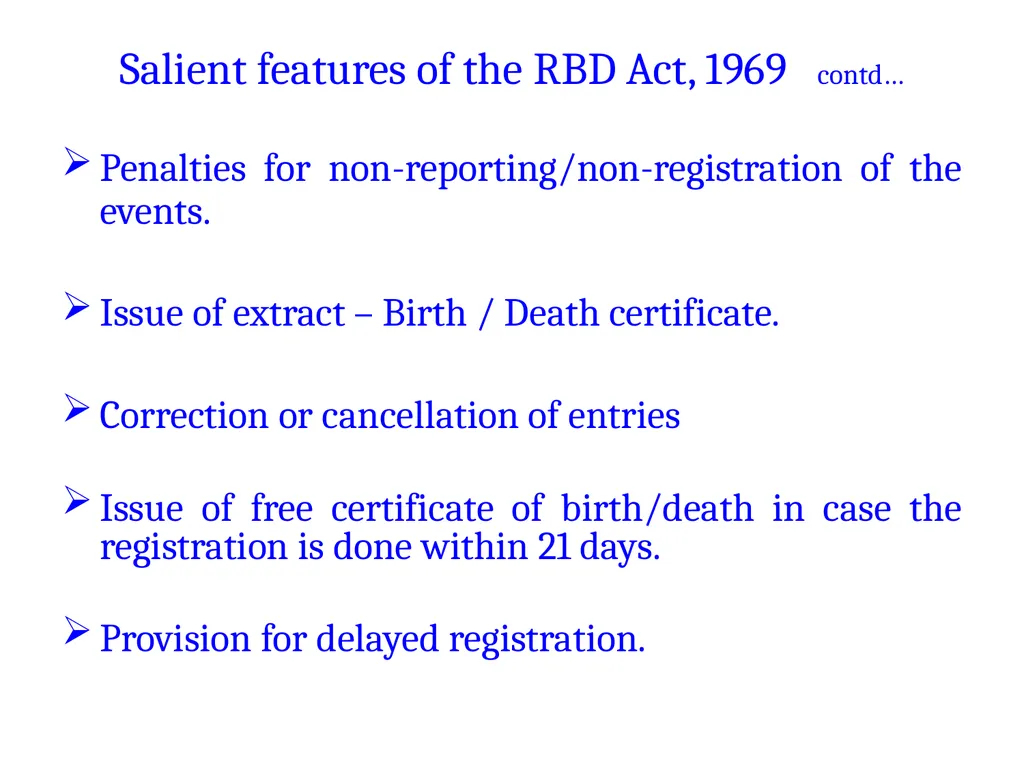
Salient features of the RBD Act, 1969 contd… Penalties for non-reporting/non-registration of the events.
Issue of extract – Birth / Death certificate.
Correction or cancellation of entries
Issue of free certificate of birth/death in case the registration is done within 21 days.
Provision for delayed registration.<br>
Issue of extract – Birth / Death certificate.
Correction or cancellation of entries
Issue of free certificate of birth/death in case the registration is done within 21 days.
Provision for delayed registration.<br>
16
Registration Hierarchy Coordinates
and unifies the implementation
of the Act in the country Chief Executive authority
in the State/Ut for implementing
the provisions of the Act Supervision of
the registration of
births and deaths
in the District Registration of
births and deaths and
submission of statistical
Information on registered
births and deaths<br>
and unifies the implementation
of the Act in the country Chief Executive authority
in the State/Ut for implementing
the provisions of the Act Supervision of
the registration of
births and deaths
in the District Registration of
births and deaths and
submission of statistical
Information on registered
births and deaths<br>
17
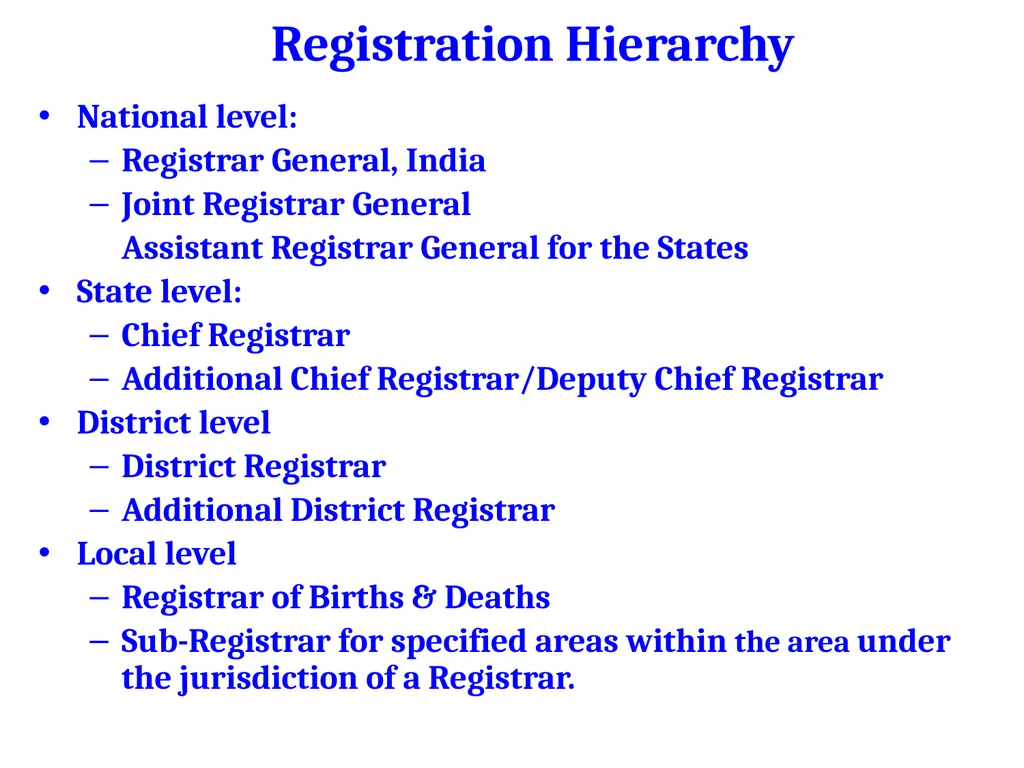
National level:
Registrar General, India
Joint Registrar General
Assistant Registrar General for the States
State level:
Chief Registrar
Additional Chief Registrar/Deputy Chief Registrar
District level
District Registrar
Additional District Registrar
Local level
Registrar of Births & Deaths
Sub-Registrar for specified areas within the area under the jurisdiction of a Registrar. Registration Hierarchy<br>
Registrar General, India
Joint Registrar General
Assistant Registrar General for the States
State level:
Chief Registrar
Additional Chief Registrar/Deputy Chief Registrar
District level
District Registrar
Additional District Registrar
Local level
Registrar of Births & Deaths
Sub-Registrar for specified areas within the area under the jurisdiction of a Registrar. Registration Hierarchy<br>
18
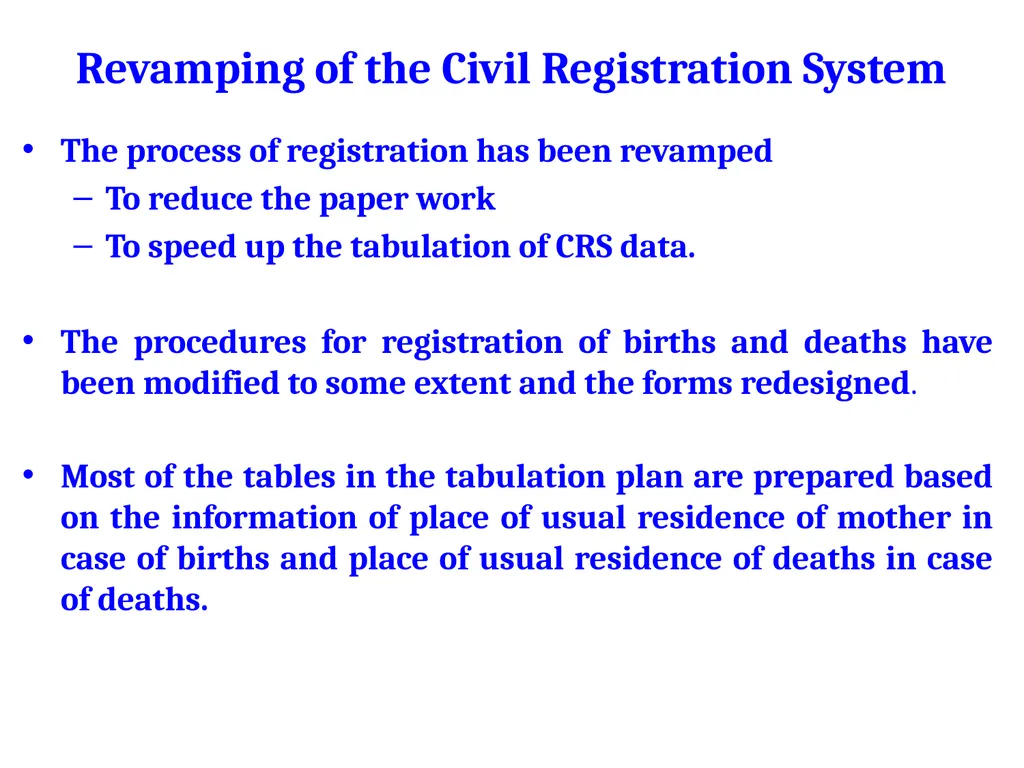
Revamping of the Civil Registration System The process of registration has been revamped
To reduce the paper work
To speed up the tabulation of CRS data.
The procedures for registration of births and deaths have been modified to some extent and the forms redesigned.
Most of the tables in the tabulation plan are prepared based on the information of place of usual residence of mother in case of births and place of usual residence of deaths in case of deaths.<br>
To reduce the paper work
To speed up the tabulation of CRS data.
The procedures for registration of births and deaths have been modified to some extent and the forms redesigned.
Most of the tables in the tabulation plan are prepared based on the information of place of usual residence of mother in case of births and place of usual residence of deaths in case of deaths.<br>
19
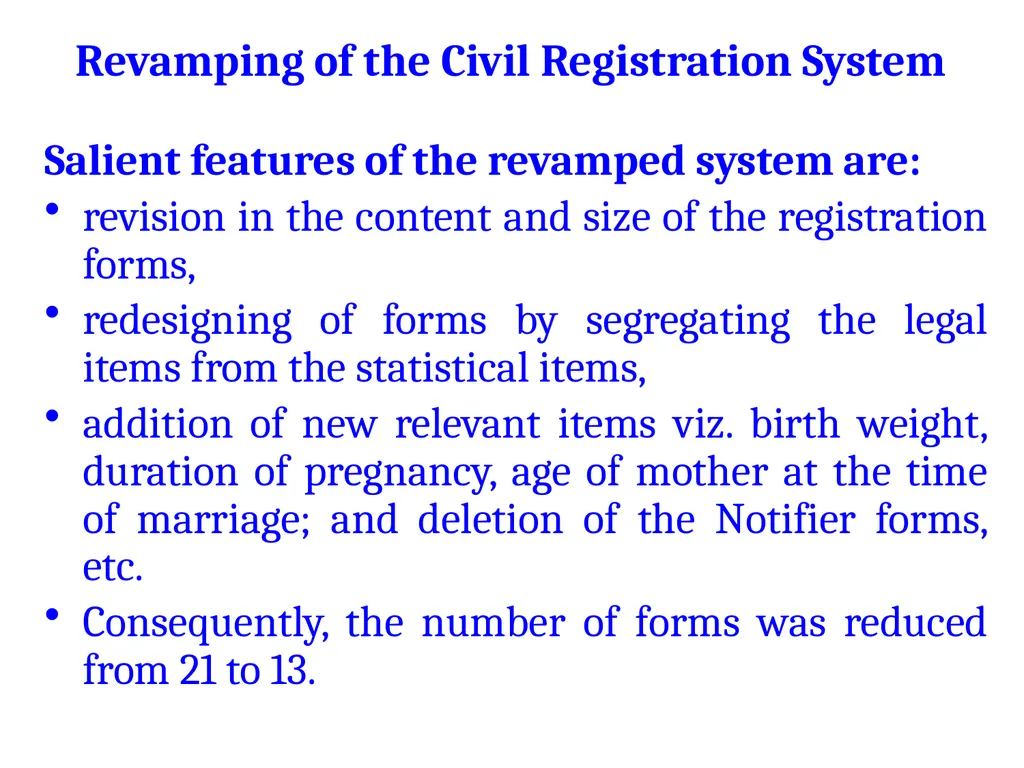
Revamping of the Civil Registration System Salient features of the revamped system are:
revision in the content and size of the registration forms,
redesigning of forms by segregating the legal items from the statistical items,
addition of new relevant items viz. birth weight, duration of pregnancy, age of mother at the time of marriage; and deletion of the Notifier forms, etc.
Consequently, the number of forms was reduced from 21 to 13.<br>
revision in the content and size of the registration forms,
redesigning of forms by segregating the legal items from the statistical items,
addition of new relevant items viz. birth weight, duration of pregnancy, age of mother at the time of marriage; and deletion of the Notifier forms, etc.
Consequently, the number of forms was reduced from 21 to 13.<br>
20
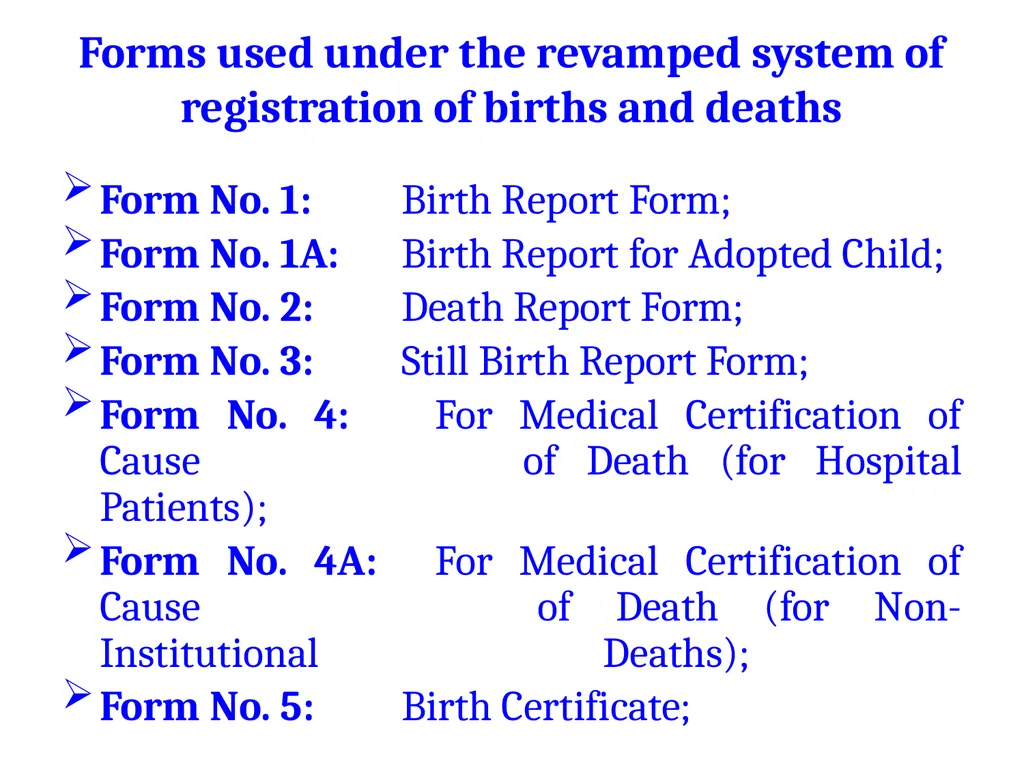
Forms used under the revamped system of registration of births and deaths Form No. 1: Birth Report Form;
Form No. 1A: Birth Report for Adopted Child;
Form No. 2: Death Report Form;
Form No. 3: Still Birth Report Form;
Form No. 4: For Medical Certification of Cause of Death (for Hospital Patients);
Form No. 4A: For Medical Certification of Cause of Death (for Non-Institutional Deaths);
Form No. 5: Birth Certificate;<br>
Form No. 1A: Birth Report for Adopted Child;
Form No. 2: Death Report Form;
Form No. 3: Still Birth Report Form;
Form No. 4: For Medical Certification of Cause of Death (for Hospital Patients);
Form No. 4A: For Medical Certification of Cause of Death (for Non-Institutional Deaths);
Form No. 5: Birth Certificate;<br>
21
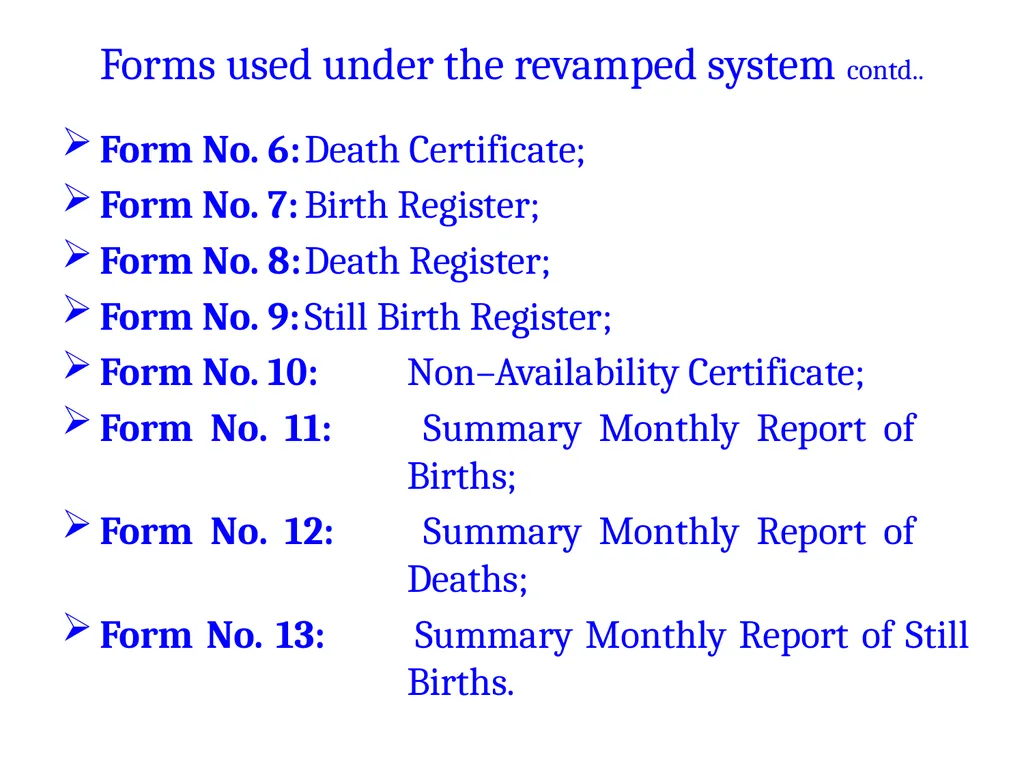
Forms used under the revamped system contd.. Form No. 6: Death Certificate;
Form No. 7: Birth Register;
Form No. 8: Death Register;
Form No. 9: Still Birth Register;
Form No. 10: Non–Availability Certificate;
Form No. 11: Summary Monthly Report of Births;
Form No. 12: Summary Monthly Report of Deaths;
Form No. 13: Summary Monthly Report of Still Births.<br>
Form No. 7: Birth Register;
Form No. 8: Death Register;
Form No. 9: Still Birth Register;
Form No. 10: Non–Availability Certificate;
Form No. 11: Summary Monthly Report of Births;
Form No. 12: Summary Monthly Report of Deaths;
Form No. 13: Summary Monthly Report of Still Births.<br>
22
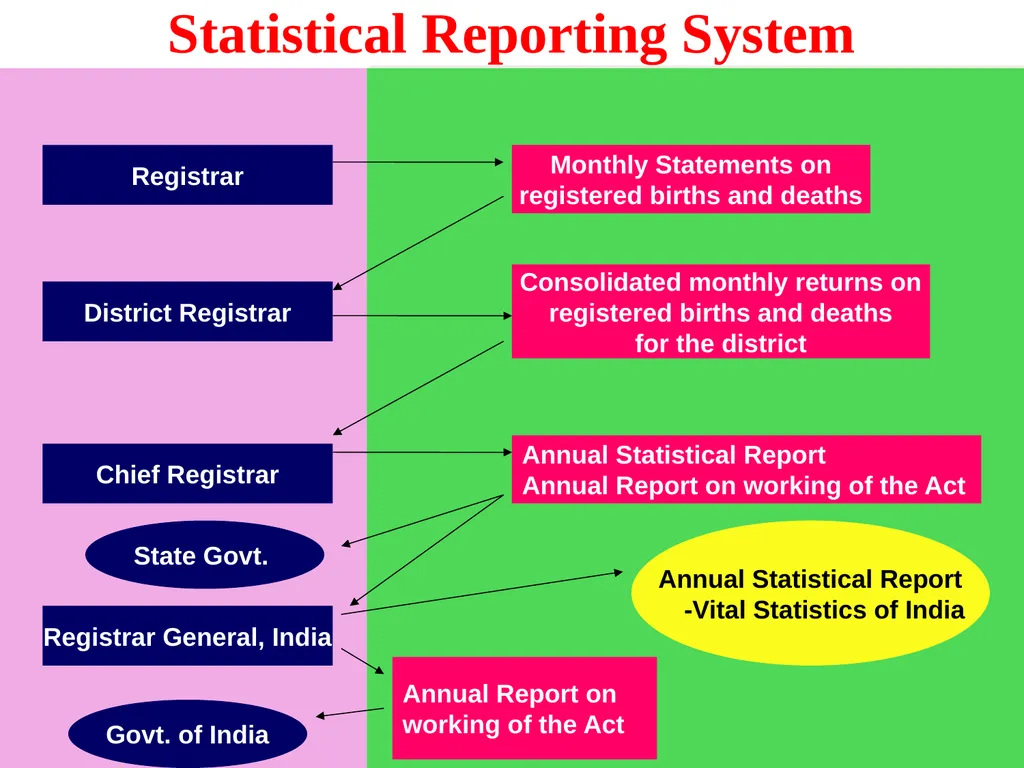
Statistical Reporting System Registrar Monthly Statements on
registered births and deaths District Registrar Consolidated monthly returns on
registered births and deaths
for the district Annual Statistical Report
Annual Report on working of the Act Chief Registrar Registrar General, India Annual Report on
working of the Act Annual Statistical Report
-Vital Statistics of India Govt. of India State Govt.<br>
registered births and deaths District Registrar Consolidated monthly returns on
registered births and deaths
for the district Annual Statistical Report
Annual Report on working of the Act Chief Registrar Registrar General, India Annual Report on
working of the Act Annual Statistical Report
-Vital Statistics of India Govt. of India State Govt.<br>
23
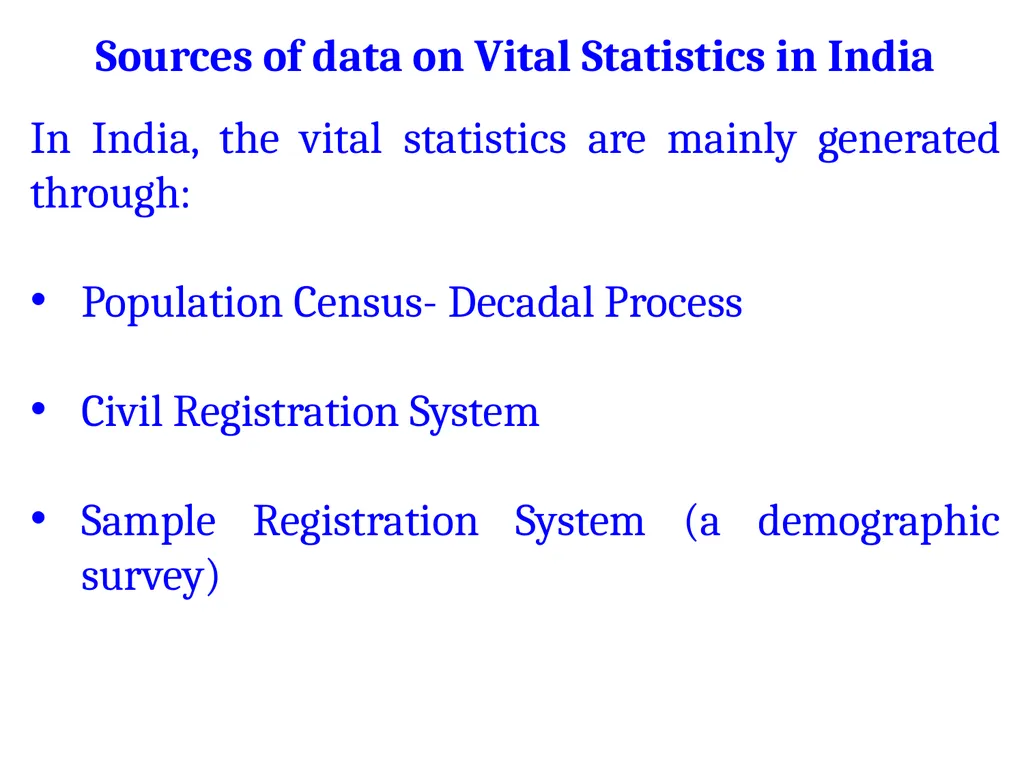
Sources of data on Vital Statistics in India In India, the vital statistics are mainly generated through:
Population Census- Decadal Process
Civil Registration System
Sample Registration System (a demographic survey)<br>
Population Census- Decadal Process
Civil Registration System
Sample Registration System (a demographic survey)<br>
24
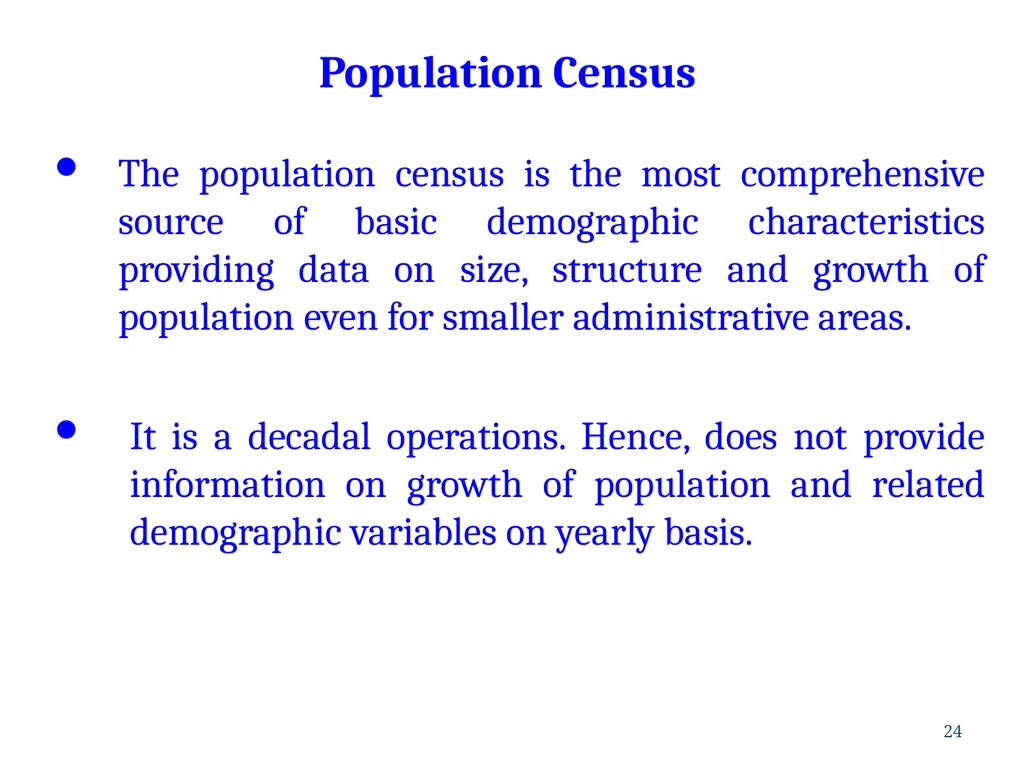
The population census is the most comprehensive source of basic demographic characteristics providing data on size, structure and growth of population even for smaller administrative areas.
It is a decadal operations. Hence, does not provide information on growth of population and related demographic variables on yearly basis. 24 Population Census<br>
It is a decadal operations. Hence, does not provide information on growth of population and related demographic variables on yearly basis. 24 Population Census<br>
25
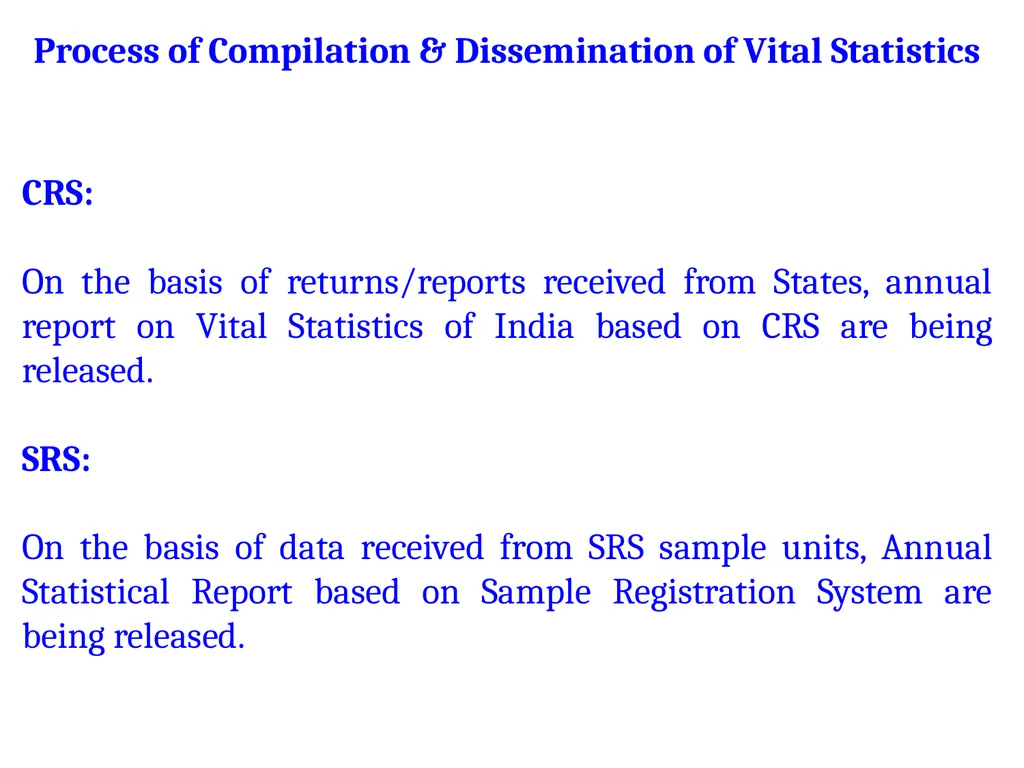
Process of Compilation & Dissemination of Vital Statistics CRS:
On the basis of returns/reports received from States, annual report on Vital Statistics of India based on CRS are being released.
SRS:
On the basis of data received from SRS sample units, Annual Statistical Report based on Sample Registration System are being released.<br>
On the basis of returns/reports received from States, annual report on Vital Statistics of India based on CRS are being released.
SRS:
On the basis of data received from SRS sample units, Annual Statistical Report based on Sample Registration System are being released.<br>
26
Civil registration systems are considered to be complete if they cover 90% or more of all live births and deaths.
In India, the coverage of registration system is incomplete and not up to the mark to be utilized for statistical purposes at the National level.
However, there are 21 and 14 States/UTs where the coverage of birth and death registration respectively is more than 90%.<br>
In India, the coverage of registration system is incomplete and not up to the mark to be utilized for statistical purposes at the National level.
However, there are 21 and 14 States/UTs where the coverage of birth and death registration respectively is more than 90%.<br>
27
The level of registration (LOR), defined as the percentage of registered births/deaths to the births/deaths estimated through SRS, determines the performance level of a State /Union Territory in respect of registration of births and deaths. Performance Indicator (Level of Registration)<br>
28
LOR (Birth) – India: 69.0% to 83.6 % ( + 14.6 %)
LOR (Death)– India: 63.2% to 67.4% ( + 4.2%)
15 States/UTs have achieved 100% registration of births.
7 States/UTs have achieved 100% registration of deaths.
Some of the major States remains the main concern. Registration Scenario in India during last 5 years<br>
LOR (Death)– India: 63.2% to 67.4% ( + 4.2%)
15 States/UTs have achieved 100% registration of births.
7 States/UTs have achieved 100% registration of deaths.
Some of the major States remains the main concern. Registration Scenario in India during last 5 years<br>
29
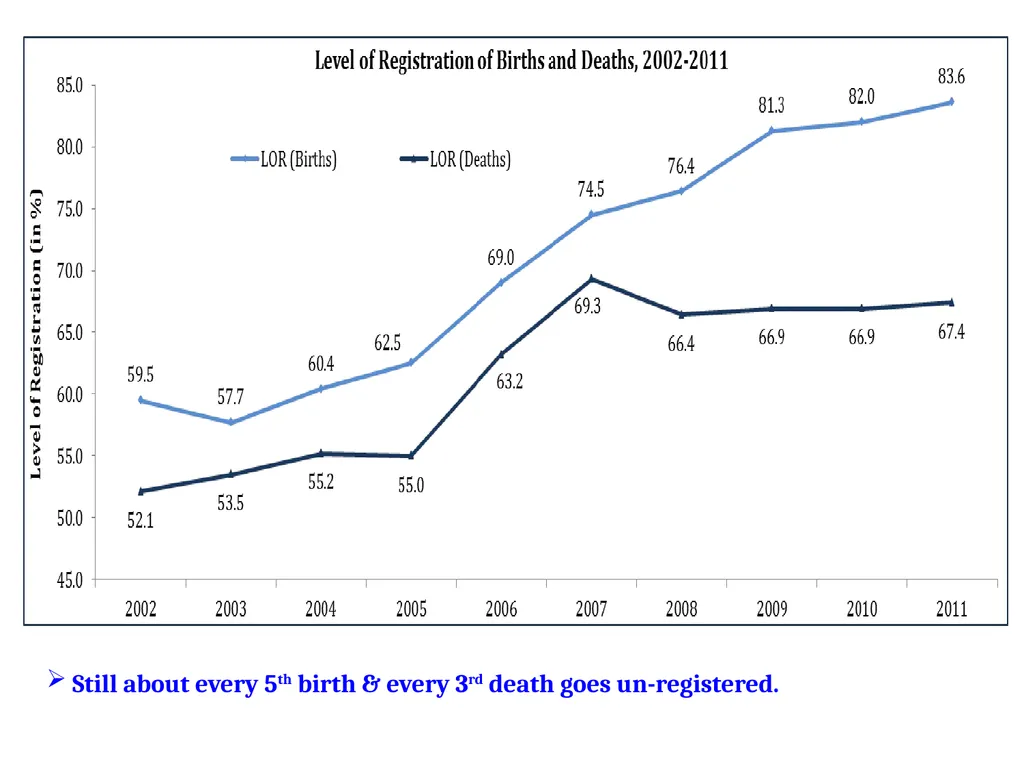
Still about every 5th birth & every 3rd death goes un-registered.<br>
30
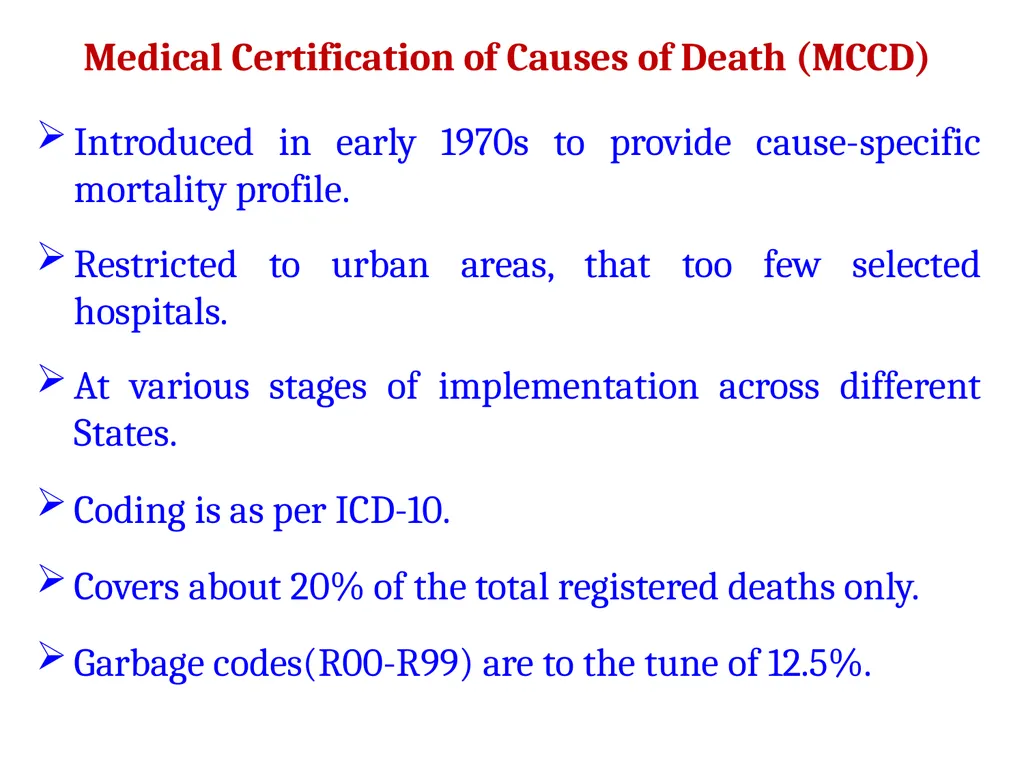
Introduced in early 1970s to provide cause-specific mortality profile.
Restricted to urban areas, that too few selected hospitals.
At various stages of implementation across different States.
Coding is as per ICD-10.
Covers about 20% of the total registered deaths only.
Garbage codes(R00-R99) are to the tune of 12.5%. Medical Certification of Causes of Death (MCCD)<br>
Restricted to urban areas, that too few selected hospitals.
At various stages of implementation across different States.
Coding is as per ICD-10.
Covers about 20% of the total registered deaths only.
Garbage codes(R00-R99) are to the tune of 12.5%. Medical Certification of Causes of Death (MCCD)<br>
31
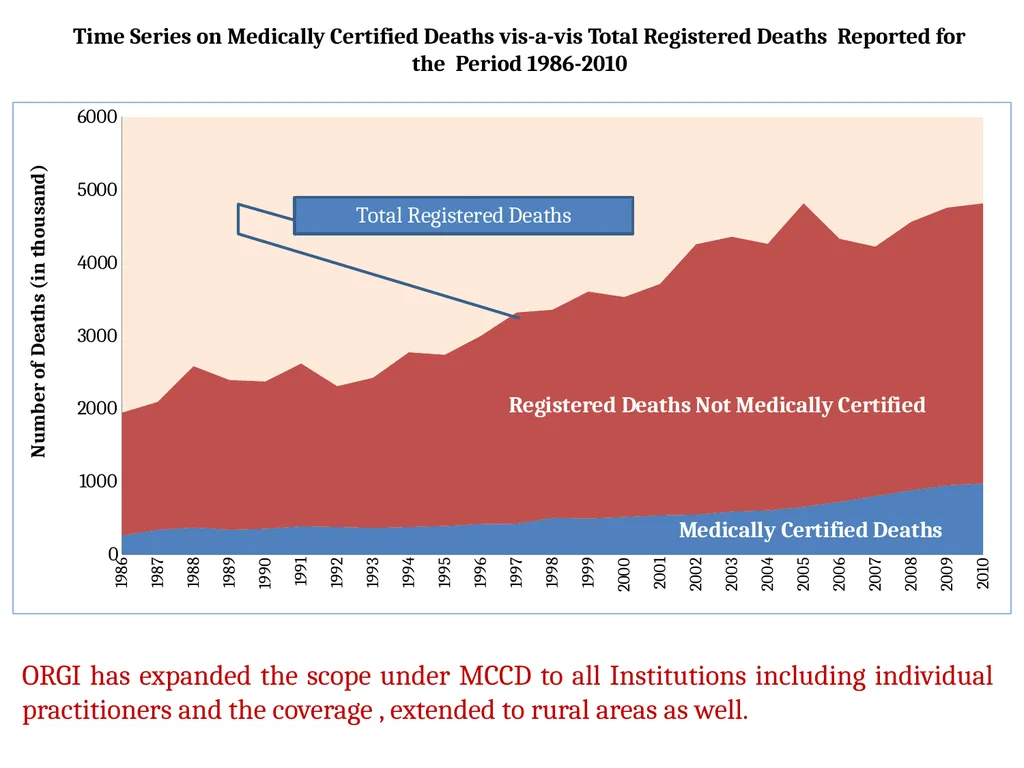
Time Series on Medically Certified Deaths vis-a-vis Total Registered Deaths Reported for the Period 1986-2010 ORGI has expanded the scope under MCCD to all Institutions including individual practitioners and the coverage , extended to rural areas as well.<br>
32
Evaluation :
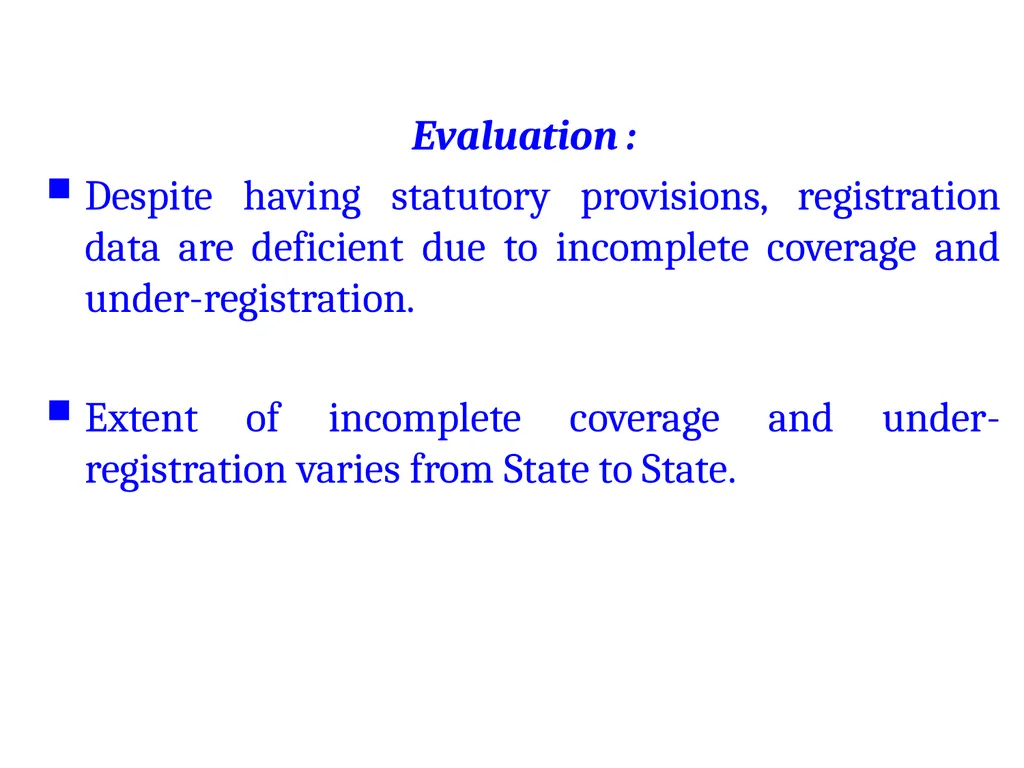
Despite having statutory provisions, registration data are deficient due to incomplete coverage and under-registration.
Extent of incomplete coverage and under-registration varies from State to State.<br>
Despite having statutory provisions, registration data are deficient due to incomplete coverage and under-registration.
Extent of incomplete coverage and under-registration varies from State to State.<br>
33
Why SRS is implemented ?
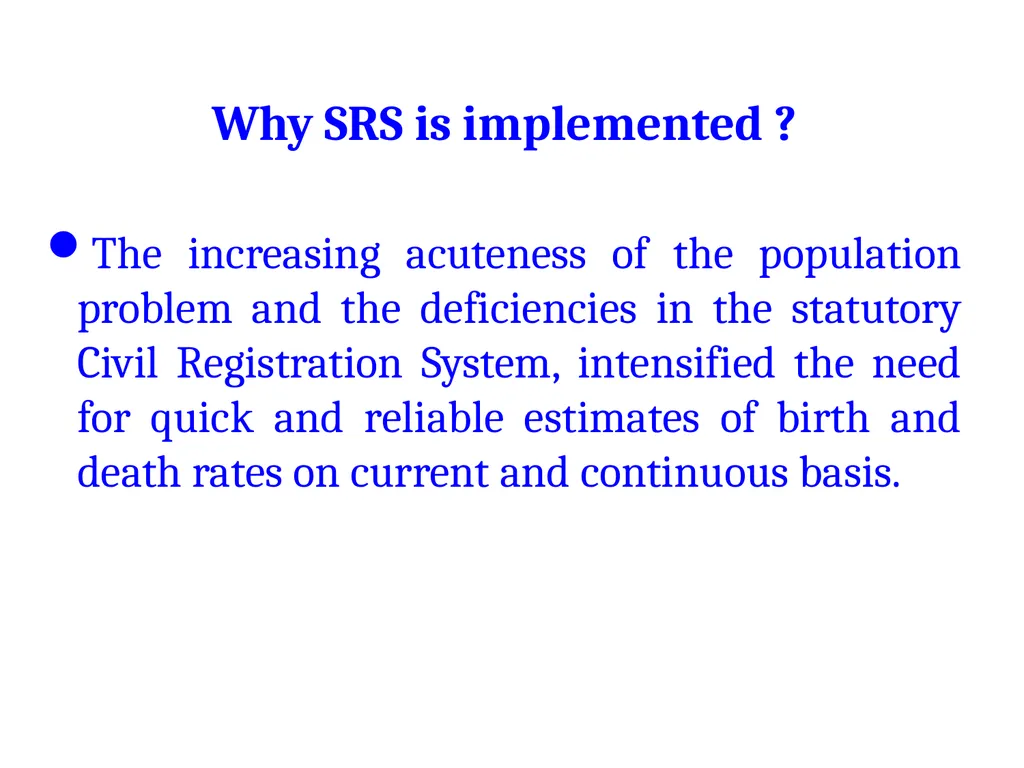
The increasing acuteness of the population problem and the deficiencies in the statutory Civil Registration System, intensified the need for quick and reliable estimates of birth and death rates on current and continuous basis.<br>
The increasing acuteness of the population problem and the deficiencies in the statutory Civil Registration System, intensified the need for quick and reliable estimates of birth and death rates on current and continuous basis.<br>
34
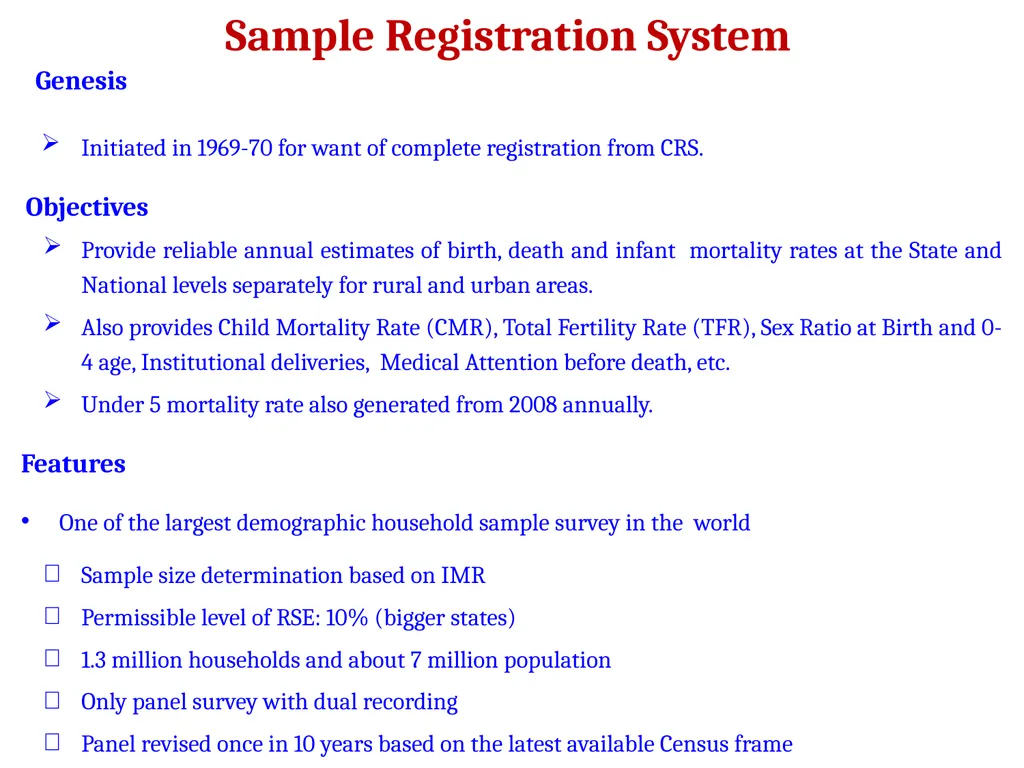
Sample Registration System Genesis
Initiated in 1969-70 for want of complete registration from CRS.
Objectives
Provide reliable annual estimates of birth, death and infant mortality rates at the State and National levels separately for rural and urban areas.
Also provides Child Mortality Rate (CMR), Total Fertility Rate (TFR), Sex Ratio at Birth and 0-4 age, Institutional deliveries, Medical Attention before death, etc.
Under 5 mortality rate also generated from 2008 annually.
Features
One of the largest demographic household sample survey in the world
Sample size determination based on IMR
Permissible level of RSE: 10% (bigger states)
1.3 million households and about 7 million population
Only panel survey with dual recording
Panel revised once in 10 years based on the latest available Census frame<br>
Initiated in 1969-70 for want of complete registration from CRS.
Objectives
Provide reliable annual estimates of birth, death and infant mortality rates at the State and National levels separately for rural and urban areas.
Also provides Child Mortality Rate (CMR), Total Fertility Rate (TFR), Sex Ratio at Birth and 0-4 age, Institutional deliveries, Medical Attention before death, etc.
Under 5 mortality rate also generated from 2008 annually.
Features
One of the largest demographic household sample survey in the world
Sample size determination based on IMR
Permissible level of RSE: 10% (bigger states)
1.3 million households and about 7 million population
Only panel survey with dual recording
Panel revised once in 10 years based on the latest available Census frame<br>
35
SRS organised by the Office of the Registrar General, India in 1964-65 on a pilot basis and became operational on full scale from 1969-70.
One of the largest demographic sample of household survey covering 1.3 million households and about 7 million population in the new SRS (based on 2001 census frame). Sample Registration System (SRS)<br>
One of the largest demographic sample of household survey covering 1.3 million households and about 7 million population in the new SRS (based on 2001 census frame). Sample Registration System (SRS)<br>
36
SRS is a dual recording system with the main objective of providing reliable annual estimates of birth and death rates at the State and National levels.
SRS also provides estimates of Infant Mortality Rate (IMR), Under Five Mortality Rate (U5MR) and Total Fertility Rate (TFR).<br>
SRS also provides estimates of Infant Mortality Rate (IMR), Under Five Mortality Rate (U5MR) and Total Fertility Rate (TFR).<br>
37
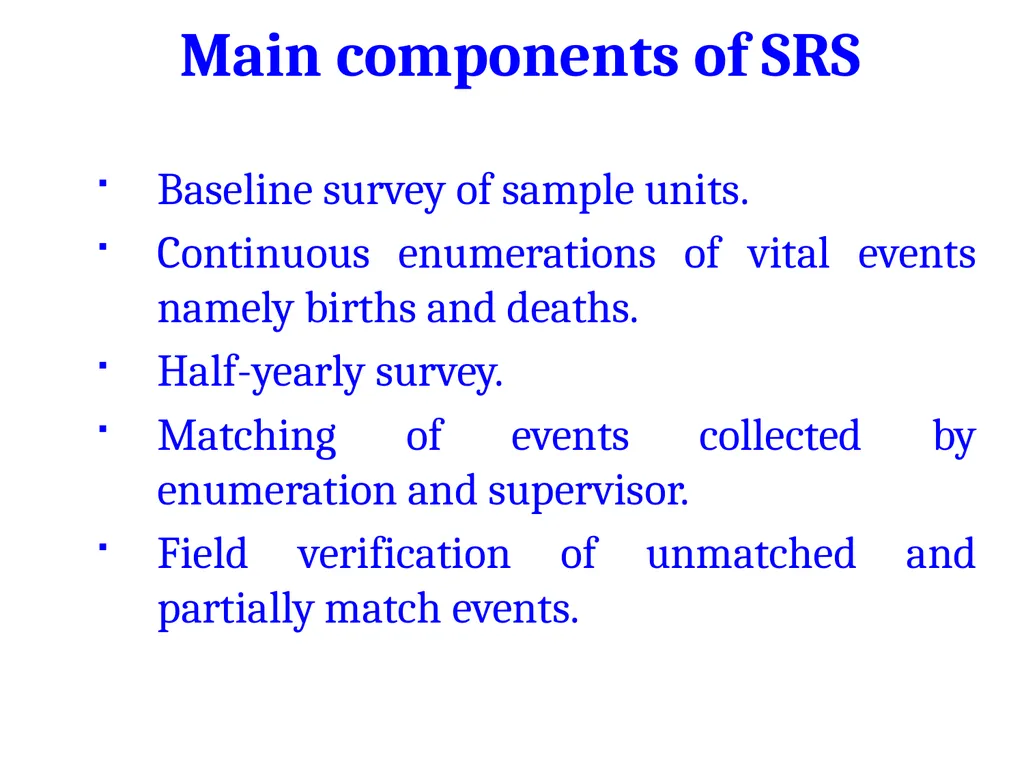
Baseline survey of sample units.
Continuous enumerations of vital events namely births and deaths.
Half-yearly survey.
Matching of events collected by enumeration and supervisor.
Field verification of unmatched and partially match events. Main components of SRS<br>
Continuous enumerations of vital events namely births and deaths.
Half-yearly survey.
Matching of events collected by enumeration and supervisor.
Field verification of unmatched and partially match events. Main components of SRS<br>
38
The field investigation under SRS consists of a continuous enumeration of births and deaths by an enumerator (preferably an anganwadi/local teacher) and an independent six-monthly retrospective survey by a full-time supervisor.
The data obtained by the two methods are matched. The partly matched and unmatched events are re-verified in the field to get an unduplicated count of events.<br>
The data obtained by the two methods are matched. The partly matched and unmatched events are re-verified in the field to get an unduplicated count of events.<br>
39
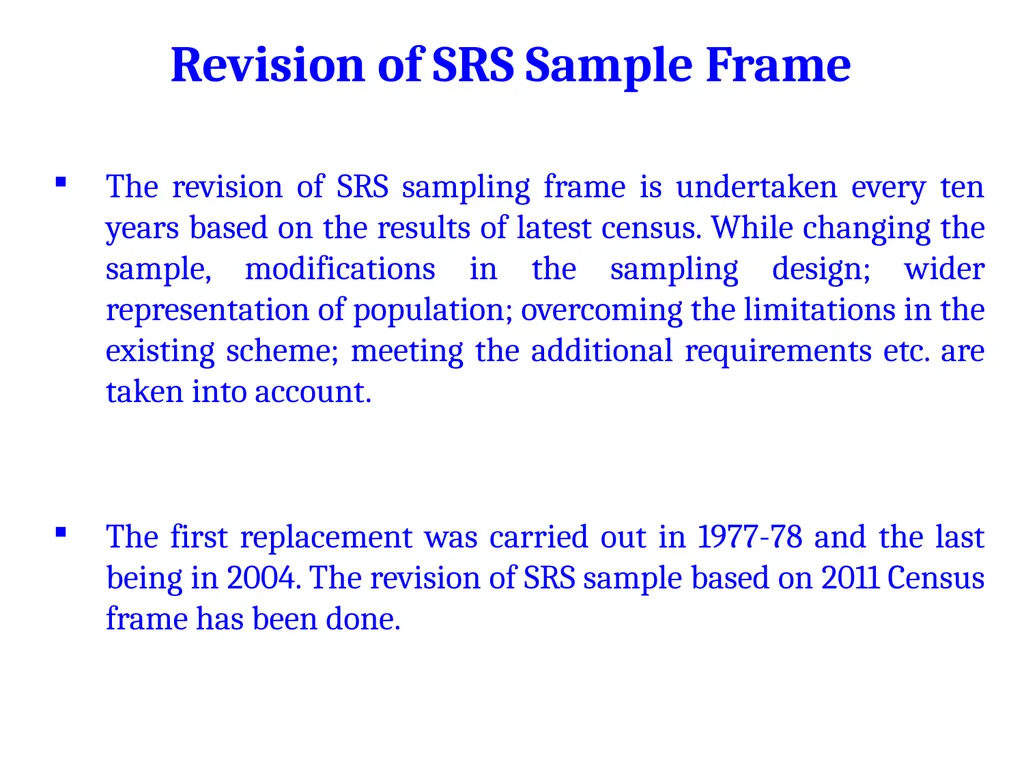
The revision of SRS sampling frame is undertaken every ten years based on the results of latest census. While changing the sample, modifications in the sampling design; wider representation of population; overcoming the limitations in the existing scheme; meeting the additional requirements etc. are taken into account.
The first replacement was carried out in 1977-78 and the last being in 2004. The revision of SRS sample based on 2011 Census frame has been done. Revision of SRS Sample Frame<br>
The first replacement was carried out in 1977-78 and the last being in 2004. The revision of SRS sample based on 2011 Census frame has been done. Revision of SRS Sample Frame<br>
40
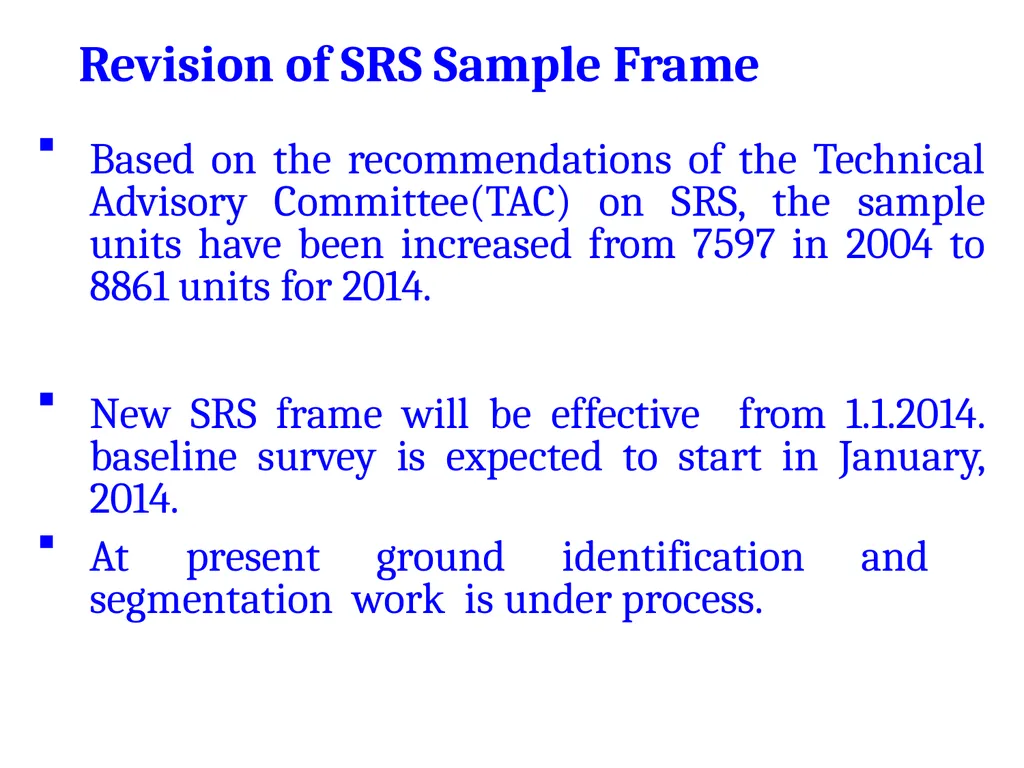
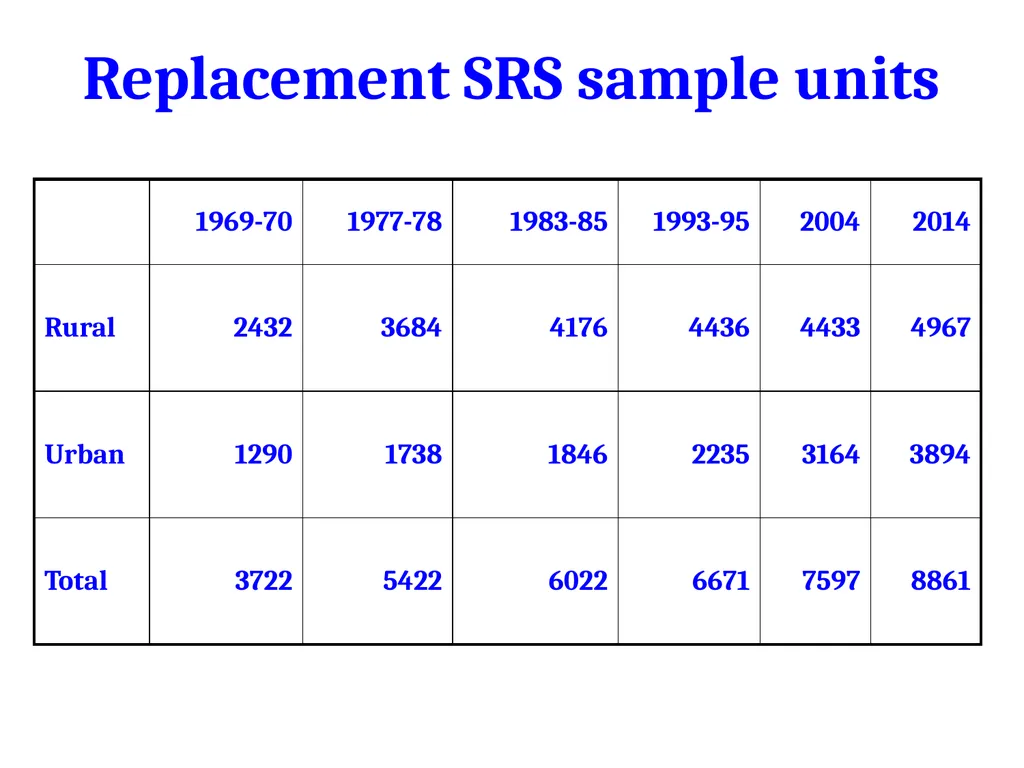
Based on the recommendations of the Technical Advisory Committee(TAC) on SRS, the sample units have been increased from 7597 in 2004 to 8861 units for 2014.
New SRS frame will be effective from 1.1.2014. baseline survey is expected to start in January, 2014.
At present ground identification and segmentation work is under process. Revision of SRS Sample Frame<br>
New SRS frame will be effective from 1.1.2014. baseline survey is expected to start in January, 2014.
At present ground identification and segmentation work is under process. Revision of SRS Sample Frame<br>
41
Replacement SRS sample units<br>
42
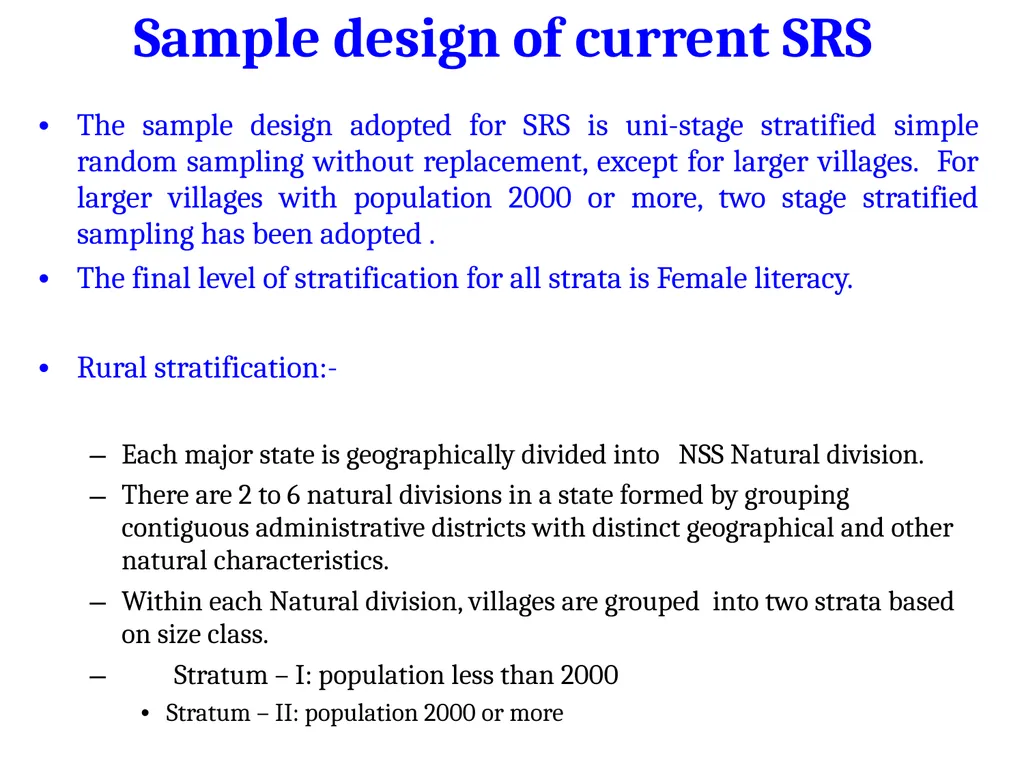
The sample design adopted for SRS is uni-stage stratified simple random sampling without replacement, except for larger villages. For larger villages with population 2000 or more, two stage stratified sampling has been adopted .
The final level of stratification for all strata is Female literacy.
Rural stratification:-
Each major state is geographically divided into NSS Natural division.
There are 2 to 6 natural divisions in a state formed by grouping contiguous administrative districts with distinct geographical and other natural characteristics.
Within each Natural division, villages are grouped into two strata based on size class.
Stratum – I: population less than 2000
Stratum – II: population 2000 or more Sample design of current SRS<br>
The final level of stratification for all strata is Female literacy.
Rural stratification:-
Each major state is geographically divided into NSS Natural division.
There are 2 to 6 natural divisions in a state formed by grouping contiguous administrative districts with distinct geographical and other natural characteristics.
Within each Natural division, villages are grouped into two strata based on size class.
Stratum – I: population less than 2000
Stratum – II: population 2000 or more Sample design of current SRS<br>
43
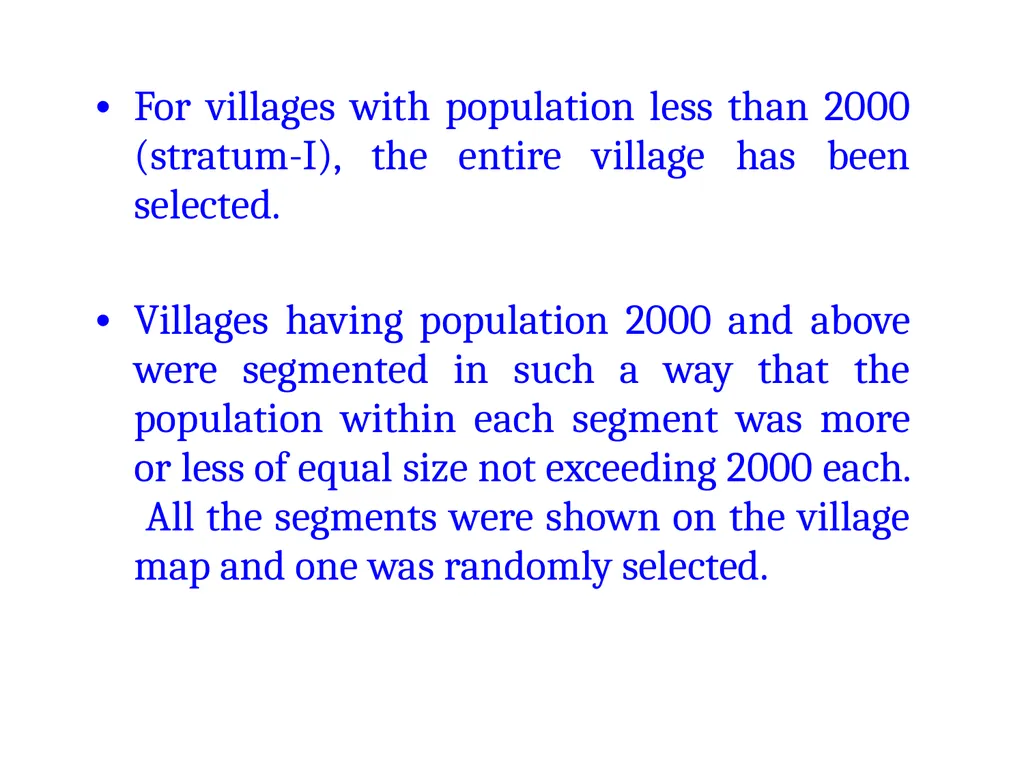
For villages with population less than 2000 (stratum-I), the entire village has been selected.
Villages having population 2000 and above were segmented in such a way that the population within each segment was more or less of equal size not exceeding 2000 each. All the segments were shown on the village map and one was randomly selected.<br>
Villages having population 2000 and above were segmented in such a way that the population within each segment was more or less of equal size not exceeding 2000 each. All the segments were shown on the village map and one was randomly selected.<br>
44
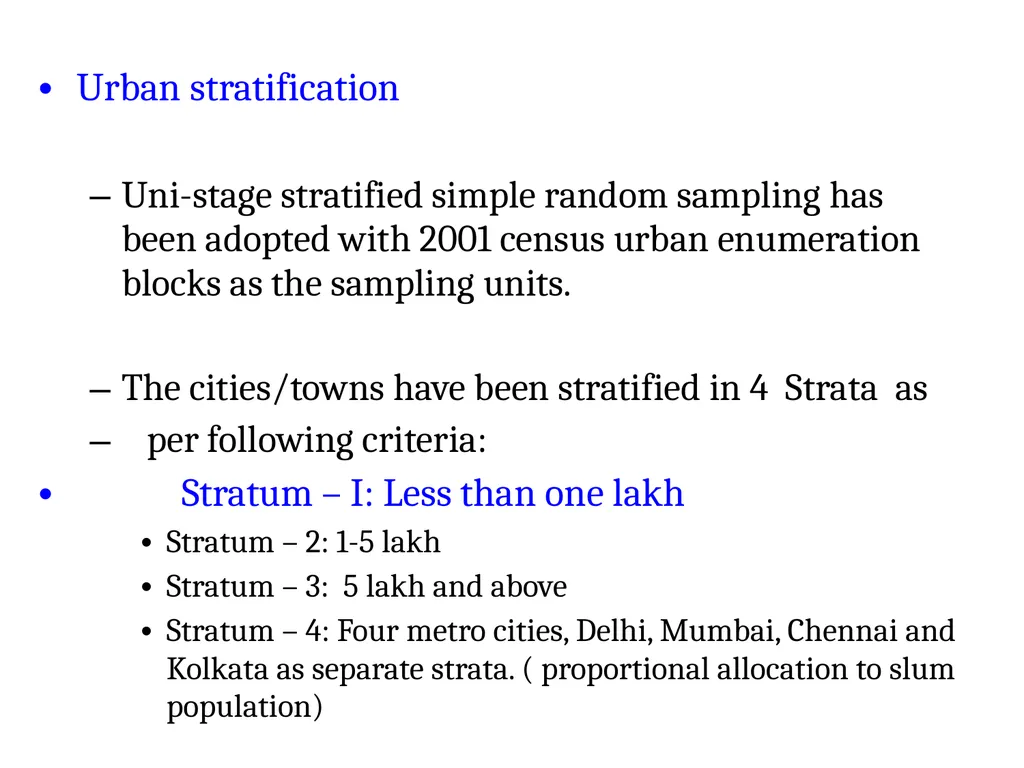
Urban stratification
Uni-stage stratified simple random sampling has been adopted with 2001 census urban enumeration blocks as the sampling units.
The cities/towns have been stratified in 4 Strata as
per following criteria:
Stratum – I: Less than one lakh
Stratum – 2: 1-5 lakh
Stratum – 3: 5 lakh and above
Stratum – 4: Four metro cities, Delhi, Mumbai, Chennai and Kolkata as separate strata. ( proportional allocation to slum population)<br>
Uni-stage stratified simple random sampling has been adopted with 2001 census urban enumeration blocks as the sampling units.
The cities/towns have been stratified in 4 Strata as
per following criteria:
Stratum – I: Less than one lakh
Stratum – 2: 1-5 lakh
Stratum – 3: 5 lakh and above
Stratum – 4: Four metro cities, Delhi, Mumbai, Chennai and Kolkata as separate strata. ( proportional allocation to slum population)<br>
45
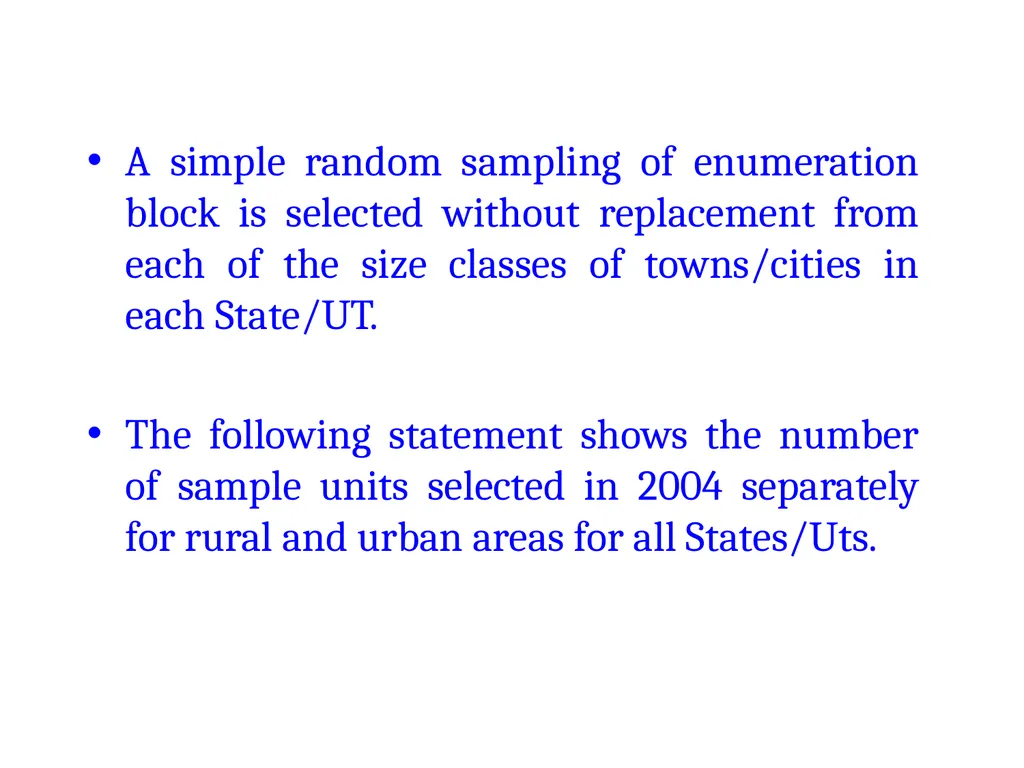
A simple random sampling of enumeration block is selected without replacement from each of the size classes of towns/cities in each State/UT.
The following statement shows the number of sample units selected in 2004 separately for rural and urban areas for all States/Uts.<br>
The following statement shows the number of sample units selected in 2004 separately for rural and urban areas for all States/Uts.<br>
46
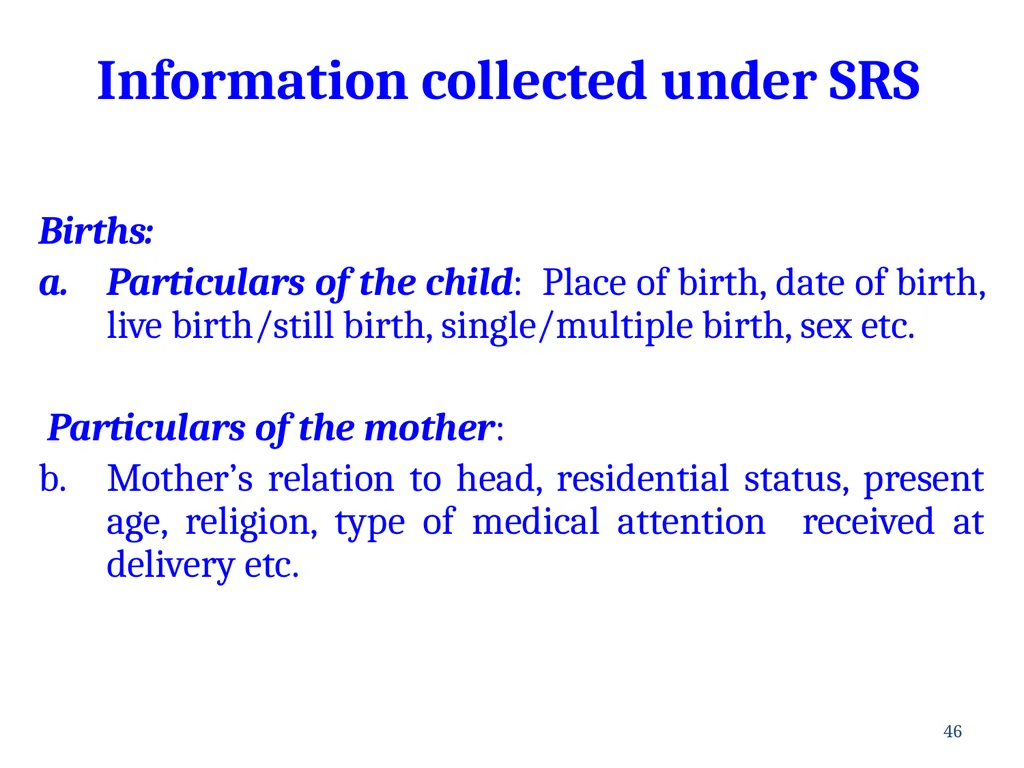
Births:
Particulars of the child: Place of birth, date of birth, live birth/still birth, single/multiple birth, sex etc.
Particulars of the mother:
Mother’s relation to head, residential status, present age, religion, type of medical attention received at delivery etc. 46 Information collected under SRS<br>
Particulars of the child: Place of birth, date of birth, live birth/still birth, single/multiple birth, sex etc.
Particulars of the mother:
Mother’s relation to head, residential status, present age, religion, type of medical attention received at delivery etc. 46 Information collected under SRS<br>
47
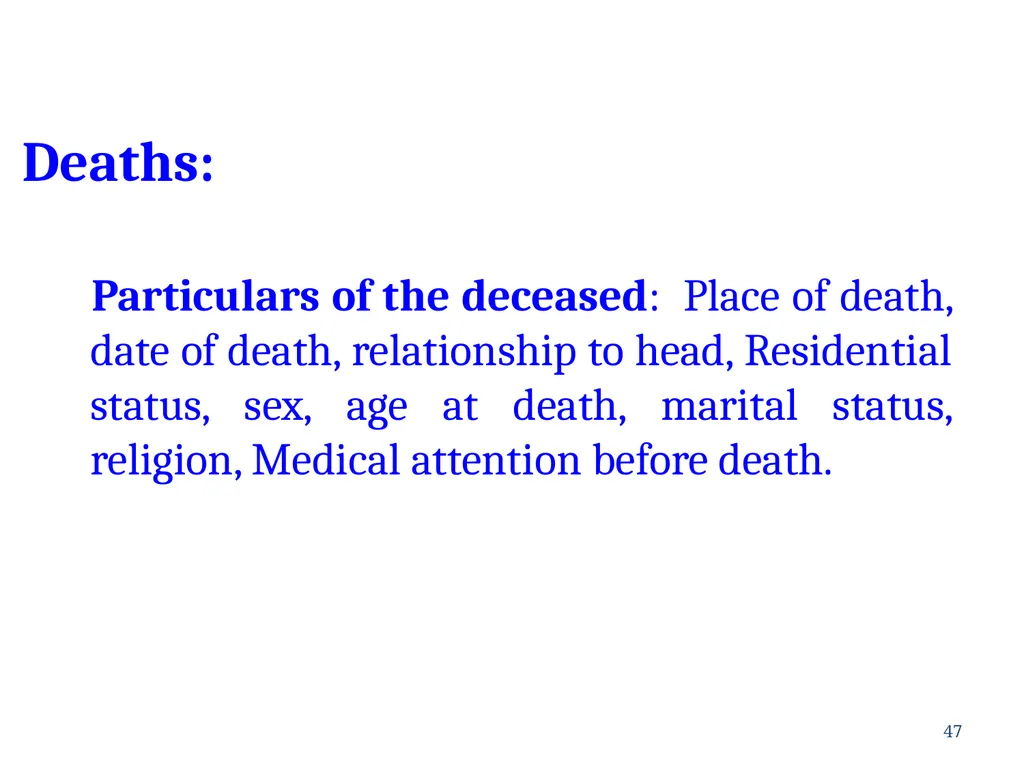
Deaths:
Particulars of the deceased: Place of death, date of death, relationship to head, Residential status, sex, age at death, marital status, religion, Medical attention before death. 47<br>
Particulars of the deceased: Place of death, date of death, relationship to head, Residential status, sex, age at death, marital status, religion, Medical attention before death. 47<br>
48
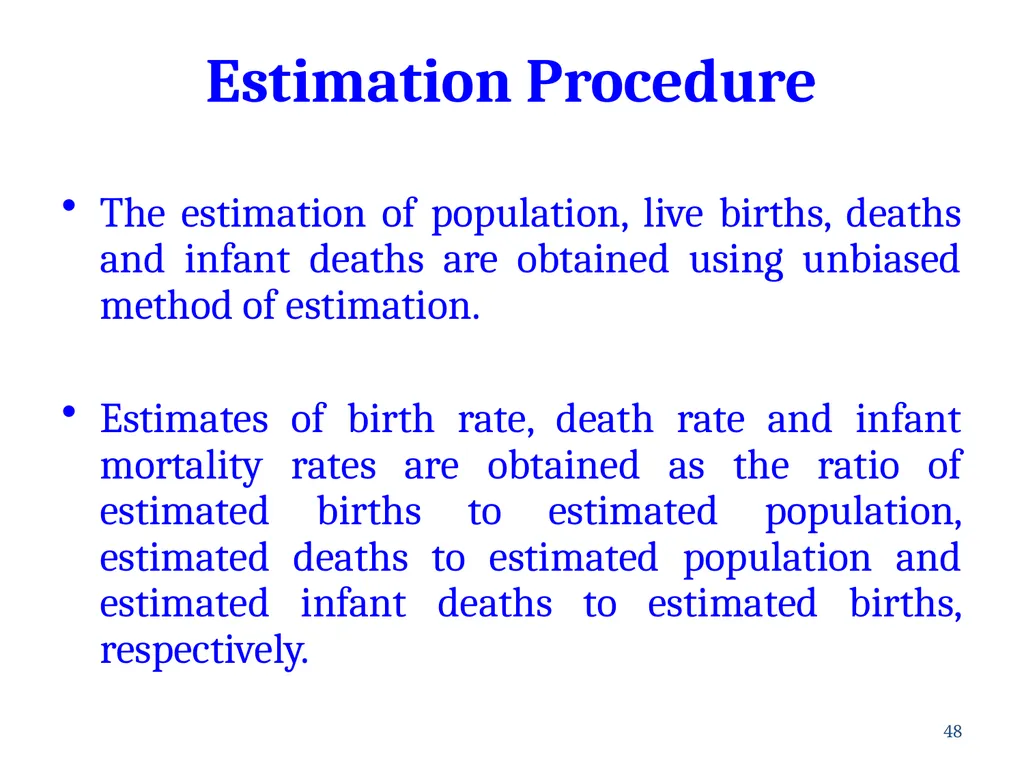
The estimation of population, live births, deaths and infant deaths are obtained using unbiased method of estimation.
Estimates of birth rate, death rate and infant mortality rates are obtained as the ratio of estimated births to estimated population, estimated deaths to estimated population and estimated infant deaths to estimated births, respectively. 48 Estimation Procedure<br>
Estimates of birth rate, death rate and infant mortality rates are obtained as the ratio of estimated births to estimated population, estimated deaths to estimated population and estimated infant deaths to estimated births, respectively. 48 Estimation Procedure<br>
49
SRS-Bulletin : Annual publication giving annual vital rates at all- India and State/Ut levels.
SRS Statistical Report: detailed the tables giving fertility and mortality indicators are published in this annual publication. 49 Publications<br>
SRS Statistical Report: detailed the tables giving fertility and mortality indicators are published in this annual publication. 49 Publications<br>
50
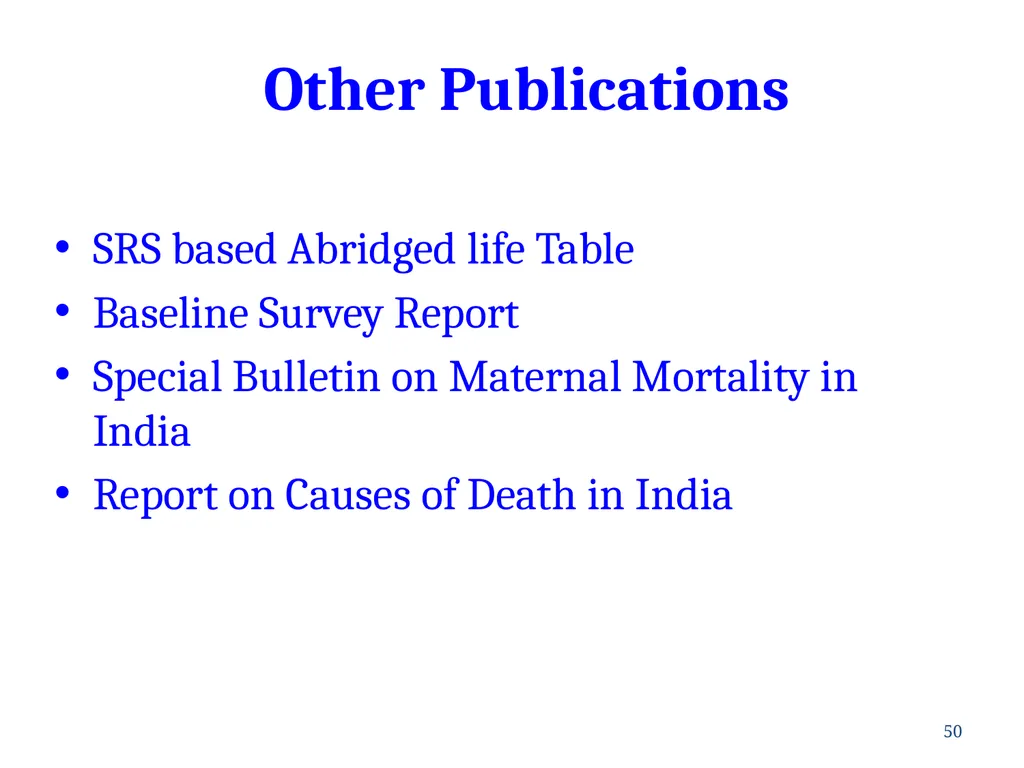
SRS based Abridged life Table
Baseline Survey Report
Special Bulletin on Maternal Mortality in India
Report on Causes of Death in India 50 Other Publications<br>
Baseline Survey Report
Special Bulletin on Maternal Mortality in India
Report on Causes of Death in India 50 Other Publications<br>
51
Of the 8 MDGs, IMR, U5MR and MMR are generated by SRS. MILLENNIUM DEVELOPMENT GOALS(MDG)<br>
52
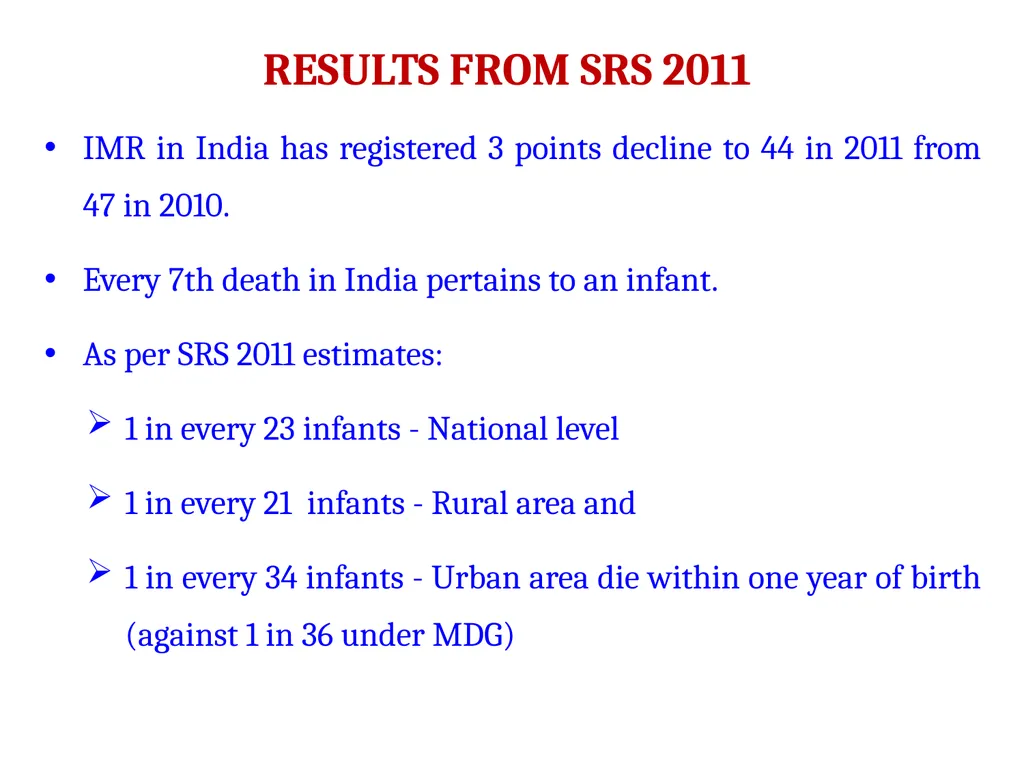
IMR in India has registered 3 points decline to 44 in 2011 from 47 in 2010.
Every 7th death in India pertains to an infant.
As per SRS 2011 estimates:
1 in every 23 infants - National level
1 in every 21 infants - Rural area and
1 in every 34 infants - Urban area die within one year of birth (against 1 in 36 under MDG) RESULTS FROM SRS 2011<br>
Every 7th death in India pertains to an infant.
As per SRS 2011 estimates:
1 in every 23 infants - National level
1 in every 21 infants - Rural area and
1 in every 34 infants - Urban area die within one year of birth (against 1 in 36 under MDG) RESULTS FROM SRS 2011<br>
53
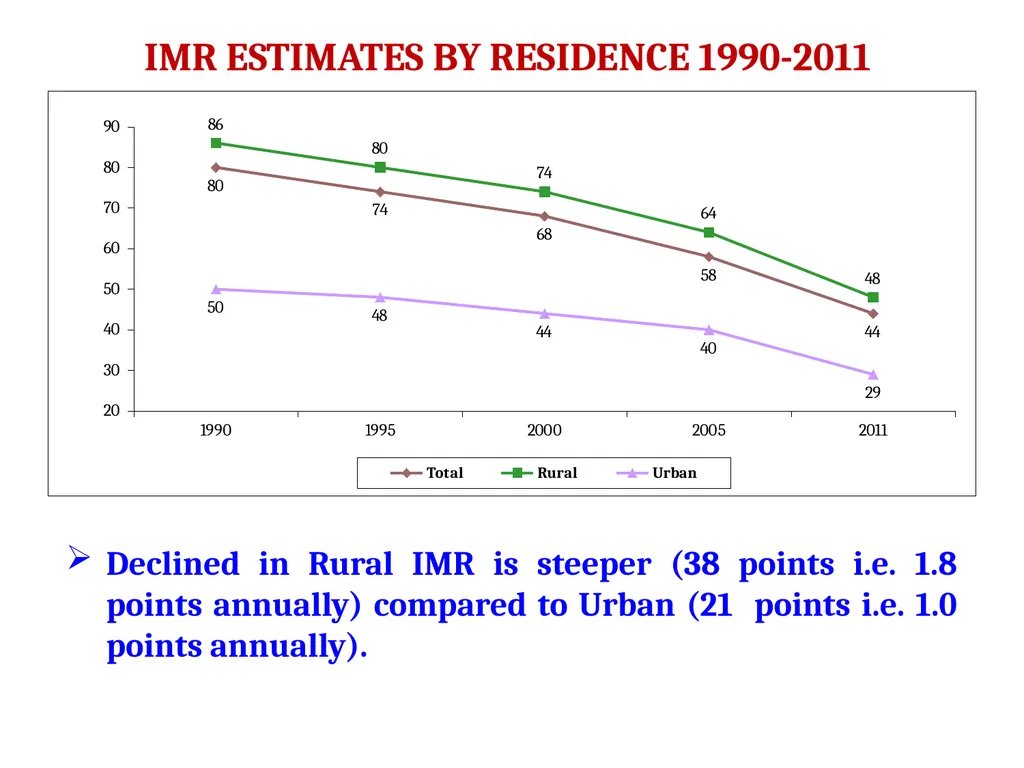
Declined in Rural IMR is steeper (38 points i.e. 1.8 points annually) compared to Urban (21 points i.e. 1.0 points annually). IMR ESTIMATES BY RESIDENCE 1990-2011<br>
54
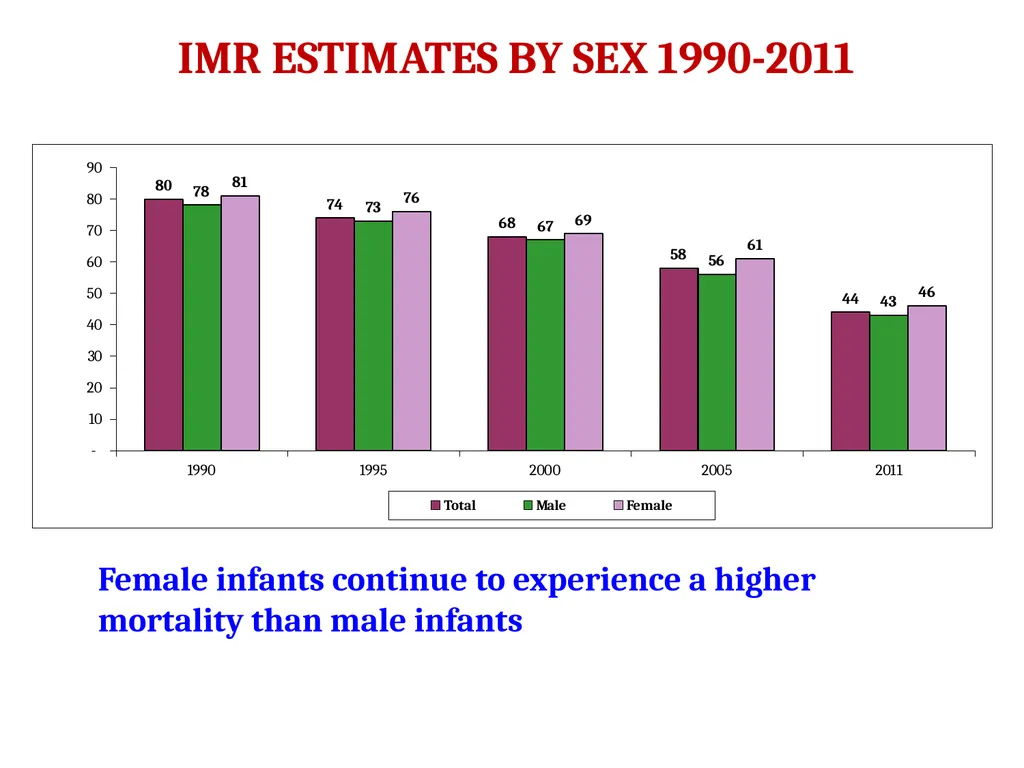
IMR ESTIMATES BY SEX 1990-2011 Female infants continue to experience a higher mortality than male infants<br>
55
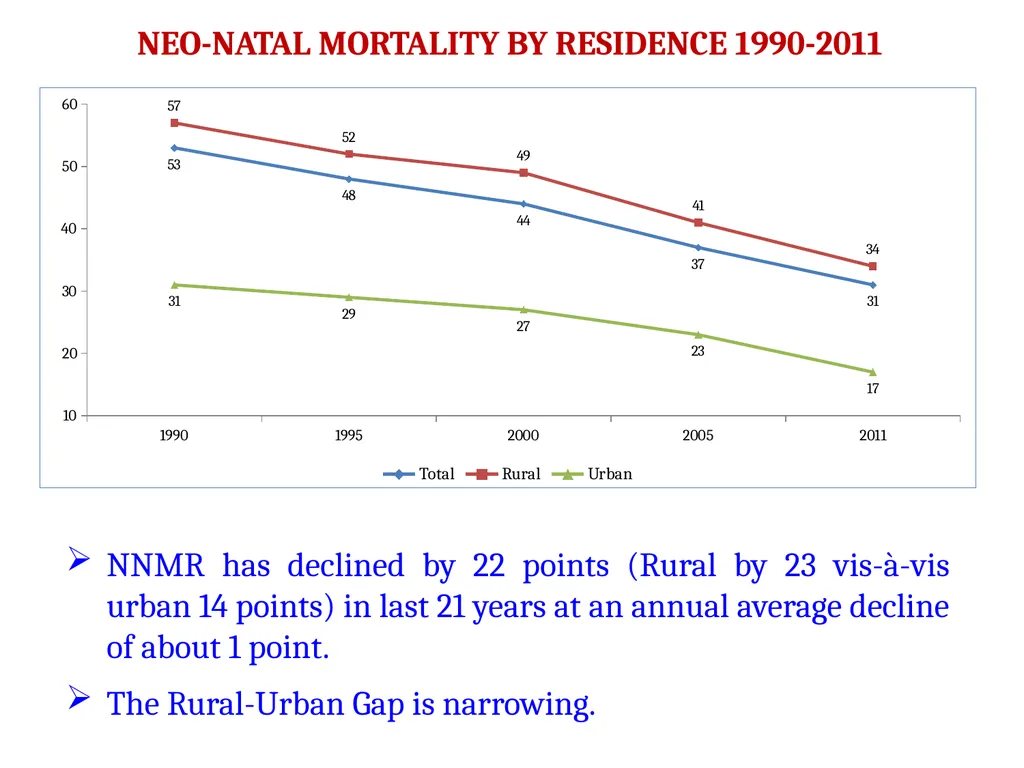
NNMR has declined by 22 points (Rural by 23 vis-à-vis urban 14 points) in last 21 years at an annual average decline of about 1 point.
The Rural-Urban Gap is narrowing. NEO-NATAL MORTALITY BY RESIDENCE 1990-2011<br>
The Rural-Urban Gap is narrowing. NEO-NATAL MORTALITY BY RESIDENCE 1990-2011<br>
56
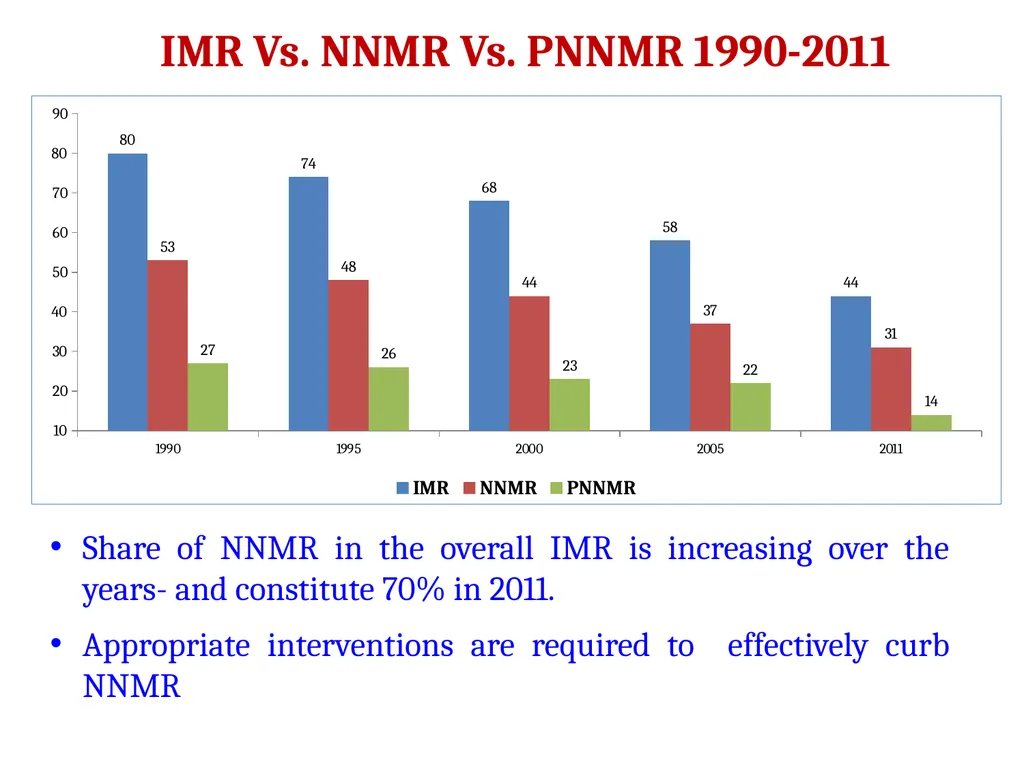
IMR Vs. NNMR Vs. PNNMR 1990-2011 Share of NNMR in the overall IMR is increasing over the years- and constitute 70% in 2011.
Appropriate interventions are required to effectively curb NNMR<br>
Appropriate interventions are required to effectively curb NNMR<br>
57
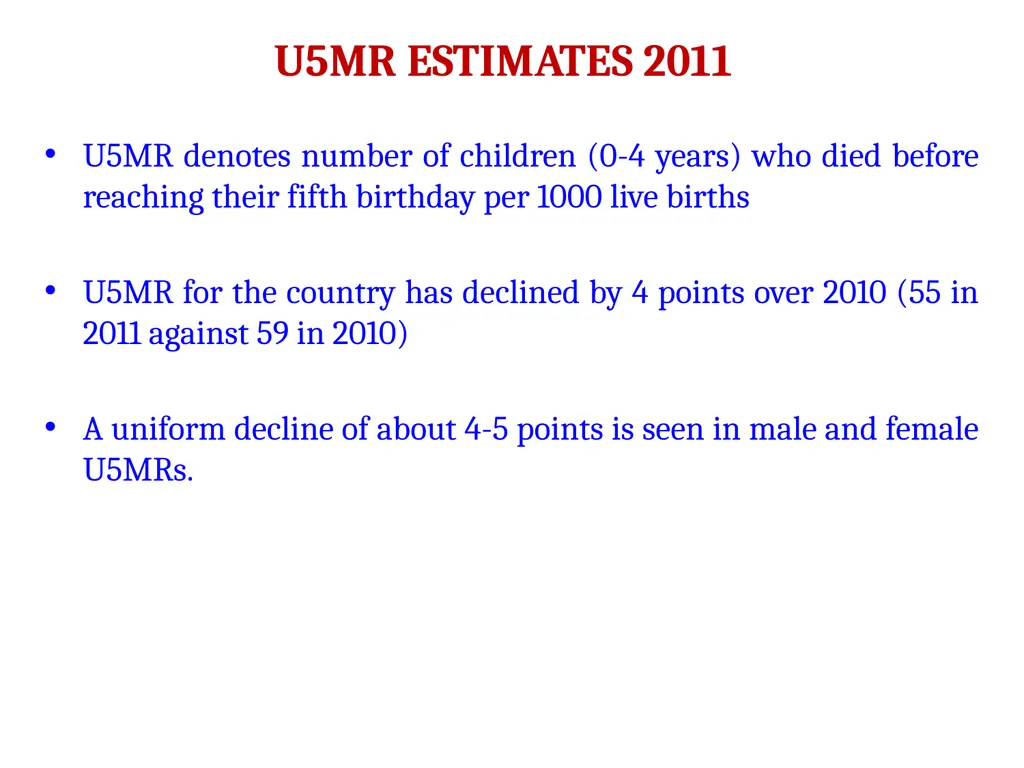
U5MR denotes number of children (0-4 years) who died before reaching their fifth birthday per 1000 live births
U5MR for the country has declined by 4 points over 2010 (55 in 2011 against 59 in 2010)
A uniform decline of about 4-5 points is seen in male and female U5MRs. U5MR ESTIMATES 2011<br>
U5MR for the country has declined by 4 points over 2010 (55 in 2011 against 59 in 2010)
A uniform decline of about 4-5 points is seen in male and female U5MRs. U5MR ESTIMATES 2011<br>
58
U5MR for the country declined by 63 points (rural by 67 points vis-à-vis urban 36 points) in the last 21 years at an annual average decline of about 3 points.
Urban areas have achieved MDG target (42) but rural is still far off. U5MR BY RESIDENCE : 1990-2011<br>
Urban areas have achieved MDG target (42) but rural is still far off. U5MR BY RESIDENCE : 1990-2011<br>
59
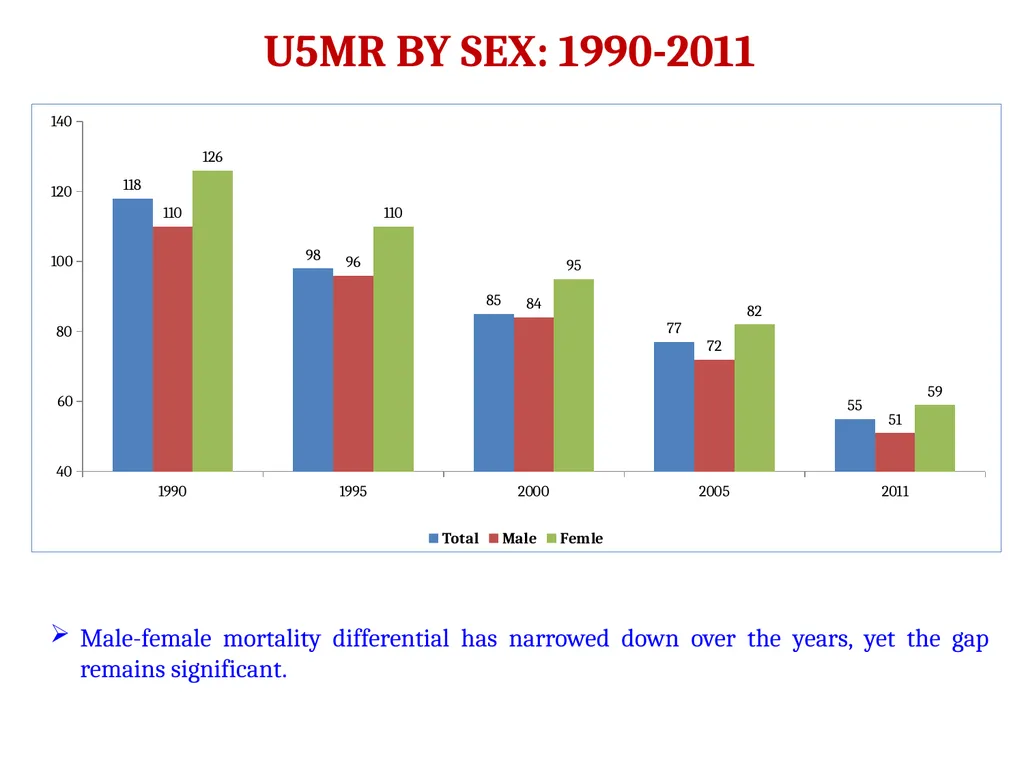
Male-female mortality differential has narrowed down over the years, yet the gap remains significant. U5MR BY SEX: 1990-2011<br>
60
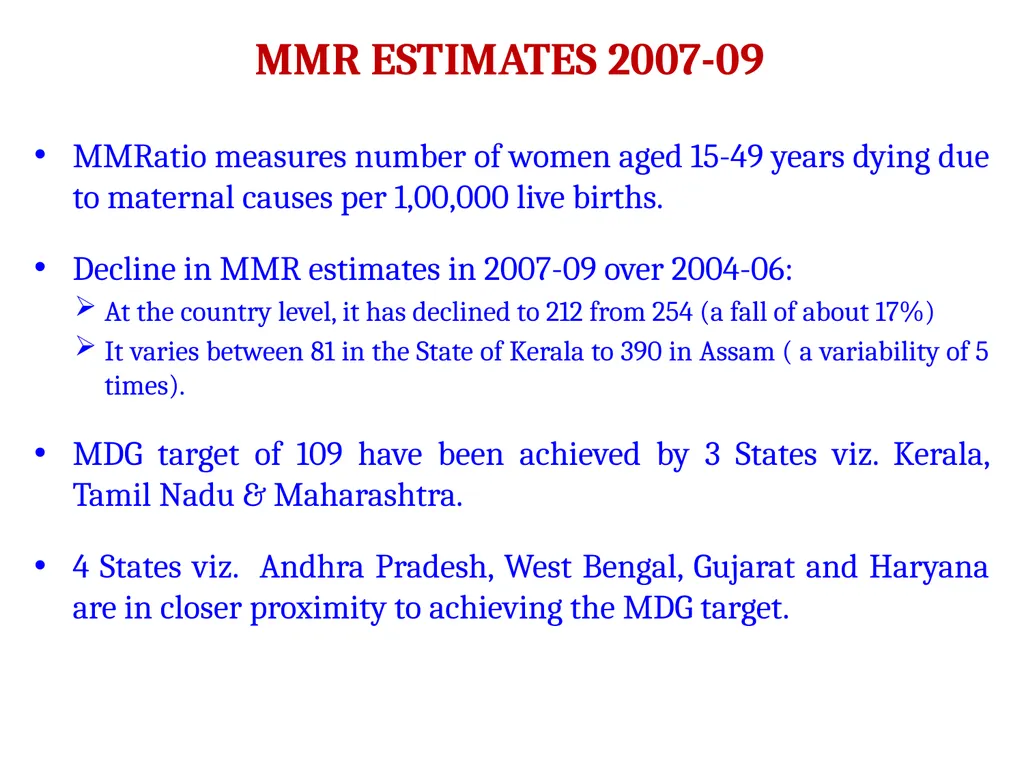
MMRatio measures number of women aged 15-49 years dying due to maternal causes per 1,00,000 live births.
Decline in MMR estimates in 2007-09 over 2004-06:
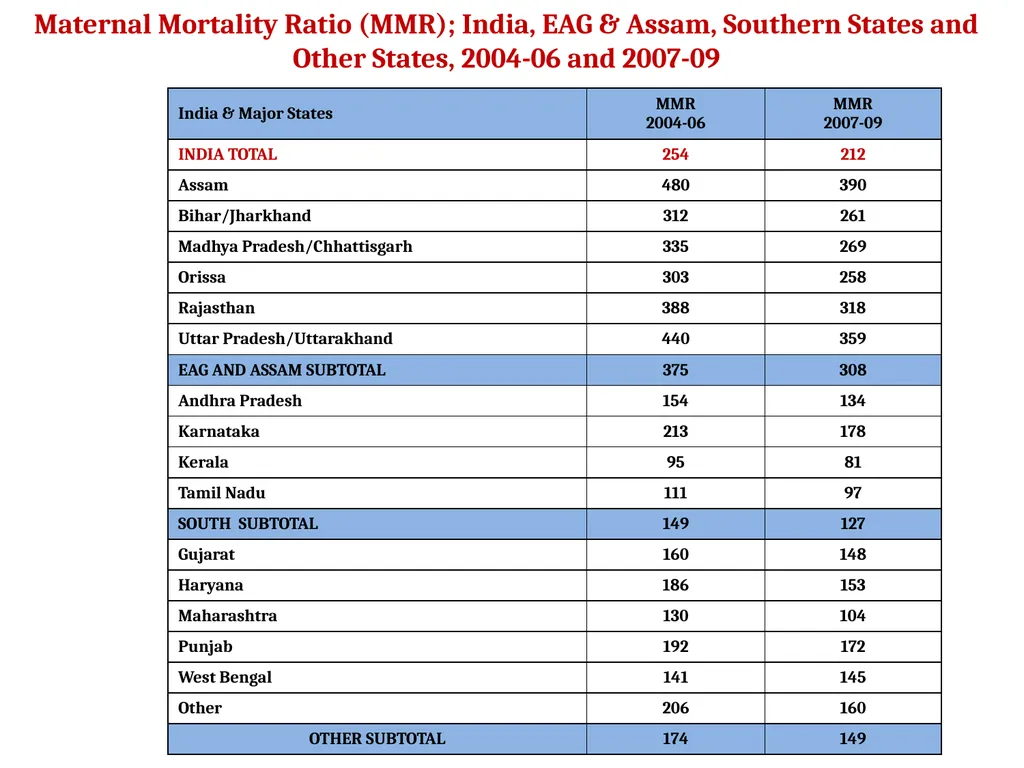
At the country level, it has declined to 212 from 254 (a fall of about 17%)
It varies between 81 in the State of Kerala to 390 in Assam ( a variability of 5 times).
MDG target of 109 have been achieved by 3 States viz. Kerala, Tamil Nadu & Maharashtra.
4 States viz. Andhra Pradesh, West Bengal, Gujarat and Haryana are in closer proximity to achieving the MDG target. MMR ESTIMATES 2007-09<br>
Decline in MMR estimates in 2007-09 over 2004-06:
At the country level, it has declined to 212 from 254 (a fall of about 17%)
It varies between 81 in the State of Kerala to 390 in Assam ( a variability of 5 times).
MDG target of 109 have been achieved by 3 States viz. Kerala, Tamil Nadu & Maharashtra.
4 States viz. Andhra Pradesh, West Bengal, Gujarat and Haryana are in closer proximity to achieving the MDG target. MMR ESTIMATES 2007-09<br>
61
Maternal Mortality Ratio (MMR); India, EAG & Assam, Southern States and Other States, 2004-06 and 2007-09<br>
62
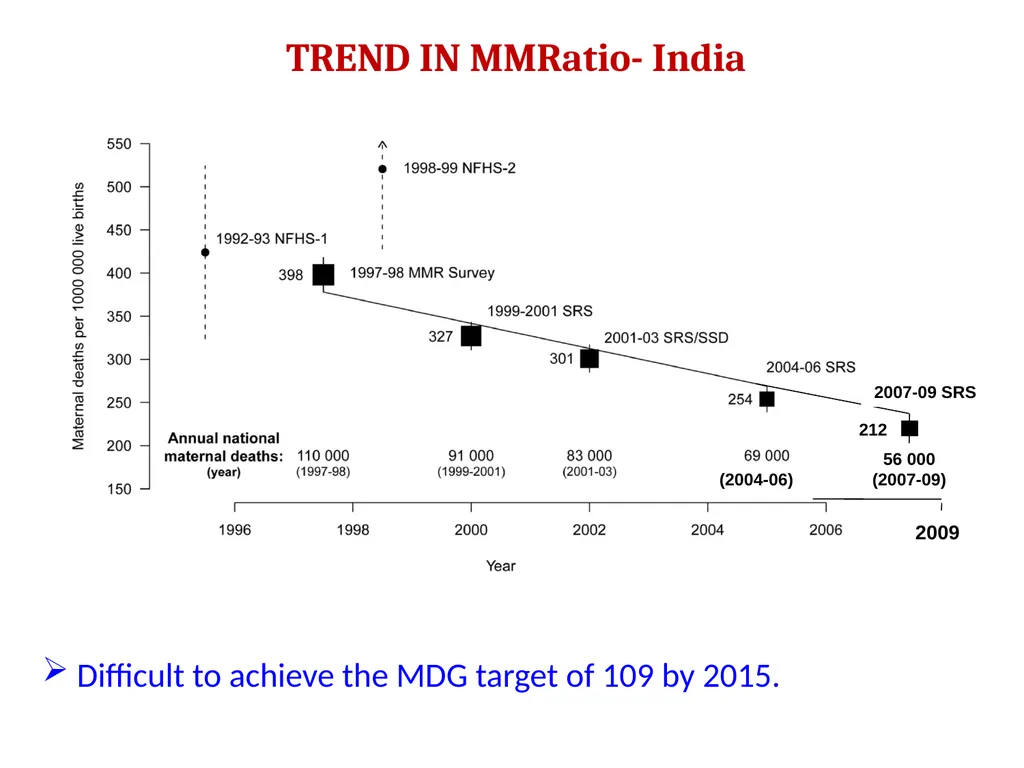
TREND IN MMRatio- India Difficult to achieve the MDG target of 109 by 2015.<br>
63
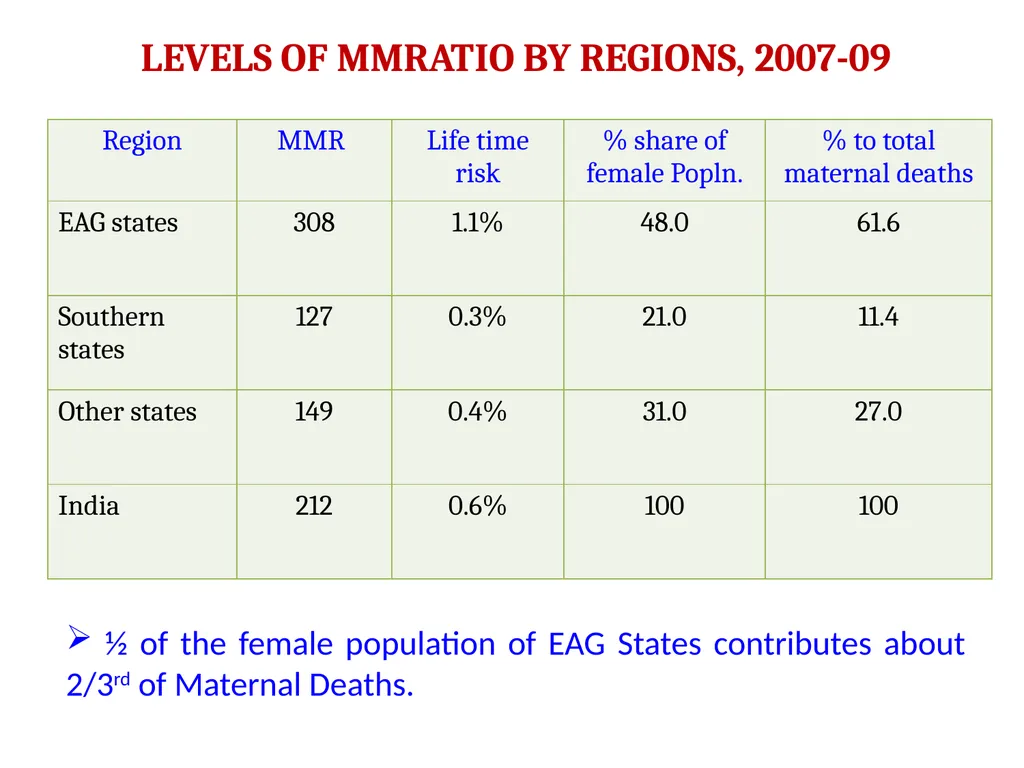
LEVELS OF MMRATIO BY REGIONS, 2007-09 ½ of the female population of EAG States contributes about 2/3rd of Maternal Deaths.<br>
64
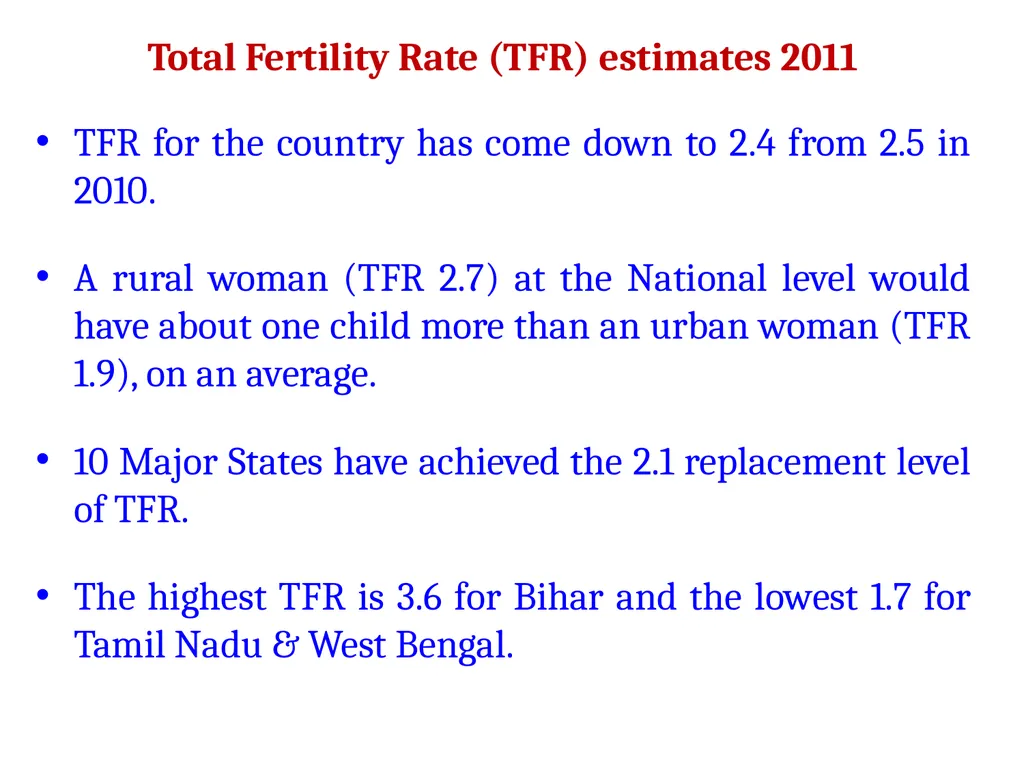
TFR for the country has come down to 2.4 from 2.5 in 2010.
A rural woman (TFR 2.7) at the National level would have about one child more than an urban woman (TFR 1.9), on an average.
10 Major States have achieved the 2.1 replacement level of TFR.
The highest TFR is 3.6 for Bihar and the lowest 1.7 for Tamil Nadu & West Bengal. Total Fertility Rate (TFR) estimates 2011<br>
A rural woman (TFR 2.7) at the National level would have about one child more than an urban woman (TFR 1.9), on an average.
10 Major States have achieved the 2.1 replacement level of TFR.
The highest TFR is 3.6 for Bihar and the lowest 1.7 for Tamil Nadu & West Bengal. Total Fertility Rate (TFR) estimates 2011<br>
65
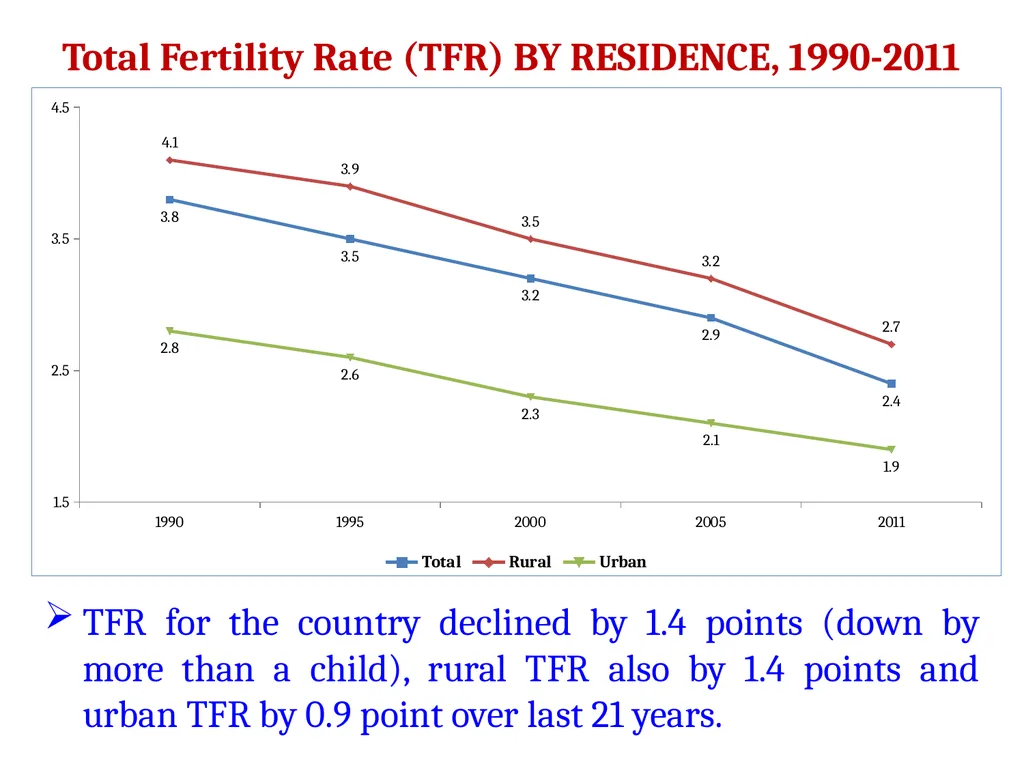
Total Fertility Rate (TFR) BY RESIDENCE, 1990-2011 TFR for the country declined by 1.4 points (down by more than a child), rural TFR also by 1.4 points and urban TFR by 0.9 point over last 21 years.<br>
66
Thank You<br>