
Thermochromic Variable Emissivity Material Thermal
SB
Published · 22 slides · 0 views
1 / 1


Description
Thermochromic Variable Emissivity Material Thermal Modeling and Test Correlation Session No. Thermal Control Protection 12 Paper No. TCP XII - 01 Authors Redwire: Dr. Derek Hengeveld (presenter) AFRL: Isaac J. Foster, Trevor J. Bird,
Related Topics
Share
Embed code
Download this presentation From Below
"Thermochromic Variable Emissivity Material Thermal" is the property of its rightful owner. Permission is granted to download and print the materials on this website for personal, non-commercial use only, and to display it on your personal computer provided you do not modify the materials and that you retain all copyright notices contained in the materials. By downloading content from our website, you accept the terms of this agreement.
Presentation Transcript
01
Thermochromic Variable Emissivity Material Thermal Modeling and Test Correlation
Session No. Thermal Control & Protection 12 / Paper No. TC&P XII - 01 Authors
Redwire: Dr. Derek Hengeveld (presenter)
AFRL: Isaac J. Foster, Trevor J. Bird, Daniel Lockwood, and Jonathan Allison<br>
Redwire: Dr. Derek Hengeveld (presenter)
AFRL: Isaac J. Foster, Trevor J. Bird, Daniel Lockwood, and Jonathan Allison<br>
02
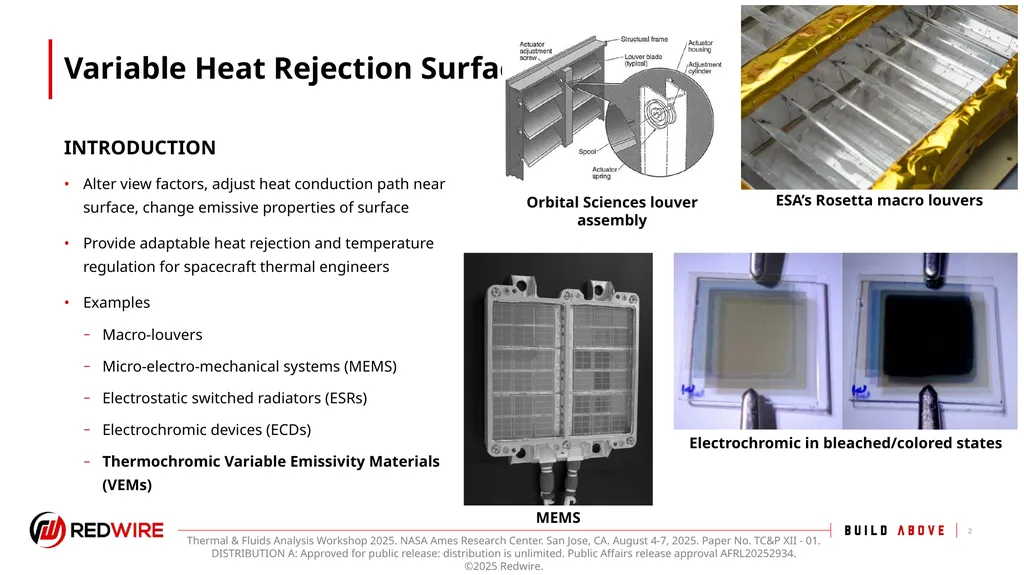
Variable Heat Rejection Surfaces Alter view factors, adjust heat conduction path near surface, change emissive properties of surface
Provide adaptable heat rejection and temperature regulation for spacecraft thermal engineers
Examples
Macro-louvers
Micro-electro-mechanical systems (MEMS)
Electrostatic switched radiators (ESRs)
Electrochromic devices (ECDs)
Thermochromic Variable Emissivity Materials (VEMs) INTRODUCTION 2 ESA’s Rosetta macro louvers Orbital Sciences louver assembly Electrochromic in bleached/colored states MEMS<br>
Provide adaptable heat rejection and temperature regulation for spacecraft thermal engineers
Examples
Macro-louvers
Micro-electro-mechanical systems (MEMS)
Electrostatic switched radiators (ESRs)
Electrochromic devices (ECDs)
Thermochromic Variable Emissivity Materials (VEMs) INTRODUCTION 2 ESA’s Rosetta macro louvers Orbital Sciences louver assembly Electrochromic in bleached/colored states MEMS<br>
03
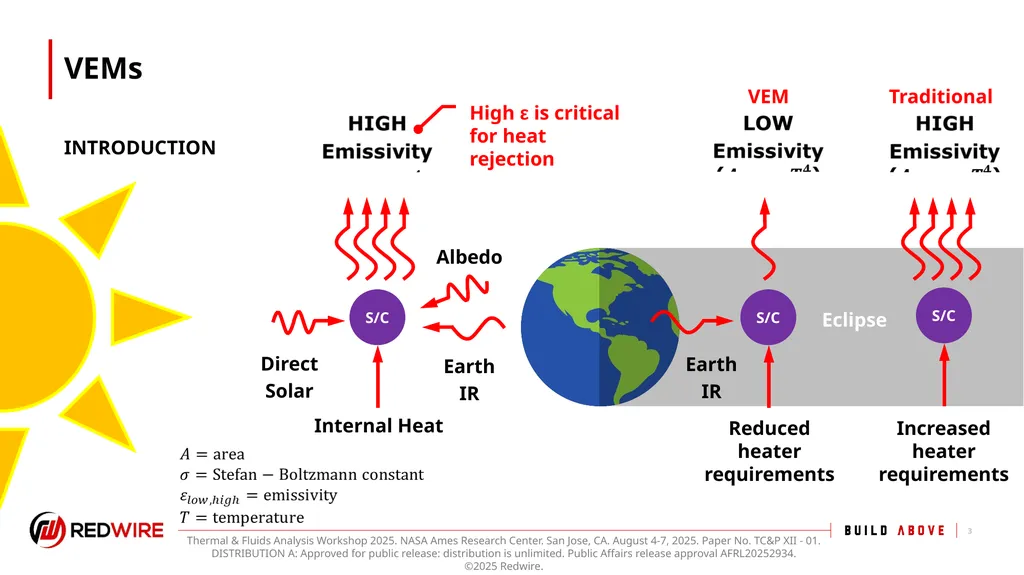
VEMs INTRODUCTION 3 Direct
Solar Earth
IR Albedo Eclipse Internal Heat Reduced heater requirements S/C S/C Earth
IR Increased heater requirements S/C VEM Traditional High ε is critical for heat rejection<br>
Solar Earth
IR Albedo Eclipse Internal Heat Reduced heater requirements S/C S/C Earth
IR Increased heater requirements S/C VEM Traditional High ε is critical for heat rejection<br>
04
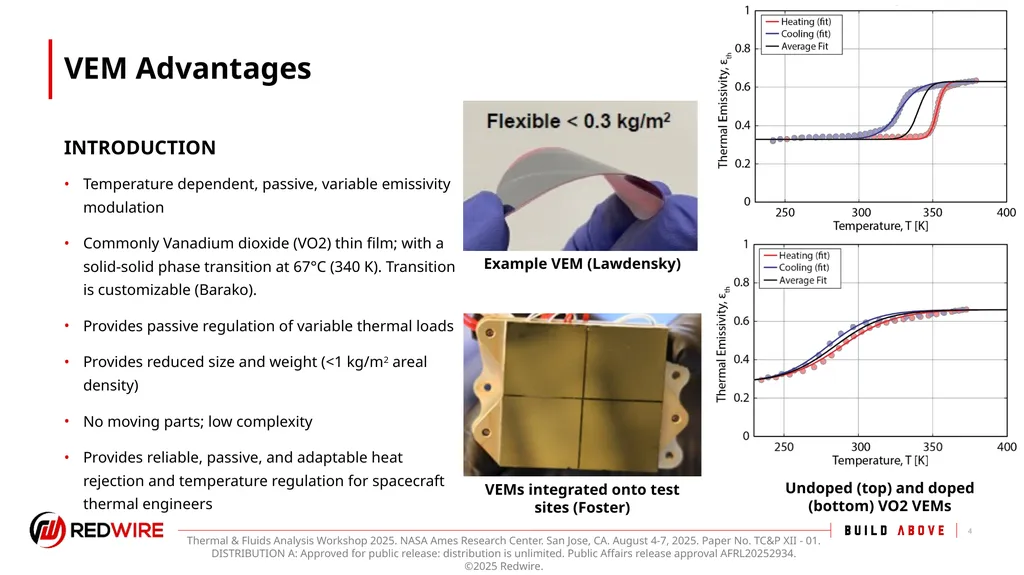
VEM Advantages Temperature dependent, passive, variable emissivity modulation
Commonly Vanadium dioxide (VO2) thin film; with a solid-solid phase transition at 67°C (340 K). Transition is customizable (Barako).
Provides passive regulation of variable thermal loads
Provides reduced size and weight (<1 kg/m2 areal density)
No moving parts; low complexity
Provides reliable, passive, and adaptable heat rejection and temperature regulation for spacecraft thermal engineers INTRODUCTION 4 Undoped (top) and doped (bottom) VO2 VEMs Example VEM (Lawdensky) VEMs integrated onto test sites (Foster)<br>
Commonly Vanadium dioxide (VO2) thin film; with a solid-solid phase transition at 67°C (340 K). Transition is customizable (Barako).
Provides passive regulation of variable thermal loads
Provides reduced size and weight (<1 kg/m2 areal density)
No moving parts; low complexity
Provides reliable, passive, and adaptable heat rejection and temperature regulation for spacecraft thermal engineers INTRODUCTION 4 Undoped (top) and doped (bottom) VO2 VEMs Example VEM (Lawdensky) VEMs integrated onto test sites (Foster)<br>
05
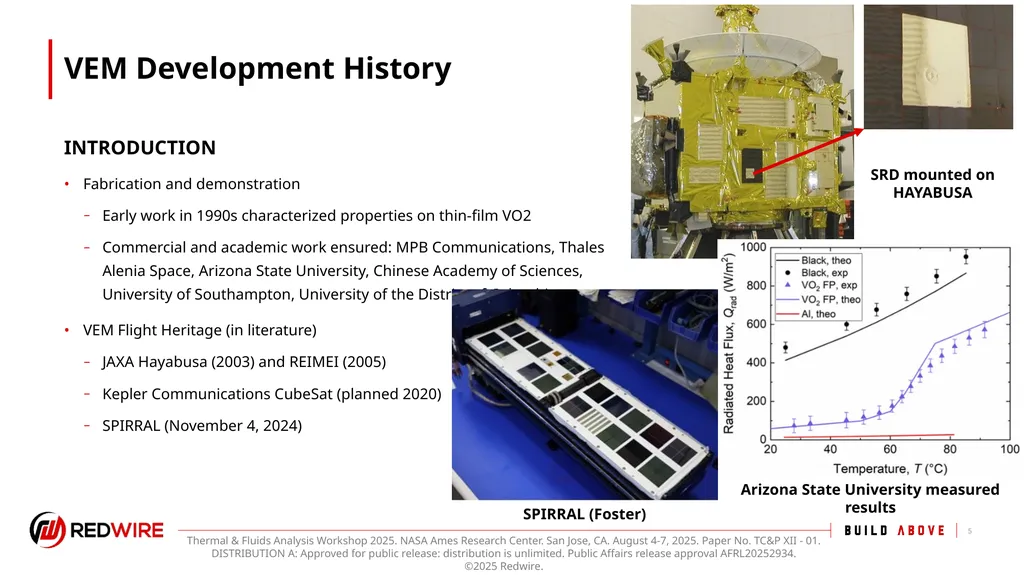
VEM Development History Fabrication and demonstration
Early work in 1990s characterized properties on thin-film VO2
Commercial and academic work ensured: MPB Communications, Thales Alenia Space, Arizona State University, Chinese Academy of Sciences, University of Southampton, University of the District of Columbia
VEM Flight Heritage (in literature)
JAXA Hayabusa (2003) and REIMEI (2005)
Kepler Communications CubeSat (planned 2020)
SPIRRAL (November 4, 2024) INTRODUCTION 5 SRD mounted on HAYABUSA Arizona State University measured results SPIRRAL (Foster)<br>
Early work in 1990s characterized properties on thin-film VO2
Commercial and academic work ensured: MPB Communications, Thales Alenia Space, Arizona State University, Chinese Academy of Sciences, University of Southampton, University of the District of Columbia
VEM Flight Heritage (in literature)
JAXA Hayabusa (2003) and REIMEI (2005)
Kepler Communications CubeSat (planned 2020)
SPIRRAL (November 4, 2024) INTRODUCTION 5 SRD mounted on HAYABUSA Arizona State University measured results SPIRRAL (Foster)<br>
06
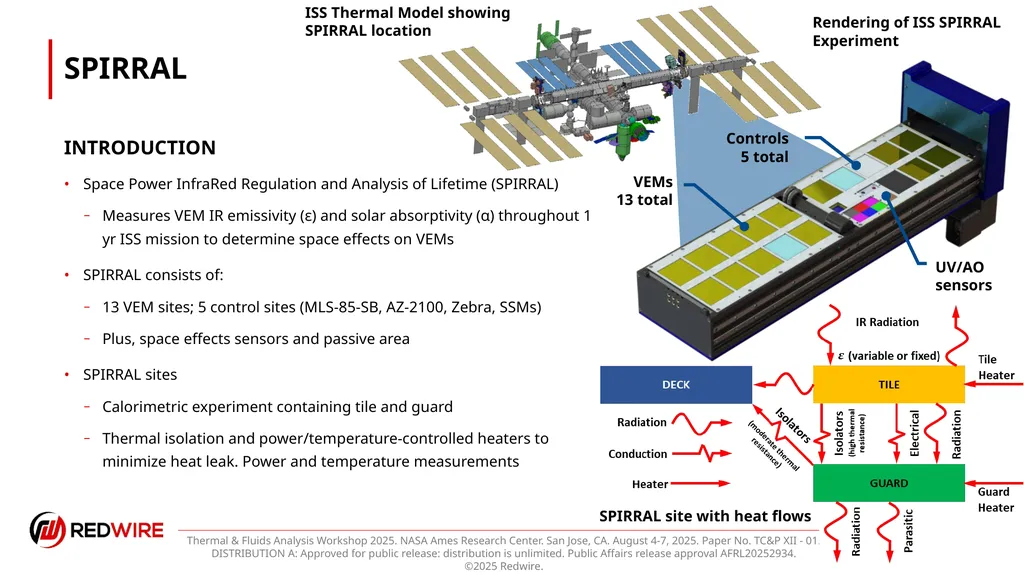
SPIRRAL Space Power InfraRed Regulation and Analysis of Lifetime (SPIRRAL)
Measures VEM IR emissivity (ε) and solar absorptivity (α) throughout 1 yr ISS mission to determine space effects on VEMs
SPIRRAL consists of:
13 VEM sites; 5 control sites (MLS-85-SB, AZ-2100, Zebra, SSMs)
Plus, space effects sensors and passive area
SPIRRAL sites
Calorimetric experiment containing tile and guard
Thermal isolation and power/temperature-controlled heaters to minimize heat leak. Power and temperature measurements INTRODUCTION 6 VEMs
13 total UV/AO
sensors Controls 5 total ISS Thermal Model showing SPIRRAL location Rendering of ISS SPIRRAL Experiment Edit SPIRRAL site with heat flows<br>
Measures VEM IR emissivity (ε) and solar absorptivity (α) throughout 1 yr ISS mission to determine space effects on VEMs
SPIRRAL consists of:
13 VEM sites; 5 control sites (MLS-85-SB, AZ-2100, Zebra, SSMs)
Plus, space effects sensors and passive area
SPIRRAL sites
Calorimetric experiment containing tile and guard
Thermal isolation and power/temperature-controlled heaters to minimize heat leak. Power and temperature measurements INTRODUCTION 6 VEMs
13 total UV/AO
sensors Controls 5 total ISS Thermal Model showing SPIRRAL location Rendering of ISS SPIRRAL Experiment Edit SPIRRAL site with heat flows<br>
07
VEM Modeling 7<br>
08
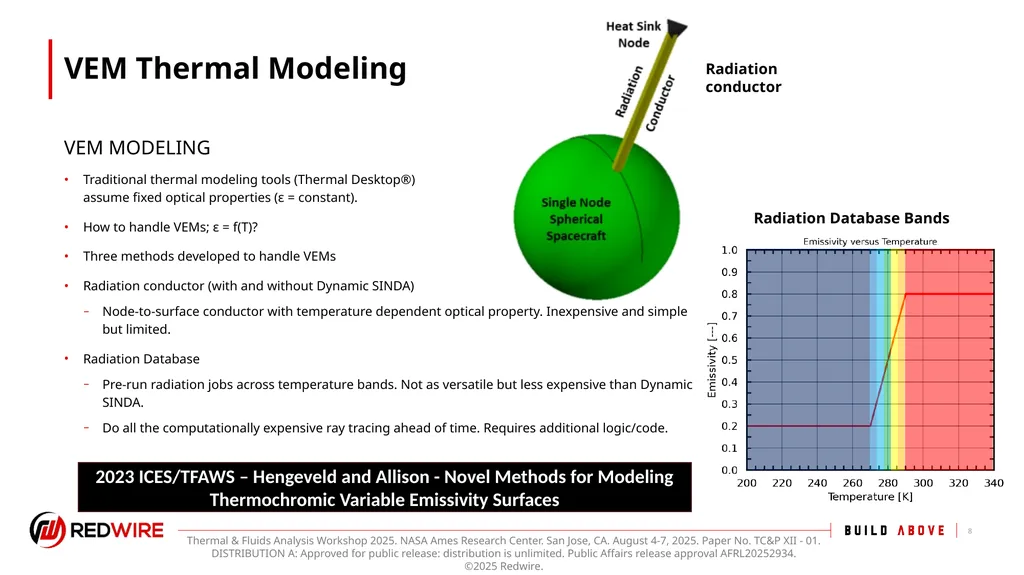
VEM Thermal Modeling Traditional thermal modeling tools (Thermal Desktop®)
assume fixed optical properties (ε = constant).
How to handle VEMs; ε = f(T)?
Three methods developed to handle VEMs
Radiation conductor (with and without Dynamic SINDA)
Node-to-surface conductor with temperature dependent optical property. Inexpensive and simple but limited.
Radiation Database
Pre-run radiation jobs across temperature bands. Not as versatile but less expensive than Dynamic SINDA.
Do all the computationally expensive ray tracing ahead of time. Requires additional logic/code. VEM MODELING 8 Radiation conductor Radiation Database Bands 2023 ICES/TFAWS – Hengeveld and Allison - Novel Methods for Modeling Thermochromic Variable Emissivity Surfaces<br>
How to handle VEMs; ε = f(T)?
Three methods developed to handle VEMs
Radiation conductor (with and without Dynamic SINDA)
Node-to-surface conductor with temperature dependent optical property. Inexpensive and simple but limited.
Radiation Database
Pre-run radiation jobs across temperature bands. Not as versatile but less expensive than Dynamic SINDA.
Do all the computationally expensive ray tracing ahead of time. Requires additional logic/code. VEM MODELING 8 Radiation conductor Radiation Database Bands 2023 ICES/TFAWS – Hengeveld and Allison - Novel Methods for Modeling Thermochromic Variable Emissivity Surfaces<br>
09
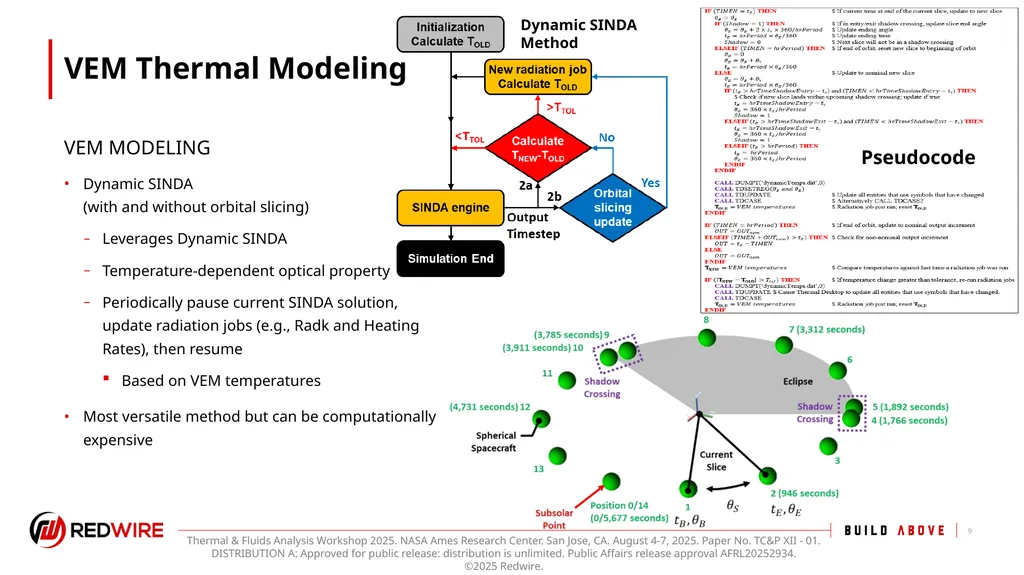
VEM Thermal Modeling Dynamic SINDA
(with and without orbital slicing)
Leverages Dynamic SINDA
Temperature-dependent optical property
Periodically pause current SINDA solution, update radiation jobs (e.g., Radk and Heating Rates), then resume
Based on VEM temperatures
Most versatile method but can be computationally expensive VEM MODELING 9 Dynamic SINDA
Method Pseudocode<br>
Leverages Dynamic SINDA
Temperature-dependent optical property
Periodically pause current SINDA solution, update radiation jobs (e.g., Radk and Heating Rates), then resume
Based on VEM temperatures
Most versatile method but can be computationally expensive VEM MODELING 9 Dynamic SINDA
Method Pseudocode<br>
10
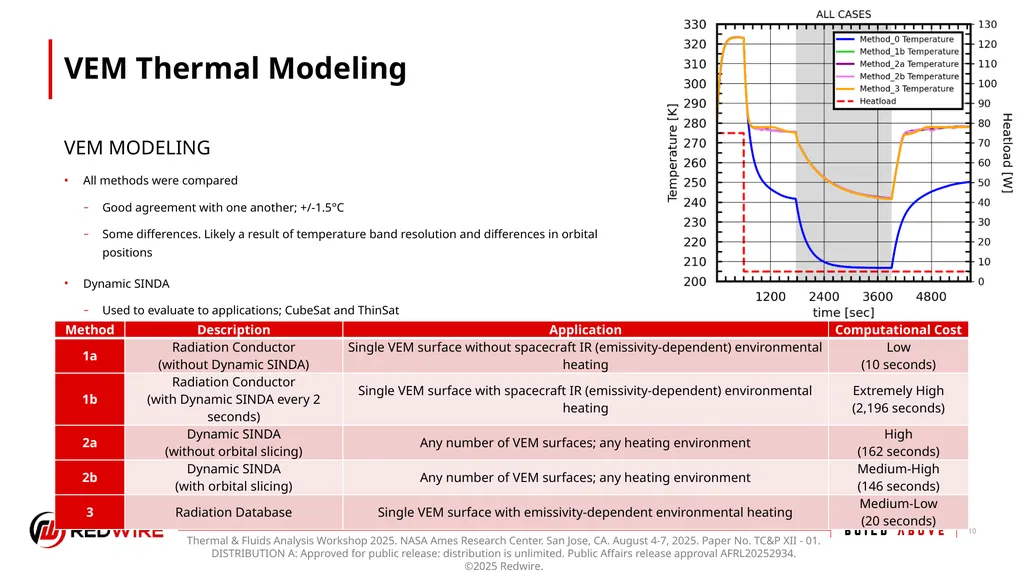
VEM Thermal Modeling All methods were compared
Good agreement with one another; +/-1.5°C
Some differences. Likely a result of temperature band resolution and differences in orbital positions
Dynamic SINDA
Used to evaluate to applications; CubeSat and ThinSat VEM MODELING 10<br>
Good agreement with one another; +/-1.5°C
Some differences. Likely a result of temperature band resolution and differences in orbital positions
Dynamic SINDA
Used to evaluate to applications; CubeSat and ThinSat VEM MODELING 10<br>
11
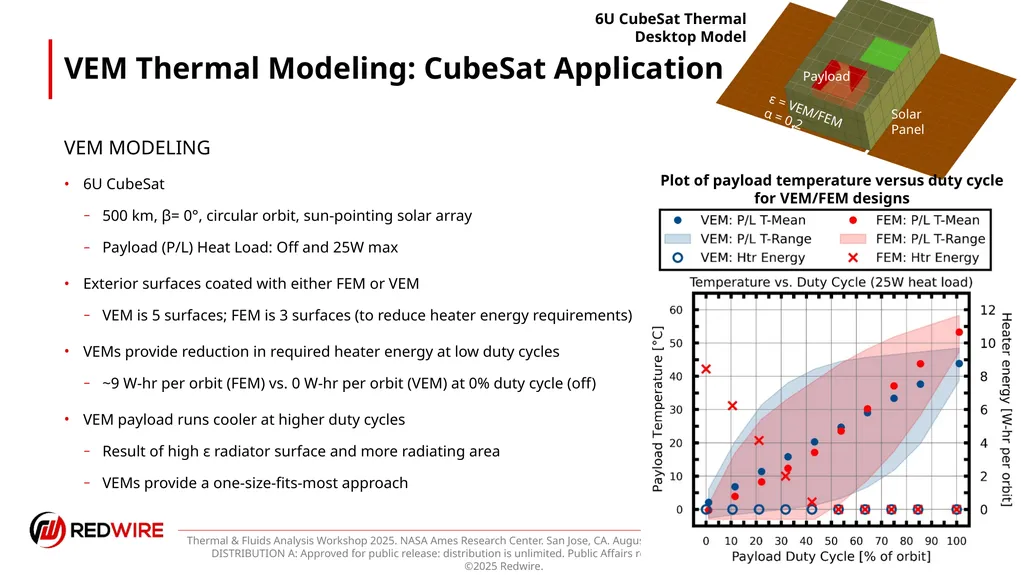
VEM Thermal Modeling: CubeSat Application 6U CubeSat
500 km, β= 0°, circular orbit, sun-pointing solar array
Payload (P/L) Heat Load: Off and 25W max
Exterior surfaces coated with either FEM or VEM
VEM is 5 surfaces; FEM is 3 surfaces (to reduce heater energy requirements)
VEMs provide reduction in required heater energy at low duty cycles
~9 W-hr per orbit (FEM) vs. 0 W-hr per orbit (VEM) at 0% duty cycle (off)
VEM payload runs cooler at higher duty cycles
Result of high ε radiator surface and more radiating area
VEMs provide a one-size-fits-most approach VEM MODELING 11 6U CubeSat Thermal
Desktop Model Plot of payload temperature versus duty cycle for VEM/FEM designs<br>
500 km, β= 0°, circular orbit, sun-pointing solar array
Payload (P/L) Heat Load: Off and 25W max
Exterior surfaces coated with either FEM or VEM
VEM is 5 surfaces; FEM is 3 surfaces (to reduce heater energy requirements)
VEMs provide reduction in required heater energy at low duty cycles
~9 W-hr per orbit (FEM) vs. 0 W-hr per orbit (VEM) at 0% duty cycle (off)
VEM payload runs cooler at higher duty cycles
Result of high ε radiator surface and more radiating area
VEMs provide a one-size-fits-most approach VEM MODELING 11 6U CubeSat Thermal
Desktop Model Plot of payload temperature versus duty cycle for VEM/FEM designs<br>
12
SPIRRAL Thermal Model Correlation 12<br>
13
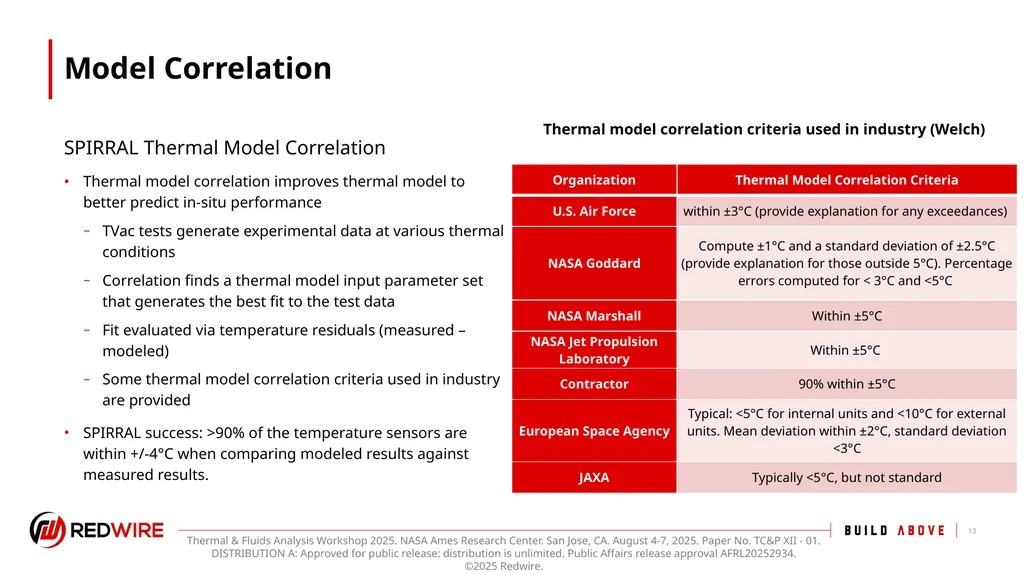
Model Correlation Thermal model correlation improves thermal model to better predict in-situ performance
TVac tests generate experimental data at various thermal conditions
Correlation finds a thermal model input parameter set that generates the best fit to the test data
Fit evaluated via temperature residuals (measured – modeled)
Some thermal model correlation criteria used in industry are provided
SPIRRAL success: >90% of the temperature sensors are within +/-4°C when comparing modeled results against measured results. SPIRRAL Thermal Model Correlation 13 Thermal model correlation criteria used in industry (Welch)<br>
TVac tests generate experimental data at various thermal conditions
Correlation finds a thermal model input parameter set that generates the best fit to the test data
Fit evaluated via temperature residuals (measured – modeled)
Some thermal model correlation criteria used in industry are provided
SPIRRAL success: >90% of the temperature sensors are within +/-4°C when comparing modeled results against measured results. SPIRRAL Thermal Model Correlation 13 Thermal model correlation criteria used in industry (Welch)<br>
14
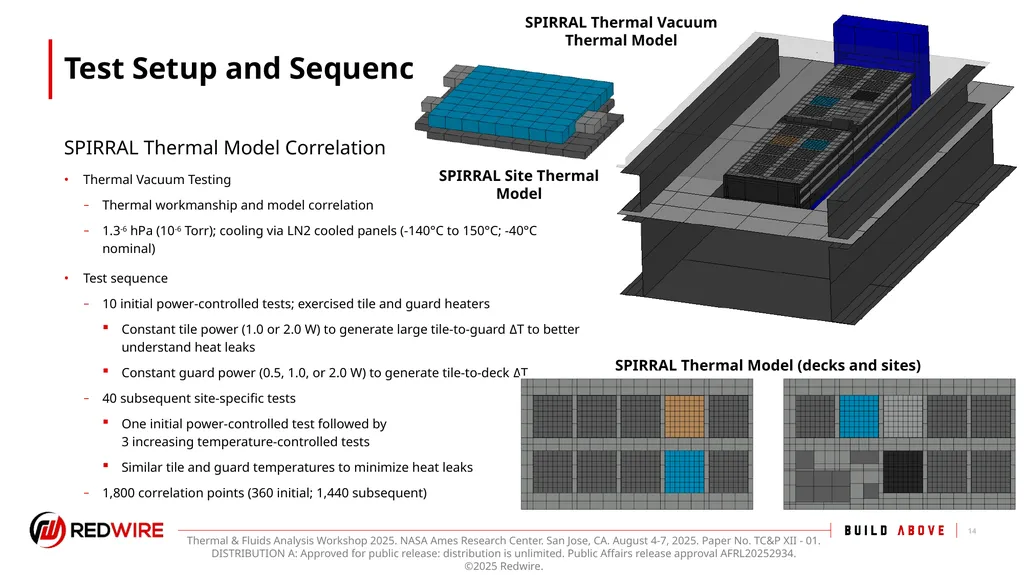
Test Setup and Sequence Thermal Vacuum Testing
Thermal workmanship and model correlation
1.3-6 hPa (10-6 Torr); cooling via LN2 cooled panels (-140°C to 150°C; -40°C nominal)
Test sequence
10 initial power-controlled tests; exercised tile and guard heaters
Constant tile power (1.0 or 2.0 W) to generate large tile-to-guard ΔT to better understand heat leaks
Constant guard power (0.5, 1.0, or 2.0 W) to generate tile-to-deck ΔT
40 subsequent site-specific tests
One initial power-controlled test followed by 3 increasing temperature-controlled tests
Similar tile and guard temperatures to minimize heat leaks
1,800 correlation points (360 initial; 1,440 subsequent) SPIRRAL Thermal Model Correlation 14 SPIRRAL Thermal Vacuum Thermal Model SPIRRAL Thermal Model (decks and sites) SPIRRAL Site Thermal Model<br>
Thermal workmanship and model correlation
1.3-6 hPa (10-6 Torr); cooling via LN2 cooled panels (-140°C to 150°C; -40°C nominal)
Test sequence
10 initial power-controlled tests; exercised tile and guard heaters
Constant tile power (1.0 or 2.0 W) to generate large tile-to-guard ΔT to better understand heat leaks
Constant guard power (0.5, 1.0, or 2.0 W) to generate tile-to-deck ΔT
40 subsequent site-specific tests
One initial power-controlled test followed by 3 increasing temperature-controlled tests
Similar tile and guard temperatures to minimize heat leaks
1,800 correlation points (360 initial; 1,440 subsequent) SPIRRAL Thermal Model Correlation 14 SPIRRAL Thermal Vacuum Thermal Model SPIRRAL Thermal Model (decks and sites) SPIRRAL Site Thermal Model<br>
15
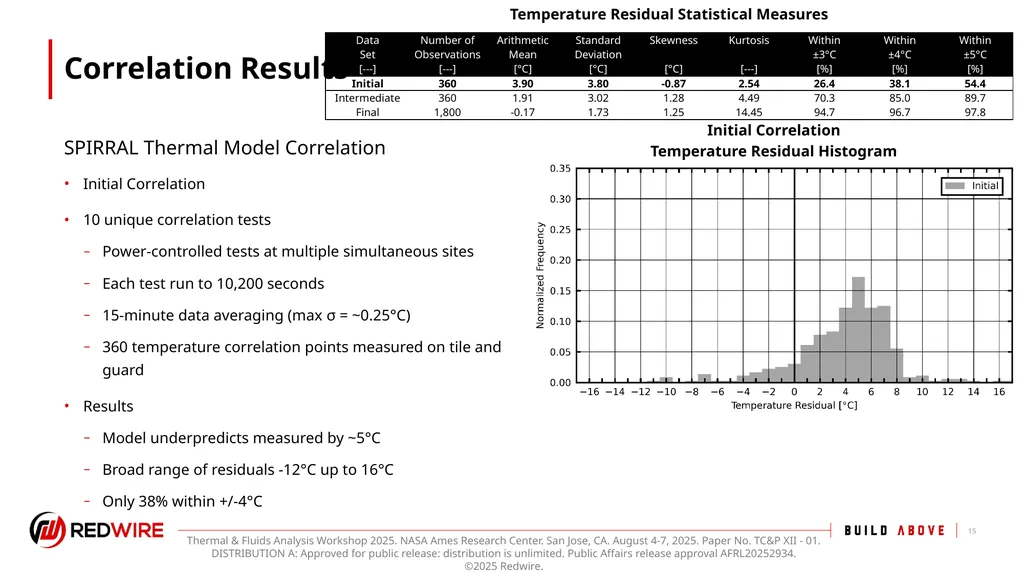
Correlation Results Initial Correlation
10 unique correlation tests
Power-controlled tests at multiple simultaneous sites
Each test run to 10,200 seconds
15-minute data averaging (max σ = ~0.25°C)
360 temperature correlation points measured on tile and guard
Results
Model underpredicts measured by ~5°C
Broad range of residuals -12°C up to 16°C
Only 38% within +/-4°C SPIRRAL Thermal Model Correlation 15 Initial Correlation
Temperature Residual Histogram Temperature Residual Statistical Measures<br>
10 unique correlation tests
Power-controlled tests at multiple simultaneous sites
Each test run to 10,200 seconds
15-minute data averaging (max σ = ~0.25°C)
360 temperature correlation points measured on tile and guard
Results
Model underpredicts measured by ~5°C
Broad range of residuals -12°C up to 16°C
Only 38% within +/-4°C SPIRRAL Thermal Model Correlation 15 Initial Correlation
Temperature Residual Histogram Temperature Residual Statistical Measures<br>
16
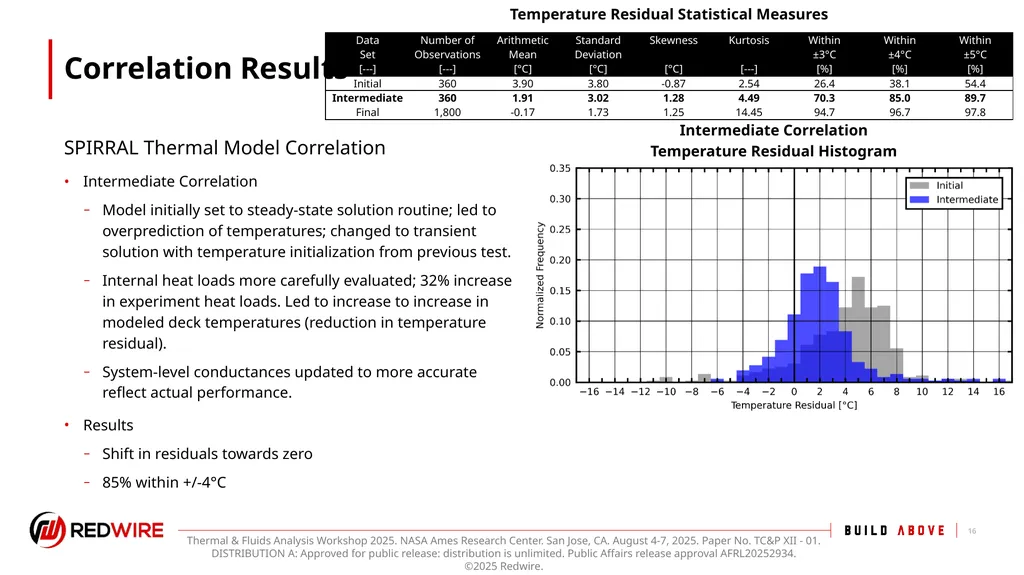
Correlation Results Intermediate Correlation
Model initially set to steady-state solution routine; led to overprediction of temperatures; changed to transient solution with temperature initialization from previous test.
Internal heat loads more carefully evaluated; 32% increase in experiment heat loads. Led to increase to increase in modeled deck temperatures (reduction in temperature residual).
System-level conductances updated to more accurate reflect actual performance.
Results
Shift in residuals towards zero
85% within +/-4°C SPIRRAL Thermal Model Correlation 16 Intermediate Correlation
Temperature Residual Histogram Temperature Residual Statistical Measures<br>
Model initially set to steady-state solution routine; led to overprediction of temperatures; changed to transient solution with temperature initialization from previous test.
Internal heat loads more carefully evaluated; 32% increase in experiment heat loads. Led to increase to increase in modeled deck temperatures (reduction in temperature residual).
System-level conductances updated to more accurate reflect actual performance.
Results
Shift in residuals towards zero
85% within +/-4°C SPIRRAL Thermal Model Correlation 16 Intermediate Correlation
Temperature Residual Histogram Temperature Residual Statistical Measures<br>
17
Correlation Results Final Correlation
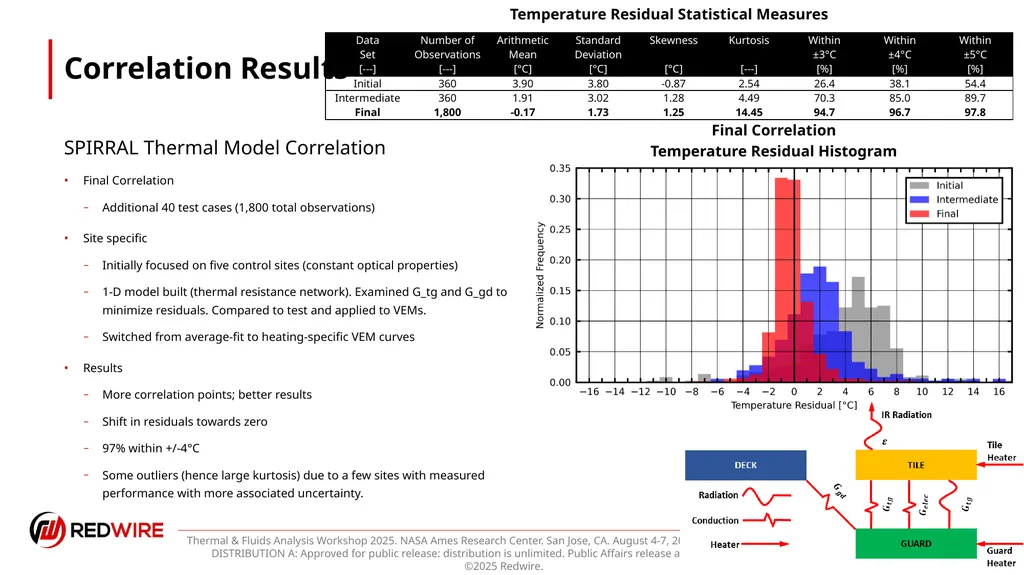
Additional 40 test cases (1,800 total observations)
Site specific
Initially focused on five control sites (constant optical properties)
1-D model built (thermal resistance network). Examined G_tg and G_gd to minimize residuals. Compared to test and applied to VEMs.
Switched from average-fit to heating-specific VEM curves
Results
More correlation points; better results
Shift in residuals towards zero
97% within +/-4°C
Some outliers (hence large kurtosis) due to a few sites with measured performance with more associated uncertainty. SPIRRAL Thermal Model Correlation 17 Final Correlation
Temperature Residual Histogram Temperature Residual Statistical Measures Edit<br>
Additional 40 test cases (1,800 total observations)
Site specific
Initially focused on five control sites (constant optical properties)
1-D model built (thermal resistance network). Examined G_tg and G_gd to minimize residuals. Compared to test and applied to VEMs.
Switched from average-fit to heating-specific VEM curves
Results
More correlation points; better results
Shift in residuals towards zero
97% within +/-4°C
Some outliers (hence large kurtosis) due to a few sites with measured performance with more associated uncertainty. SPIRRAL Thermal Model Correlation 17 Final Correlation
Temperature Residual Histogram Temperature Residual Statistical Measures Edit<br>
18
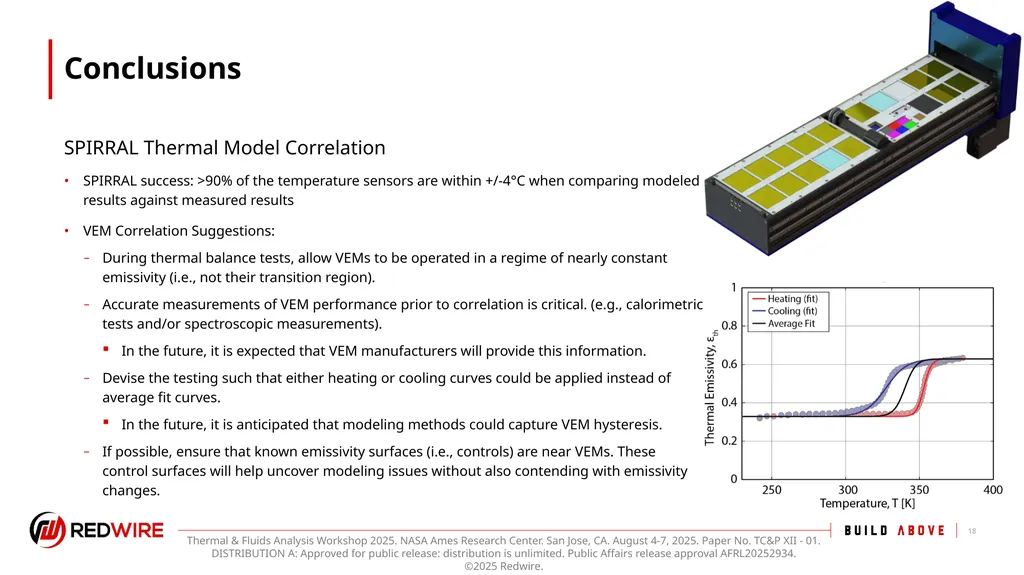
Conclusions SPIRRAL success: >90% of the temperature sensors are within +/-4°C when comparing modeled results against measured results
VEM Correlation Suggestions:
During thermal balance tests, allow VEMs to be operated in a regime of nearly constant emissivity (i.e., not their transition region).
Accurate measurements of VEM performance prior to correlation is critical. (e.g., calorimetric tests and/or spectroscopic measurements).
In the future, it is expected that VEM manufacturers will provide this information.
Devise the testing such that either heating or cooling curves could be applied instead of average fit curves.
In the future, it is anticipated that modeling methods could capture VEM hysteresis.
If possible, ensure that known emissivity surfaces (i.e., controls) are near VEMs. These control surfaces will help uncover modeling issues without also contending with emissivity changes. SPIRRAL Thermal Model Correlation 18<br>
VEM Correlation Suggestions:
During thermal balance tests, allow VEMs to be operated in a regime of nearly constant emissivity (i.e., not their transition region).
Accurate measurements of VEM performance prior to correlation is critical. (e.g., calorimetric tests and/or spectroscopic measurements).
In the future, it is expected that VEM manufacturers will provide this information.
Devise the testing such that either heating or cooling curves could be applied instead of average fit curves.
In the future, it is anticipated that modeling methods could capture VEM hysteresis.
If possible, ensure that known emissivity surfaces (i.e., controls) are near VEMs. These control surfaces will help uncover modeling issues without also contending with emissivity changes. SPIRRAL Thermal Model Correlation 18<br>
19
Acknowledgments and References This work is in support of the Space Power InfraRed Regulation and Analysis of Lifetime (SPIRRAL) experiment by the Air Force Research Laboratory, Space Vehicles Directorate, Kirtland AFB, NM (AFRL/RV). The views expressed are those of the authors and do not reflect the official guidance or position of the United States Government, the Department of Defense or of the United States Air Force. The appearance of external hyperlinks does not constitute endorsement by the United States Department of Defense (DoD) of the linked websites, or the information, products, or services contained therein. The DoD does not exercise any editorial, security, or other control over the information you may find at these locations.
Select references
Lawdensky, Air Force Research Laboratory Tech Roadmap, presented at 2023 Spacecraft Thermal Control Workshop
Foster, Air Force Research Laboratory Tech Roadmap, presented at 2025 Spacecraft Thermal Control Workshop
2023 ICES/TFAWS - Hengeveld and Allison - Novel Methods for Modeling Thermochromic Variable Emissivity Surfaces
Welch, J. Assessment of thermal balance test criteria requirements for test objectives and thermal design. 2016. 46th International Conference on Environmental Systems 19<br>
Select references
Lawdensky, Air Force Research Laboratory Tech Roadmap, presented at 2023 Spacecraft Thermal Control Workshop
Foster, Air Force Research Laboratory Tech Roadmap, presented at 2025 Spacecraft Thermal Control Workshop
2023 ICES/TFAWS - Hengeveld and Allison - Novel Methods for Modeling Thermochromic Variable Emissivity Surfaces
Welch, J. Assessment of thermal balance test criteria requirements for test objectives and thermal design. 2016. 46th International Conference on Environmental Systems 19<br>
20
Thermochromic Variable Emissivity Material Thermal Modeling and Test Correlation Authors
Redwire: Dr. Derek Hengeveld
AFRL: Isaac J. Foster, Trevor J. Bird, Daniel Lockwood, and Jonathan Allison<br>
Redwire: Dr. Derek Hengeveld
AFRL: Isaac J. Foster, Trevor J. Bird, Daniel Lockwood, and Jonathan Allison<br>
21
Backup 21<br>
22
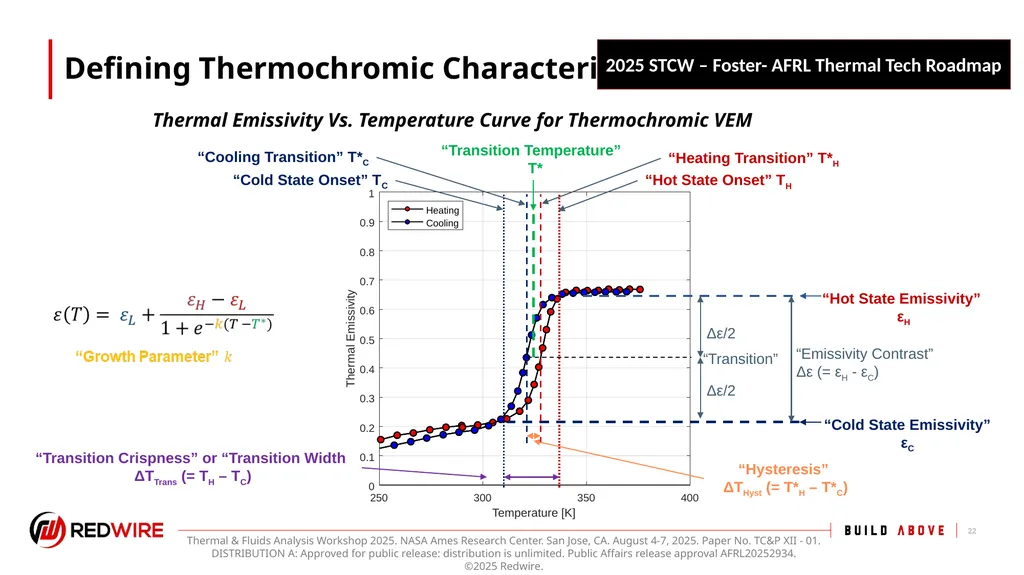
Defining Thermochromic Characteristics 22 “Hot State Emissivity”
εH “Cold State Emissivity”
εC “Emissivity Contrast”
Δε (= εH - εC) “Transition Crispness” or “Transition Width
ΔTTrans (= TH – TC) “Cold State Onset” TC “Hot State Onset” TH “Hysteresis”
ΔTHyst (= T*H – T*C) “Transition Temperature”
T* “Heating Transition” T*H “Cooling Transition” T*C Δε/2 Δε/2 “Transition” Thermal Emissivity Vs. Temperature Curve for Thermochromic VEM 2025 STCW – Foster- AFRL Thermal Tech Roadmap<br>
εH “Cold State Emissivity”
εC “Emissivity Contrast”
Δε (= εH - εC) “Transition Crispness” or “Transition Width
ΔTTrans (= TH – TC) “Cold State Onset” TC “Hot State Onset” TH “Hysteresis”
ΔTHyst (= T*H – T*C) “Transition Temperature”
T* “Heating Transition” T*H “Cooling Transition” T*C Δε/2 Δε/2 “Transition” Thermal Emissivity Vs. Temperature Curve for Thermochromic VEM 2025 STCW – Foster- AFRL Thermal Tech Roadmap<br>