
This slide deck has been designed to be customised
Description: This slide deck has been designed to be customised by paediatric diabetes teams to: communicate the main national and unit level findings from the audit facilitate interpretation of results use the data to stimulate quality improvement
Related Topics
Download Presentation
"This slide deck has been designed to be customised" is the property of its rightful owner. Permission is granted to download and print the materials on this website for personal, non-commercial use only, and to display it on your personal computer provided you do not modify the materials and that you retain all copyright notices contained in the materials. By downloading content from our website, you accept the terms of this agreement.
Presentation Transcript
slide1. This slide deck has been designed to be customised by paediatric diabetes teams to:
communicate the main national and unit level findings from the audit
facilitate interpretation of results
use the data to stimulate quality improvement activity
promote awareness of the functionality of NPDA Results Online (our interactive online reporting tool), and the NPDA data capture system
All unit level graphs displayed are placeholders, and there are instructions for the generation of bespoke graphs for your unit on the slides displaying these place holders
The results displayed are for children and young people with Type 1 diabetes, as numbers with other types of diabetes are currently too low at unit level to enable meaningful reporting within the majority of participating services
In order to compare your validated 2021/22 results against data submitted for the 2022/23 audit, please view the service level summaries within the data completeness report generated upon submission of your 2022/23 data NPDA 2021/22 results presentation template<br>
slide2. NPDA Results Online
NPDA Results Online user guide (including how to load and download graphs, and download the data behind each)
Data completeness report user guide
Unit level pdf reports
How to use the snipping tool to cut and paste graphs if preferred (please note the resolution will likely be higher if graphs are downloaded as jpegs from NPDA Results Online- click the bottom left hand square within each graph generated to do so)
Excel files of current and historical summary NPDA data NPDA 2021/22 results presentation template:
Resources to support your presentation<br>
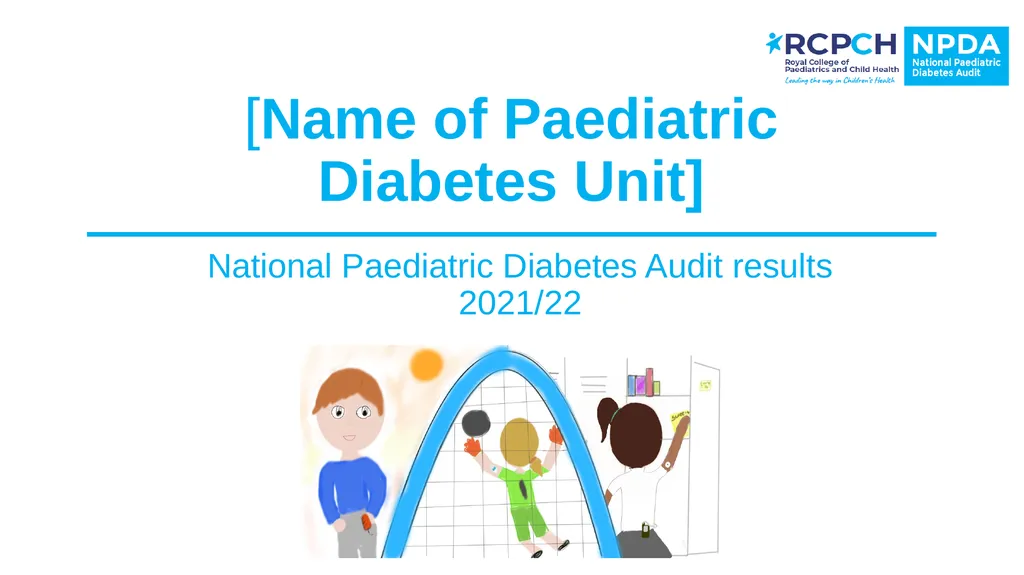
slide3. [Name of Paediatric Diabetes Unit] National Paediatric Diabetes Audit results 2021/22<br>
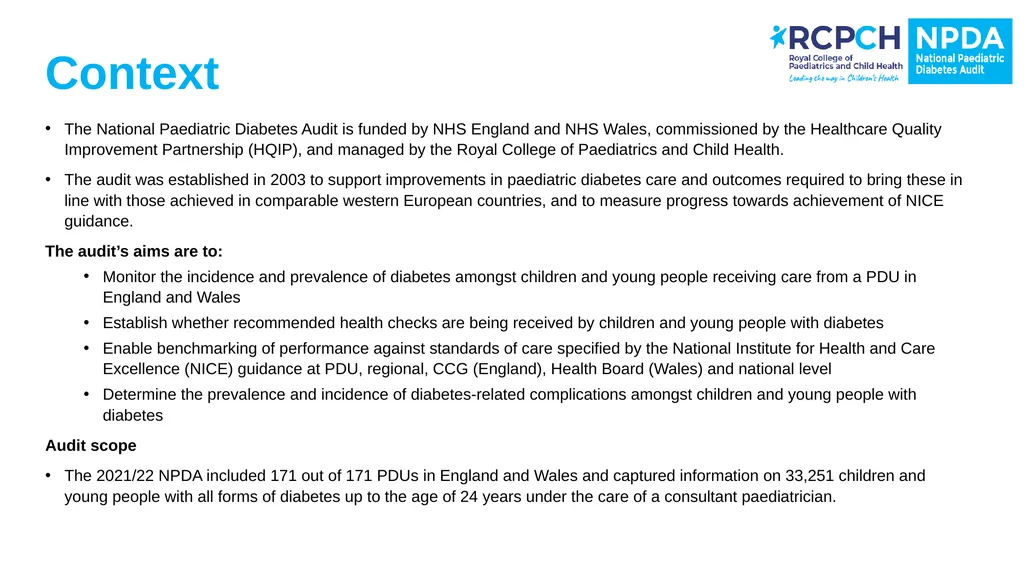
slide4. Context The National Paediatric Diabetes Audit is funded by NHS England and NHS Wales, commissioned by the Healthcare Quality Improvement Partnership (HQIP), and managed by the Royal College of Paediatrics and Child Health.
The audit was established in 2003 to support improvements in paediatric diabetes care and outcomes required to bring these in line with those achieved in comparable western European countries, and to measure progress towards achievement of NICE guidance.
The audit’s aims are to:
Monitor the incidence and prevalence of diabetes amongst children and young people receiving care from a PDU in England and Wales
Establish whether recommended health checks are being received by children and young people with diabetes
Enable benchmarking of performance against standards of care specified by the National Institute for Health and Care Excellence (NICE) guidance at PDU, regional, CCG (England), Health Board (Wales) and national level
Determine the prevalence and incidence of diabetes-related complications amongst children and young people with diabetes
Audit scope
The 2021/22 NPDA included 171 out of 171 PDUs in England and Wales and captured information on 33,251 children and young people with all forms of diabetes up to the age of 24 years under the care of a consultant paediatrician.<br>
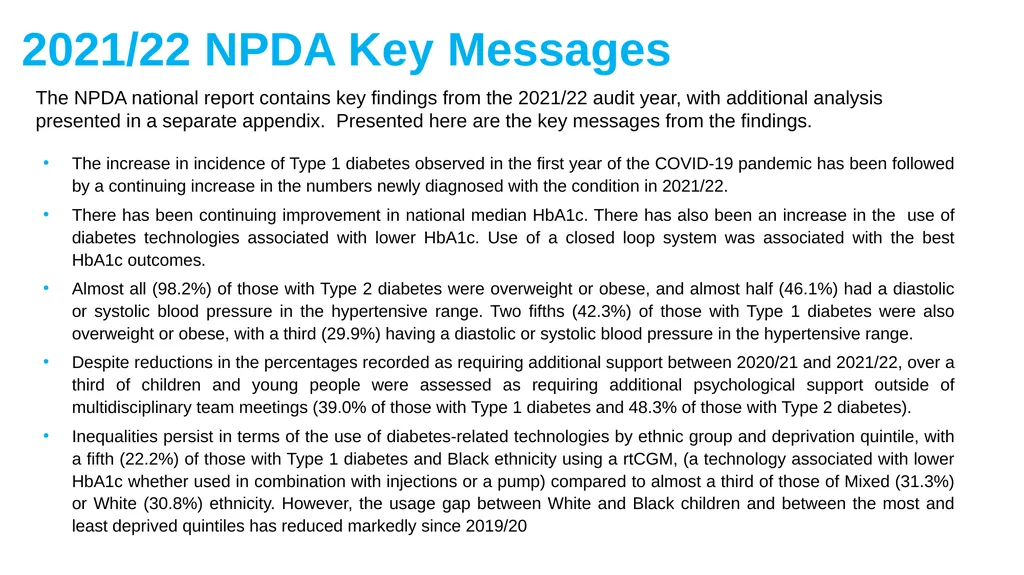
slide5. 2021/22 NPDA Key Messages The NPDA national report contains key findings from the 2021/22 audit year, with additional analysis presented in a separate appendix. Presented here are the key messages from the findings. The increase in incidence of Type 1 diabetes observed in the first year of the COVID-19 pandemic has been followed by a continuing increase in the numbers newly diagnosed with the condition in 2021/22.
There has been continuing improvement in national median HbA1c. There has also been an increase in the use of diabetes technologies associated with lower HbA1c. Use of a closed loop system was associated with the best HbA1c outcomes.
Almost all (98.2%) of those with Type 2 diabetes were overweight or obese, and almost half (46.1%) had a diastolic or systolic blood pressure in the hypertensive range. Two fifths (42.3%) of those with Type 1 diabetes were also overweight or obese, with a third (29.9%) having a diastolic or systolic blood pressure in the hypertensive range.
Despite reductions in the percentages recorded as requiring additional support between 2020/21 and 2021/22, over a third of children and young people were assessed as requiring additional psychological support outside of multidisciplinary team meetings (39.0% of those with Type 1 diabetes and 48.3% of those with Type 2 diabetes).
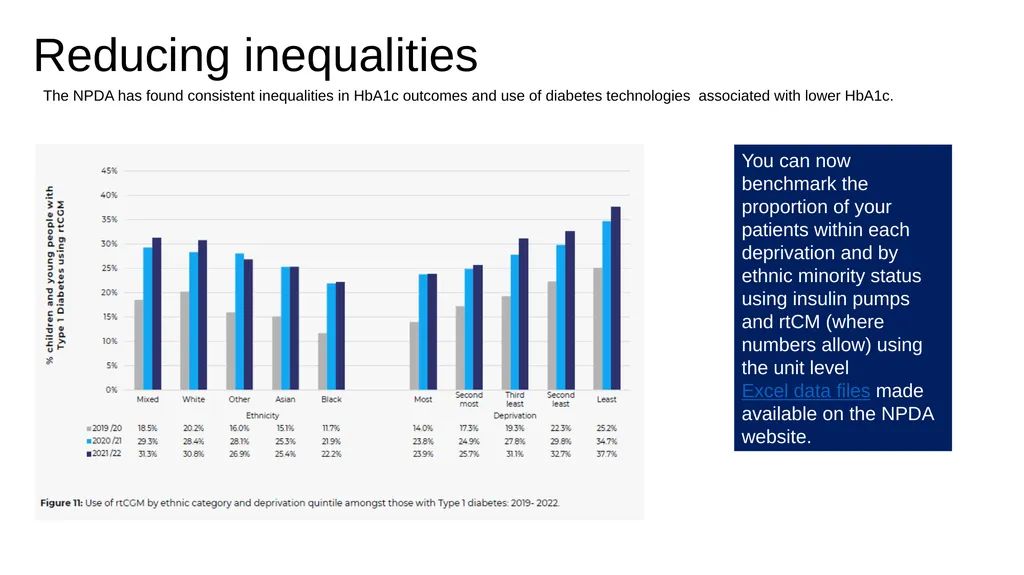
Inequalities persist in terms of the use of diabetes-related technologies by ethnic group and deprivation quintile, with a fifth (22.2%) of those with Type 1 diabetes and Black ethnicity using a rtCGM, (a technology associated with lower HbA1c whether used in combination with injections or a pump) compared to almost a third of those of Mixed (31.3%) or White (30.8%) ethnicity. However, the usage gap between White and Black children and between the most and least deprived quintiles has reduced markedly since 2019/20<br>
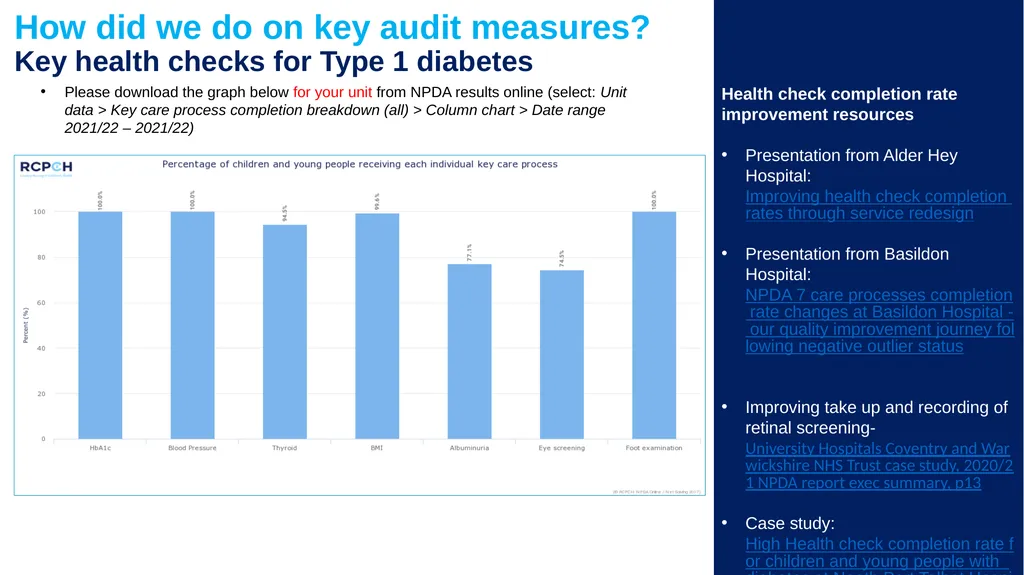
slide6. How did we do on key audit measures? Key health checks for Type 1 diabetes Please download the graph below for your unit from NPDA results online (select: Unit data > Key care process completion breakdown (all) > Column chart > Date range 2021/22 – 2021/22)<br>
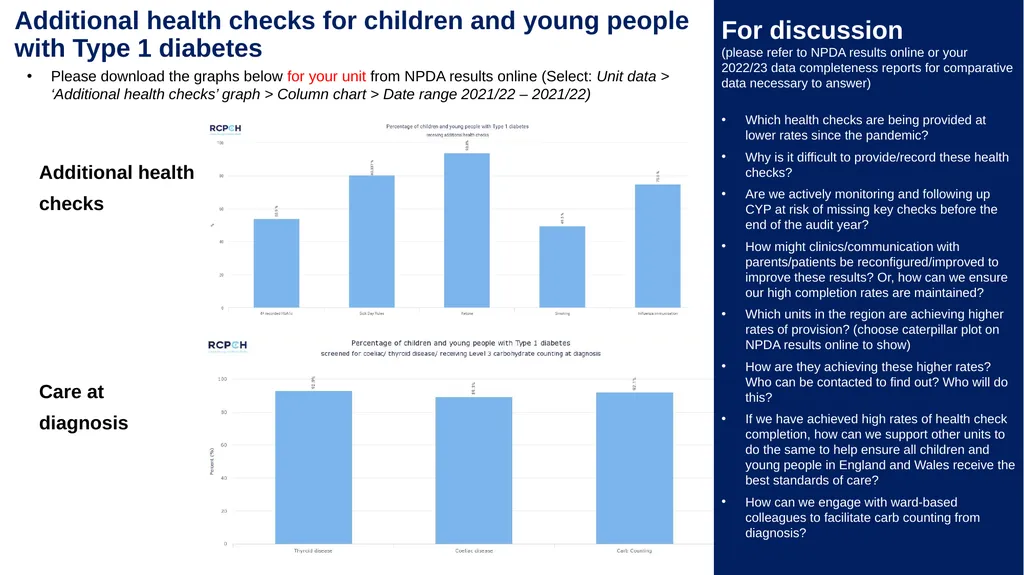
slide7. Additional health checks for children and young people with Type 1 diabetes Please download the graphs below for your unit from NPDA results online (Select: Unit data > ‘Additional health checks’ graph > Column chart > Date range 2021/22 – 2021/22) Additional health
checks
Care at
diagnosis For discussion
(please refer to NPDA results online or your 2022/23 data completeness reports for comparative data necessary to answer)
Which health checks are being provided at lower rates since the pandemic?
Why is it difficult to provide/record these health checks?
Are we actively monitoring and following up CYP at risk of missing key checks before the end of the audit year?
How might clinics/communication with parents/patients be reconfigured/improved to improve these results? Or, how can we ensure our high completion rates are maintained?
Which units in the region are achieving higher rates of provision? (choose caterpillar plot on NPDA results online to show)
How are they achieving these higher rates? Who can be contacted to find out? Who will do this?
If we have achieved high rates of health check completion, how can we support other units to do the same to help ensure all children and young people in England and Wales receive the best standards of care?
How can we engage with ward-based colleagues to facilitate carb counting from diagnosis?<br>
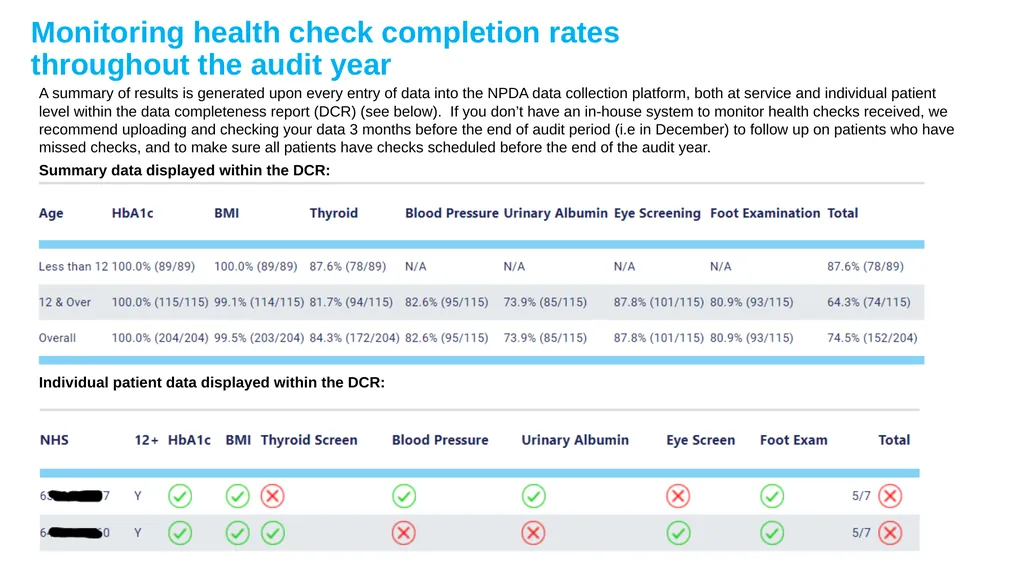
slide8. Monitoring health check completion rates throughout the audit year A summary of results is generated upon every entry of data into the NPDA data collection platform, both at service and individual patient level within the data completeness report (DCR) (see below). If you don’t have an in-house system to monitor health checks received, we recommend uploading and checking your data 3 months before the end of audit period (i.e in December) to follow up on patients who have missed checks, and to make sure all patients have checks scheduled before the end of the audit year.
Summary data displayed within the DCR: Individual patient data displayed within the DCR:<br>
slide9. How does/or could your team monitor health check completion for patients with Type 2 diabetes?
Are families with Type 2 diabetes receiving enough information from your service to help them understand the aggressive nature of Type 2 diabetes in the young, and to support them to self-manage within their particular family circumstances?
When complications are identified such as high blood pressure or albuminuria, how is your service managing these?
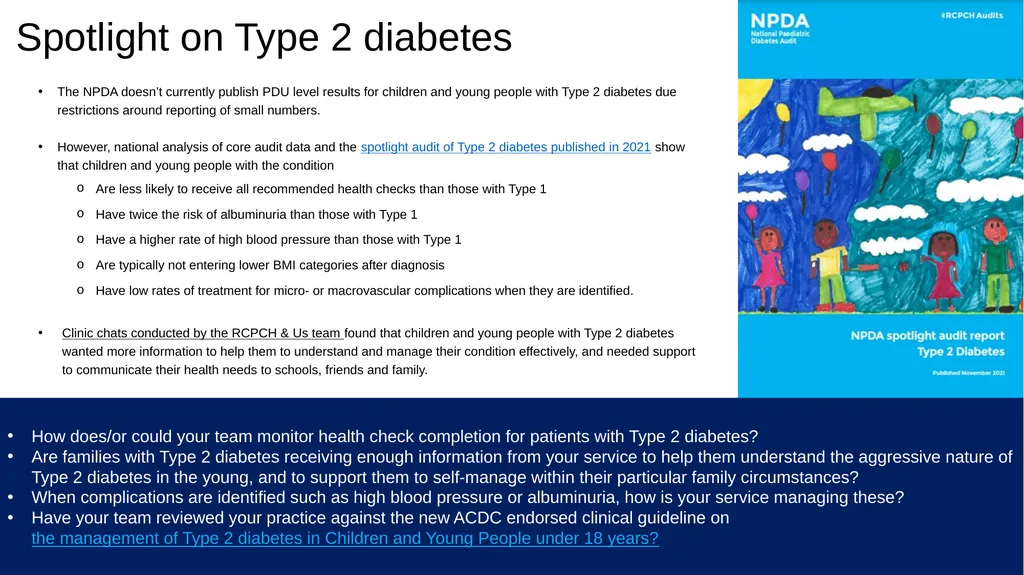
Have your team reviewed your practice against the new ACDC endorsed clinical guideline on the management of Type 2 diabetes in Children and Young People under 18 years? Spotlight on Type 2 diabetes The NPDA doesn’t currently publish PDU level results for children and young people with Type 2 diabetes due restrictions around reporting of small numbers.
However, national analysis of core audit data and the spotlight audit of Type 2 diabetes published in 2021 show that children and young people with the condition
Are less likely to receive all recommended health checks than those with Type 1
Have twice the risk of albuminuria than those with Type 1
Have a higher rate of high blood pressure than those with Type 1
Are typically not entering lower BMI categories after diagnosis
Have low rates of treatment for micro- or macrovascular complications when they are identified.
Clinic chats conducted by the RCPCH & Us team found that children and young people with Type 2 diabetes wanted more information to help them to understand and manage their condition effectively, and needed support to communicate their health needs to schools, friends and family.<br>
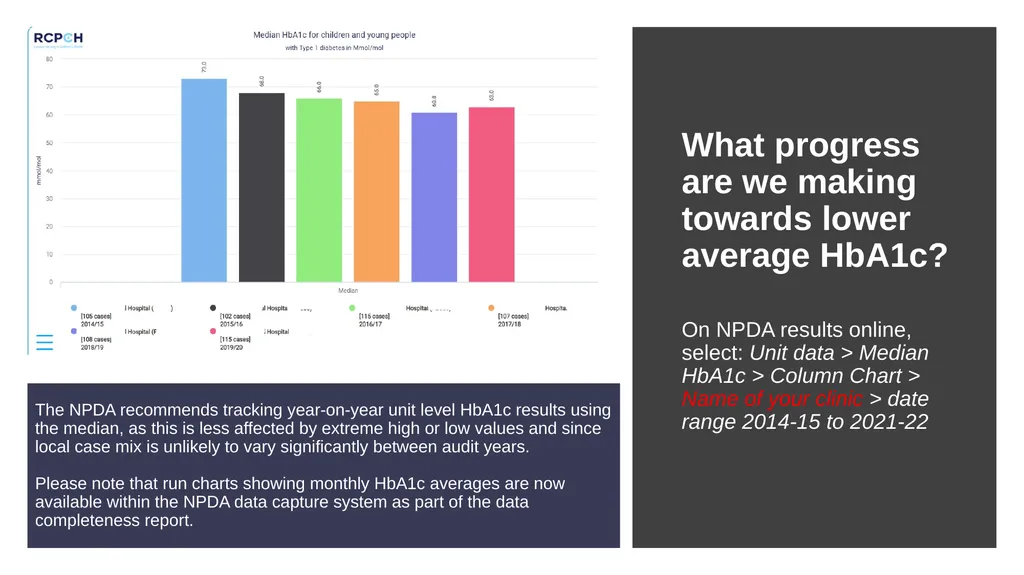
slide10. The NPDA recommends tracking year-on-year unit level HbA1c results using the median, as this is less affected by extreme high or low values and since local case mix is unlikely to vary significantly between audit years. Please note that run charts showing monthly HbA1c averages are now available within the NPDA data capture system as part of the data completeness report. What progress are we making towards lower average HbA1c?
On NPDA results online, select: Unit data > Median HbA1c > Column Chart > Name of your clinic > date range 2014-15 to 2021-22<br>
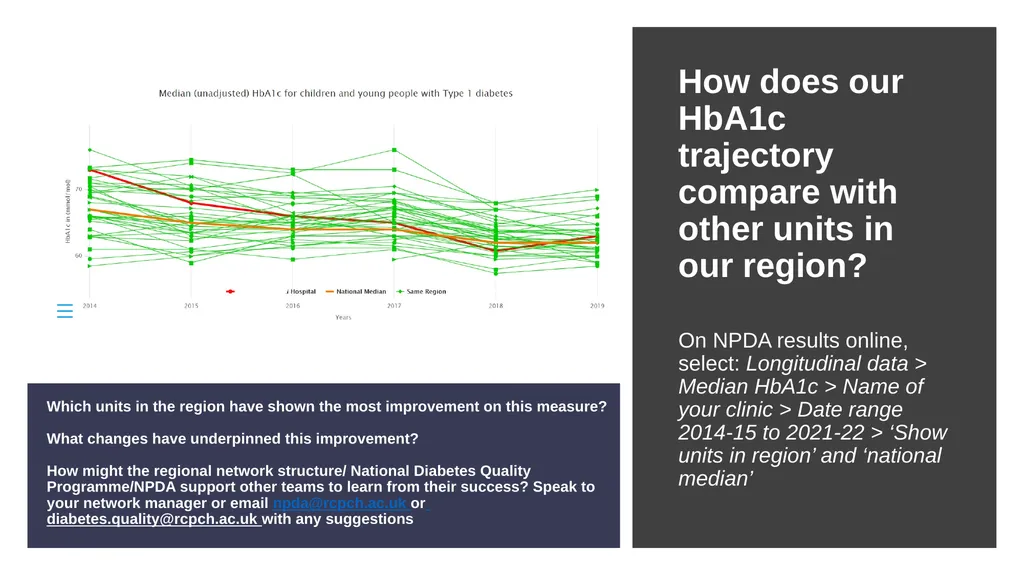
slide11. Which units in the region have shown the most improvement on this measure? What changes have underpinned this improvement? How might the regional network structure/ National Diabetes Quality Programme/NPDA support other teams to learn from their success? Speak to your network manager or email npda@rcpch.ac.uk or diabetes.quality@rcpch.ac.uk with any suggestions How does our HbA1c trajectory compare with other units in our region?
On NPDA results online, select: Longitudinal data > Median HbA1c > Name of your clinic > Date range 2014-15 to 2021-22 > ‘Show units in region’ and ‘national median’<br>
slide12. HbA1c outcomes: For discussion Do NPDA results shown demonstrate the impact of team quality improvement initiatives trialed to make improvements in care over the audit period?
Which quality improvement initiatives introduced within the audit year do team members consider most successful, and why?
What initiatives could be trialed to improve engagement and outcomes amongst the groups of patients shown by the NPDA to have typically higher HbA1c (adolescents, girls, those living in the most deprived areas, those of Black or mixed ethnicity)?
Even clinics with lower-than-average HbA1cs have a small proportion of patients achieving an HbA1c <48 mmol/mol. What support can be provided to patients already achieving an HbA1c <63mmol/mol to help them reach 48?
Analysis within the NPDA tech spotlight report published in 2019 showed use of an insulin pump to be associated with lower average HbA1c compared to MDI, even after patient characteristics were controlled for, however there was also significant variation in pump users' HbA1c outcomes by clinic. 2021/22 unit summaries included comparison of PDU-level HbA1c outcomes for pump users. How do your pump results compare with the national figure?<br>
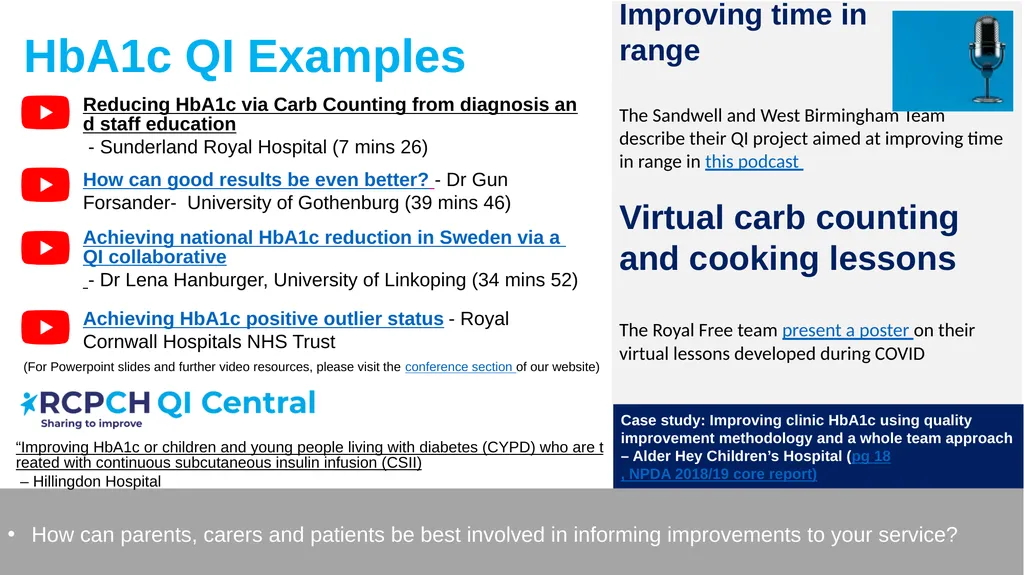
slide13. HbA1c QI Examples How can parents, carers and patients be best involved in informing improvements to your service? Reducing HbA1c via Carb Counting from diagnosis and staff education - Sunderland Royal Hospital (7 mins 26) How can good results be even better? - Dr Gun Forsander- University of Gothenburg (39 mins 46) Achieving national HbA1c reduction in Sweden via a QI collaborative - Dr Lena Hanburger, University of Linkoping (34 mins 52) Achieving HbA1c positive outlier status - Royal Cornwall Hospitals NHS Trust Improving time in
range
The Sandwell and West Birmingham Team describe their QI project aimed at improving time in range in this podcast
Virtual carb counting and cooking lessons
The Royal Free team present a poster on their virtual lessons developed during COVID “Improving HbA1c or children and young people living with diabetes (CYPD) who are treated with continuous subcutaneous insulin infusion (CSII) – Hillingdon Hospital (For Powerpoint slides and further video resources, please visit the conference section of our website) Case study: Improving clinic HbA1c using quality improvement methodology and a whole team approach – Alder Hey Children’s Hospital (pg 18, NPDA 2018/19 core report)<br>
slide14. Reducing inequalities The NPDA has found consistent inequalities in HbA1c outcomes and use of diabetes technologies associated with lower HbA1c. You can now benchmark the proportion of your patients within each deprivation and by ethnic minority status using insulin pumps and rtCM (where numbers allow) using the unit level Excel data files made available on the NPDA website.<br>
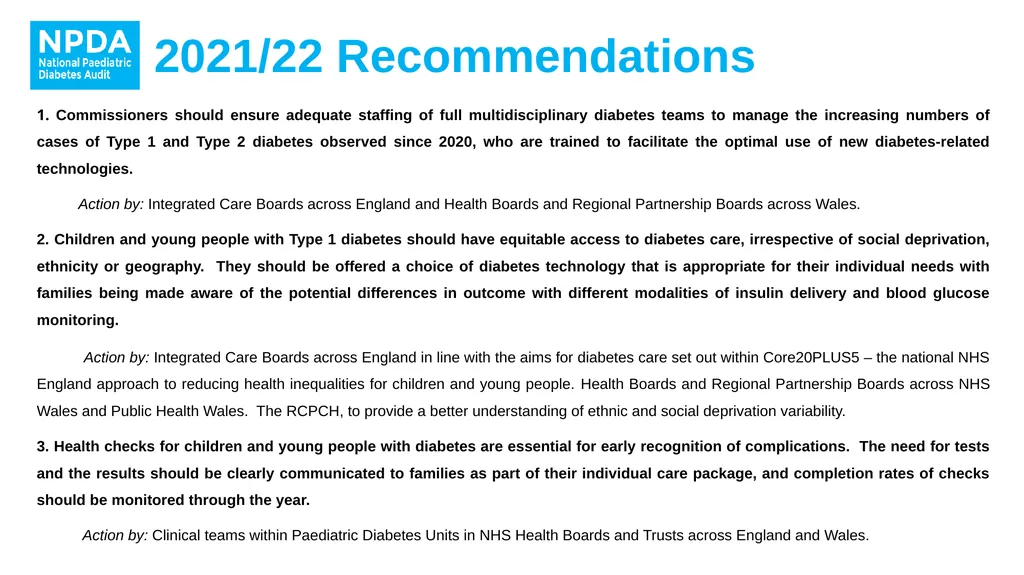
slide15. 2021/22 Recommendations 1. Commissioners should ensure adequate staffing of full multidisciplinary diabetes teams to manage the increasing numbers of cases of Type 1 and Type 2 diabetes observed since 2020, who are trained to facilitate the optimal use of new diabetes-related technologies.
Action by: Integrated Care Boards across England and Health Boards and Regional Partnership Boards across Wales.
2. Children and young people with Type 1 diabetes should have equitable access to diabetes care, irrespective of social deprivation, ethnicity or geography. They should be offered a choice of diabetes technology that is appropriate for their individual needs with families being made aware of the potential differences in outcome with different modalities of insulin delivery and blood glucose monitoring.
Action by: Integrated Care Boards across England in line with the aims for diabetes care set out within Core20PLUS5 – the national NHS England approach to reducing health inequalities for children and young people. Health Boards and Regional Partnership Boards across NHS Wales and Public Health Wales. The RCPCH, to provide a better understanding of ethnic and social deprivation variability.
3. Health checks for children and young people with diabetes are essential for early recognition of complications. The need for tests and the results should be clearly communicated to families as part of their individual care package, and completion rates of checks should be monitored through the year.
Action by: Clinical teams within Paediatric Diabetes Units in NHS Health Boards and Trusts across England and Wales.<br>
slide16. 2021/22 Recommendations contd 4. Awareness of diabetes symptomatology amongst the public should be enhanced to avoid newly diagnosed children and young people presenting with Diabetic ketoacidosis (DKA).
Action by: The Office for Health Improvement and Disparities, NHS England, Public Health Wales and NHS Wales supported by the National Children and Young People's (CYP) Diabetes Network, and diabetes charities (Diabetes UK and JDRF).
5. Studies should be funded to derive evidence for interventions supporting pre-diabetic children young people to avoid progression to Type 2 diabetes.
Action by: Funding bodies such as the National Institute for Health and Care Research, Diabetes UK.<br>
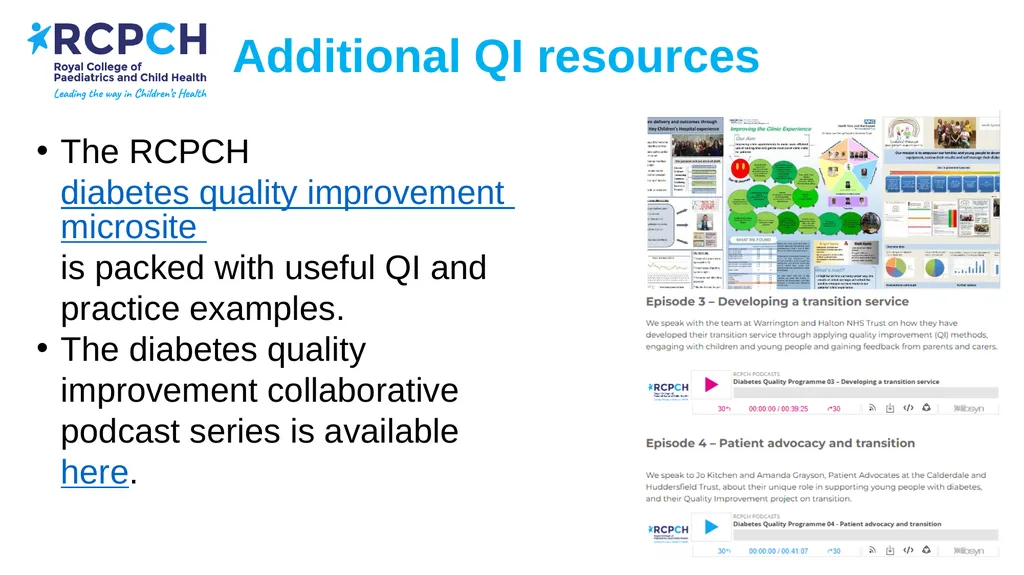
slide17. Additional QI resources The RCPCH diabetes quality improvement microsite is packed with useful QI and practice examples.
The diabetes quality improvement collaborative podcast series is available here.<br>
slide18. Thank you to everyone involved in recording, collating, submitting and checking data for the 2021/22 NPDA!<br>
communicate the main national and unit level findings from the audit
facilitate interpretation of results
use the data to stimulate quality improvement activity
promote awareness of the functionality of NPDA Results Online (our interactive online reporting tool), and the NPDA data capture system
All unit level graphs displayed are placeholders, and there are instructions for the generation of bespoke graphs for your unit on the slides displaying these place holders
The results displayed are for children and young people with Type 1 diabetes, as numbers with other types of diabetes are currently too low at unit level to enable meaningful reporting within the majority of participating services
In order to compare your validated 2021/22 results against data submitted for the 2022/23 audit, please view the service level summaries within the data completeness report generated upon submission of your 2022/23 data NPDA 2021/22 results presentation template<br>
slide2. NPDA Results Online
NPDA Results Online user guide (including how to load and download graphs, and download the data behind each)
Data completeness report user guide
Unit level pdf reports
How to use the snipping tool to cut and paste graphs if preferred (please note the resolution will likely be higher if graphs are downloaded as jpegs from NPDA Results Online- click the bottom left hand square within each graph generated to do so)
Excel files of current and historical summary NPDA data NPDA 2021/22 results presentation template:
Resources to support your presentation<br>
slide3. [Name of Paediatric Diabetes Unit] National Paediatric Diabetes Audit results 2021/22<br>
slide4. Context The National Paediatric Diabetes Audit is funded by NHS England and NHS Wales, commissioned by the Healthcare Quality Improvement Partnership (HQIP), and managed by the Royal College of Paediatrics and Child Health.
The audit was established in 2003 to support improvements in paediatric diabetes care and outcomes required to bring these in line with those achieved in comparable western European countries, and to measure progress towards achievement of NICE guidance.
The audit’s aims are to:
Monitor the incidence and prevalence of diabetes amongst children and young people receiving care from a PDU in England and Wales
Establish whether recommended health checks are being received by children and young people with diabetes
Enable benchmarking of performance against standards of care specified by the National Institute for Health and Care Excellence (NICE) guidance at PDU, regional, CCG (England), Health Board (Wales) and national level
Determine the prevalence and incidence of diabetes-related complications amongst children and young people with diabetes
Audit scope
The 2021/22 NPDA included 171 out of 171 PDUs in England and Wales and captured information on 33,251 children and young people with all forms of diabetes up to the age of 24 years under the care of a consultant paediatrician.<br>
slide5. 2021/22 NPDA Key Messages The NPDA national report contains key findings from the 2021/22 audit year, with additional analysis presented in a separate appendix. Presented here are the key messages from the findings. The increase in incidence of Type 1 diabetes observed in the first year of the COVID-19 pandemic has been followed by a continuing increase in the numbers newly diagnosed with the condition in 2021/22.
There has been continuing improvement in national median HbA1c. There has also been an increase in the use of diabetes technologies associated with lower HbA1c. Use of a closed loop system was associated with the best HbA1c outcomes.
Almost all (98.2%) of those with Type 2 diabetes were overweight or obese, and almost half (46.1%) had a diastolic or systolic blood pressure in the hypertensive range. Two fifths (42.3%) of those with Type 1 diabetes were also overweight or obese, with a third (29.9%) having a diastolic or systolic blood pressure in the hypertensive range.
Despite reductions in the percentages recorded as requiring additional support between 2020/21 and 2021/22, over a third of children and young people were assessed as requiring additional psychological support outside of multidisciplinary team meetings (39.0% of those with Type 1 diabetes and 48.3% of those with Type 2 diabetes).
Inequalities persist in terms of the use of diabetes-related technologies by ethnic group and deprivation quintile, with a fifth (22.2%) of those with Type 1 diabetes and Black ethnicity using a rtCGM, (a technology associated with lower HbA1c whether used in combination with injections or a pump) compared to almost a third of those of Mixed (31.3%) or White (30.8%) ethnicity. However, the usage gap between White and Black children and between the most and least deprived quintiles has reduced markedly since 2019/20<br>
slide6. How did we do on key audit measures? Key health checks for Type 1 diabetes Please download the graph below for your unit from NPDA results online (select: Unit data > Key care process completion breakdown (all) > Column chart > Date range 2021/22 – 2021/22)<br>
slide7. Additional health checks for children and young people with Type 1 diabetes Please download the graphs below for your unit from NPDA results online (Select: Unit data > ‘Additional health checks’ graph > Column chart > Date range 2021/22 – 2021/22) Additional health
checks
Care at
diagnosis For discussion
(please refer to NPDA results online or your 2022/23 data completeness reports for comparative data necessary to answer)
Which health checks are being provided at lower rates since the pandemic?
Why is it difficult to provide/record these health checks?
Are we actively monitoring and following up CYP at risk of missing key checks before the end of the audit year?
How might clinics/communication with parents/patients be reconfigured/improved to improve these results? Or, how can we ensure our high completion rates are maintained?
Which units in the region are achieving higher rates of provision? (choose caterpillar plot on NPDA results online to show)
How are they achieving these higher rates? Who can be contacted to find out? Who will do this?
If we have achieved high rates of health check completion, how can we support other units to do the same to help ensure all children and young people in England and Wales receive the best standards of care?
How can we engage with ward-based colleagues to facilitate carb counting from diagnosis?<br>
slide8. Monitoring health check completion rates throughout the audit year A summary of results is generated upon every entry of data into the NPDA data collection platform, both at service and individual patient level within the data completeness report (DCR) (see below). If you don’t have an in-house system to monitor health checks received, we recommend uploading and checking your data 3 months before the end of audit period (i.e in December) to follow up on patients who have missed checks, and to make sure all patients have checks scheduled before the end of the audit year.
Summary data displayed within the DCR: Individual patient data displayed within the DCR:<br>
slide9. How does/or could your team monitor health check completion for patients with Type 2 diabetes?
Are families with Type 2 diabetes receiving enough information from your service to help them understand the aggressive nature of Type 2 diabetes in the young, and to support them to self-manage within their particular family circumstances?
When complications are identified such as high blood pressure or albuminuria, how is your service managing these?
Have your team reviewed your practice against the new ACDC endorsed clinical guideline on the management of Type 2 diabetes in Children and Young People under 18 years? Spotlight on Type 2 diabetes The NPDA doesn’t currently publish PDU level results for children and young people with Type 2 diabetes due restrictions around reporting of small numbers.
However, national analysis of core audit data and the spotlight audit of Type 2 diabetes published in 2021 show that children and young people with the condition
Are less likely to receive all recommended health checks than those with Type 1
Have twice the risk of albuminuria than those with Type 1
Have a higher rate of high blood pressure than those with Type 1
Are typically not entering lower BMI categories after diagnosis
Have low rates of treatment for micro- or macrovascular complications when they are identified.
Clinic chats conducted by the RCPCH & Us team found that children and young people with Type 2 diabetes wanted more information to help them to understand and manage their condition effectively, and needed support to communicate their health needs to schools, friends and family.<br>
slide10. The NPDA recommends tracking year-on-year unit level HbA1c results using the median, as this is less affected by extreme high or low values and since local case mix is unlikely to vary significantly between audit years. Please note that run charts showing monthly HbA1c averages are now available within the NPDA data capture system as part of the data completeness report. What progress are we making towards lower average HbA1c?
On NPDA results online, select: Unit data > Median HbA1c > Column Chart > Name of your clinic > date range 2014-15 to 2021-22<br>
slide11. Which units in the region have shown the most improvement on this measure? What changes have underpinned this improvement? How might the regional network structure/ National Diabetes Quality Programme/NPDA support other teams to learn from their success? Speak to your network manager or email npda@rcpch.ac.uk or diabetes.quality@rcpch.ac.uk with any suggestions How does our HbA1c trajectory compare with other units in our region?
On NPDA results online, select: Longitudinal data > Median HbA1c > Name of your clinic > Date range 2014-15 to 2021-22 > ‘Show units in region’ and ‘national median’<br>
slide12. HbA1c outcomes: For discussion Do NPDA results shown demonstrate the impact of team quality improvement initiatives trialed to make improvements in care over the audit period?
Which quality improvement initiatives introduced within the audit year do team members consider most successful, and why?
What initiatives could be trialed to improve engagement and outcomes amongst the groups of patients shown by the NPDA to have typically higher HbA1c (adolescents, girls, those living in the most deprived areas, those of Black or mixed ethnicity)?
Even clinics with lower-than-average HbA1cs have a small proportion of patients achieving an HbA1c <48 mmol/mol. What support can be provided to patients already achieving an HbA1c <63mmol/mol to help them reach 48?
Analysis within the NPDA tech spotlight report published in 2019 showed use of an insulin pump to be associated with lower average HbA1c compared to MDI, even after patient characteristics were controlled for, however there was also significant variation in pump users' HbA1c outcomes by clinic. 2021/22 unit summaries included comparison of PDU-level HbA1c outcomes for pump users. How do your pump results compare with the national figure?<br>
slide13. HbA1c QI Examples How can parents, carers and patients be best involved in informing improvements to your service? Reducing HbA1c via Carb Counting from diagnosis and staff education - Sunderland Royal Hospital (7 mins 26) How can good results be even better? - Dr Gun Forsander- University of Gothenburg (39 mins 46) Achieving national HbA1c reduction in Sweden via a QI collaborative - Dr Lena Hanburger, University of Linkoping (34 mins 52) Achieving HbA1c positive outlier status - Royal Cornwall Hospitals NHS Trust Improving time in
range
The Sandwell and West Birmingham Team describe their QI project aimed at improving time in range in this podcast
Virtual carb counting and cooking lessons
The Royal Free team present a poster on their virtual lessons developed during COVID “Improving HbA1c or children and young people living with diabetes (CYPD) who are treated with continuous subcutaneous insulin infusion (CSII) – Hillingdon Hospital (For Powerpoint slides and further video resources, please visit the conference section of our website) Case study: Improving clinic HbA1c using quality improvement methodology and a whole team approach – Alder Hey Children’s Hospital (pg 18, NPDA 2018/19 core report)<br>
slide14. Reducing inequalities The NPDA has found consistent inequalities in HbA1c outcomes and use of diabetes technologies associated with lower HbA1c. You can now benchmark the proportion of your patients within each deprivation and by ethnic minority status using insulin pumps and rtCM (where numbers allow) using the unit level Excel data files made available on the NPDA website.<br>
slide15. 2021/22 Recommendations 1. Commissioners should ensure adequate staffing of full multidisciplinary diabetes teams to manage the increasing numbers of cases of Type 1 and Type 2 diabetes observed since 2020, who are trained to facilitate the optimal use of new diabetes-related technologies.
Action by: Integrated Care Boards across England and Health Boards and Regional Partnership Boards across Wales.
2. Children and young people with Type 1 diabetes should have equitable access to diabetes care, irrespective of social deprivation, ethnicity or geography. They should be offered a choice of diabetes technology that is appropriate for their individual needs with families being made aware of the potential differences in outcome with different modalities of insulin delivery and blood glucose monitoring.
Action by: Integrated Care Boards across England in line with the aims for diabetes care set out within Core20PLUS5 – the national NHS England approach to reducing health inequalities for children and young people. Health Boards and Regional Partnership Boards across NHS Wales and Public Health Wales. The RCPCH, to provide a better understanding of ethnic and social deprivation variability.
3. Health checks for children and young people with diabetes are essential for early recognition of complications. The need for tests and the results should be clearly communicated to families as part of their individual care package, and completion rates of checks should be monitored through the year.
Action by: Clinical teams within Paediatric Diabetes Units in NHS Health Boards and Trusts across England and Wales.<br>
slide16. 2021/22 Recommendations contd 4. Awareness of diabetes symptomatology amongst the public should be enhanced to avoid newly diagnosed children and young people presenting with Diabetic ketoacidosis (DKA).
Action by: The Office for Health Improvement and Disparities, NHS England, Public Health Wales and NHS Wales supported by the National Children and Young People's (CYP) Diabetes Network, and diabetes charities (Diabetes UK and JDRF).
5. Studies should be funded to derive evidence for interventions supporting pre-diabetic children young people to avoid progression to Type 2 diabetes.
Action by: Funding bodies such as the National Institute for Health and Care Research, Diabetes UK.<br>
slide17. Additional QI resources The RCPCH diabetes quality improvement microsite is packed with useful QI and practice examples.
The diabetes quality improvement collaborative podcast series is available here.<br>
slide18. Thank you to everyone involved in recording, collating, submitting and checking data for the 2021/22 NPDA!<br>