
Unit 3.3 Break-even Analysis Source: Business
PC
Published · 48 slides · 0 views
1 / 1



Description
Unit 3.3 Break-even Analysis Source: Business Management Textbook by Paul Hoang Contribution Refers to the sum of money that remains after all direct and variable costs have been taken away from the sales revenue. This is the amount
Related Topics
Share
Embed code
Download this presentation From Below
"Unit 3.3 Break-even Analysis Source: Business" is the property of its rightful owner. Permission is granted to download and print the materials on this website for personal, non-commercial use only, and to display it on your personal computer provided you do not modify the materials and that you retain all copyright notices contained in the materials. By downloading content from our website, you accept the terms of this agreement.
Presentation Transcript
01
Unit 3.3
Break-even Analysis Source:
Business Management Textbook by Paul Hoang<br>
Business Management Textbook by Paul Hoang<br>
02
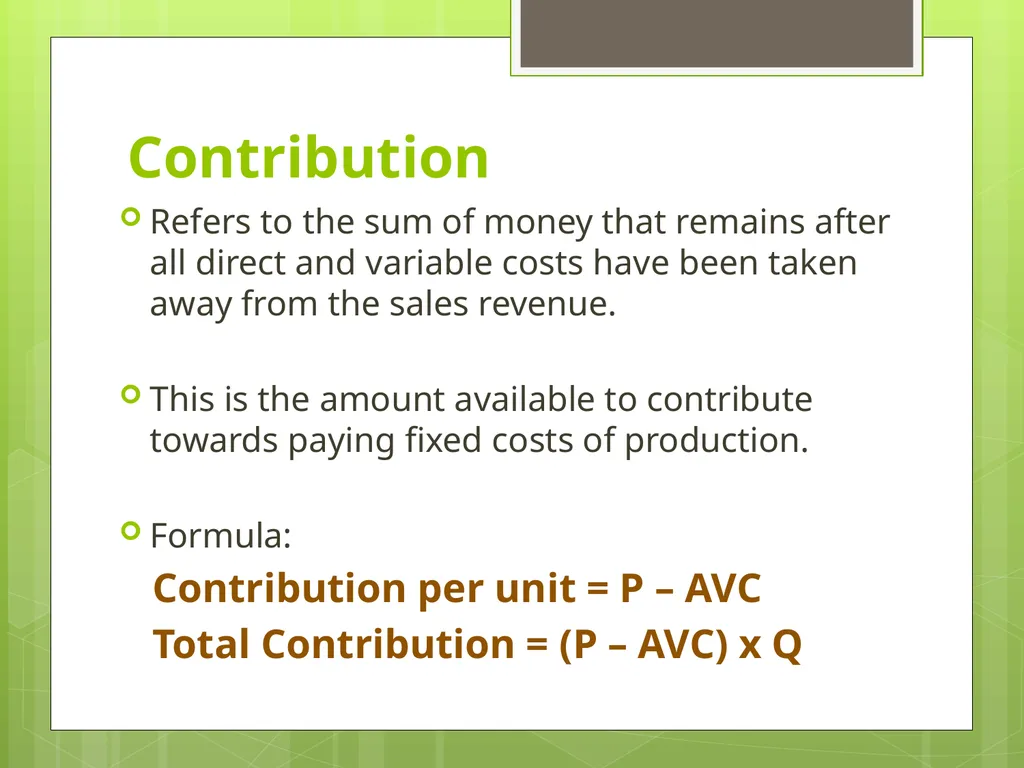
Contribution Refers to the sum of money that remains after all direct and variable costs have been taken away from the sales revenue.
This is the amount available to contribute towards paying fixed costs of production.
Formula:
Contribution per unit = P – AVC
Total Contribution = (P – AVC) x Q<br>
This is the amount available to contribute towards paying fixed costs of production.
Formula:
Contribution per unit = P – AVC
Total Contribution = (P – AVC) x Q<br>
03
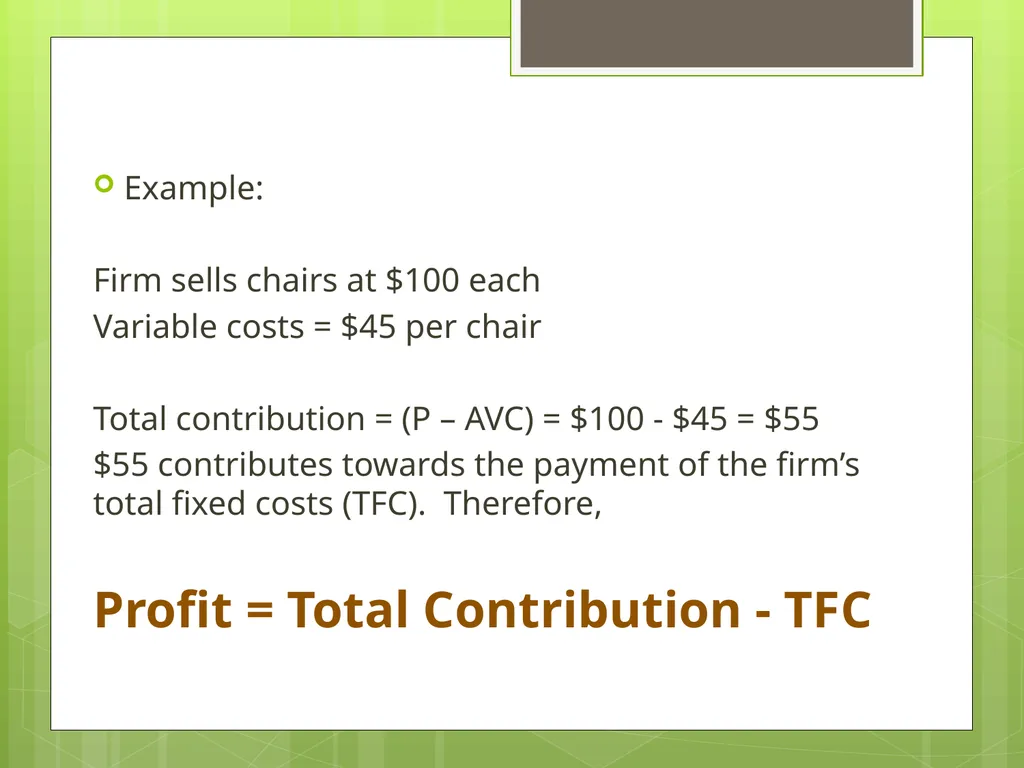
Example:
Firm sells chairs at $100 each
Variable costs = $45 per chair
Total contribution = (P – AVC) = $100 - $45 = $55
$55 contributes towards the payment of the firm’s total fixed costs (TFC). Therefore,
Profit = Total Contribution - TFC<br>
Firm sells chairs at $100 each
Variable costs = $45 per chair
Total contribution = (P – AVC) = $100 - $45 = $55
$55 contributes towards the payment of the firm’s total fixed costs (TFC). Therefore,
Profit = Total Contribution - TFC<br>
04
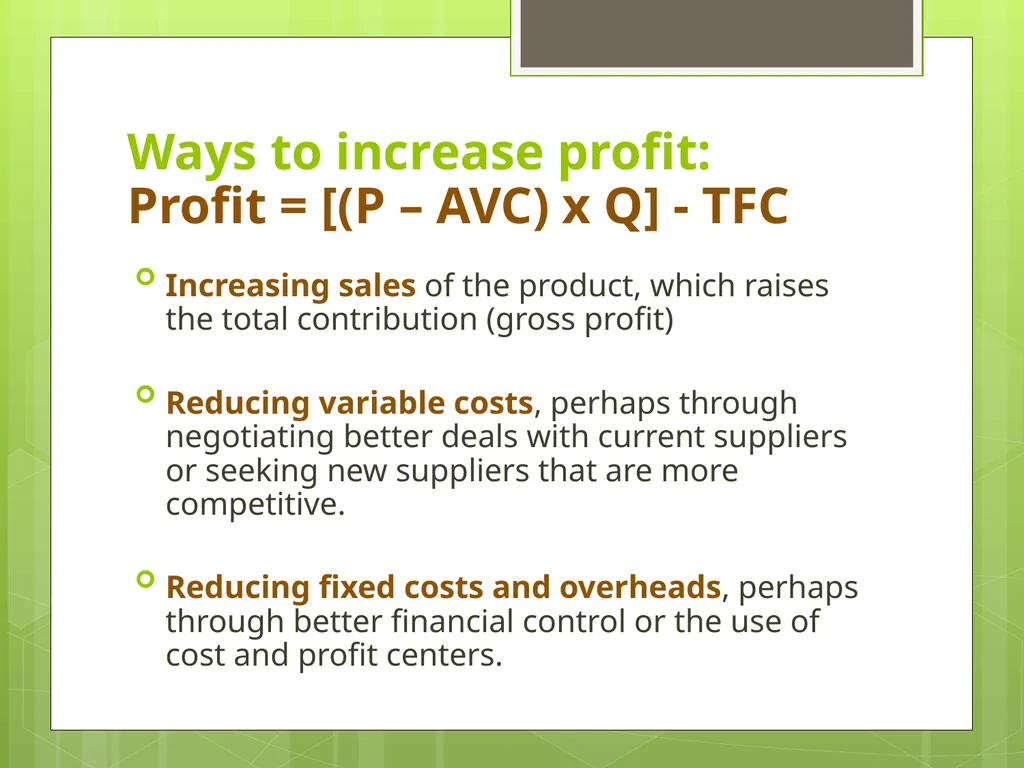
Ways to increase profit:
Profit = [(P – AVC) x Q] - TFC Increasing sales of the product, which raises the total contribution (gross profit)
Reducing variable costs, perhaps through negotiating better deals with current suppliers or seeking new suppliers that are more competitive.
Reducing fixed costs and overheads, perhaps through better financial control or the use of cost and profit centers.<br>
Reducing variable costs, perhaps through negotiating better deals with current suppliers or seeking new suppliers that are more competitive.
Reducing fixed costs and overheads, perhaps through better financial control or the use of cost and profit centers.<br>
05
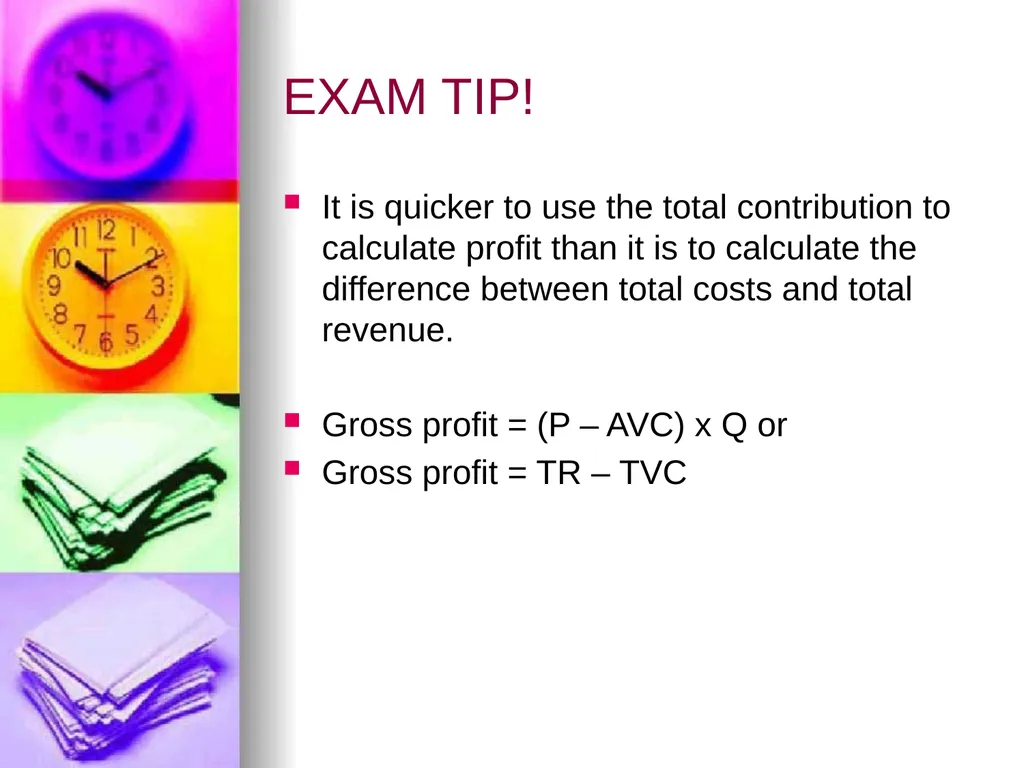
EXAM TIP! It is quicker to use the total contribution to calculate profit than it is to calculate the difference between total costs and total revenue.
Gross profit = (P – AVC) x Q or
Gross profit = TR – TVC<br>
Gross profit = (P – AVC) x Q or
Gross profit = TR – TVC<br>
06
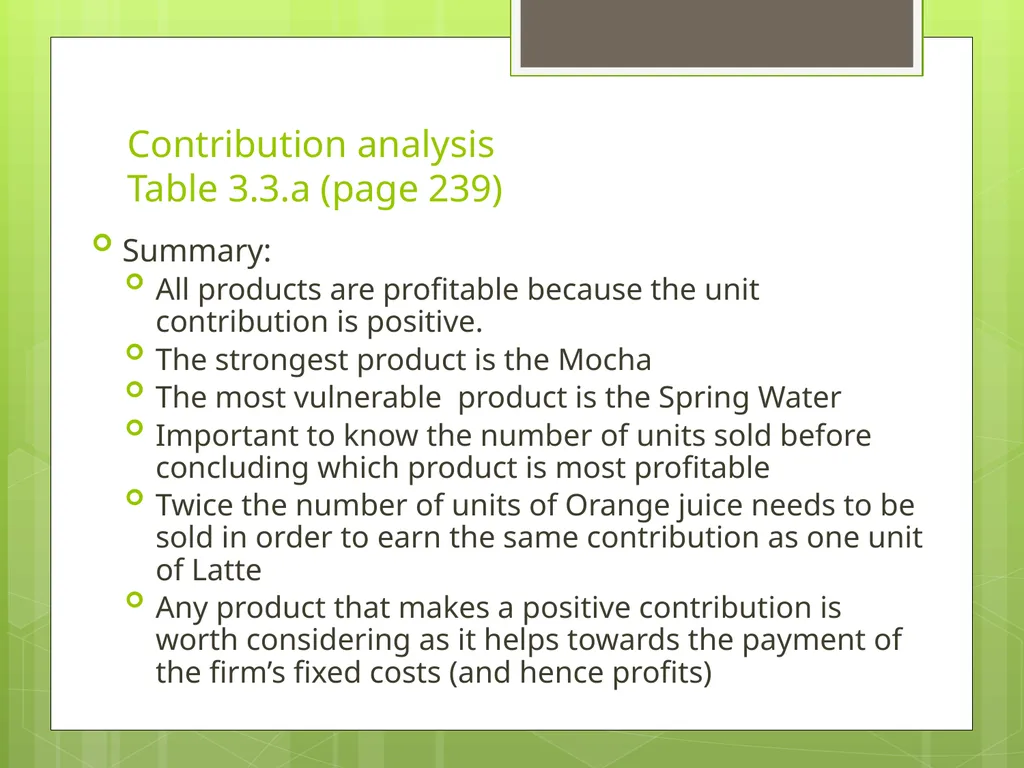
Contribution analysis
Table 3.3.a (page 239) Summary:
All products are profitable because the unit contribution is positive.
The strongest product is the Mocha
The most vulnerable product is the Spring Water
Important to know the number of units sold before concluding which product is most profitable
Twice the number of units of Orange juice needs to be sold in order to earn the same contribution as one unit of Latte
Any product that makes a positive contribution is worth considering as it helps towards the payment of the firm’s fixed costs (and hence profits)<br>
All products are profitable because the unit contribution is positive.
The strongest product is the Mocha
The most vulnerable product is the Spring Water
Important to know the number of units sold before concluding which product is most profitable
Twice the number of units of Orange juice needs to be sold in order to earn the same contribution as one unit of Latte
Any product that makes a positive contribution is worth considering as it helps towards the payment of the firm’s fixed costs (and hence profits)<br>
07
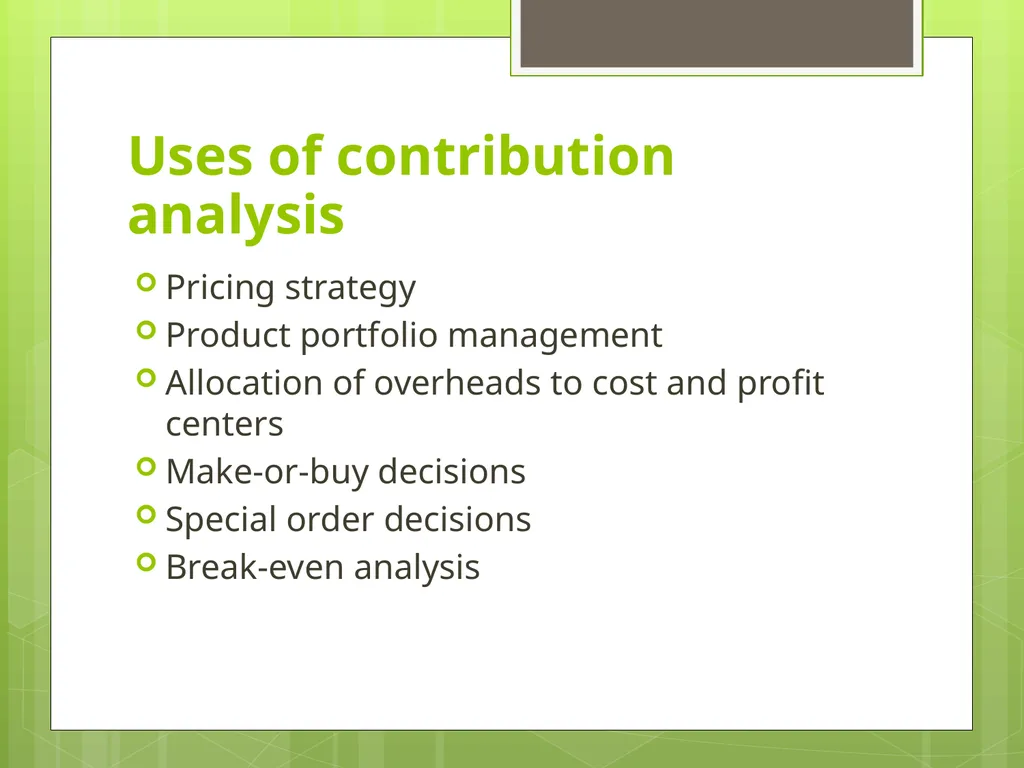
Uses of contribution analysis Pricing strategy
Product portfolio management
Allocation of overheads to cost and profit centers
Make-or-buy decisions
Special order decisions
Break-even analysis<br>
Product portfolio management
Allocation of overheads to cost and profit centers
Make-or-buy decisions
Special order decisions
Break-even analysis<br>
08
Pricing strategy Contribution analysis helps a business to set prices for each of its products to ensure there is contribution being made towards payment of fixed and indirect costs.<br>
09
Product portfolio management The analysis can help managers to decide which products should be given investment priority.
Products with a higher total contribution tend to be given precedence.
Products that earn a low unit contribution rely on high sales volumes to avoid being withdrawn or replaced by other products.<br>
Products with a higher total contribution tend to be given precedence.
Products that earn a low unit contribution rely on high sales volumes to avoid being withdrawn or replaced by other products.<br>
10
Allocation of overheads to cost and profit centers Cost center – is a department or unit of a business that incurs costs but is not involved in making any profit (ie. salaries, lighting, components, capital expenditures).
Profit center – is a department or unit of a business that incurs both costs and revenues.
The use of contribution analysis can ensure that cost allocation is done in a fair manner.<br>
Profit center – is a department or unit of a business that incurs both costs and revenues.
The use of contribution analysis can ensure that cost allocation is done in a fair manner.<br>
11
Make-or-buy decisions Contribution analysis can help a business decide whether it should produce (make) the products or purchase them (buy) from suppliers.
The relative difference between the unit contribution of making or buying the product will likely to determine the decision.<br>
The relative difference between the unit contribution of making or buying the product will likely to determine the decision.<br>
12
Special order decisions These occur when a customer places an order at a price that differs from the normal price charged by the business.
The price could be higher – customer requesting added benefits
The price could be lower – customer is buying significant amount of the product
Business decision will depend on the total contribution made from this type of deal.<br>
The price could be higher – customer requesting added benefits
The price could be lower – customer is buying significant amount of the product
Business decision will depend on the total contribution made from this type of deal.<br>
13
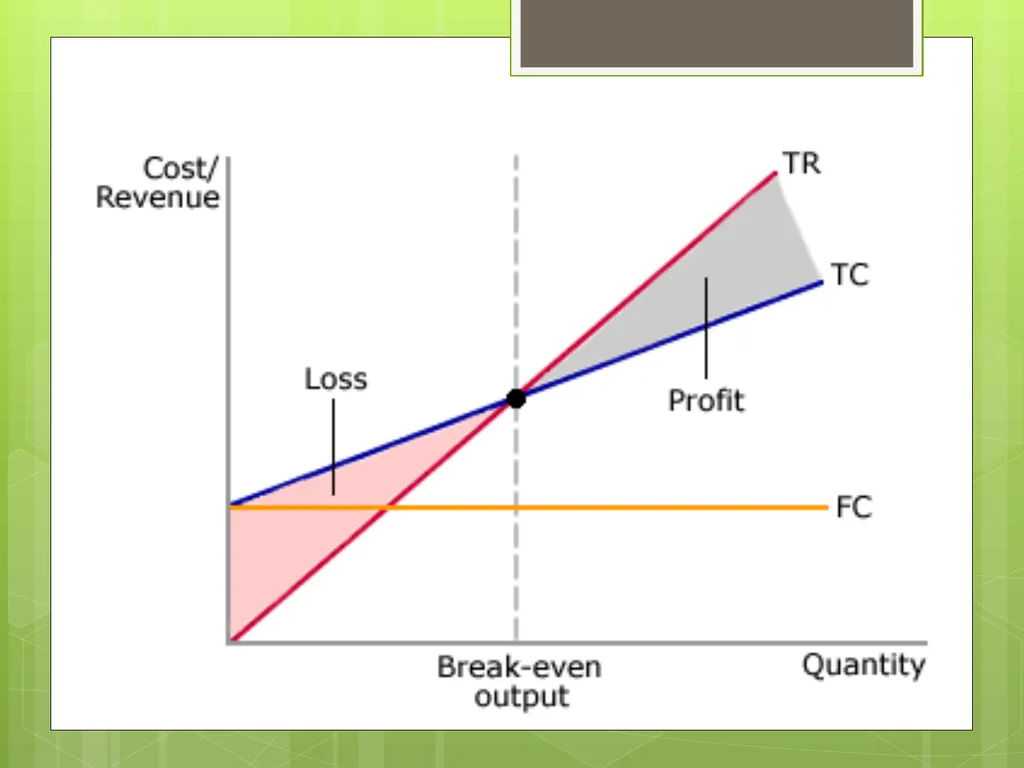
Break-even analysis (BEA) A business breaks even when neither a profit nor a loss is made.
TC = TR
BE is a key objective of new and un-established firms
Businesses need to pay careful attention to their cash-flow situation by monitoring and controlling the money coming into the business (revenues) and the money leaving the firm (costs).
BEA inform managers
whether it is financially worthwhile to produce or launch a particular good or service
The expected level of profits that the business will earn if all goes according to plan<br>
TC = TR
BE is a key objective of new and un-established firms
Businesses need to pay careful attention to their cash-flow situation by monitoring and controlling the money coming into the business (revenues) and the money leaving the firm (costs).
BEA inform managers
whether it is financially worthwhile to produce or launch a particular good or service
The expected level of profits that the business will earn if all goes according to plan<br>
14
EXAM TIP! Students who claim that a product should be discontinued or reduced in price (to sell more) because it has the smallest amount of contribution in a firm’s product portfolio do not understand the concept clearly. Even the tiniest of contribution can be used to pay towards a firm’s fixed costs. By contrast, discontinuing the product would mean less total contribution and hence, less profit.<br>
15
In financial terms, a business can be in one of the following situations at any point in time: Loss = wthe hen costs of production exceed the revenues of business
Break-even = when the revenues of the business equal the costs of production
Profit = when revenues exceed costs of production<br>
Break-even = when the revenues of the business equal the costs of production
Profit = when revenues exceed costs of production<br>
16
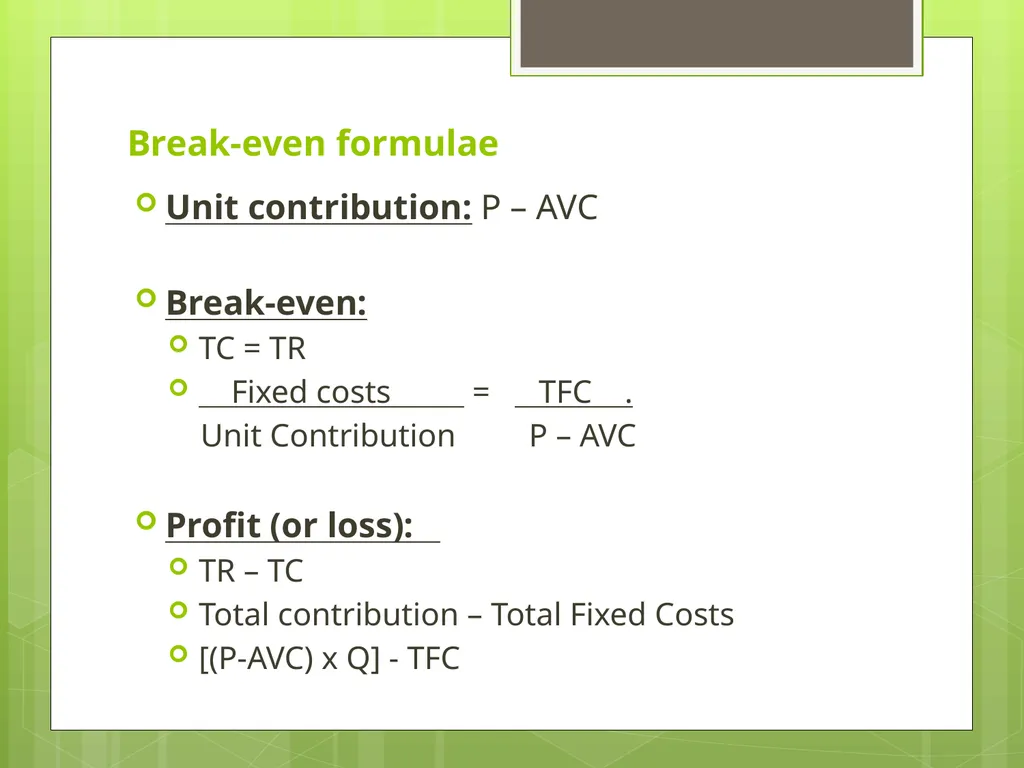
Break-even formulae Unit contribution: P – AVC
Break-even:
TC = TR
Fixed costs = TFC .
Unit Contribution P – AVC
Profit (or loss):
TR – TC
Total contribution – Total Fixed Costs
[(P-AVC) x Q] - TFC<br>
Break-even:
TC = TR
Fixed costs = TFC .
Unit Contribution P – AVC
Profit (or loss):
TR – TC
Total contribution – Total Fixed Costs
[(P-AVC) x Q] - TFC<br>
17
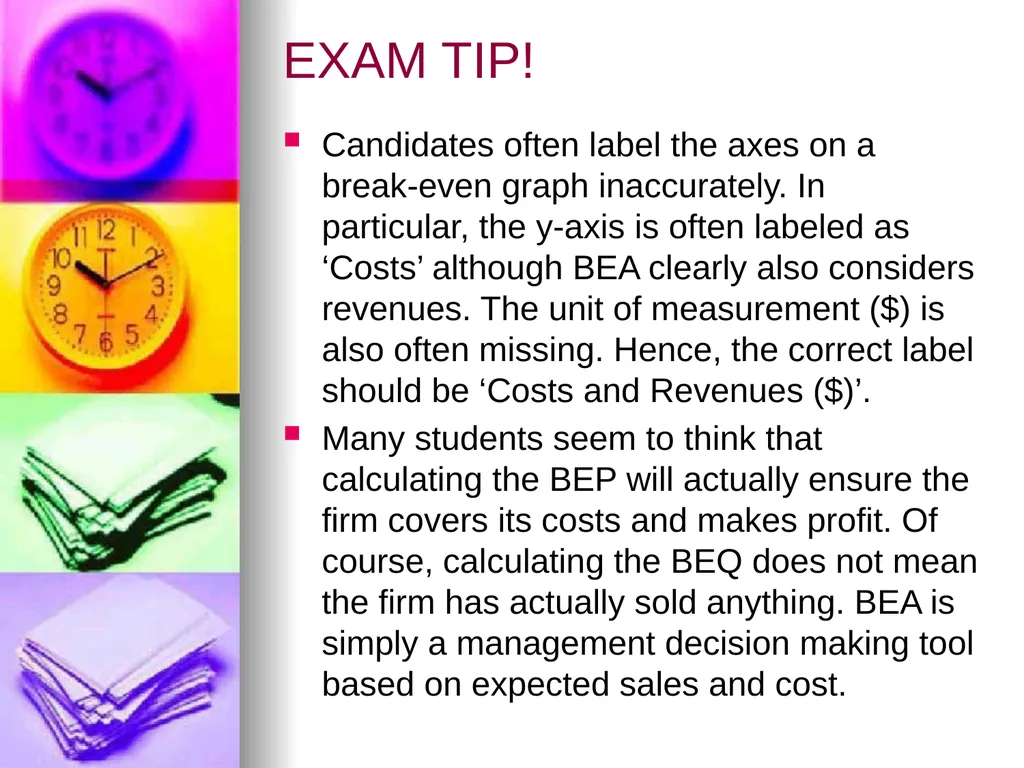
EXAM TIP! Candidates often label the axes on a break-even graph inaccurately. In particular, the y-axis is often labeled as ‘Costs’ although BEA clearly also considers revenues. The unit of measurement ($) is also often missing. Hence, the correct label should be ‘Costs and Revenues ($)’.
Many students seem to think that calculating the BEP will actually ensure the firm covers its costs and makes profit. Of course, calculating the BEQ does not mean the firm has actually sold anything. BEA is simply a management decision making tool based on expected sales and cost.<br>
Many students seem to think that calculating the BEP will actually ensure the firm covers its costs and makes profit. Of course, calculating the BEQ does not mean the firm has actually sold anything. BEA is simply a management decision making tool based on expected sales and cost.<br>
18
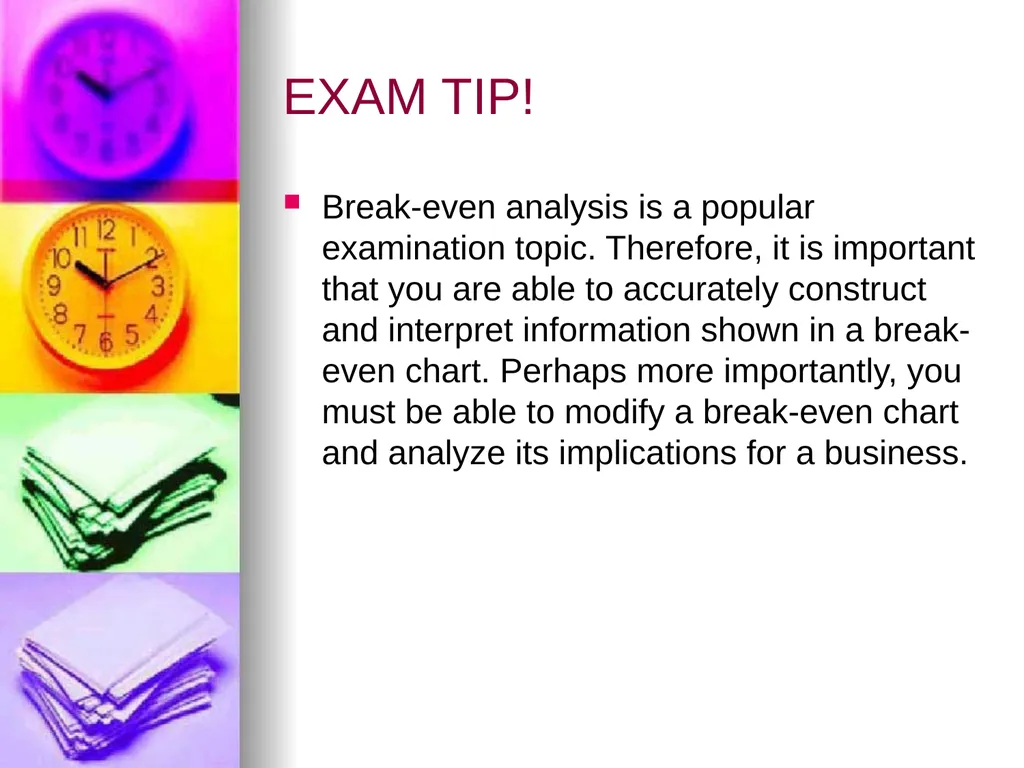
EXAM TIP! Break-even analysis is a popular examination topic. Therefore, it is important that you are able to accurately construct and interpret information shown in a break-even chart. Perhaps more importantly, you must be able to modify a break-even chart and analyze its implications for a business.<br>
19
Exercise
Question 3.3.1 Calculating the break-even quantity<br>
20
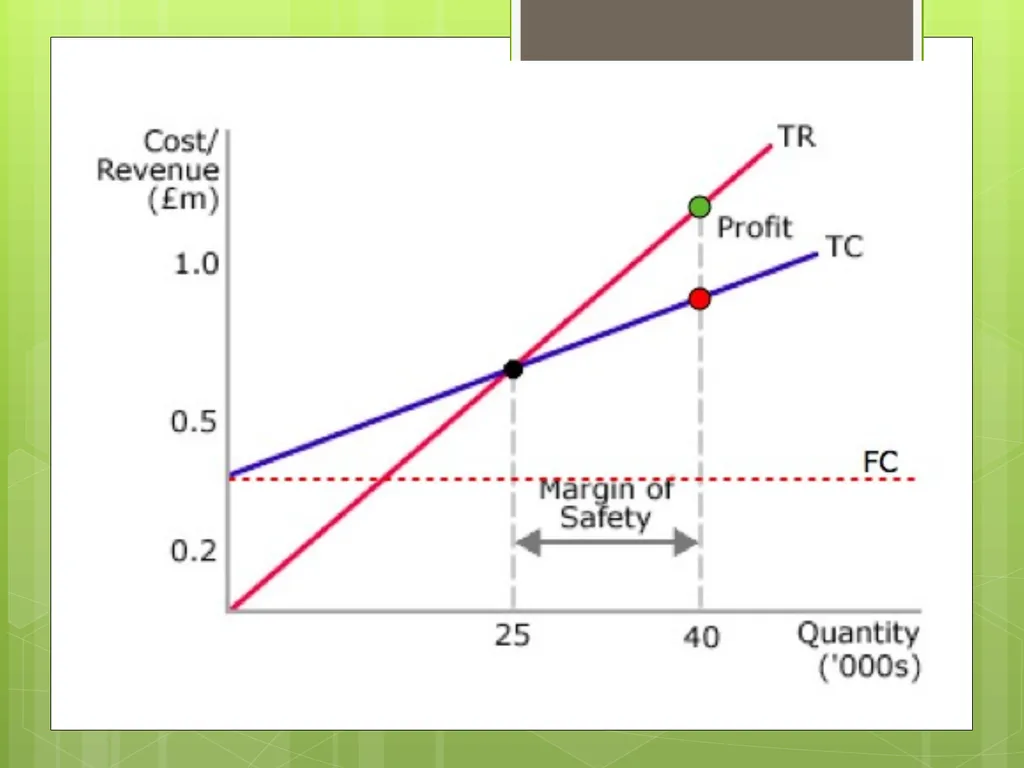
The margin of safety (MOS) MOS measures the difference between a firm’s sales volume and the quantity needed to break-even.
A positive MOS means that the firm makes a profit.
A negative MOS means that the firm makes a loss.
MOS = Level of demand - BEQ<br>
A positive MOS means that the firm makes a profit.
A negative MOS means that the firm makes a loss.
MOS = Level of demand - BEQ<br>
21
EXAM TIP! Far too often, candidates express the margin of safely as a monetary value. This clearly shows a lack of understanding and application of the concept. The MOS is calculated and shown on the x-axis of a break-even chart, i.e. the unit of measurement is the volume of output rather than the value of that output.
Before drawing a BE chart, it is important to first work out the value of the costs and revenues, at the BEQ. This will help you determine the scale needed to plot the figures on the y-axis. By working out the BEQ beforehand, it is also easier to determine the scale needed for the x-axis.<br>
Before drawing a BE chart, it is important to first work out the value of the costs and revenues, at the BEQ. This will help you determine the scale needed to plot the figures on the y-axis. By working out the BEQ beforehand, it is also easier to determine the scale needed for the x-axis.<br>
22
Exercise
Question 3.3.2 Calculating the margin of safety<br>
23
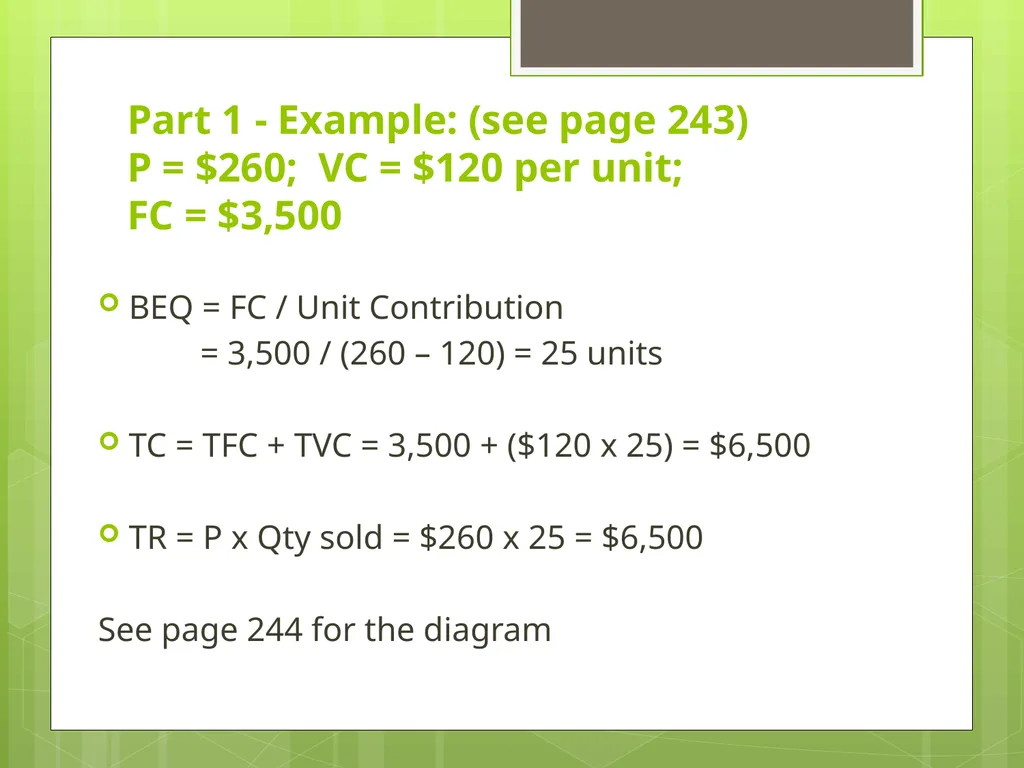
Part 1 - Example: (see page 243)
P = $260; VC = $120 per unit;
FC = $3,500 BEQ = FC / Unit Contribution
= 3,500 / (260 – 120) = 25 units
TC = TFC + TVC = 3,500 + ($120 x 25) = $6,500
TR = P x Qty sold = $260 x 25 = $6,500
See page 244 for the diagram<br>
= 3,500 / (260 – 120) = 25 units
TC = TFC + TVC = 3,500 + ($120 x 25) = $6,500
TR = P x Qty sold = $260 x 25 = $6,500
See page 244 for the diagram<br>
24
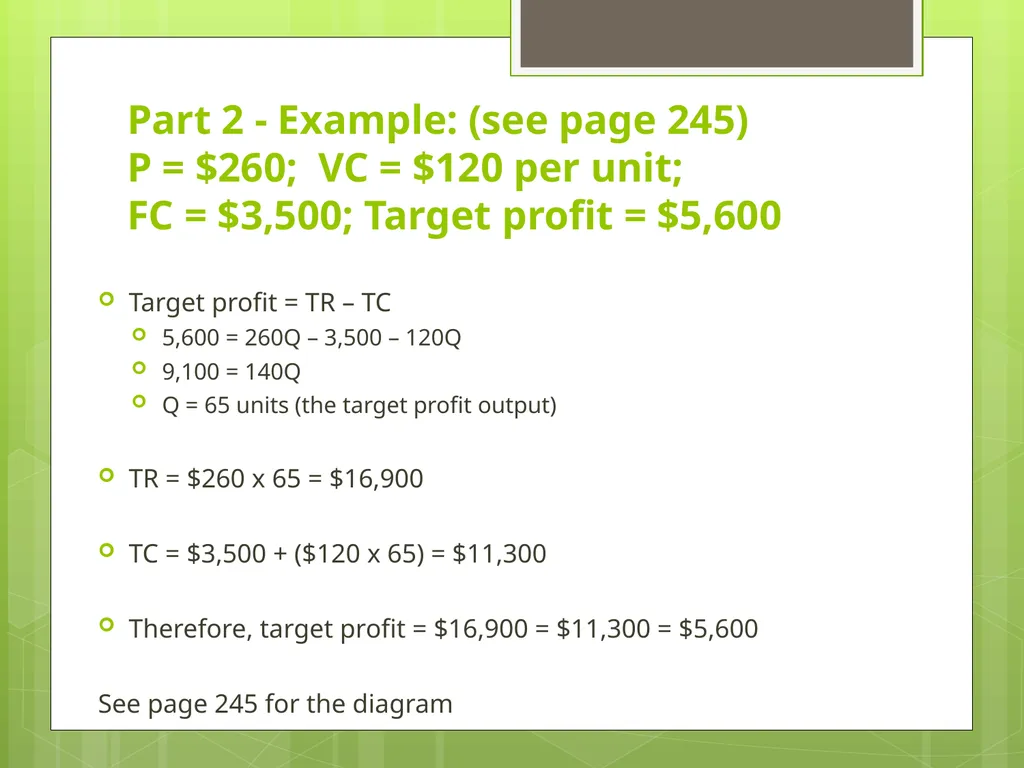
Part 2 - Example: (see page 245)
P = $260; VC = $120 per unit;
FC = $3,500; Target profit = $5,600 Target profit = TR – TC
5,600 = 260Q – 3,500 – 120Q
9,100 = 140Q
Q = 65 units (the target profit output)
TR = $260 x 65 = $16,900
TC = $3,500 + ($120 x 65) = $11,300
Therefore, target profit = $16,900 = $11,300 = $5,600
See page 245 for the diagram<br>
5,600 = 260Q – 3,500 – 120Q
9,100 = 140Q
Q = 65 units (the target profit output)
TR = $260 x 65 = $16,900
TC = $3,500 + ($120 x 65) = $11,300
Therefore, target profit = $16,900 = $11,300 = $5,600
See page 245 for the diagram<br>
25
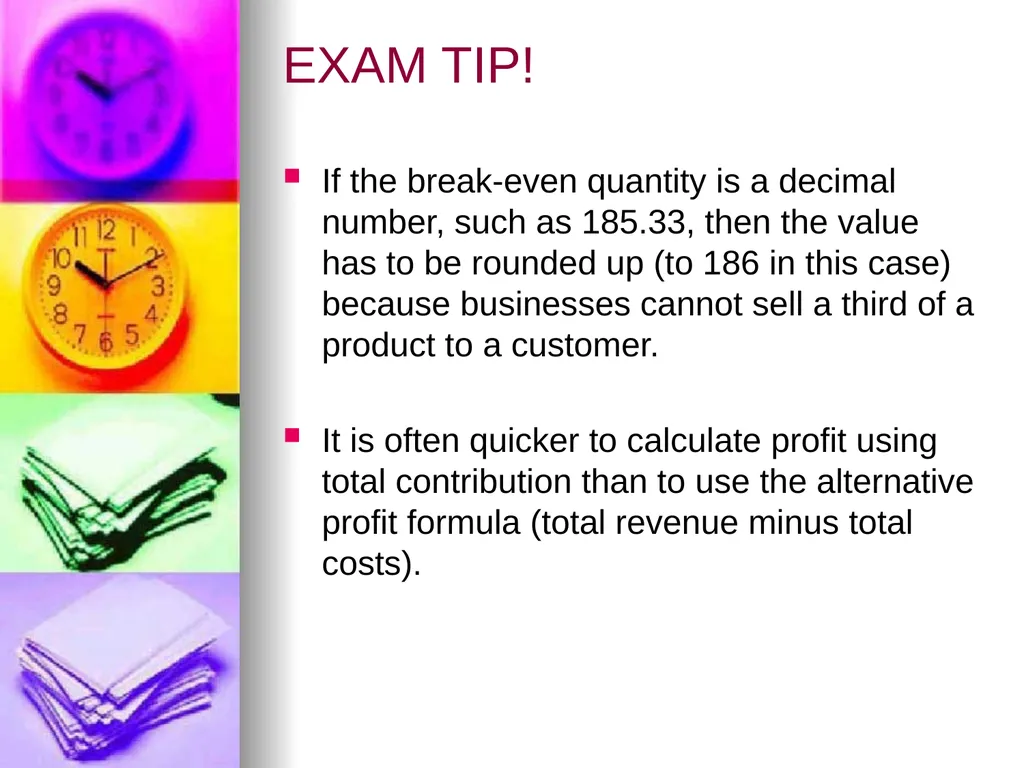
EXAM TIP! If the break-even quantity is a decimal number, such as 185.33, then the value has to be rounded up (to 186 in this case) because businesses cannot sell a third of a product to a customer.
It is often quicker to calculate profit using total contribution than to use the alternative profit formula (total revenue minus total costs).<br>
It is often quicker to calculate profit using total contribution than to use the alternative profit formula (total revenue minus total costs).<br>
26
Exercise
Question 3.3.3 TMR Day-Care Center<br>
27
Exercise
Question 3.3.4 RT’s Hotdogs<br>
28
Exercise
Question 3.3.5 Mendoza Taxi Services<br>
29
Exercise
Question 3.3.6 Rodriguez Art Studio Ltd.<br>
30
Factors that can affect the profit (or loss) of a business: The difference between ST and LT profits. It might be necessary to reduce prices (increase BEQ) in order to attract customers. In the LT, prices can be increased once a loyal customer has been established.
The level of demand is subject to change. Factors that affect demand such as changes in income or fashion will alter BEQ and hence the value of profits.<br>
The level of demand is subject to change. Factors that affect demand such as changes in income or fashion will alter BEQ and hence the value of profits.<br>
31
Factors that can affect the profit (or loss) of a business: Profit depends on the level of risk involved. Low risk projects, lower BEQ. High risk projects, higher BEQ.
Innovation and introduction of new technologies.
External factors such as changes in exchange rates, unemployment, national income and interest rates can have a direct impact (positive or negative) on the profitability of businesses.<br>
Innovation and introduction of new technologies.
External factors such as changes in exchange rates, unemployment, national income and interest rates can have a direct impact (positive or negative) on the profitability of businesses.<br>
32
Benefits of break even analysis It provides a quick graphical focus on the cost and revenue structures of different scenarios or projects.
Can be used to make realistic predictions rather than relying on simple guesswork.<br>
Can be used to make realistic predictions rather than relying on simple guesswork.<br>
33
Assumptions of BEA All cost functions are linear
The sales revenue function is linear
Business will sell all of its output<br>
The sales revenue function is linear
Business will sell all of its output<br>
34
Limitations of BEA Static model
The principle of garbage in, garbage out (GIGO) applies
Other quantitative and qualitative factors that can alter the costs, revenues and output of the business are ignored
Only suitable for single-product firms that sell all of their output<br>
The principle of garbage in, garbage out (GIGO) applies
Other quantitative and qualitative factors that can alter the costs, revenues and output of the business are ignored
Only suitable for single-product firms that sell all of their output<br>
35
EXAM TIP! Students often state a benefit of calculating the BEP ensures that the business will cover its costs and hence make a profit. This is not the case, as BEA is a management tool to help decision-making; it does not guarantee a profit will be made and it is possible for the safety margin to be negative.<br>
36
Exercise
Question 3.3.7 Airbus A380<br>
37
KEY TERMS REVIEW<br>
38
BREAK-EVEN ANALYSIS Is a management tool used to calculate the level of sales needed to cover all costs of production. Thereafter, further sales generate a positive safety margin, and hence profit for the business.<br>
39
BREAK-EVEN CHART Is the name given to the graph that shows a firm’s costs, revenues and profits (or loss) at various levels of output.<br>
40
BREAK-EVEN POINT Refers to the position on a break-even chart where the total cost line intersects to the total revenue line, ie. where TC = TR.<br>
41
BREAK-EVEN QUANTITY Refers to the level of output that generates neither profit nor loss. It is shown on the x-axis on a break-even chart.<br>
42
CONTRIBUTION PER UNIT (OR UNIT CONTRIBUTION) Is the difference between the selling price of a product and its variable costs of production, i.e. P-AVC. The surplus goes towards paying fixed costs.<br>
43
MARGIN OF SAFETY Is the difference between a firm’s level of demand and its break-even quantity.
A positive MOS means the firm can decrease output (sales volume) by that amount without making a loss.
A negative MOS means the firm is making a loss.<br>
A positive MOS means the firm can decrease output (sales volume) by that amount without making a loss.
A negative MOS means the firm is making a loss.<br>
44
PROFIT Is the positive difference between a firm’s revenue and its costs.
On a break-even chart, profit is shown at all levels of output beyond the BEQ.<br>
On a break-even chart, profit is shown at all levels of output beyond the BEQ.<br>
45
SPECIAL ORDER DECISION Occurs when a customer places an order at a price that differs from the normal price charged by the business.<br>
46
TOTAL CONTRIBUTION Is the unit contribution (P-AVC) multiplied by the quantity of sales (Q). It is essentially, a firm’s gross profit.<br>